
Effects of Konjac Glucomannan on Retrogradation of Amylose
Abstract
:1. Introduction
2. Materials and Methods
2.1. Materials
2.2. Sample Preparation
2.3. Color Measurement
2.4. Dynamic Rheological Measurement
2.5. Water-Holding Capacity (WHC)
2.6. Texture Measurement
2.7. Low-Field Nuclear Magnetic Resonance (LF-NMR)
2.8. X-ray Diffractometry (XRD)
2.9. Statistical Analysis
3. Results
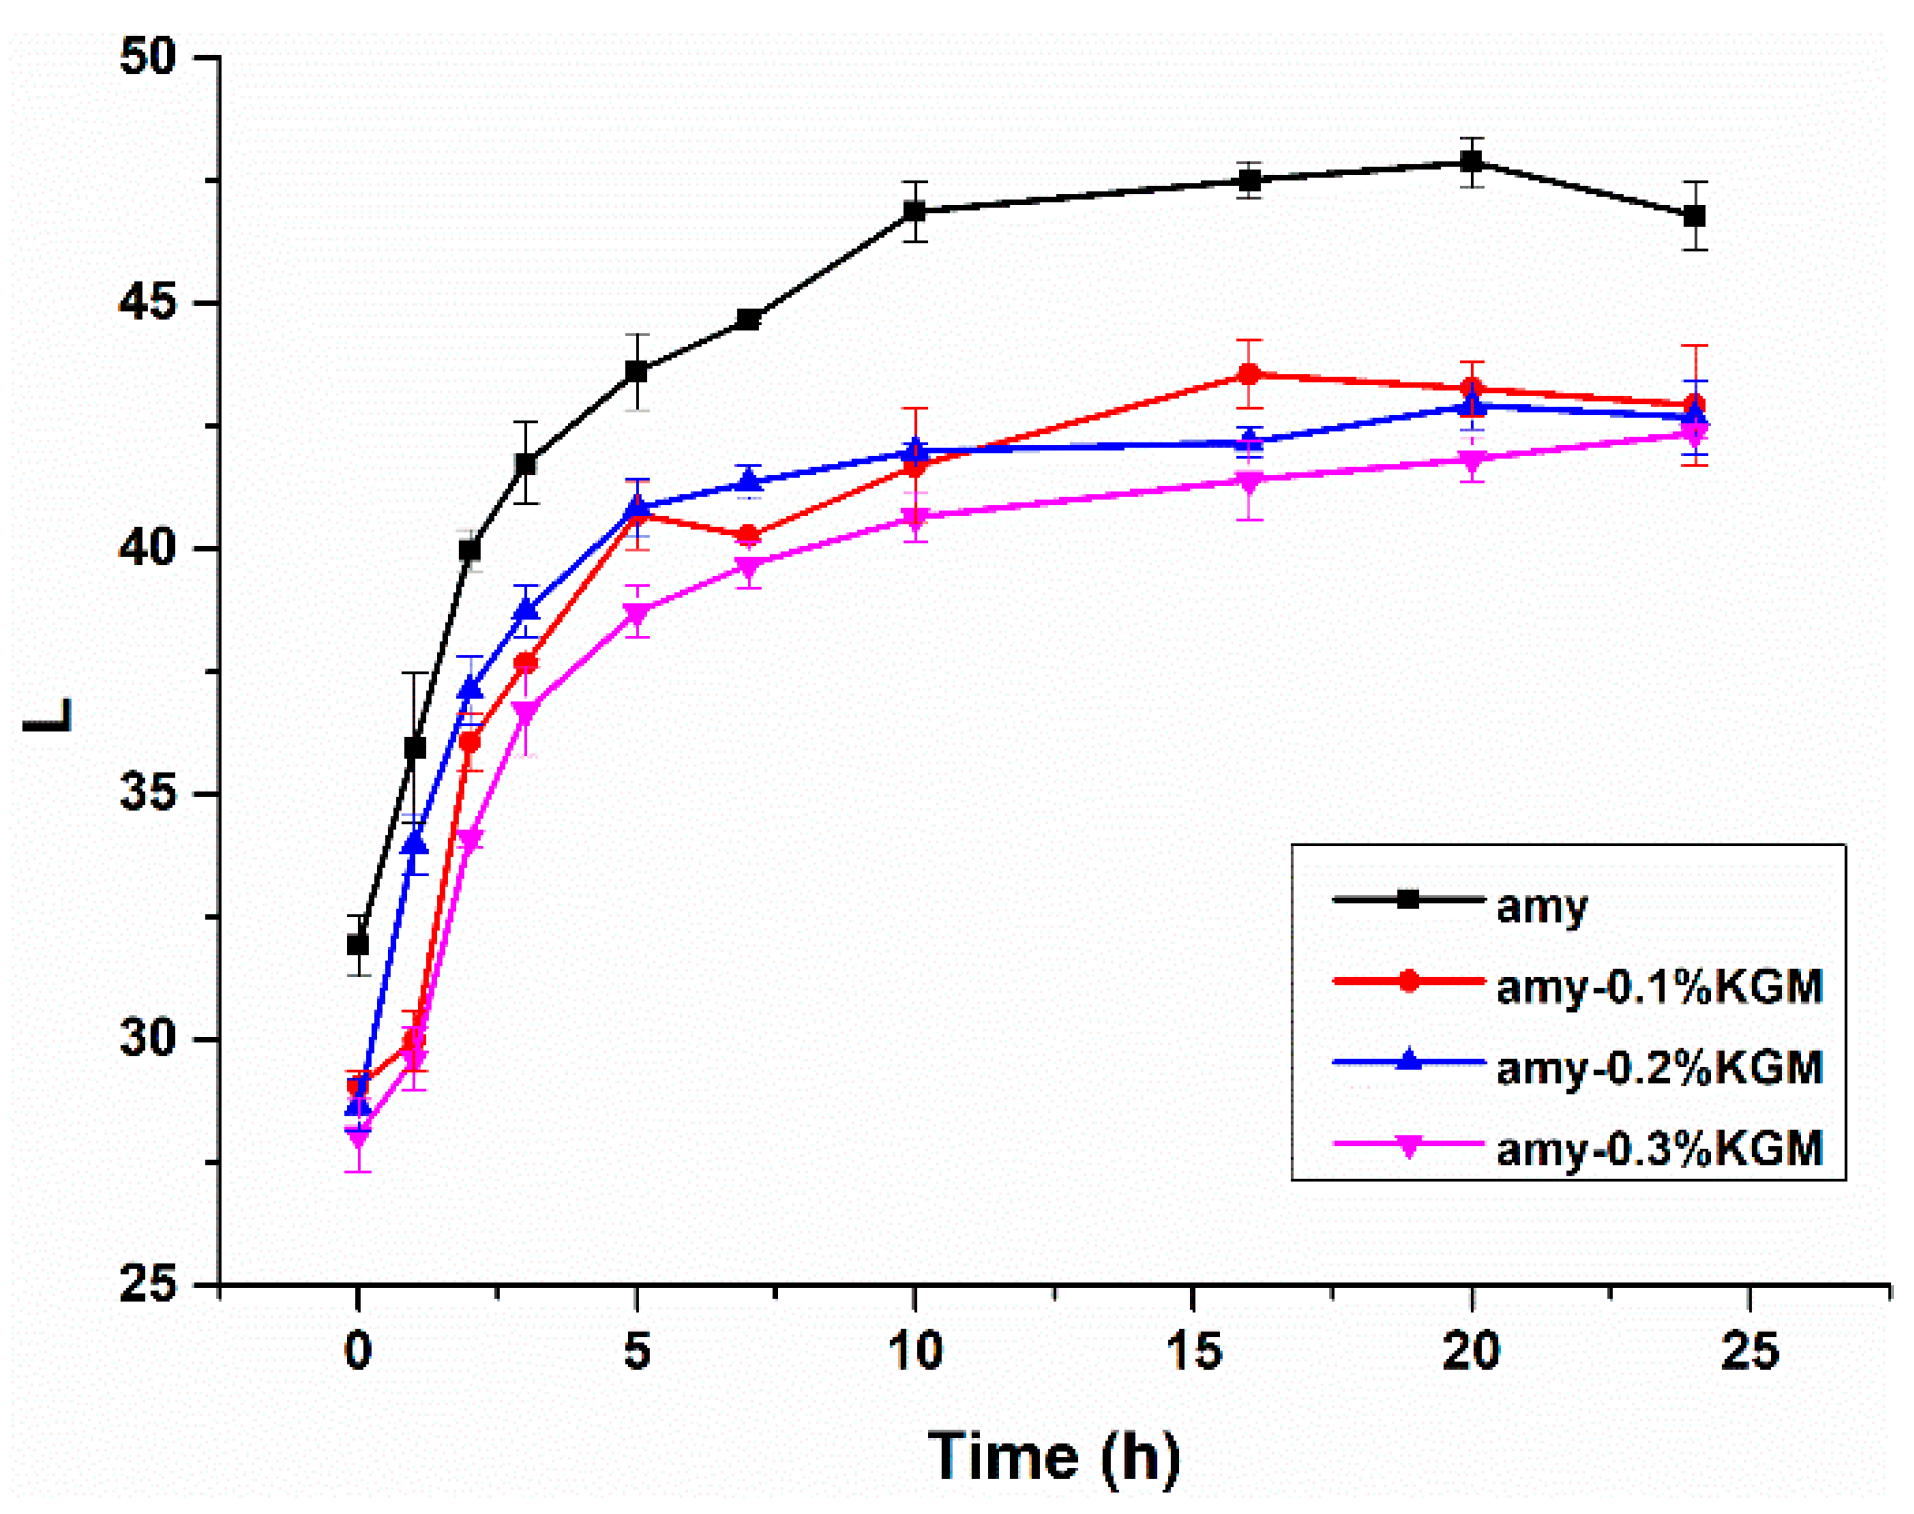
3.1. L Values
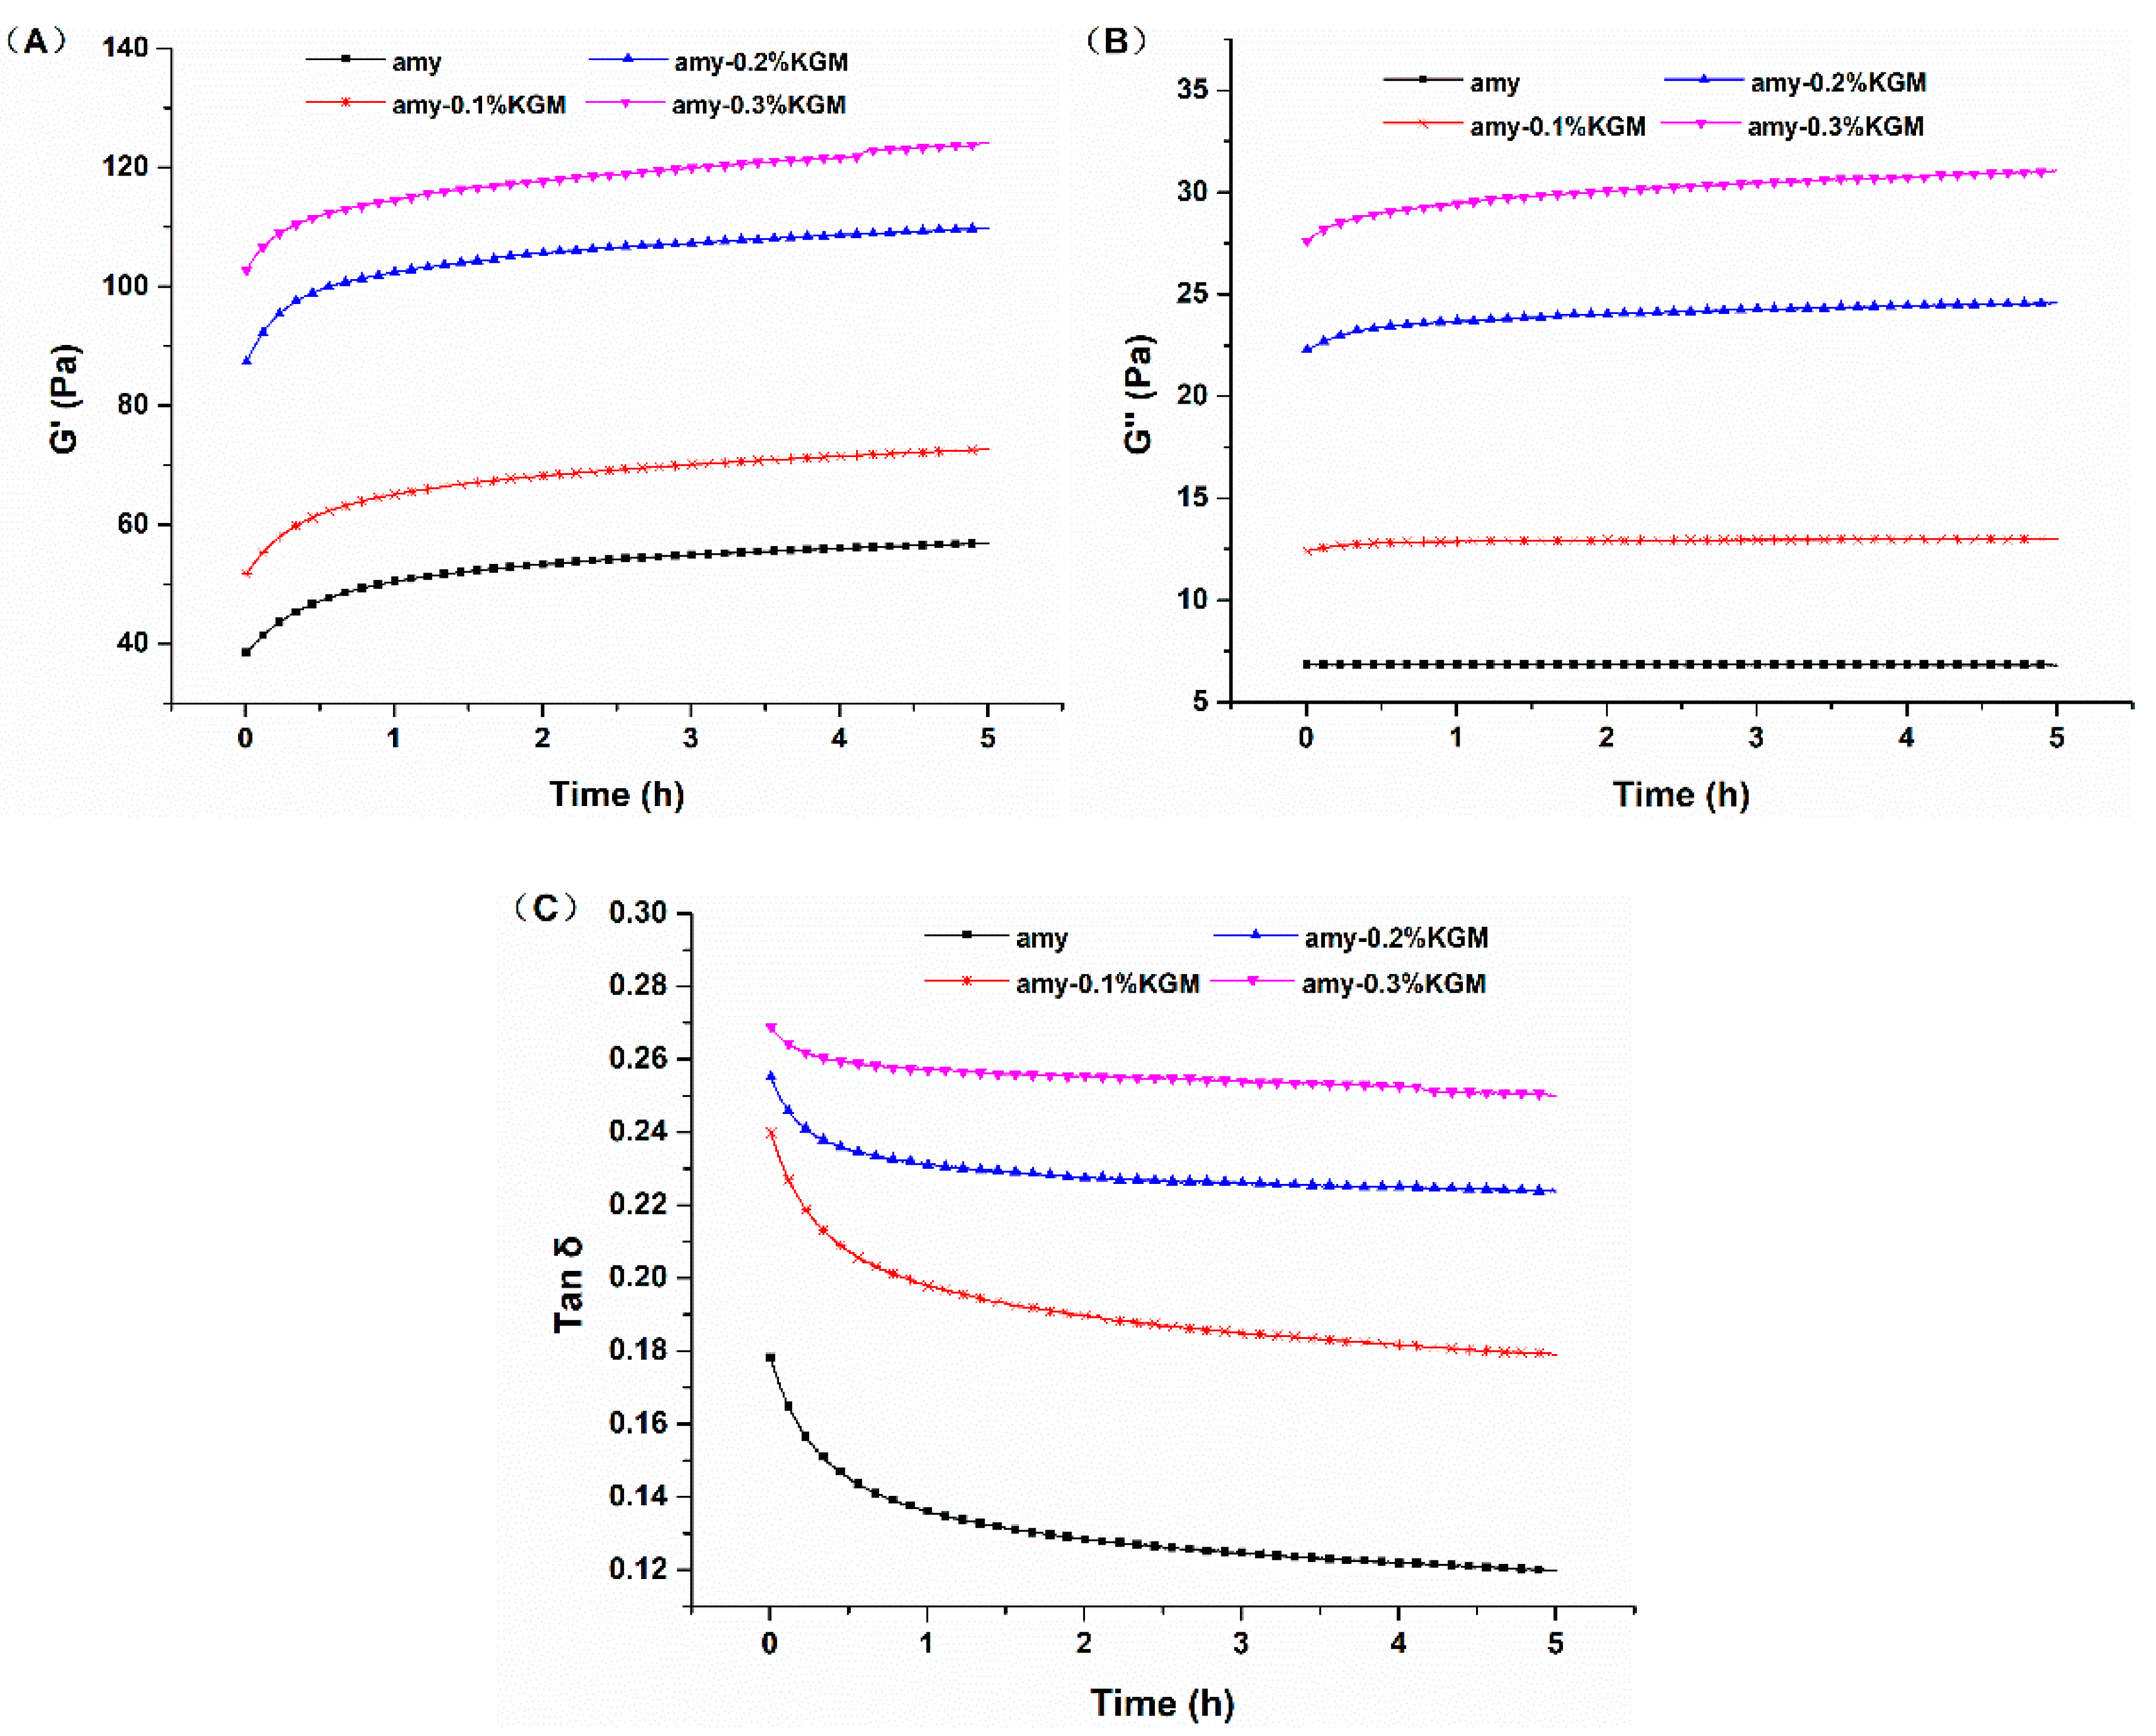
3.2. Viscoelasticity
3.2.1. Time Sweeping
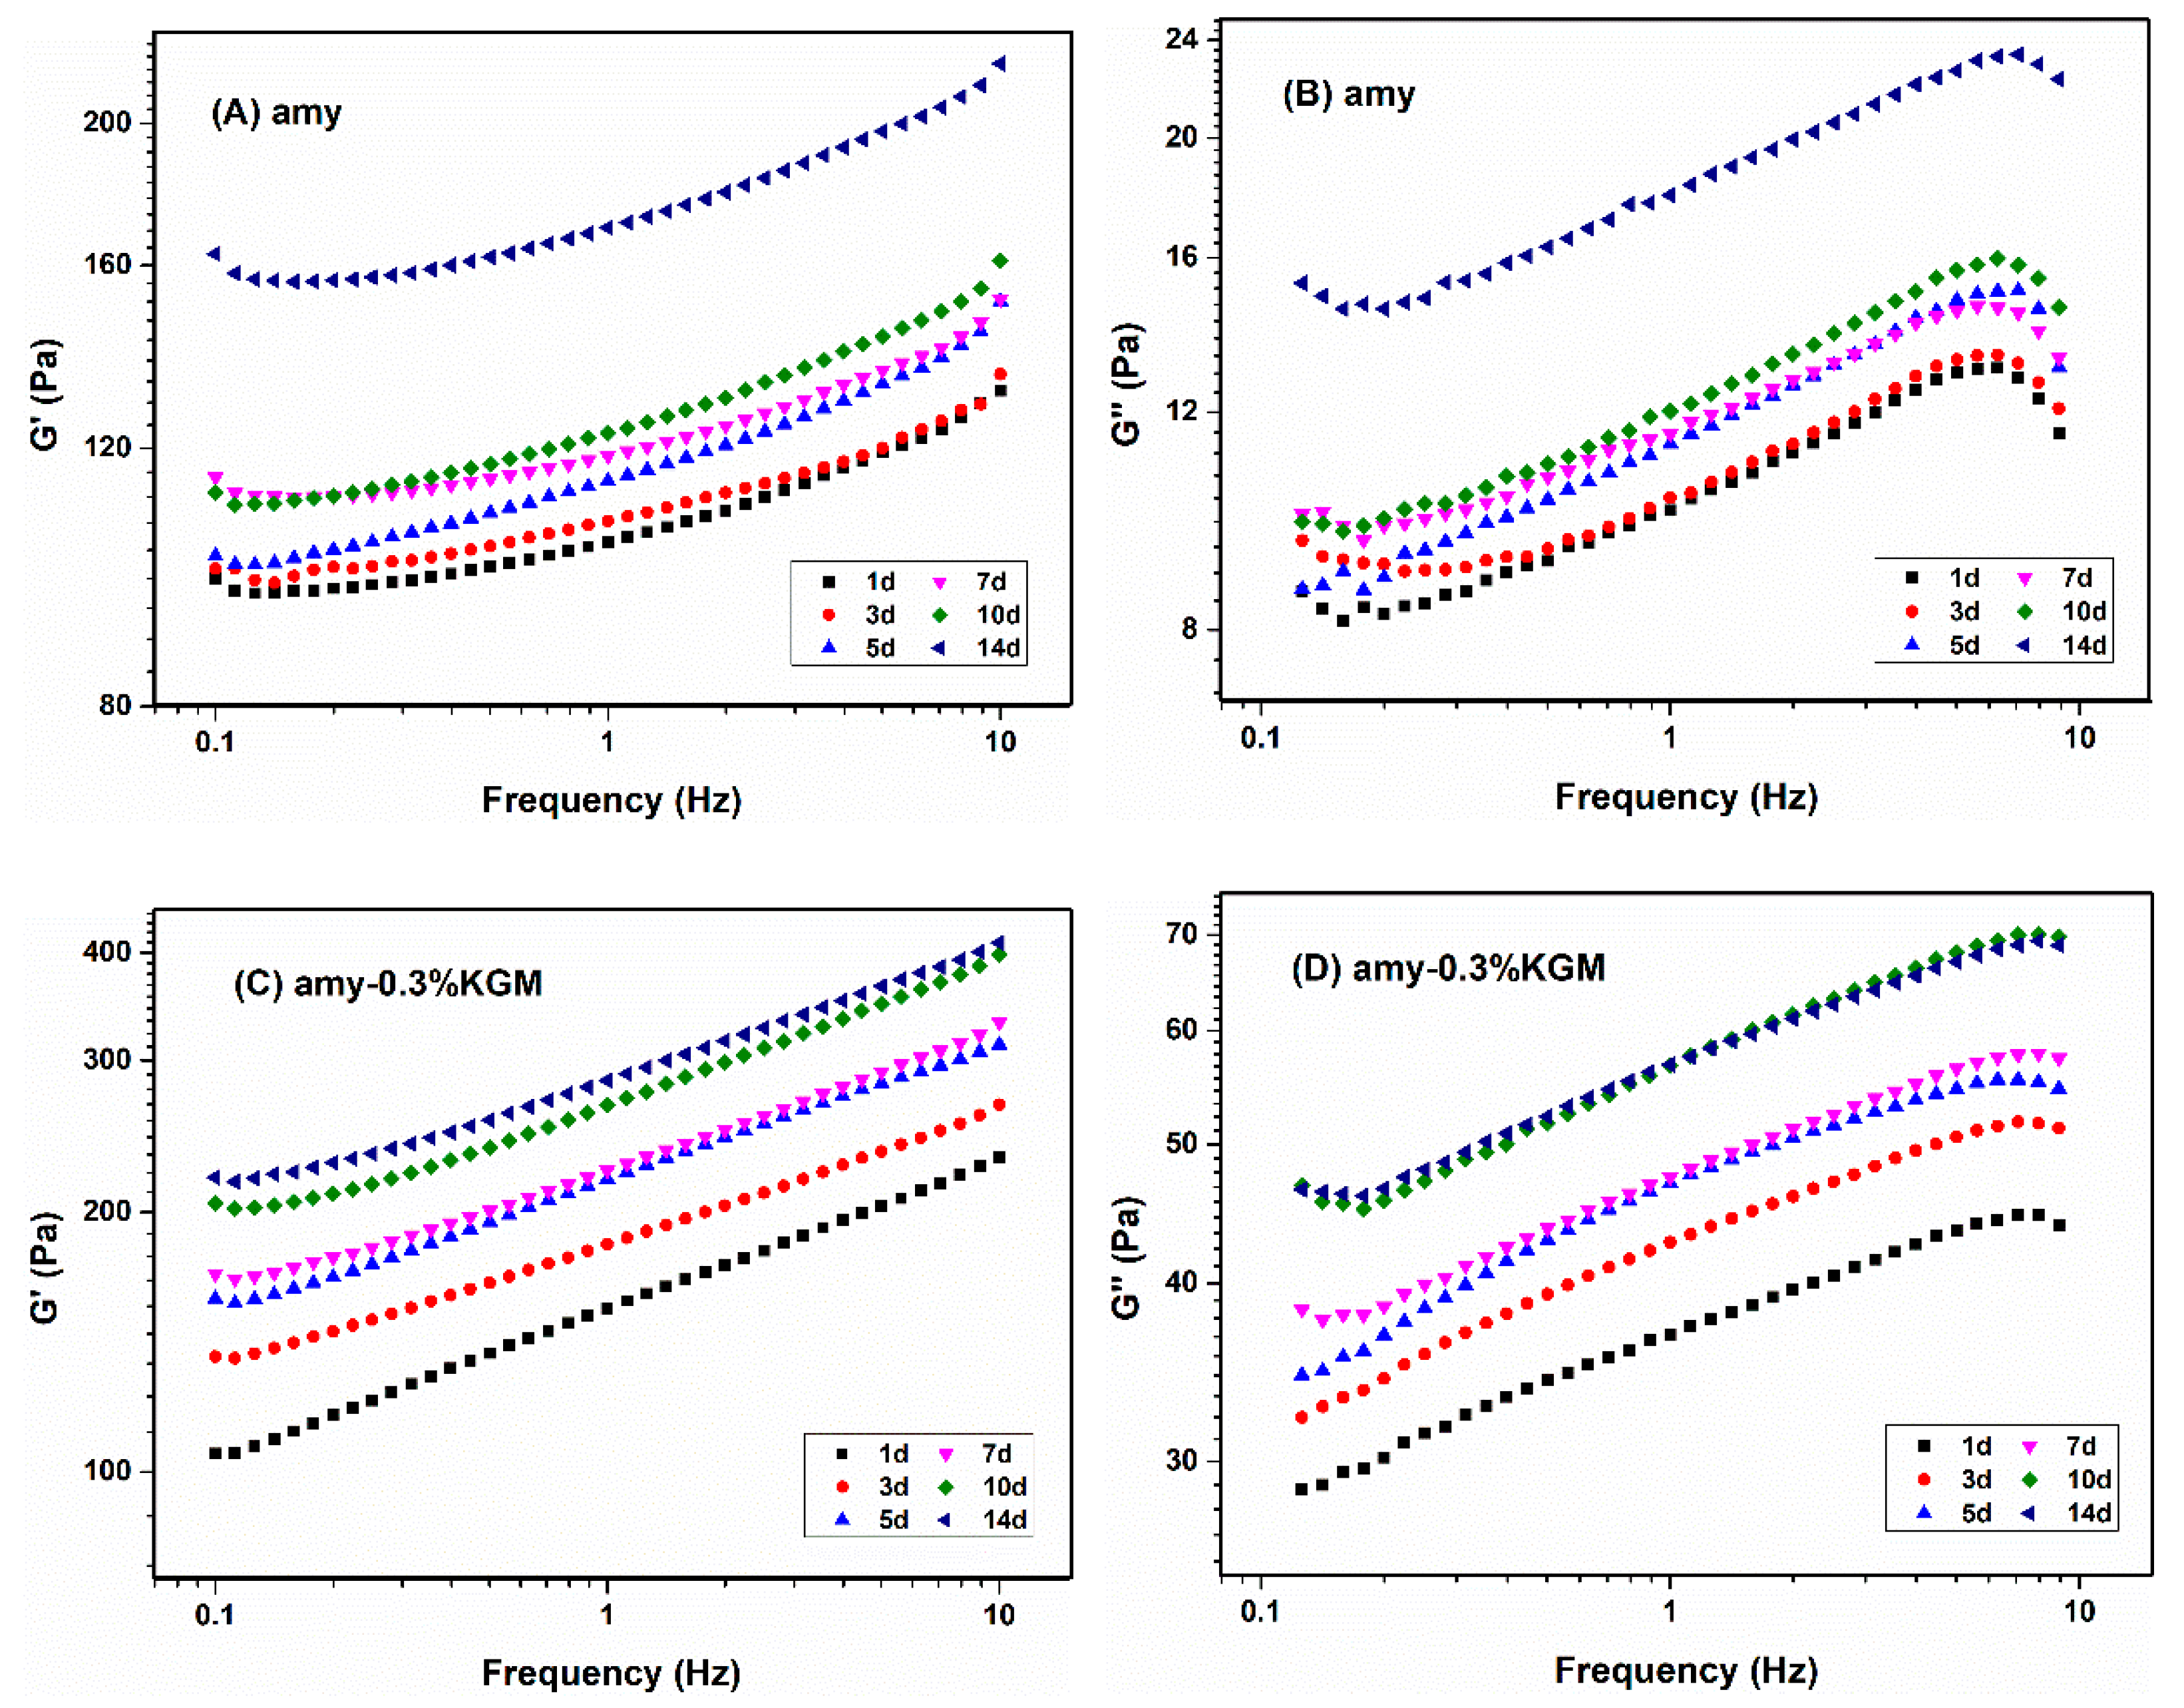
3.2.2. Frequency Sweeping
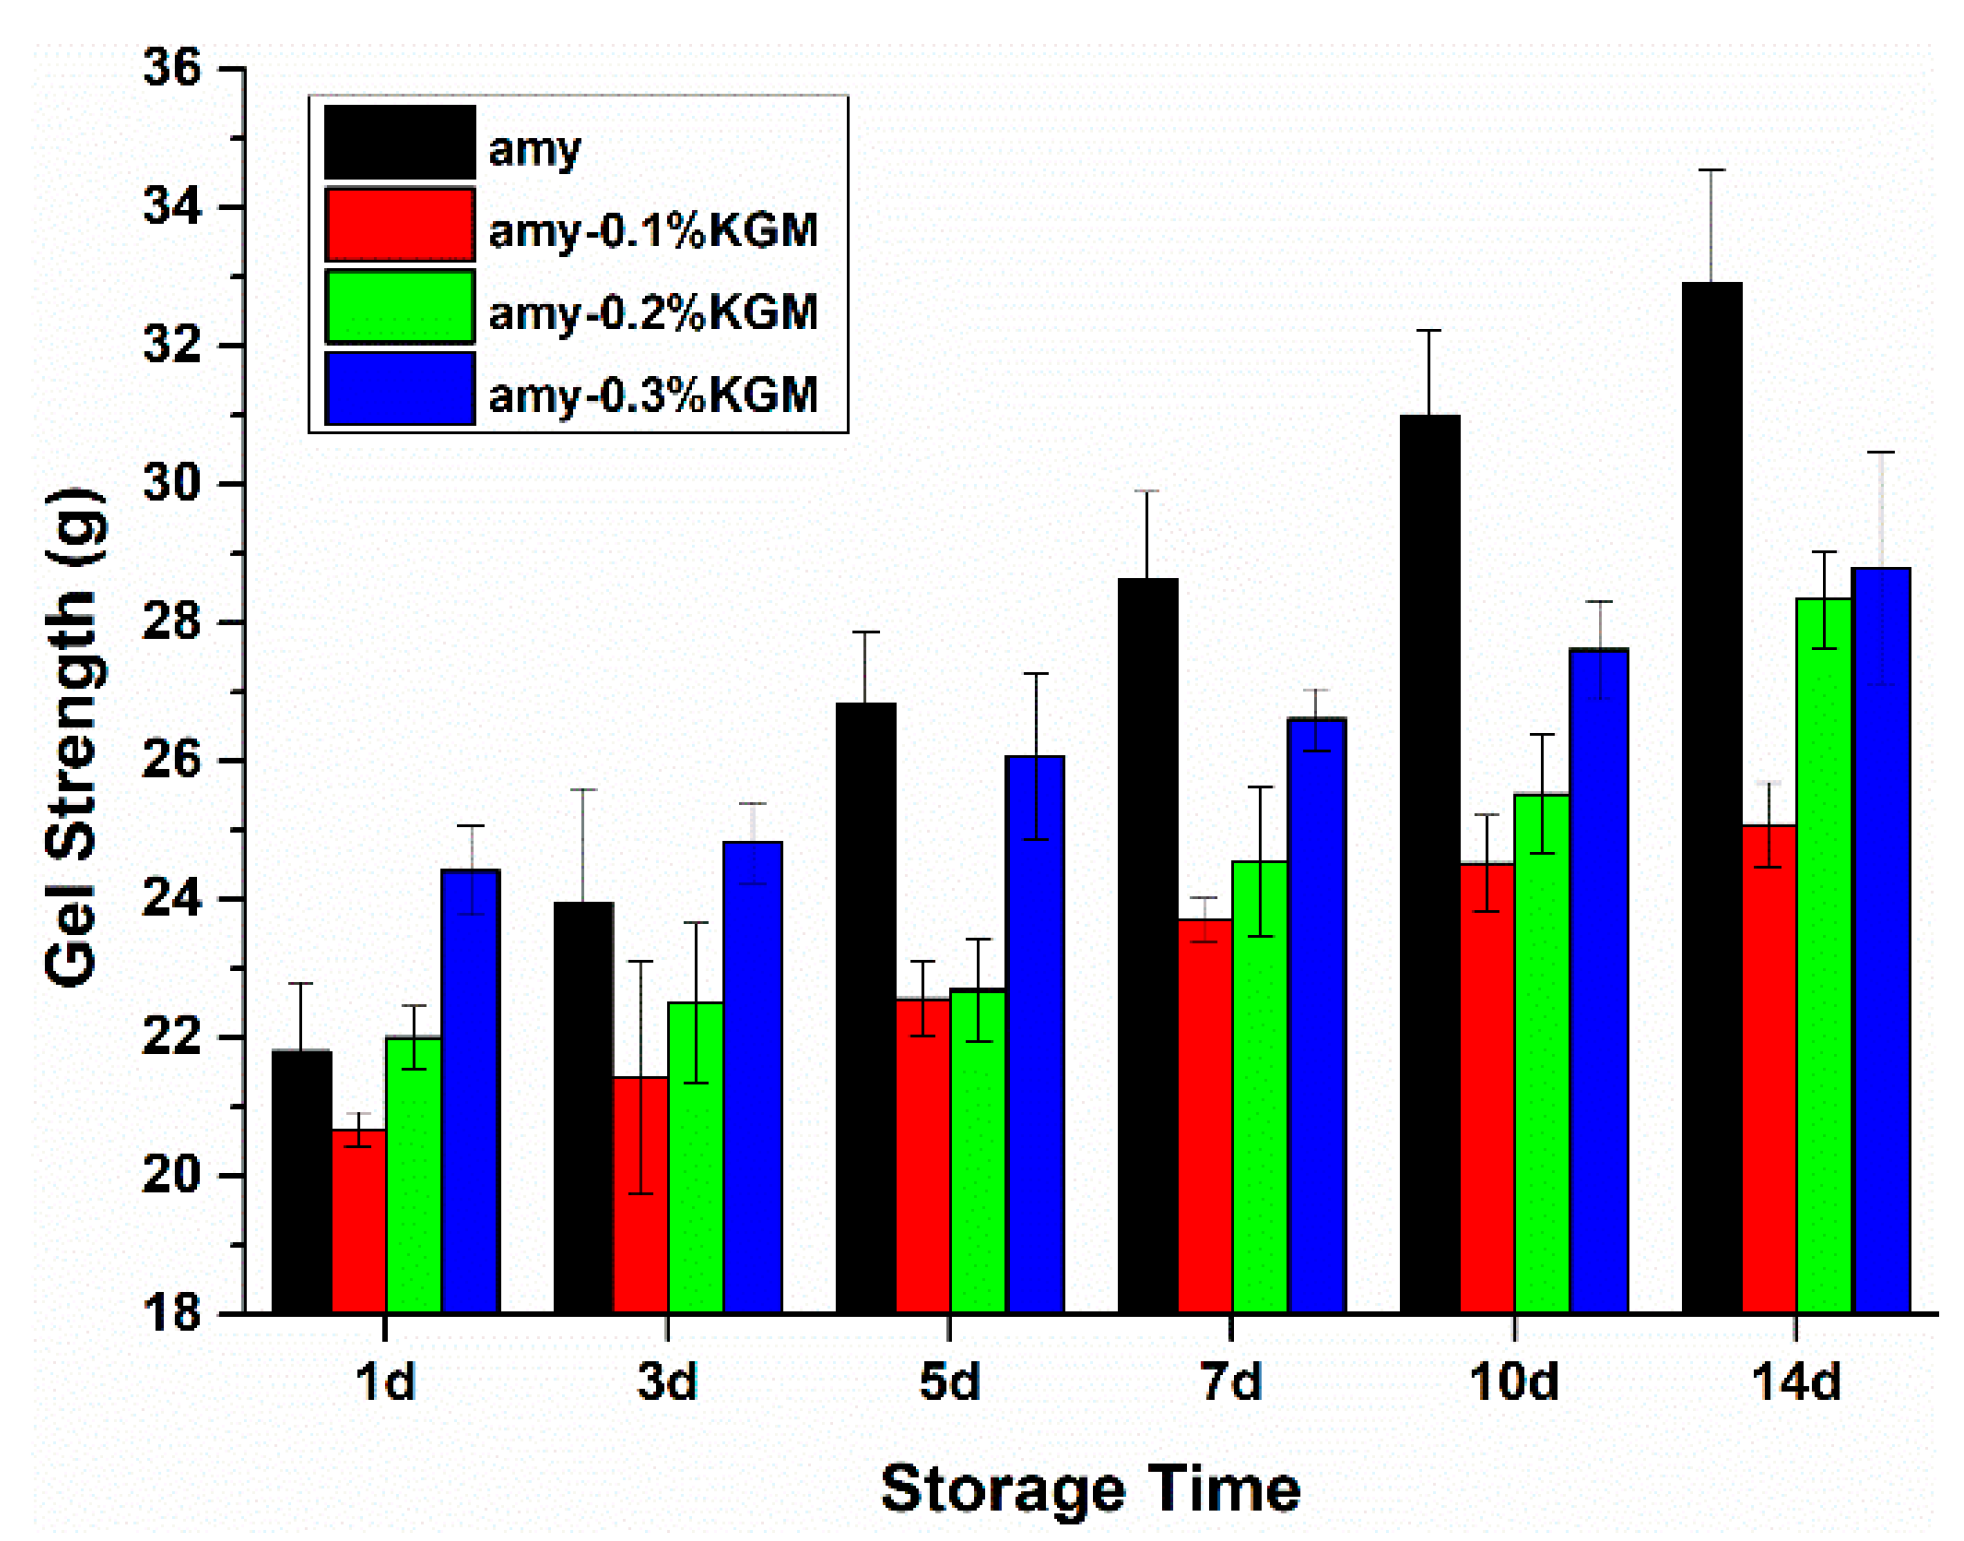
3.3. Gel Strength
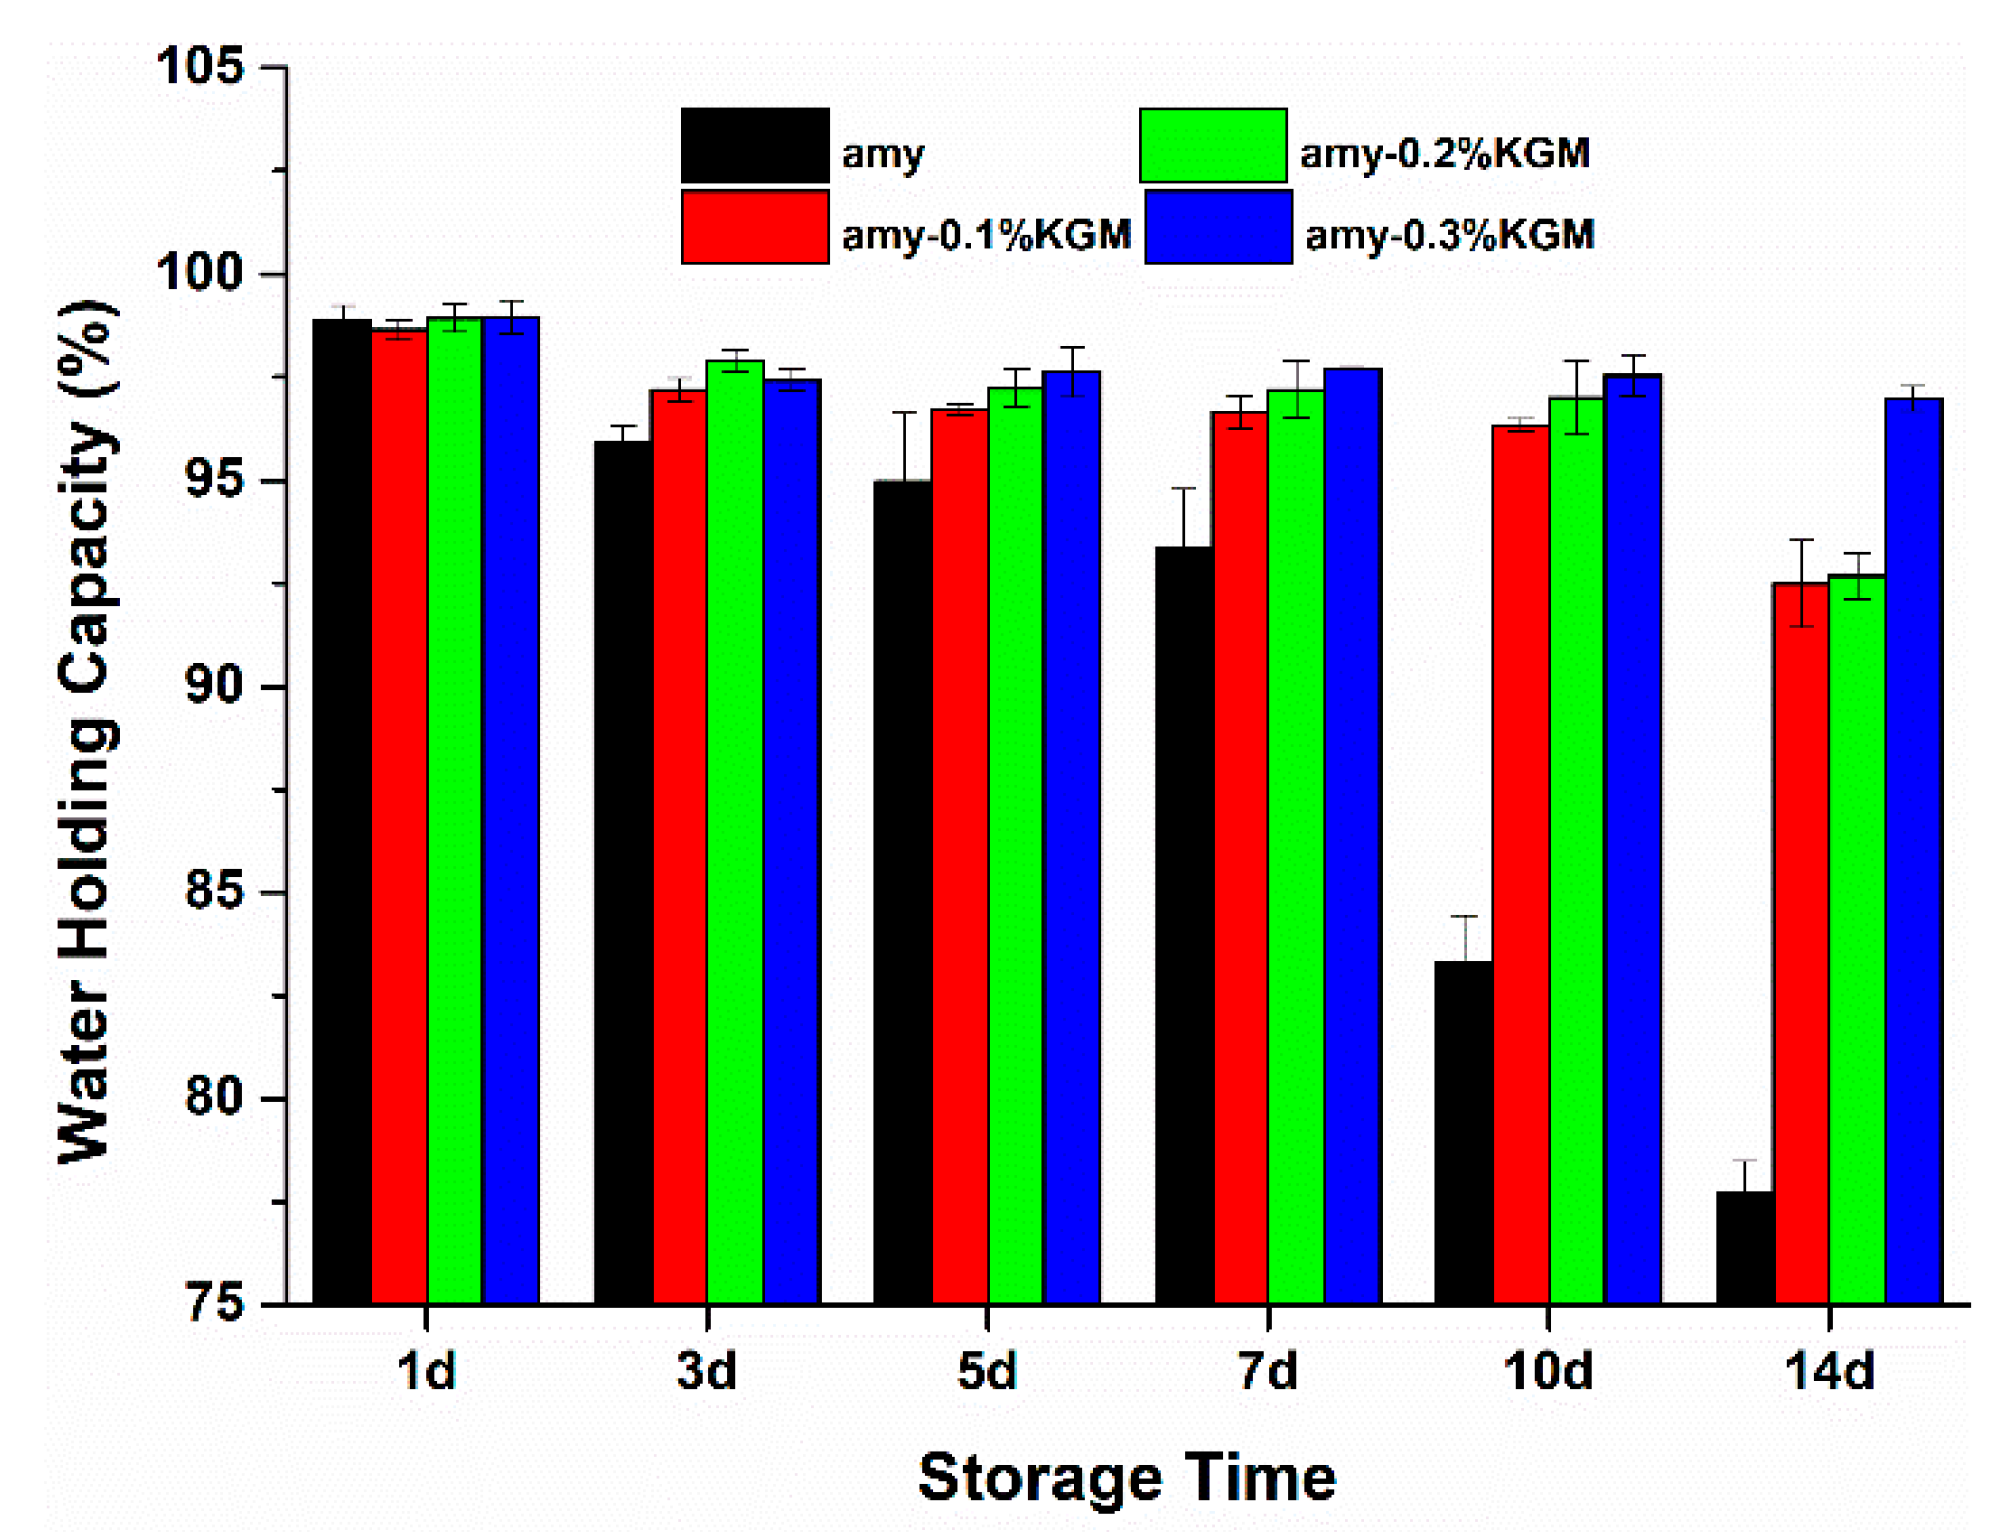
3.4. WHC
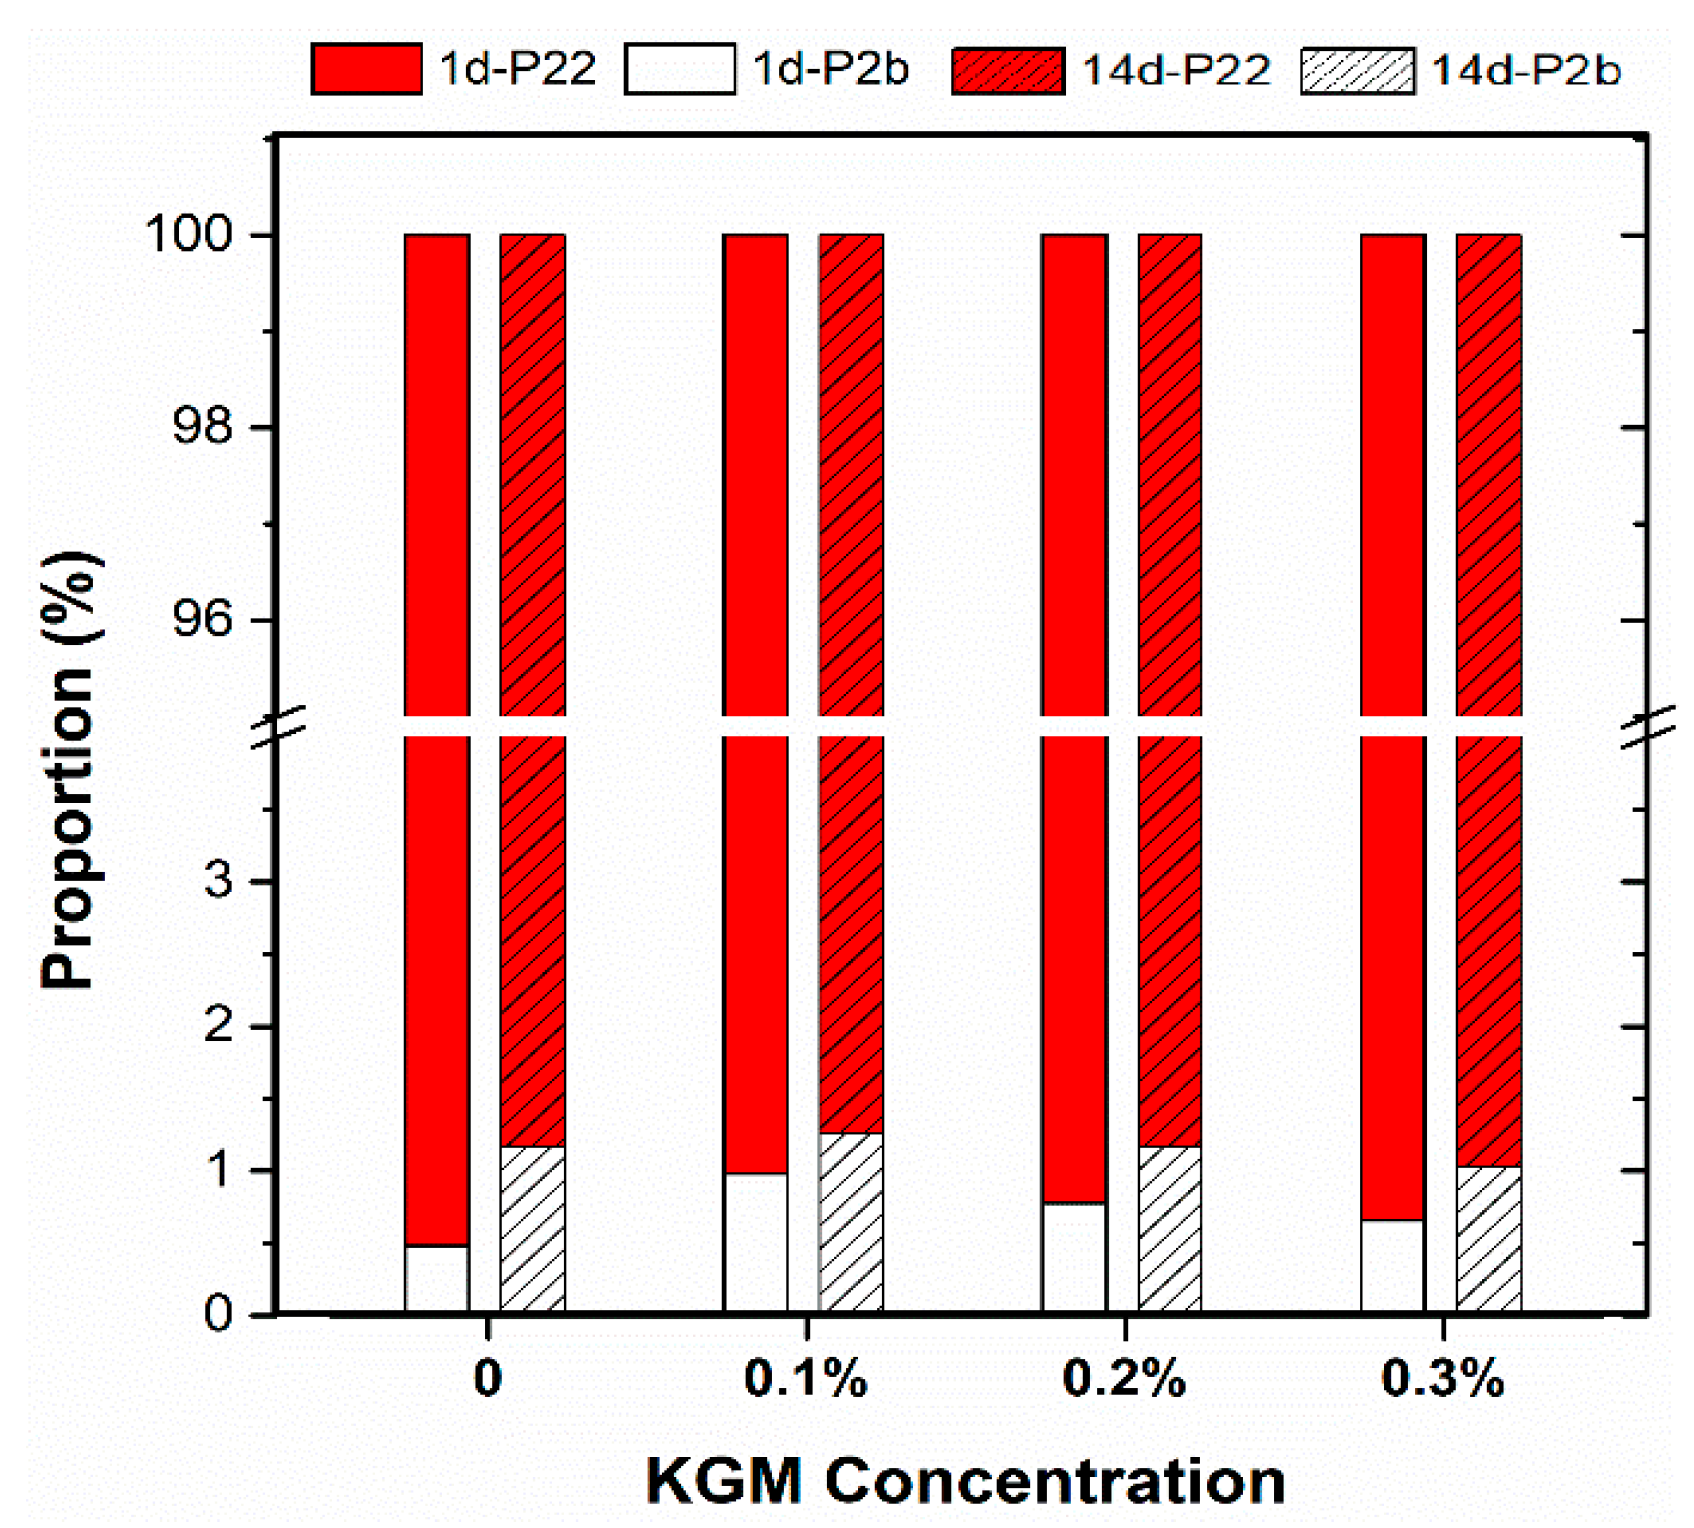
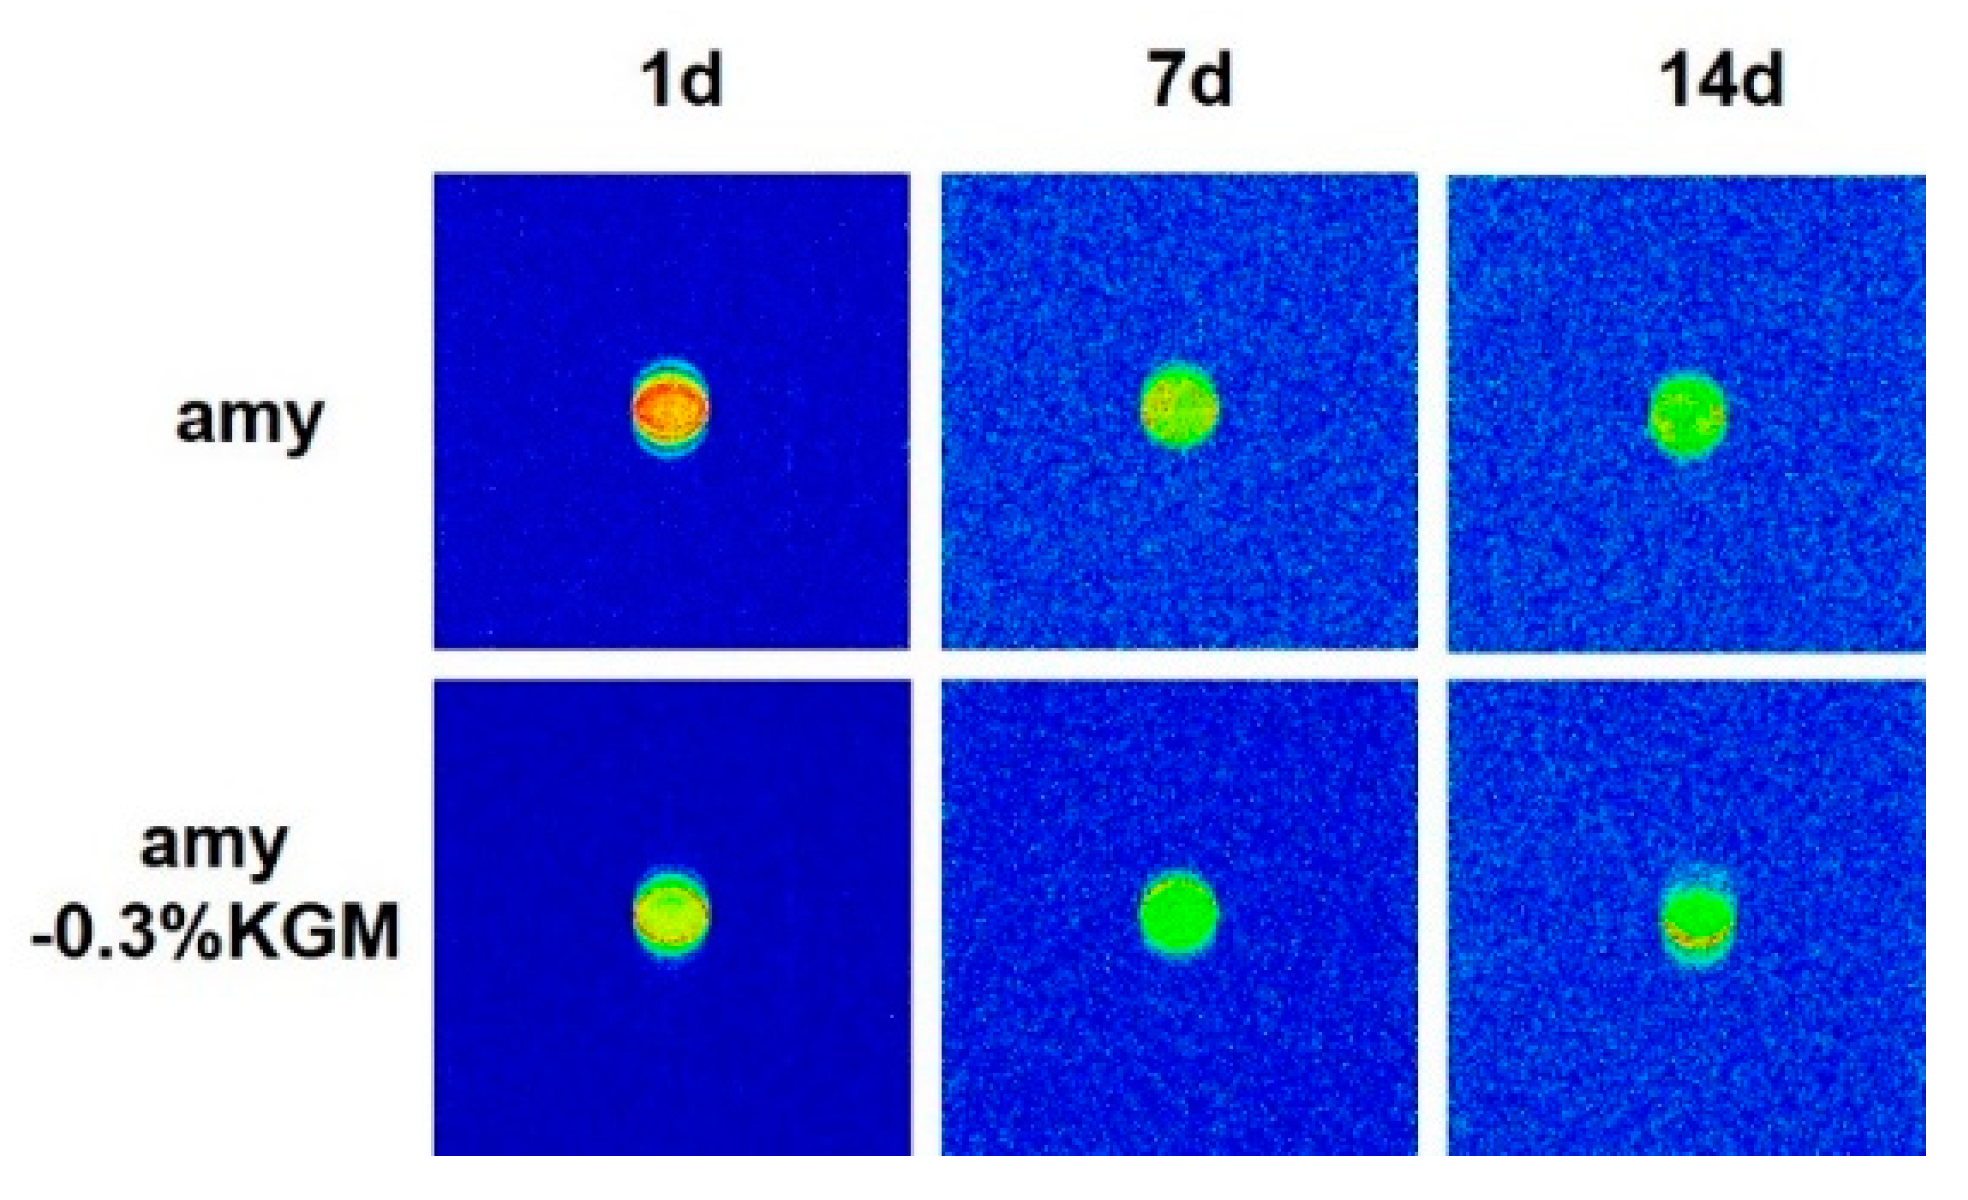
3.5. Water Distribution
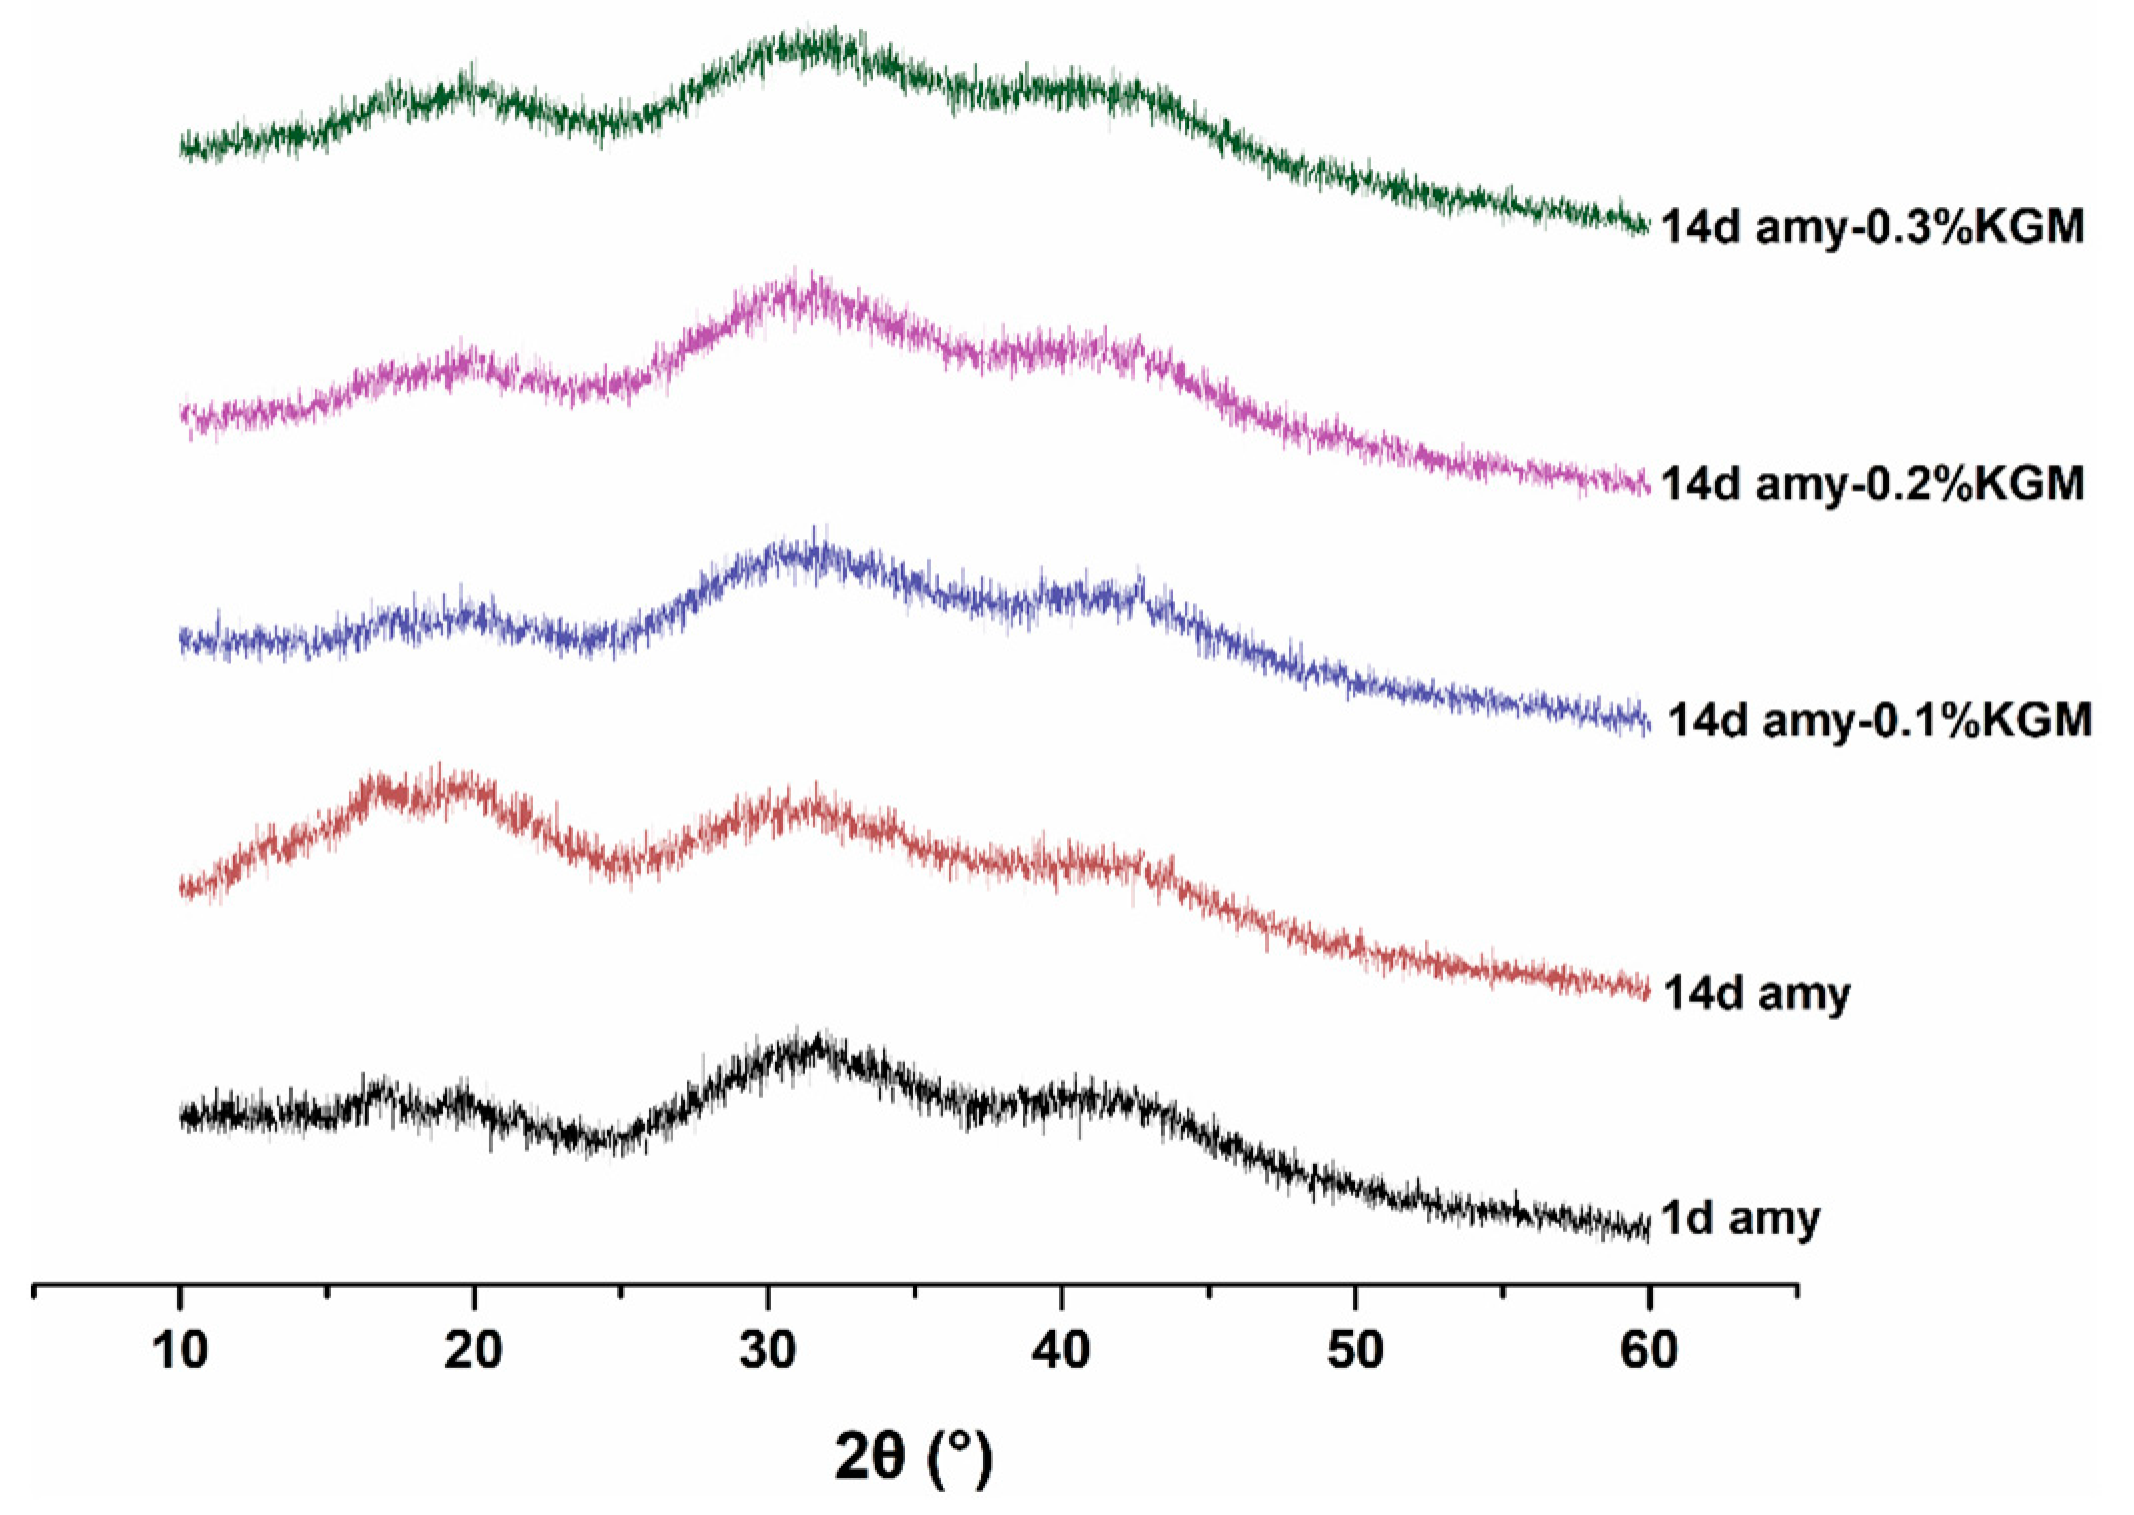
3.6. Crystallinity
4. Conclusions
Author Contributions
Funding
Data Availability Statement
Acknowledgments
Conflicts of Interest
References
- Matignon, A.; Tecante, A. Starch retrogradation: From starch components to cereal products. Food Hydrocoll. 2017, 68, 43–52. [Google Scholar] [CrossRef]
- Xia, L.; Chen, C.; Jy, A.; Lc, C.; Swa, B. Mechanistic studies of starch retrogradation and its effects on starch gel properties. Food Hydrocoll. 2021, 120, 106914. [Google Scholar]
- Zhu, B.; Zhan, J.; Chen, L.; Tian, Y. Amylose crystal seeds: Preparation and their effect on starch retrogradation. Food Hydrocoll. 2020, 105, 105805. [Google Scholar] [CrossRef]
- Li, C.; Hu, Y.; Li, E. Effects of amylose and amylopectin chain-length distribution on the kinetics of long-term rice starch retrogradation. Food Hydrocoll. 2021, 111, 106239. [Google Scholar] [CrossRef]
- Chen, L.; McClements, D.J.; Tian, Y.Q.; Zhang, Z.P.; Zhang, H.H.; Jin, Z.Y. Pasting and Rheological Properties of Non-Crystalline Granular Starch. Starch-Starke 2019, 71, 1800338. [Google Scholar] [CrossRef]
- Mahmood, K.; Kamilah, H.; Shang, P.L.; Sulaiman, S.; Ariffin, F.; Alias, A.K. A review: Interaction of starch/non-starch hydrocolloid blending and the recent food applications. Food Biosci. 2017, 19, 110–120. [Google Scholar] [CrossRef]
- Liu, Y.; Chen, Q.; Fang, F.; Liu, J.; Zhang, F. The Influence of Konjac Glucomannan on the Physicochemical and Rheological Properties and Microstructure of Canna Starch. Foods 2021, 10, 422. [Google Scholar] [CrossRef]
- Da Silva, D.F.; Barbosa, D.S.F.; de Souza Ferreira, S.B.; Bruschi, M.L.; Britten, M.; Matumoto-Pintro, P.T. Effect of commercial konjac glucomannan and konjac flours on textural, rheological and microstructural properties of low fat processed cheese. Food Hydrocoll. 2016, 60, 308–316. [Google Scholar] [CrossRef]
- Dai, S.; Jiang, F.; Shah, N.P.; Corke, H. Functional and pizza bake properties of Mozzarella cheese made with konjac glucomannan as a fat replacer. Food Hydrocoll. 2019, 92, 125–134. [Google Scholar] [CrossRef]
- Dai, S.; Corke, H.; Shah, N.P. Utilization of konjac glucomannan as a fat replacer in low-fat and skimmed yogurt. J. Dairy Sci. 2016, 99, 7063–7074. [Google Scholar] [CrossRef]
- Sorapukdee, S.; Jansa, S.; Tangwatcharin, P. Partial replacement of pork backfat with konjac gel in Northeastern Thai fermented sausage (Sai Krok E-san) to produce the healthier product. Asian-Australas. J. Anim. Sci. 2019, 32, 1763–1775. [Google Scholar] [CrossRef] [PubMed] [Green Version]
- Yoshimura, M.; Takaya, T.; Nishinari, K. Effects of Konjac-Glucomannan on the Gelatinization and Retrogradation of Corn Starch As Determined by Rheology and Differential Scanning Calorimetry. J. Agric. Food Chem. 1996, 44, 2970–2976. [Google Scholar] [CrossRef]
- Song, R.; Huang, M.; Li, B.; Zhou, B. The Effect of Three Gums on the Retrogradation of Indica Rice Starch. Nutrients 2012, 4, 425–435. [Google Scholar] [CrossRef]
- Khanna, S.; Tester, R.F. Influence of purified konjac glucomannan on the gelatinisation and retrogradation properties of maize and potato starches. Food Hydrocoll. 2006, 20, 567–576. [Google Scholar] [CrossRef]
- Schwartz, J.M.; Bail, K.L.; Garnier, C.; Llamas, G.; Queveau, D.; Pontoire, B.; Srzednicki, G.; Bail, P.L. Available water in konjac glucomannan–starch mixtures. Influence on the gelatinization, retrogradation and complexation properties of two starches. Food Hydrocoll. 2014, 41, 71–78. [Google Scholar] [CrossRef]
- Xu, Z.T.; Zhong, F.; Li, Y.; Shoemaker, C.F.; Yokoyama, W.H.; Xia, W.S. Effect of Polysaccharides on the Gelatinization Properties of Cornstarch Dispersions. J. Agric. Food. Chem. 2012, 60, 658–664. [Google Scholar] [CrossRef]
- Guo, J.; Wang, C.; Liu, C.; Wang, P. Effect of Konjac Glucomannan on Gelatinization, Retrogradation, and Gelling Properties of Frozen Wheat Starch. Starch-Starke 2020, 73, 2000025. [Google Scholar] [CrossRef]
- Lin, S.; Liu, X.; Cao, Y.; Liu, S.; Deng, D.; Zhang, J.; Huang, G. Effects of xanthan and konjac gums on pasting, rheology, microstructure, crystallinity and in vitro digestibility of mung bean resistant starch. Food Chem. 2021, 339, 128001. [Google Scholar] [CrossRef] [PubMed]
- Zhen, F.; Chen, J.; Luo, S.J.; Liu, C.M.; Wei, L. Effect of food additives on starch retrogradation: A review. Starch-Starke 2015, 67, 69–78. [Google Scholar]
- Zhang, Z.; Yang, Y.; Tang, X.; Chen, Y.; You, Y. Chemical forces and water holding capacity study of heat-induced myofibrillar protein gel as affected by high pressure. Food Chem. 2015, 188, 111–118. [Google Scholar] [CrossRef]
- Wang, S.; Li, C.; Copeland, L.; Niu, Q.; Wang, S. Starch Retrogradation: A Comprehensive Review. Compr. Rev. Food Sci. Food Saf. 2015, 14, 568–585. [Google Scholar] [CrossRef]
- Dobosz, A.; Sikora, M.; Krystyjan, M.; Lach, R.; Borczak, B. Influence of xanthan gum on the short- and long-term retrogradation of potato starches of various amylose content. Food Hydrocoll. 2020, 102, 105618. [Google Scholar] [CrossRef]
- Russ, N.; Zielbauer, B.I.; Ghebremedhin, M.; Vilgis, T.A. Pre-gelatinized tapioca starch and its mixtures with xanthan gum and iota-carrageenan. Food Hydrocoll. 2016, 56, 180–188. [Google Scholar] [CrossRef]
- Ma, S.P.; Zhu, P.L.; Wang, M.C. Effects of konjac glucomannan on pasting and rheological properties of corn starch. Food Hydrocoll. 2019, 89, 234–240. [Google Scholar] [CrossRef]
- Fang, F.; Luo, X.; BeMiller, J.N.; Schaffter, S.; Hayes, A.M.R.; Woodbury, T.J.; Hamaker, B.R.; Campanella, O.H. Neutral hydrocolloids promote shear-induced elasticity and gel strength of gelatinized waxy potato starch. Food Hydrocoll. 2020, 107, 105923. [Google Scholar] [CrossRef]
- Lee, H.Y.; Jo, W.; Yoo, B. Rheological and microstructural characteristics of rice starch-tara gum mixtures. Int. J. Food Prop. 2017, 20, 1879–1889. [Google Scholar] [CrossRef]
- Singh, A.; Geveke, D.J.; Yadav, M.P. Improvement of rheological, thermal and functional properties of tapioca starch by using gum arabic. Lwt-Food Sci. Technol. 2017, 80, 155–162. [Google Scholar] [CrossRef]
- Qiu, S.; Yadav, M.P.; Zhu, Q.M.; Chen, H.; Liu, Y.; Yin, L.J. The addition of corn fiber gum improves the long-term stability and retrogradation properties of corn starch. J. Cereal Sci. 2017, 76, 92–98. [Google Scholar] [CrossRef]
- Chen, L.; Ren, F.; Zhang, Z.P.; Tong, Q.Y.; Rashed, M.M.A. Effect of pullulan on the short-term and long-term retrogradation of rice starch. Carbohydr. Polym. 2015, 115, 415–421. [Google Scholar] [CrossRef]
- Yuris, A.; Matia-Merino, L.; Hardacre, A.K.; Hindmarsh, J.; Goh, K.K.T. Molecular interactions in composite wheat starch-Mesona chinensis polysaccharide gels: Rheological, textural, microstructural and retrogradation properties. Food Hydrocoll. 2018, 79, 1–12. [Google Scholar] [CrossRef]
- Yuris, A.; Goh, K.K.T.; Hardacre, A.K.; Matia-Merino, L. Understanding the interaction between wheat starch and Mesona chinensis polysaccharide. LWT 2017, 84, 212–221. [Google Scholar] [CrossRef]
- Kovrlija, R.; Rondeau-Mouro, C. Multi-scale NMR and MRI approaches to characterize starchy products. Food Chem. 2017, 236, 2. [Google Scholar] [CrossRef] [PubMed]
- Yu, L.; Yuehuan, X.; Mingyue, S.; Huiliang, W.; Yanming, R.; Jun, Y.; Xiuying, H.; Jianhua, X. Effect of Mesona chinensis polysaccharide on the retrogradation properties of maize and waxy maize starches during storage. Food Hydrocoll. 2020, 101, 105538. [Google Scholar]
- Zheng, M.; Lin, Y.; Wu, H.; Zeng, S.; Zheng, B.; Zhang, Y.; Zeng, H. Water migration depicts the effect of hydrocolloids on the structural and textural properties of lotus seed starch. Food Chem. 2020, 315, 126240. [Google Scholar] [CrossRef] [PubMed]
- Chen, L.; Tian, Y.; Tong, Q.; Zhang, Z.; Jin, Z. Effect of pullulan on the water distribution, microstructure and textural properties of rice starch gels during cold storage. Food Chem. 2017, 214, 702–709. [Google Scholar] [CrossRef] [PubMed]
- Shang, L.; Wu, C.; Wang, S.; Wei, X.; Li, B.; Li, J. The influence of amylose and amylopectin on water retention capacity and texture properties of frozen-thawed konjac glucomannan gel. Food Hydrocoll. 2021, 113, 106521. [Google Scholar] [CrossRef]
- He, H.; Zhang, Y.; Yan, H.; Gu, Z. Effects of hydrocolloids on corn starch retrogradation. Starch-Starke 2015, 67, 348–354. [Google Scholar] [CrossRef]


| Time (days) | Amy (Pa·s) | Amy-0.1%KGM (Pa·s) | Amy-0.2%KGM (Pa·s) | Amy-0.3%KGM (Pa·s) |
|---|---|---|---|---|
| 1 | 0.962 | 1.104 | 1.167 | 1.157 |
| 3 | 0.994 | 1.107 | 1.175 | 1.441 |
| 5 | 1.031 | 1.118 | 1.281 | 1.743 |
| 7 | 1.088 | 1.295 | 1.319 | 2.057 |
| 14 | 1.521 | 1.596 | 1.805 | 2.233 |
Publisher’s Note: MDPI stays neutral with regard to jurisdictional claims in published maps and institutional affiliations. |
© 2022 by the authors. Licensee MDPI, Basel, Switzerland. This article is an open access article distributed under the terms and conditions of the Creative Commons Attribution (CC BY) license (https://creativecommons.org/licenses/by/4.0/).
Share and Cite
Wang, S.; Ding, L.; Chen, S.; Zhang, Y.; He, J.; Li, B. Effects of Konjac Glucomannan on Retrogradation of Amylose. Foods 2022, 11, 2666. https://doi.org/10.3390/foods11172666
Wang S, Ding L, Chen S, Zhang Y, He J, Li B. Effects of Konjac Glucomannan on Retrogradation of Amylose. Foods. 2022; 11(17):2666. https://doi.org/10.3390/foods11172666
Chicago/Turabian StyleWang, Shishuai, Lidong Ding, Shuo Chen, Ying Zhang, Jiaxin He, and Bin Li. 2022. "Effects of Konjac Glucomannan on Retrogradation of Amylose" Foods 11, no. 17: 2666. https://doi.org/10.3390/foods11172666
APA StyleWang, S., Ding, L., Chen, S., Zhang, Y., He, J., & Li, B. (2022). Effects of Konjac Glucomannan on Retrogradation of Amylose. Foods, 11(17), 2666. https://doi.org/10.3390/foods11172666