Article

Phytostimulation and Synergistic Antipathogenic Effect of Tagetes erecta Extract in Presence of Rhizobacteria

by
Alina Perisoara
1,2,
Ioana Cristina Marinas
3,4,*,
Elisabeta Irina Geana
5,
Mariana Constantin
6,7,
Marian Angheloiu
4,
Lucia Pirvu
8 and
Stelica Cristea
1,2
1
Biotehnos SA., 3-5 Gorunului Street, 075100 Otopeni, Ilfov County, Romania
2
Plant Pathology Departament, University of Agronomic Science and Veterinary Medicine Bucharest, 011464 București, Romania
3
Research Institute of the University of Bucharest—ICUB, 91-95 Splaiul Independenței St., District 5, 050095 Bucharest, Romania
4
Research and Development Department of SC Sanimed International Impex SRL, Șos. București-Giurgiu (DN5), No. 6, 087040 Călugăreni, Romania
5
National R&D Institute for Cryogenics and Isotopic Technologies—ICIT, Rm. Valcea, 4 Uzinei St., 240050 Ramnicu Valcea, Romania
6
National Institute for Research & Development in Chemistry and Petrochemistry-ICECHIM, 202 Independentei Spl., 060021 Bucharest, Romania
7
Faculty of Pharmacy, Titu Maiorescu University, 16 Bd. Gh. Sincai, 040441 Bucharest, Romania
8
National Institute for Chemical-Pharmaceutical Research and Development, 031282 Bucharest, Romania
*
Author to whom correspondence should be addressed.
Horticulturae 2022, 8(9), 779; https://doi.org/10.3390/horticulturae8090779
Submission received: 13 July 2022 / Revised: 7 August 2022 / Accepted: 24 August 2022 / Published: 28 August 2022

Abstract

:
In anticipation of the food crisis, developing innovative products and technologies to increase crop yield and quality is a necessity. In this context, the aim of this study was to develop a phytostimulant based on Tagetes erecta extract and rhizobacteria to increase the antifungal activity against phytopathogenic fungi. The hydroalcoholic extract from T. erecta flowers was characterized by UV-Vis spectrophotometric assays (total phenolic content, total flavonoids content, reducing sugar content), qualitatively by ATR-FTIR and quantitatively for individual compounds by UHPLC-HESI analysis. The antioxidant activity was evaluated and the phytostimulation capacity was done on the radish and cucumber. The variants of the concentration that stimulated the rhizobacteria (Bacillus sp.) proliferation were selected by evaluating the influence on the microbial viability in a liquid medium. The antifungal activity against fungal pathogens (Monilinia laxa, Fusarium graminearum, Aspergillus niger) was determined by reducing mycelium growth in solid and liquid media. The synergistic effect between optimal levels of rhizobacteria-containing T. erecta extract showed a significant decrease in mycelium development. Thus, PGPR strains treated with T. erecta extract could be applied as biocontrol agents against plant pathogens and stimulate vegetable seedlings.

1. Introduction

Population growth and the agricultural field’s transformation into barren lands due to the excessive use of chemical fertilizers and pesticides are expected to lead to a food crisis in the near future; these are major obstacles that limit the achievement of sustainable agriculture goals [1]. Thus, plant growth and development can be adjusted by exogenous application of various natural compounds from plant origin and phytostimulants. These approaches are gaining considerable attention due to their natural origin and promising role in improving tolerance to biotic and abiotic stress on crops, indicated by various physiological attributes, such as photosynthesis and nutrient uptake [2]. Furthermore, the use of phytostimulants is a sustainable solution to enhance crop health by reducing abiotic stress and helps to increase the seedlings’ resistance to climate changes [3].
In the current context, biostimulants are widely examined in the form of a microorganism’s mixture and natural products, such as protein hydrolysates, humic and fulvic acids, basic nutrients and extracts from plants, and algae. The main natural biostimulants are polysaccharides, polyphenols, compounds with hormonal activity, protein hydrolysates, and amino acids [4]. At the same time, other commonly used components such as plant nutrients are indirect biostimulators, with direct nutritional effects being considered biofertilizers [5].
In general, phenolic compounds have a phytotoxic character at high concentrations and are considered by some authors to be allelopathic [6]. However, at lower concentration, these compounds have the ability to stimulate germination and thus crop development [7,8]. Tagetes erecta is known to control nematodes in the soil and tomato and potato roots by planting them as intercropped or rotating crops [9]. Natarajan et al. [10] reported that the application of aqueous extracts of root, stem, and whole T. erecta plant significantly impact L. esculentum plant growth. From the analysis of the literature data, most of the studies carried out so far use T. erecta seeds as a germination model and plant growth by evaluating other phytostimulants [11,12,13] or demonstration of insecticide potential [14].
Biotic agents (viruses, bacteria, nematodes, weeds, arachnids) can induce stress in their hosts by disrupting normal metabolism and limiting plant growth or even causing their mortality. Some biotic agents interact symbiotically or synergistically with their host plants, while others may be beneficial to plants and act as chemical fertilizers or pesticides. Plant-growing rhizobacteria (PGPR) can significantly improve plant growth through a mutually beneficial interaction between plants and microbes. Species of the genus Bacillus are a major type of rhizobacteria that can form spores in the soil for a long time in harsh environmental conditions. Plant growth is enhanced by PGPR through inducing systemic resistance, antibiosis, and competitive omission. Thus, the use of PGPR can induce systemic plant resistance to biotic agents and increase tolerance to environmental stress. Species of the genus Bacillus have both direct and indirect biocontrol mechanisms to suppress diseases caused by pathogens [15].
Increasing reports of pathogens’ resistance to fungicides, restrictive regulations, and growing concerns about human health and environmental problems resulting from overuse of agrochemicals, have stimulated the search for alternative methods of managing vegetable diseases [16]. Therefore, the aim of the study was to develop a phytostimulant based on T. erecta extract with a prebiotic effect on rhizobacteria in order to increase the antifungal activity against phytopathogenic fungi. In the present study, the physico-chemical characterization of T. erecta extract, the antioxidant activity by chemical methods, the influence on rhizobacteria viability, the selection of the variant that stimulates bacterial cell proliferation, root elongation modification related to solvent control, and the evaluation of antifungal effect against three phytopathogenic strains were evaluated for extract and mixture with extract and PGPR suspensions.

2. Materials and Methods

2.1. Extraction and Physico-Chemical Characterization of Plant Extract

2.1.1. Extraction Procedure

Dried and ground flowers of marigold (Tagetes erecta L.) were harvested from an ecological culture in Bulgaria in 2021. T. erecta flowers’ extract was obtained by maceration in ethanol: water (70%) at room temperature for 10 days. Extraction ratio was 1:20 (w/v). After filtration, the sample extract was concentrated using a rotary evaporator to completely remove the alcohol. The obtained semi-solid extract was taken up in 40% ethanol. The extract was stored at −20 °C until the analyses were performed.

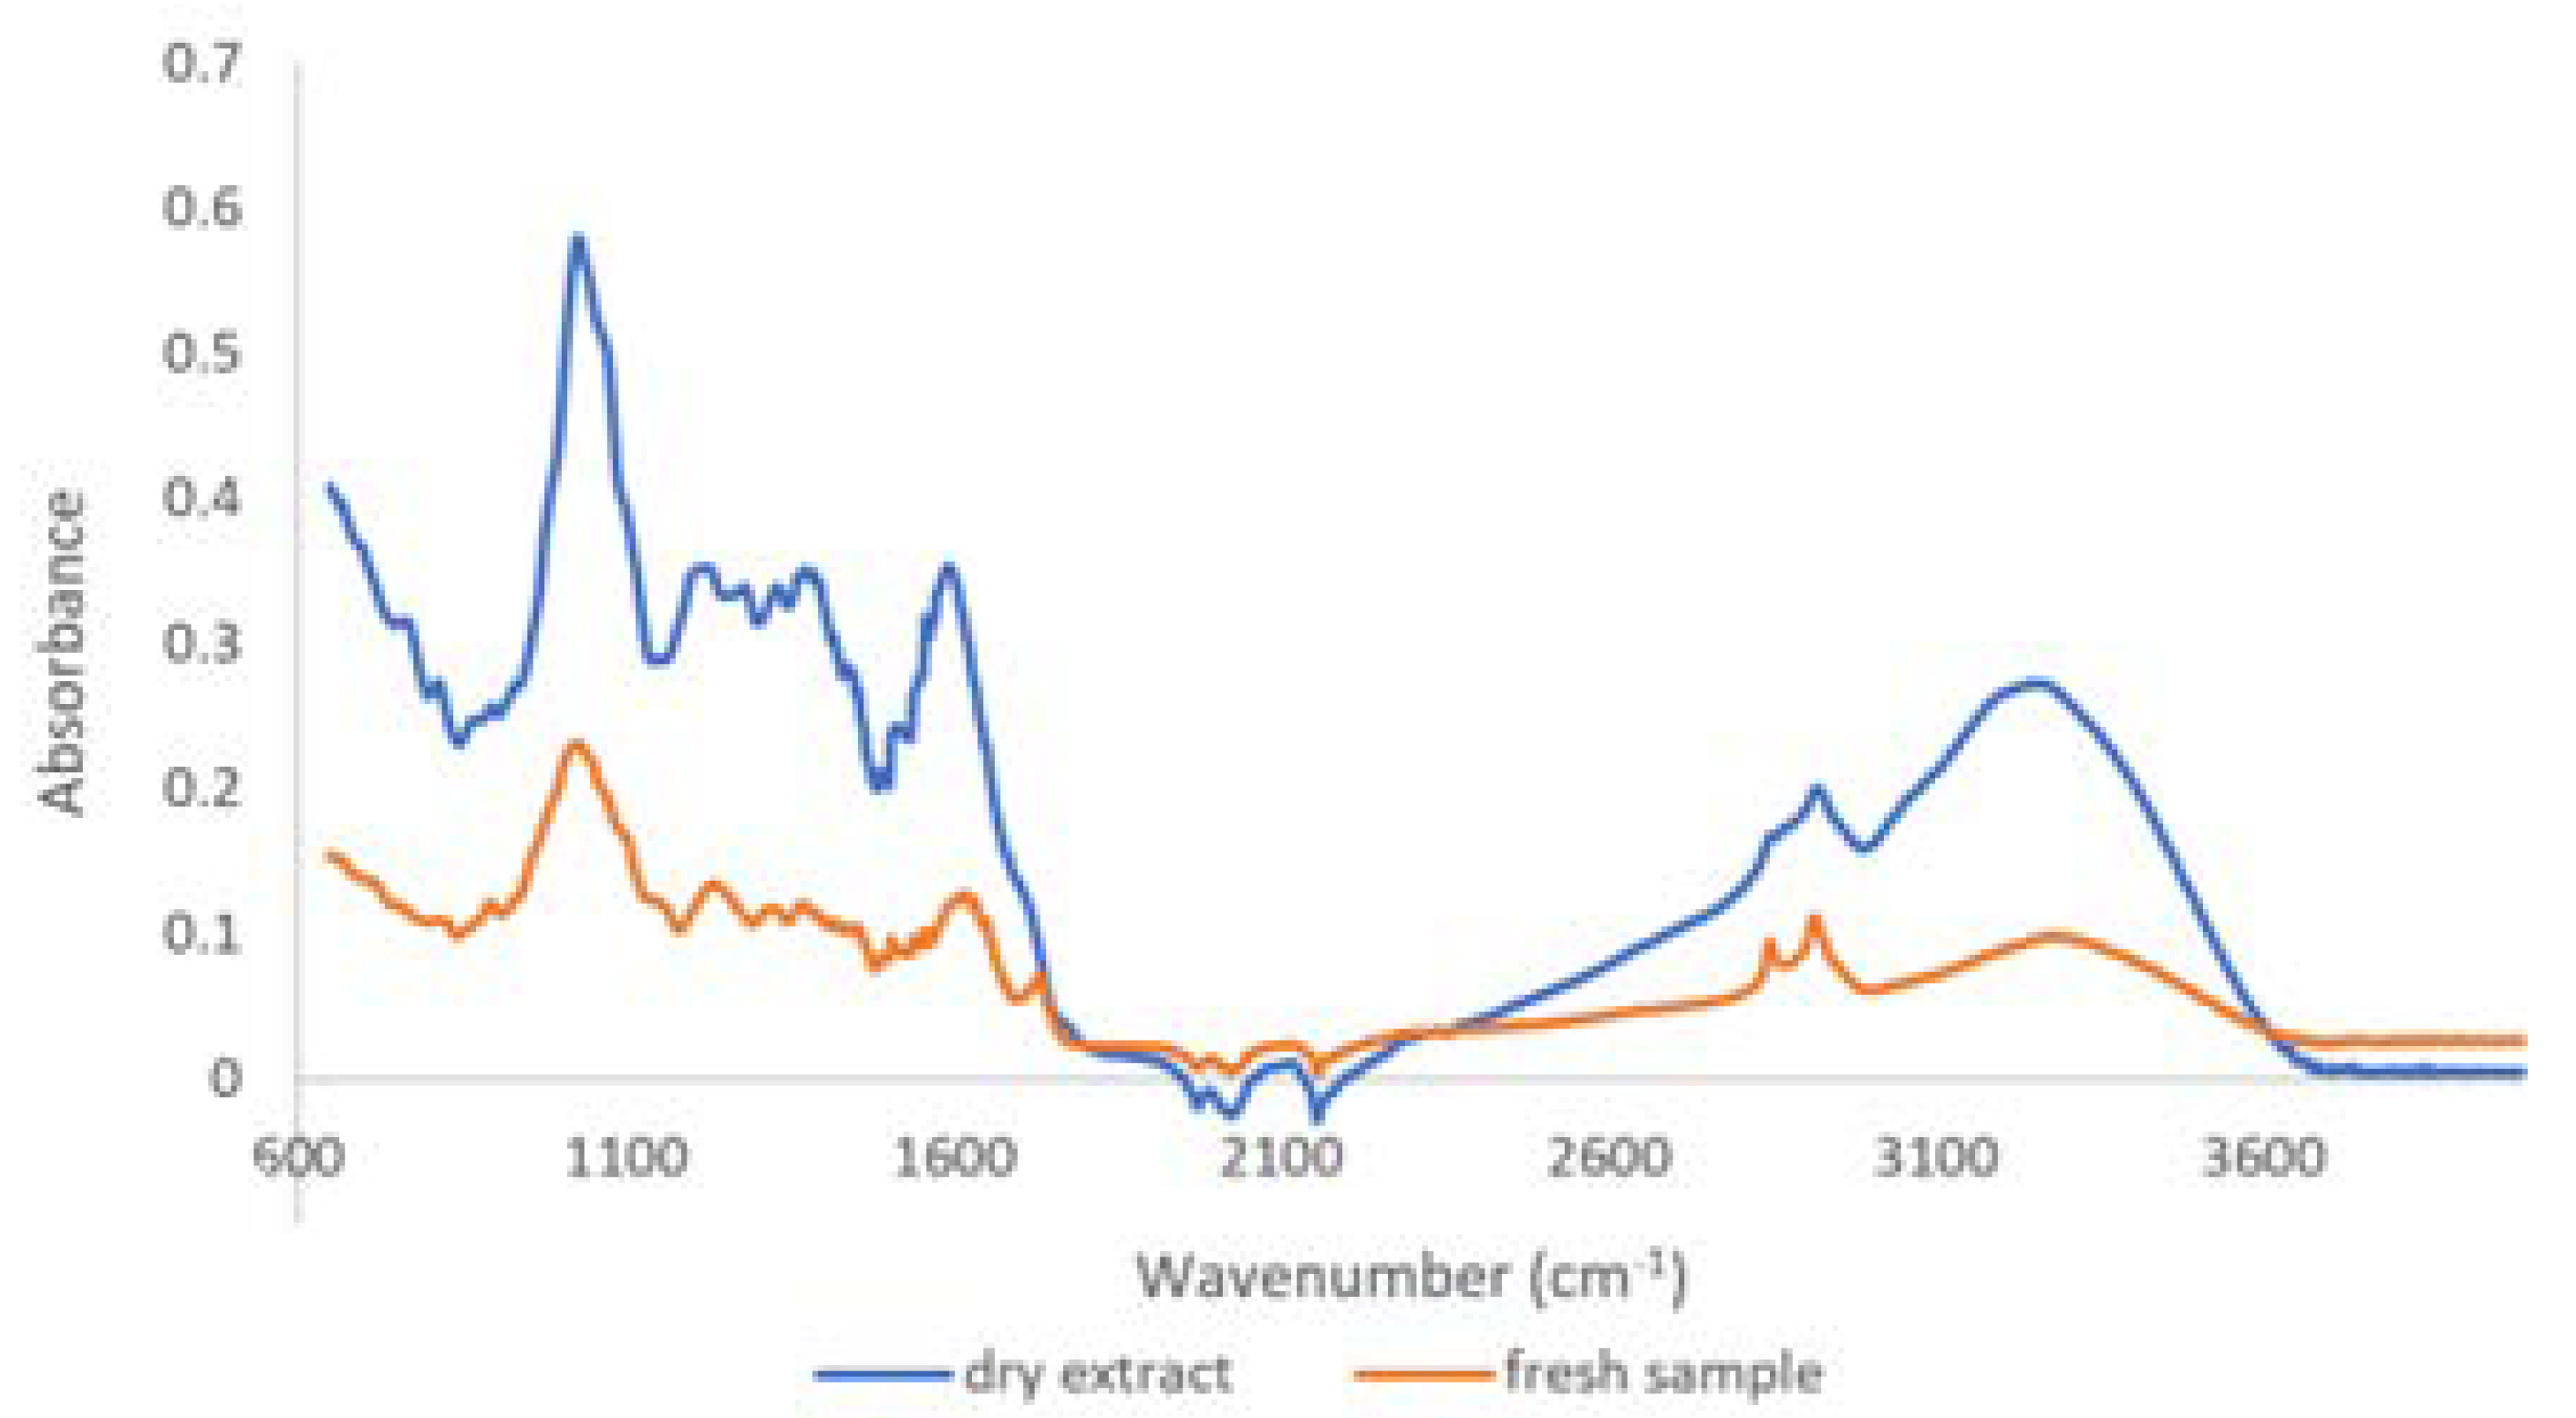
2.1.2. Qualitative Analysis by ATR-FTIR

The FTIR spectrum for plant material and dry extracts was recorded at room temperature using the Cary 630 FTIR Spectrometer in ATR mode (Agilent Technologies Inc., Santa Clara, CA, USA). The chosen measurement range was 4000–650 cm−1, the number of scans was 400, and the resolution was 4 cm−1. The FTIR spectra of dry extract were produced on the alcoholic extract dried previously at 28 °C (for 72 h) [17].

2.1.3. Determination of Phenol Content

Total phenolic content (TPC) was performed according to Singleton et al. [17] with slight modification. Over 100 µL of the sample was added to 900 µL H2O distillated water. After adding 100 µL of Folin–Ciocalteu reagent (Sigma Aldrich, Darmstadt, Germany, product cod: F9252), samples were stirred for 5 min, then added to 1000 µL of 7% Na2CO3. After incubation in the dark at room temperature for 60 min, the absorbance values were recorded at 765 nm. The calibration curve was performed for gallic acid concentrations between 25–250 μg/mL (R2 = 0.9994).

2.1.4. Determination of Flavonoid Content

The total flavonoid content (TFC) was determined according to Formagio et al. [18]. Briefly, over 0.1 mL sample was added to 0.1 mL of 10% sodium acetate, 0.12 mL of 10% AlCl3 aqueous solution, and was brought to a final volume of 0.5 mL with 70% ethanol. After stirring, this solution was allowed to stand for 45 min in the dark and the absorbance was read at 430 nm. A calibration curve was performed for quercetin concentrations in the range of 10–250 μg/mL (R2 = 0.9968).

2.1.5. Determination of Reducing Sugar Content

Reducing sugar content (RSC) was determined using the 3,5-dinitrosalicylic acid (DNSA) method, according to Khatri et al. [19] with slight modification. For the measurement, 650 µL of DNSA reagent was pipetted into a test tube containing 350 µL of plant extract and kept at 90 °C for 15 min. After cooling, 150 μL was added in 96-well plates and the absorbance was measured at 540 nm using a UV-VIS spectrophotometer. The reducing sugar content was calculated from the calibration curve of standard D-glucose (0.1–1 mg/mL) (R2 = 0.9981).

2.1.6. Ultra-High-Performance Liquid Chromatography Electrospray Ionization Tandem Mass Spectrometry

Polyphenolic compound quantification was performed using a high-resolution Q Exactive mass spectrometer™ Focus Hybrid Quadrupole-OrbiTrap (Thermo Fisher Scientific, Bremen, Germany) equipped with HESI, coupled to a high-performance liquid chromatograph Ulti-Mate 3000 UHPLC (Thermo Fisher Scientific, Bremen, Germany). Chromatographic separation was per-formed on a Kinetex® C18 column (100 × 2.1 mm, 1.7 µm particle diameter) at 30 °C. Mobile phase: A—water with 0.1% formic acid and B—methanol with 0.1% formic acid, with elution in a gradient at a flow rate between 0.3 and 0.4 mL/min. The mass spectra were recorded in negative ionization mode, in a range between m/z 100 and 1000, at a resolution of 70,000. Nitrogen was used as collision gas and auxiliary gas at a flow rate of 11 and 48 arbitrary units, respectively. The applied voltage was 2.5 kV, and the capillary temperature was 320 °C. The energy of the collision cell varied between 30 and 60 eV. The calibration was performed in the concentration range between 0 and 1000 μg/L for each of the phenolic acids and flavonoids by serial dilution with methanol of the standard mixture of concentration (10 mg/L) [20]. The data were purchased and processed using the Xcalibur software package (Version 4.1).

2.2. Antioxidant Activity

The measurement of DPPH radical scavenging activity was performed by a method adapted from Madhu et al. [21]. An amount of 100 μL of the sample was added to 100 μL of 0.3 mM DPPH methanolic solution. The absorbance was read at λ = 517 nm using a Multiskan™ Microplate Spectrophotometer (Thermo Fisher Scientific, Waltham, MA, USA) after 30 min of incubation in the dark. The calibration curve was done for concentrations between 80–5 µM Trolox/mL (R2 = 0.9988).
The CUPRAC method is based on the reduction of a cupric complex, neocuproin, by antioxidants in copper form. Copper ion reduction was performed according to a method described by Celik et al. [22]. An amount of 60 µL of sample/standard solutions of different concentrations was mixed with 50 µL CuCl2 (10 mM), 50 µL neocuproin (7.5 mM), and 50 µL ammonium acetate buffer 1 M, pH = 7.00. After 30 min, the absorbance was measured at 450 nm using a Multiskan™Microplate Spectrophotometer (Thermo Fisher Scientific, Waltham, MA, USA). The stock Trolox solutions required for the calibration curve were 2 mM, and the working concentrations were between 0.24 and 2.0 mM Trolox/mL (R2 = 0.9991).
FRAP assay—the determination of the antioxidant capacity of iron reduction was performed by the method described by Corbu et al. [20]. The FRAP regent was prepared by mixing 300 mM of acetate buffer, pH 3.6, 10 mM of 2,4,6-tripyridyl-s-triazine (TPTZ) solution in 40 mM of HCl, and 20 mM of FeCl3 6H2O solution in a volume ratio 10:1:2 and was incubated at 37 °C before using. An aliquot of 10 µL of sample was mixed with 190 µL of FRAP regent and incubated in the dark at 37 °C. The absorbance was read at 593 nm using a Multiskan™ Microplate Spectrophotometer (Thermo Fisher Scientific, Waltham, MA, USA). A 1 mM Trolox stock solution was used to plot the calibration curve, the concentration ranging between 30 and 250 µM Trolox/mL (R2 = 0.9971).
Trolox equivalent antioxidant capacity (TEAC) assay was performed according to Re et al. [17] with a few modifications. A stable stock solution of ABTS+ was produced by mixing a solution of 7 mM of ABTS in 2.45 mM potassium persulphate. Then, the mixture was left standing in the dark at room temperature for 12–16 h before use. An ABTS+ working solution was obtained by dilution with ethanol to an absorbance of around of 0.70. The reaction mixture consisted of 20 µL of sample/standard and 180 µL of ABTS+ working solution was incubated 30 min in the dark and the absorbance was measured at 734 nm using a Multiskan™ Microplate Spectrophotometer (Thermo Fisher Scientific, Waltham, MA, USA). The standard curve was linear between 20 and 200 µM Trolox (R2 = 0.9981). The results were expressed in mM Trolox equivalent/mL extract.

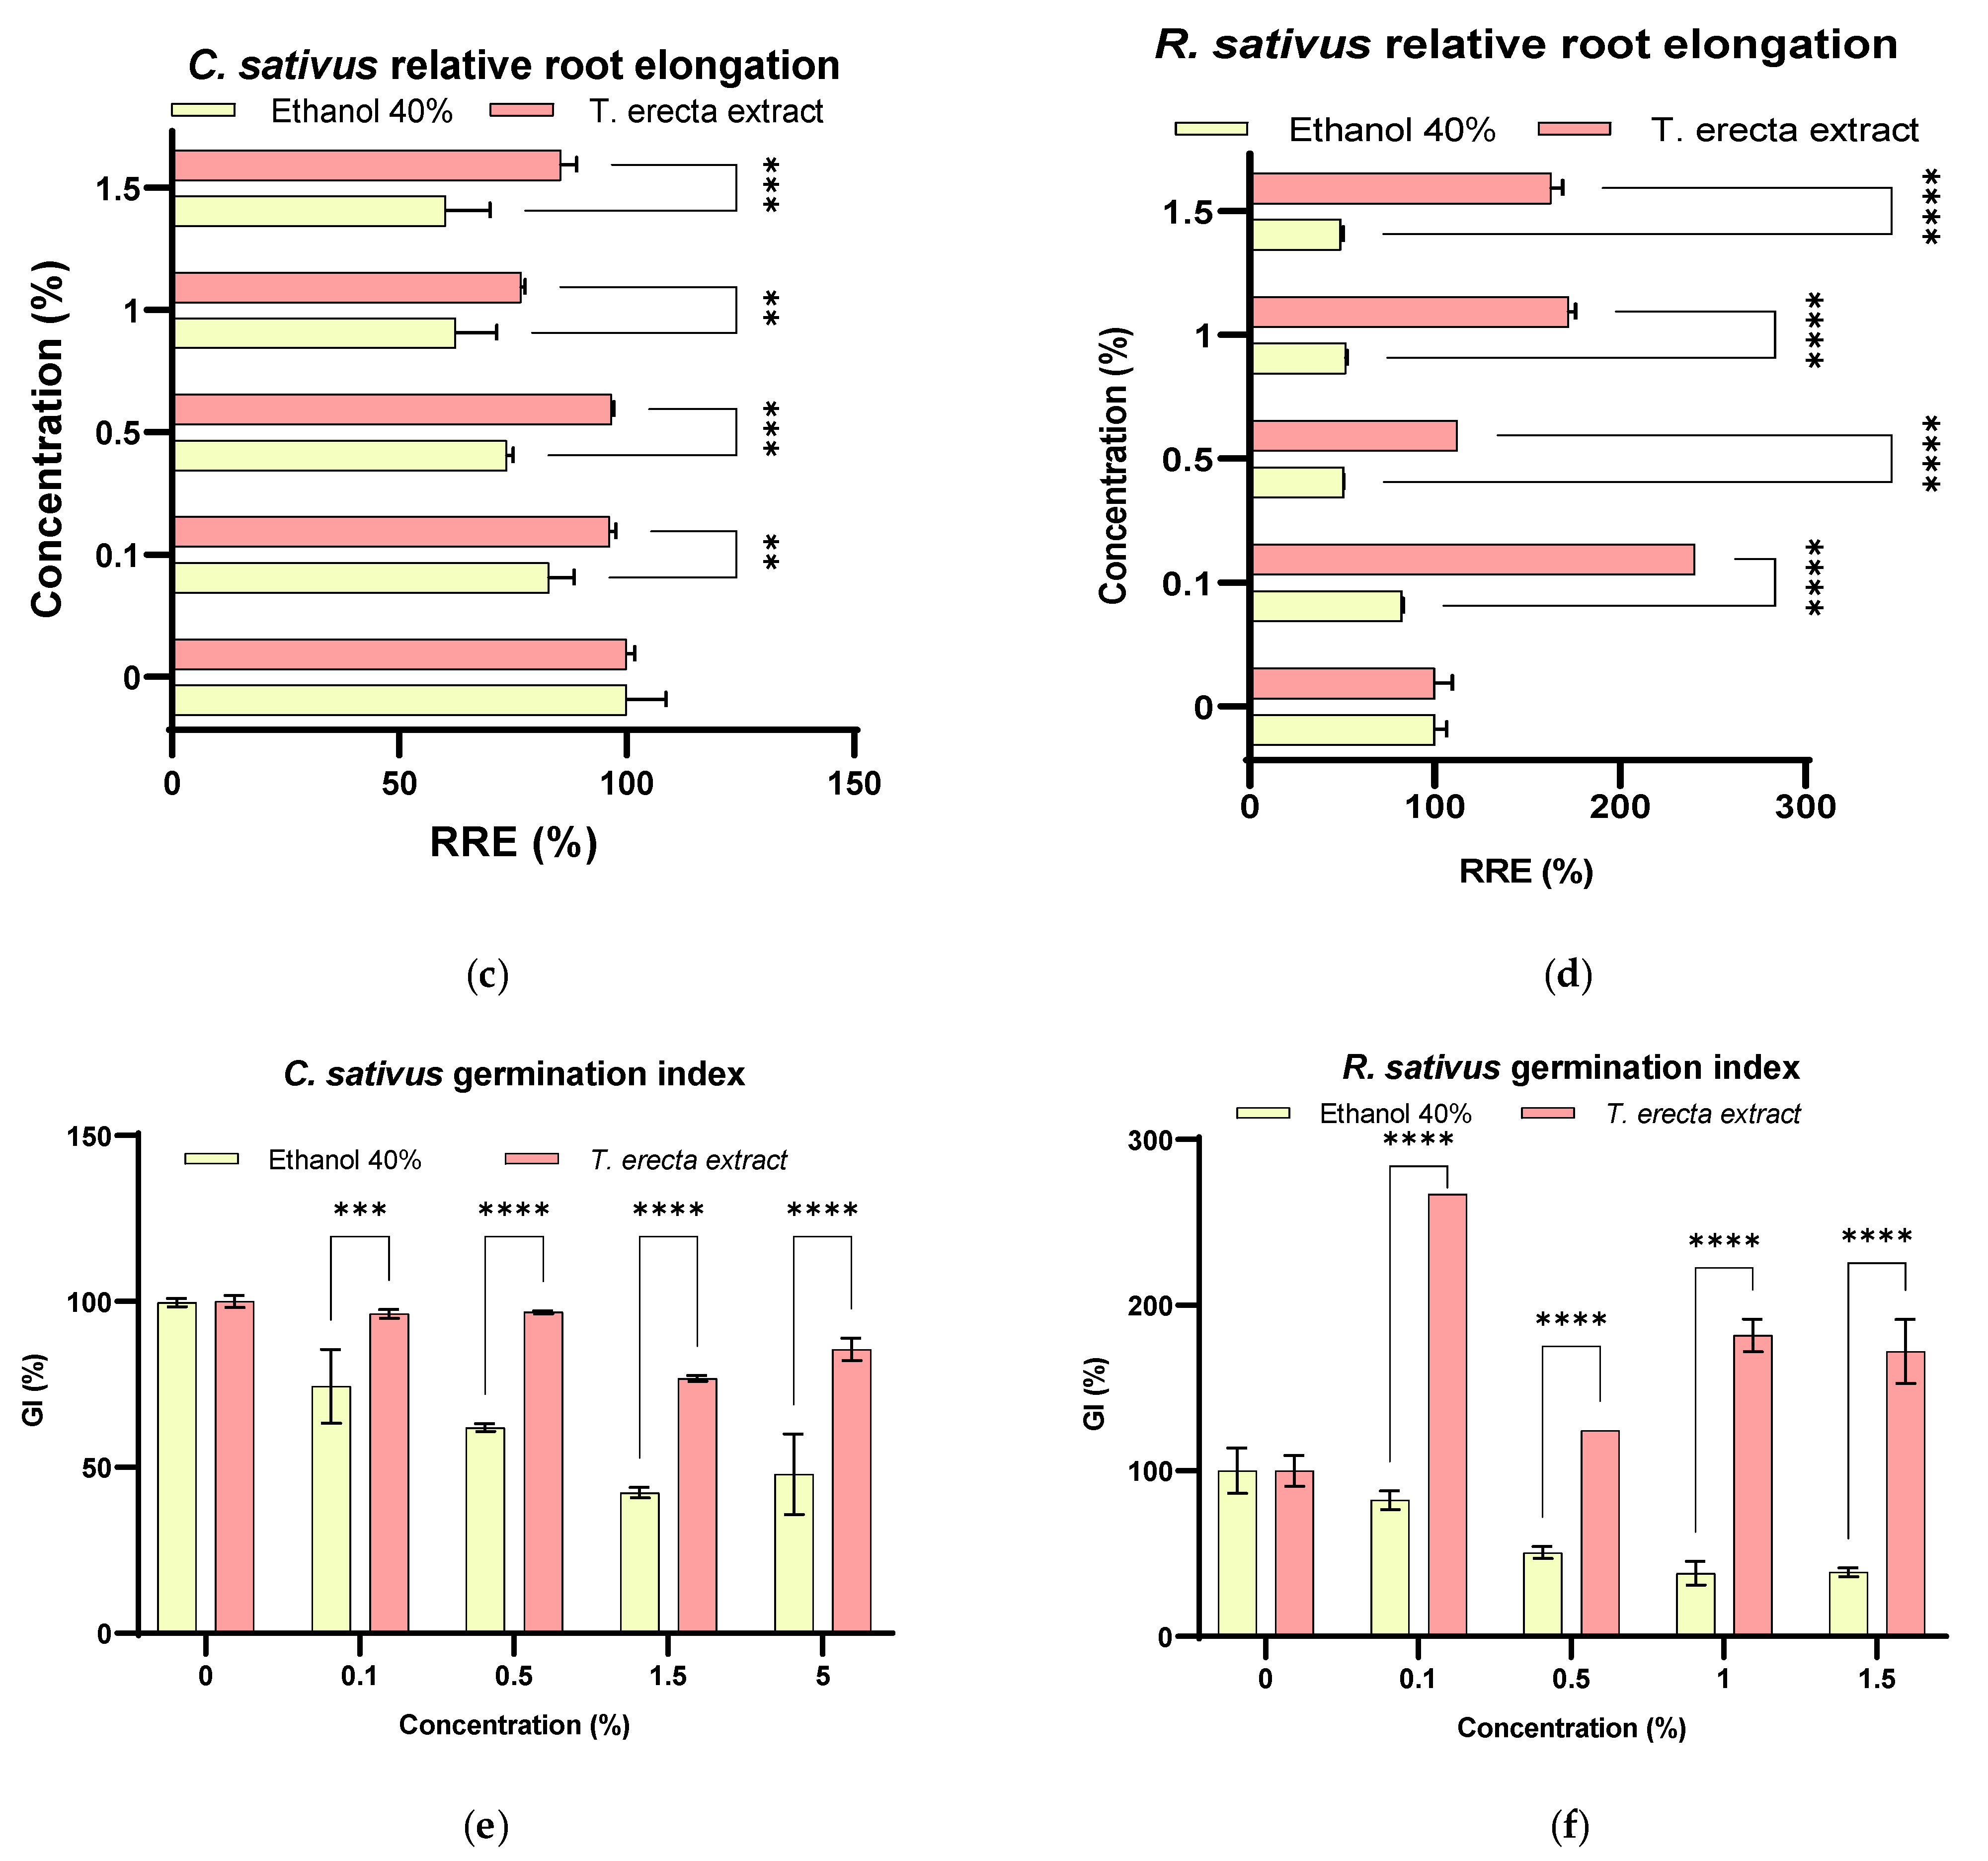
2.3. Seed Germination Bioassay

The purpose of the study was to evaluate the ability of stimulating germination for two types of seeds with different sizes in order to select the type of seedling for which the product is intended. Four dilutions of extract were performed in distilled water to obtain the following concentrations: 0.1%, 0.5%, 1.0%, and 1.5%; in parallel, the same dilutions were made for the solvent control (40% ethanol). The results were reported to the negative control containing distilled water. The materials used were sterilized according to the detailed recommendations by Mitelut and Popa [23]. Petri dishes were disinfected with 70% isopropyl alcohol and the filter paper was sterilized with UV radiation for 30 min.
The experiment was performed for two batches, each with 10 seeds. Ten radish/cucumber seeds of similar size were distributed in each sterile Petri dish and 5 mL of each dilution of extract or solvent control was added. The plates were incubated for 5 days at 25 ± 1 °C. At the end of the incubation period, the germinated seeds were counted and the root length was measured. The results were analyzed by determining the following indicators: relative seed germination (RSG), relative root elongation (RRE), and germination index (Gi), according to the equation below [24]:
RSG   ( % ) = N o .   f o r   s e e d   g e r m i n a t i o n   i n   t h e   e x t r a c t N o .   o f   s e e d s   g e r m i n a t e d   i n   t h e   c o n t r o l   ×   100
RRE   ( % ) = M e a n   r o o t   e l o n g a t i o n   i n   t h e   e x t r a c t M e a n   r o o t   e l o n g a t i o n   i n   t h e   c o n t r o l   ×   100
GI   ( % ) = % R S G   ×   % R R E 100

2.4. Modulators of the Microorganisms Growth

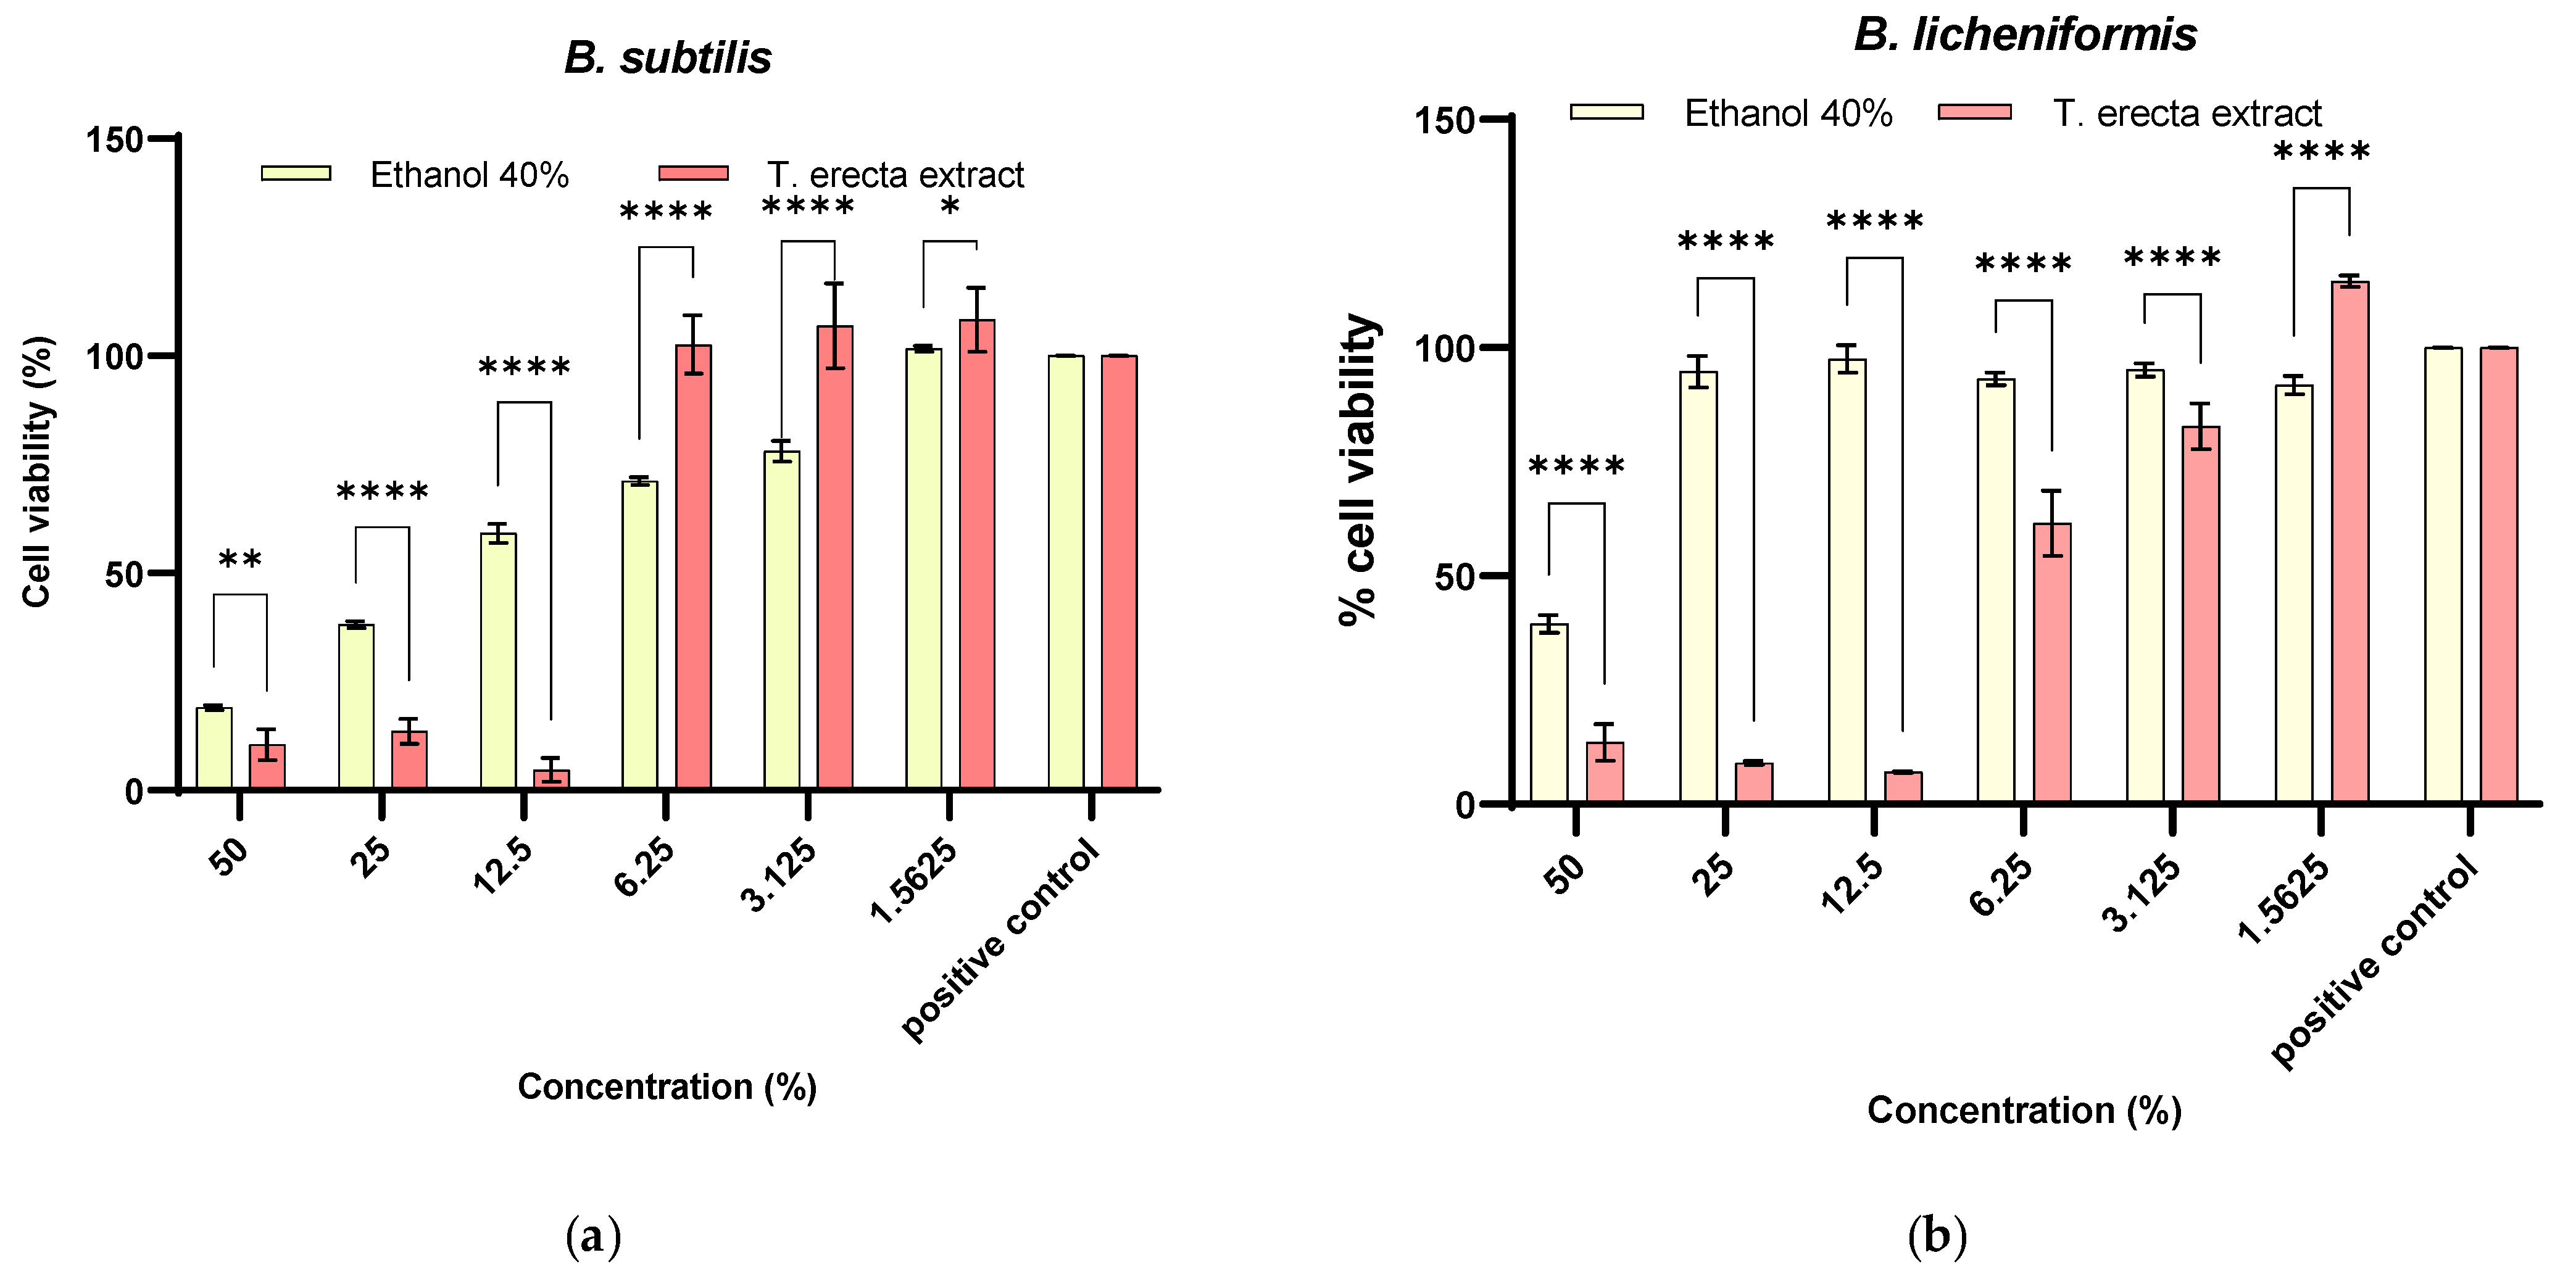
2.4.1. Prebiotic Activity on Bacillus sp.

To evaluate the antibacterial activity, three species belonging to the Bacillus genus were used: Bacillus subtilis, Bacillus licheniformis, and Bacillus amyloliquefaciens. These bacteria strains are found associated with plant roots, acting beneficially on their growth, and are widely used in various commercial formulations to promote plant growth [25,26]. The antimicrobial activity screening was determined by employing an adapted disk diffusion technique. Briefly, the microbial suspensions adjusted to 0.5 McFarland (108 CFU/mL) were inoculated on the surface of the solid medium (Muller–Hilton), after which paper discs impregnated with extract or solvent were distributed. The plates were incubated at 37 °C for 24 h. The obtaining of a mixed inhibition area around the disk level was interpreted as a positive result and inhibition zone diameter was measured [20].
The minimum inhibitory concentrations (MICs) were measured as described previously [27]. Briefly, serial dilutions of samples in liquid medium (Trypton Soya broth for Bacillus sp.) were prepared in 96-well plates (concentration range: 50–1.56%). Then, 10 µL of the microbial suspension with the standard density of 0.5 McFarland was added to each well. Positive and negative controls were used for each strain. The plates were incubated for 24 h at 37 °C. The absorbance was measured at 620 nm with FlexStation 3 UV–VIS (Molecular Devices Company, Sunnyvale, CA, USA) spectrophotometer. The measurements were performed in triplicate.

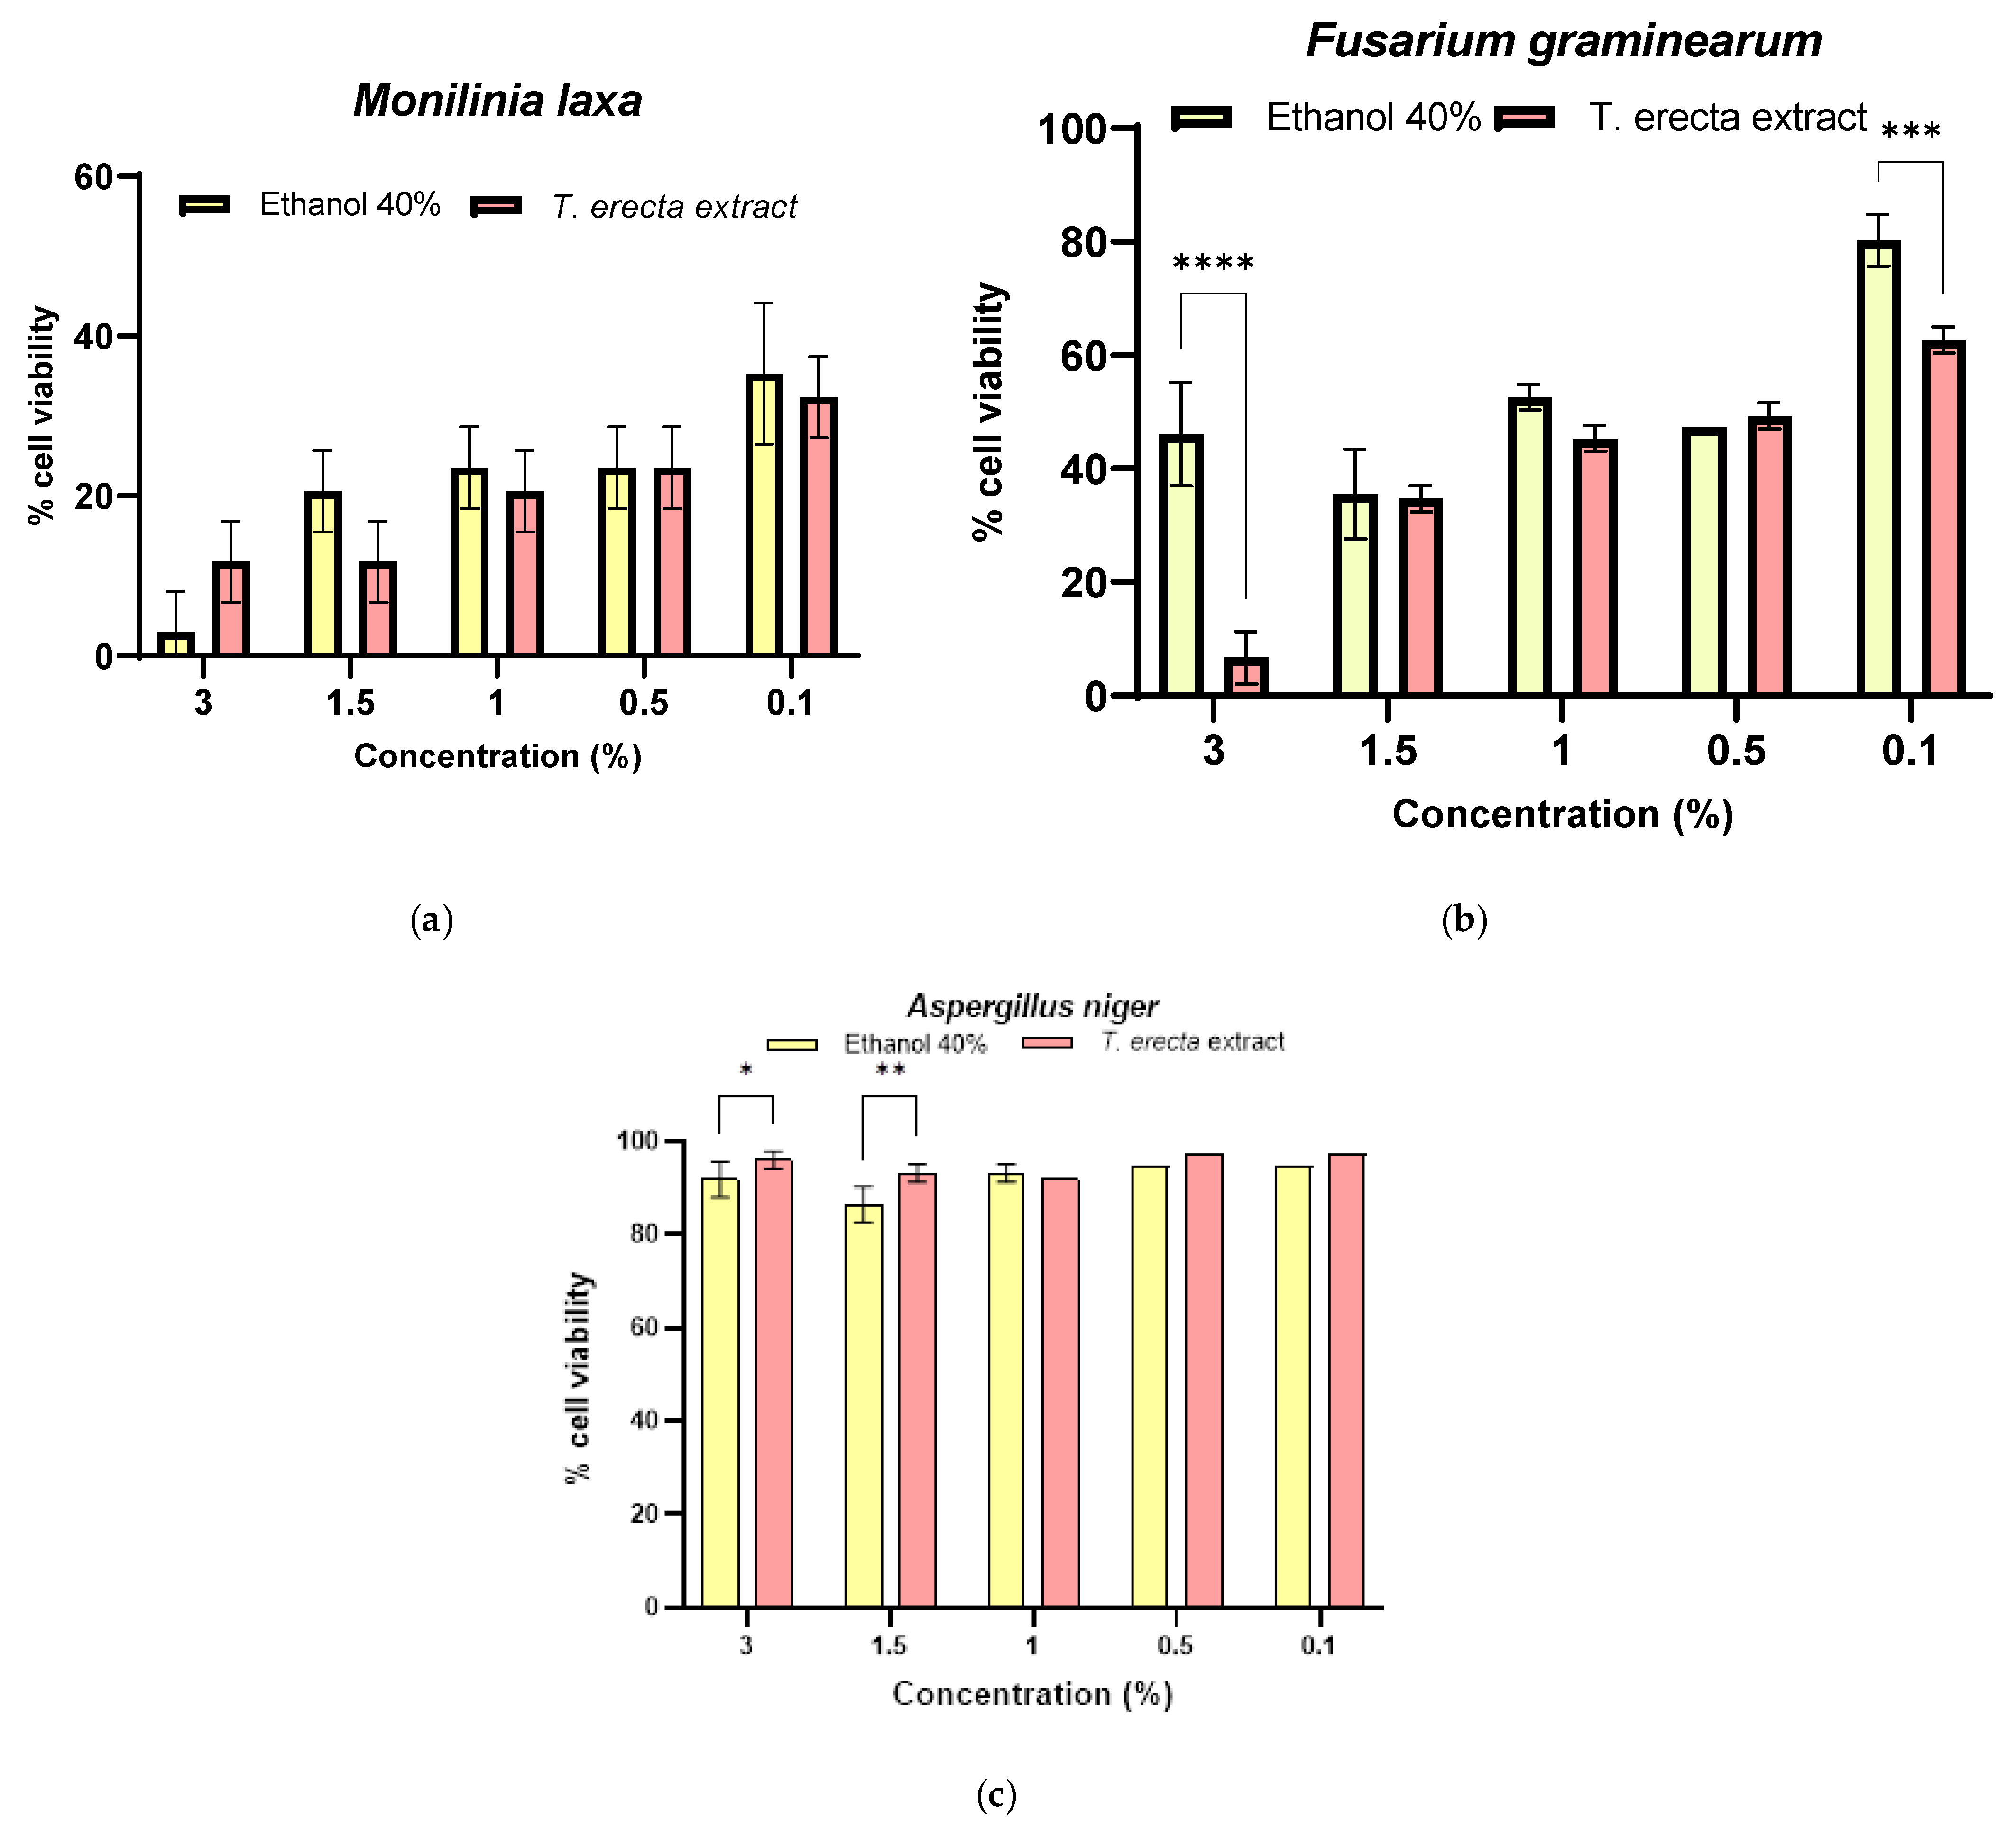
2.4.2. Antifungal Activity against Three Pathogenic Fungi

Three species of pathogenic fungi, Aspergillus niger, Fusarium graminearum, and Monilinia laxa strains were obtained from the Microbial Strain Collection of Faculty of Biology, University of Bucharest, Romania, and confirmed by MALDI-TOF. Qualitative antifungal screening was carried out using the incorporation of extract in PDA medium (Potato Dextrose Agar-Scharlau, Spain) melted and cooled to 40–45 °C. The extract concentrations used were 0.5%, 1%, and 5% on agar-well diffusion assay. After solidification, the Petri dishes were seeded with fragments from the active growth area of fungal culture with a diameter of 6 mm. The inoculated Petri dishes were incubated in a thermostat at 28 °C for 7–10 days until the growth of the fungal strains used as a control reached the maximum growth. After 10 days, the diameter of the colonies developed on the culture medium was measured. The diameter of the colonies formed by tested fungal strains on the culture media containing different concentrations of extracts was compared with that of the fungal strain colonies grown in the culture medium without the addition of extract (control). Results were recorded using the following formula, according with Javed et al. [28]:
Inhibition   percentage   ( % ) = d P C d E   d P C × 100
where dPC (cm) is the diameter of the positive control (strain control without extract/solvent) and dE (cm) the diameter of the fungi growth in the presence of extract/solvent.
The quantitative evaluation of the antifungal activity was performed in RPMI (Roswell Park Memorial Institute) 1640 using the microdilution method in 24 multi-well plates [20]. The concentrations of the extract (3%, 1.5%, 1%, 0.5%, 0.1%) were achieved in 2 mL final volume of RPMI 1640 seeded with 200 µL of standard fungal inoculum of 1 McFarland (108 CFU/mL fungal). After incubation for 7–10 days at room temperature, the absorbance was measurement at λ = 620 nm and the results were expressed as cell viability (%) related to positive control for fungal growth. A volume of 10 µL was taken from each well and was inoculated on the spot on the PDA medium and expressed as inhibition mycelia growth percentage (%) according to equation (4) after 7 days of incubation at 28 °C The solvent was also tested under the same conditions.

2.4.3. Synergistic Effect between T. erecta Extract and Rhizobacteria

The agar spot test described by Lee and Kim [29] was carried out to assess the production of antifungal activity by the mixture PGRP strains and T. erecta extract or ethanol 40%. The options used were the concentrations of 1.5% extract/solvent in the presence of B. licheniformis, and 1.5% and 3% extract/solvent in the presence of B. subtilis against the fungi strains (F. graminearum, M. laxa, A. niger). For testing, 2 μL of a 108 CFU/mL fungal plug was inoculated in the centre of a plate with PDA and each isolated bacterium was spotted at a distance of 2.5 cm from the fungus suspension spot. Growth inhibition of the fungi was examined. After 7–15 days of incubation at 28 °C, inhibition zones were read. The presence of a sclear zone around the spot, which indicates an inhibition, was measured. The inhibition zone size (mm) was measured from the centre of the bacterial colony to the edge of the inhibition zone of the fungal colony. The analysis was made in triplicate [30].

2.4.4. Antibiofilm Activity

The influence on the ability of microbial adherence to the inert substratum (96-well plate, untreated polystyrene for bacterial strains/24-well plate for fungal strains) was measured after running the quantitative analysis of the antimicrobial activity, through the microtiter method, by evaluating the biofilm biomass, and after fixation with cold methanol (5 min) and 1% crystal violet staining (for 15 min). The optical density of resuspended adherence cells in acetic acid was 33% for 15 min; this was determined by reading the absorbance at 490 nm [27]. Positive controls are represented by the natural adhesion of untreated microbial strains.

2.5. Statistical Analysis

Data for total compounds content and antioxidant activity were performed in triplicate and processed to obtain the mean and standard deviation of the mean (SD). The statistical analysis was done using GraphPad Prism 9 (San Diego, CA, USA). Data were analyzed using ordinary two-way ANOVA with a two-stage linear step-up procedure of Benjamini, Krieger, and Yekutieli, with individual variances computed for comparison extract vs. solvent and extract vs. positive control (untreated cells) for antimicrobial, antibiofilm, and phytotoxicity activities. A value of p < 0.05 was considered to be statistically significant.

3. Results and Discussions

3.1. Physico-Chemical Characterization of T. erecta Extract

The extract obtained from the T. erecta flowers has a density of 1.0526 ± 0.0016 g/mL and a dry matter of approximately 3.6%. The qualitative profile was evaluated by FTIR for both plant material and dry extract (Figure 1). Thus, it can be observed that, in the extract, the specific bands of proteins, lipids, and cellulose were removed (1655, 1639, 1626, 1542, 1536, 1460, 1324, 1236, 897, and 672 cm−1); only the bands specific to phenolic compounds (1598, 1441, 1285, and 769 cm−1) and carbohydrates remain. The main bands identified are presented in Table S1.
For plant material, the bands in the range of 650–4000 cm−1 reflect the primary biochemical and macronutrient components, including lipids, proteins, and carbohydrates [31]. In particular, the band at 1736 cm−1 due to C=O stretching of esters could be assigned to glycerol-based lipids [32] or to acetyl ester and a carbonyl aldehyde group of hemicellulose and lignin [33]. Proteins generate the broad band of the O=CNH- vibrations between 1655 and 1500 cm−1 (region of proteins, Amide-I and Amide-II) and 1236 cm−1 for Amide-III [34]. The carbohydrate specific bands produce the main absorption between 1200 and 889 cm−1 [35].
After the extraction procedure, it was observed that in the extract, the specific bands of proteins, cellulose, and lipids were removed, highlighting the bands attributed to the aromatic compounds (1562 cm−1, 1441 cm−1, 1335 cm−1, 1598 cm−1, 1285 cm−1, 769 cm−1) [36] and carbohydrates (1032 cm−1) [37].
The carbohydrate component plays an essential role in plants, both as a nutrient and a central signaling or regulating molecule that modulates the expression of genes related to plant growth, development, metabolism, stress response, and disease resistance [19]. The qualitative evidence of the presence of carbohydrates in the extract was quantified by the reducing sugar content assay. Through the DNS method, a high concentration of reducing carbohydrates (5.97 ± 0.48 mg D-glucose/mL) was obtained. In this context, the extract has the ability to function as a nutrient for both plant and microbial cells.
There are a few studies on the reducing sugar content of T. erecta flowers. A more detailed study related to the extraction methodology highlights that the concentrations of reducing sugars were first increased with the extraction temperature between 80 °C and 180 °C (25 mg/g–90 mg/g) [38]. The extraction in this study was carried out at room temperature, so the correlation of the obtained result is difficult. Related to fresh plant weight, the extraction method improved the carbohydrates extraction (119.4 mg/g).
The extract has a high content of polyphenols and flavonoids (Table 1). The flavonoid content is about 13.29% of the total phenols quantified by the Folin–Ciocalteu method. The TPC value of 15.12 mg GAE/mL (302.4 mg GAE/g) is considerably higher than that obtained by Gong et al. [39], probably due to the longer extraction time. The TFC content proved to be lower compared to Gong et al. [39], probably due to degradation during extraction. Through HPLC, approximately 3.36% from the total phenolic compounds quantified by the Folin–Ciocalteu method and 20.15% of the total flavonoids were identified. According to Table 2, the main compounds identified were quercetin (383.74 mg/L), syringic acid (30.71 mg/L), ellagic acid (26.80 mg/L), and 3,4-dihydroxybenzoic acid (20.50 mg/L).
In general, phenolic compounds have a pronounced allelopathic character, but by optimizing their concentration, they could become phytostimulants, protecting plants from oxidative stress. According to Matos et al. [40], quercetin has been shown to act as a cytoprotective agent, thus allowing a greater increase of Lactuca sativa roots in the presence of mercury chloride. Pretreatment of chickpea seedlings with ellagic acid resulted in significant resistance to osmotic stress. In addition, an improvement was also observed in the germination rate, seedling growth, and the fresh and dry weight of the seedlings pretreated with ellagic acid and osmotically stressed [41].

3.2. Antioxidant Activity

Categories of biostimulators could be divided into antioxidants or elicitors for their synthesis in plants. This helps plants to cope with unfavourable growing conditions, such as extreme temperatures, a limited water supply, and lower nutrient absorption. In this study, we focus on the ability of T. erecta extract to provide antioxidants that help protect beneficial microbial and plant cells to enhance growth rate [42]. In addition, antioxidants are known to help induce better absorption of minerals from the soil, shoot growth, photosynthesis, and reduce biotic and abiotic stress [43].
The antioxidant activity was thus performed by four methods involving different mechanisms. From Table 3, it can be seen that the CUPRAC method obtained the best antioxidant activity, probably due to the fact that it is able to analyze both hydrophilic and lipophilic antioxidants [44].
Discoloration assays, such as ABTS and DPPH, have many disadvantages, one of which is that the higher the sample’s initial colour influence, the lower the absorbance value and antioxidant activity [45]. Another disadvantage of the DPPH method is the steric inaccessibility, because small molecules may have a better chance of accessing the radical, as well as the narrow linearity range [44,46]. The antioxidant activity obtained by the TEAC, FRAP, and DPPH methods had higher values than those obtained by Gong et al. [39]. These results correlated with TPC, indicating that the degraded flavonoids also show some antioxidant activity.
The role of the extract is to ensure the cellular homeostasis of reactive oxygen species (ROS), which is essential for plants. ROS could act as signaling molecules that regulate the growth and development of plants and acclimatize them to the presence of stressors, causing harmful effects on cellular metabolism when their concentration increases under stress [4].

3.3. Optimization of T. erecta Extract Concentration as Prebiotic

According to previous research [15,47,48,49], species of the Bacillus genus have the ability to promote increased productivity by colonizing the agricultural plant roots. Bacillus sp. secrete several metabolites that trigger plant growth and prevent pathogen infection. The beneficial effects of Bacillus sp. on crop improvement are: an increase in the length and biomass of the shoot, roots, and leaves [50]; solubilization of the P and fixing of the N in the soil and an increase in their transport to roots [51]; synthesis of plant growth [47], secretion of ACC deaminase to inhibit plant senescence [52]; an increased plant water-use efficiency [53]; an enhanced fruits and grains yield [54]; an effect against plant pathogens [55], etc. From the qualitative assay, both the extract and the solvent showed antibacterial activity against all PGPR with diameters between 9–14 mm (Table 4). The results are comparable to those obtained by Latifian et al. [56] but on methanolic extract obtained from buds and leaves.
Through this study, therefore, we aimed to highlight the concentrations which improved cell proliferation for PGPR and the selection of variants that could generate a synergistic antifungal activity. According to Figure 2, it can be seen that the minimum inhibitory concentration (MIC) was at 12.5% for all bacteria. In the case of 6.25% (102.60 ± 6.70%), 3.125% (106.89 ± 6.70%), and 1.5625% (108.33 ± 6.70%) extract concentrations, a significant increase in cell viability can be observed compared to the solvent (p < 0.0001, p < 0.05) (Figure 2a). The significant differences compared to the positive control (untreated cell) which stimulate cell proliferation are seen in the extract concentrations of 3.125% (p < 0.05) and 1.5625% (p < 0.05). For B. licheniformis (Figure 2b), a significant increase in cell viability was observed concerning 1.56% of the solvent (114.59 ± 1.26%, p < 0.0001) and for positive control (p < 0.0001). For B. amyloliquefaciens (Figure 2c), it can be seen that the extract significantly inhibits the microbial viability to the solvent and the positive control, respectively.
Another important aspect is the enhancement of the bacterial cell’s ability to adhere to the root surface. The evaluation of microbial adhesion aims at the ability of microorganisms to form adhesins, to attach and colonize the root surface [57]. Thus, the evaluation of the modulation ability of Bacillus sp. attachment to abiotic surface in the presence of subinhibitory extract concentrations is highlighted in Table 5. It can be concluded that the interaction between B. licheniformis cells and T. erecta extract has a synergistic effect of stimulating the adhesion of microbial cells to inert (abiotic) substrate [58]. According to Townsley et al. [58], the Bacillus sp. biofilms’ formation on the root’s surface is important because it provides protection against pathogens. It has been previously reported that in the case of B. subtilis, cyclic di-AMP acts as an extracellular signal that influences the biofilm formation and the microbial cell attachment to the biotic surface [59]. In the case of B. amyloliquefaciens, no significant differences were observed compared to the untreated control (positive control), while for B. licheniformis, all variants significantly increased microbial adhesion (p < 0.01 and p < 0.0001).

3.4. T. erecta Extract as a Phytostimulant

In this study, the effect of the T. erecta extract was compared with a solvent used in similar concentrations to show the influence on germination capacity. Thus, the seeds adsorb extracts and use nutrients for various metabolic processes, such as cell division, elongation, and differentiation [60]. The RSG% results were as follows: 90–100% for the extract and 60–100% for the solvent on both types of seeds (Figure 3). In the case of cucumber seeds, the treatment with the extract significantly improved the RSG% compared to the solvent at concentrations of 0.1% (p < 0.05), 0.5% (p < 0.01), 1% (p < 0.001), and 1.5% (p < 0.01) (Figure 3a); for radish seeds, the relative seed germination rate was better than the control containing only distilled water (p < 0.05 for 0.1% and 0.5% T. erecta extract) and significantly improved the RSG% compared to the solvent used at concentrations of 1% and 1.5% (p < 0.01) (Figure 3b). It can be seen that the germination rate is strongly influenced by the concentration of extract antioxidants.
The range of RRE (%) results for the two crop seeds treated with extract and solvent was as follows: radish: 240.44–112.02% for extract and 82.32–49.17% for solvent; cucumber: 96.77–76.81% for extract and 60.20–82.94% for solvent (Figure 3). In addition, the RRE% values were found to be less than 100% in cucumber seedlings, and for the solvent the values decrease with increasing concentration (Figure 3c). The RRE values (%) for all radish seeds proved to be significantly different (p < 0.001), the optimal in vitro stimulation concentration being 0.1% (240.44 ± 0.18%), followed by 1% (172.40 ± 3.48%) and 1.5% (162.84 ± 6.18%), respectively (Figure 3d). Related to control (distillated water), the relative root elongation for R. sativus was significantly enhanced (p < 0.0001) for all concentrations except 0.5% extract.
In general, the germination index (GI) is based on the quantification of phytotoxicity using crop seedlings, RRE, and RSG in the analysis phase. A GI level lower than 50% indicates phytotoxicity, 50%–80% indicates moderate phytotoxicity, 80%–100% non-phytotoxic, and >100% indicates a stimulating effect [61]. In the present analysis, both cultures (Figure 3e,f) showed GI > 50%, indicating that both extract and solvent concentrations are non-phytotoxic or have moderate phytotoxicity. Phytotoxicity (<50%) was observed in the solvent treatment (control) for both seeds at concentrations greater than 1% (Figure 3e,f), while no phytotoxicity was observed for the extract (values greater than 80%) in the case of cucumber seeds, and for radishes, all extract concentrations stimulate germination (p < 0.0001). Related to control (distillated water), the germination index for R. sativus was significantly enhanced, and p < 0.0001 for all concentrations except 0.5% extract (p < 0.001). Thus, the highest GI value of the extract was recorded for the 0.1% concentration (Figure S1).
Bioactivity and the role of polyphenols in defending against biotic and abiotic stress are commonly attributed to antioxidant activity, supported by major in vitro data [62]. The antioxidant activity of phenolic acids is correlated to the main number of hydroxyl groups, and hydroxycinnamic acids are often more efficient antioxidants than hydroxybenzoic acids [63]. Other biological roles of polyphenols in stress responses, tested in vivo, also depend on experimental conditions such as the duration of exposure to stress, the chosen plant model, the stage of plant growth, and the method of analysis of metabolites. Thus, it is difficult to conclude which polyphenolic structures are involved in specific protection mechanisms [62].
Santos et al. [64] showed that the 20% concentration of hydroalcoholic extract of T. erecta obtained from the vegetative parts induces phytotoxicity for Lactuca sativa seeds. At 5% and 10%, the differences were not significant compared to the control. In order to highlight the stimulation effect, we started with a concentration of 1.5%.

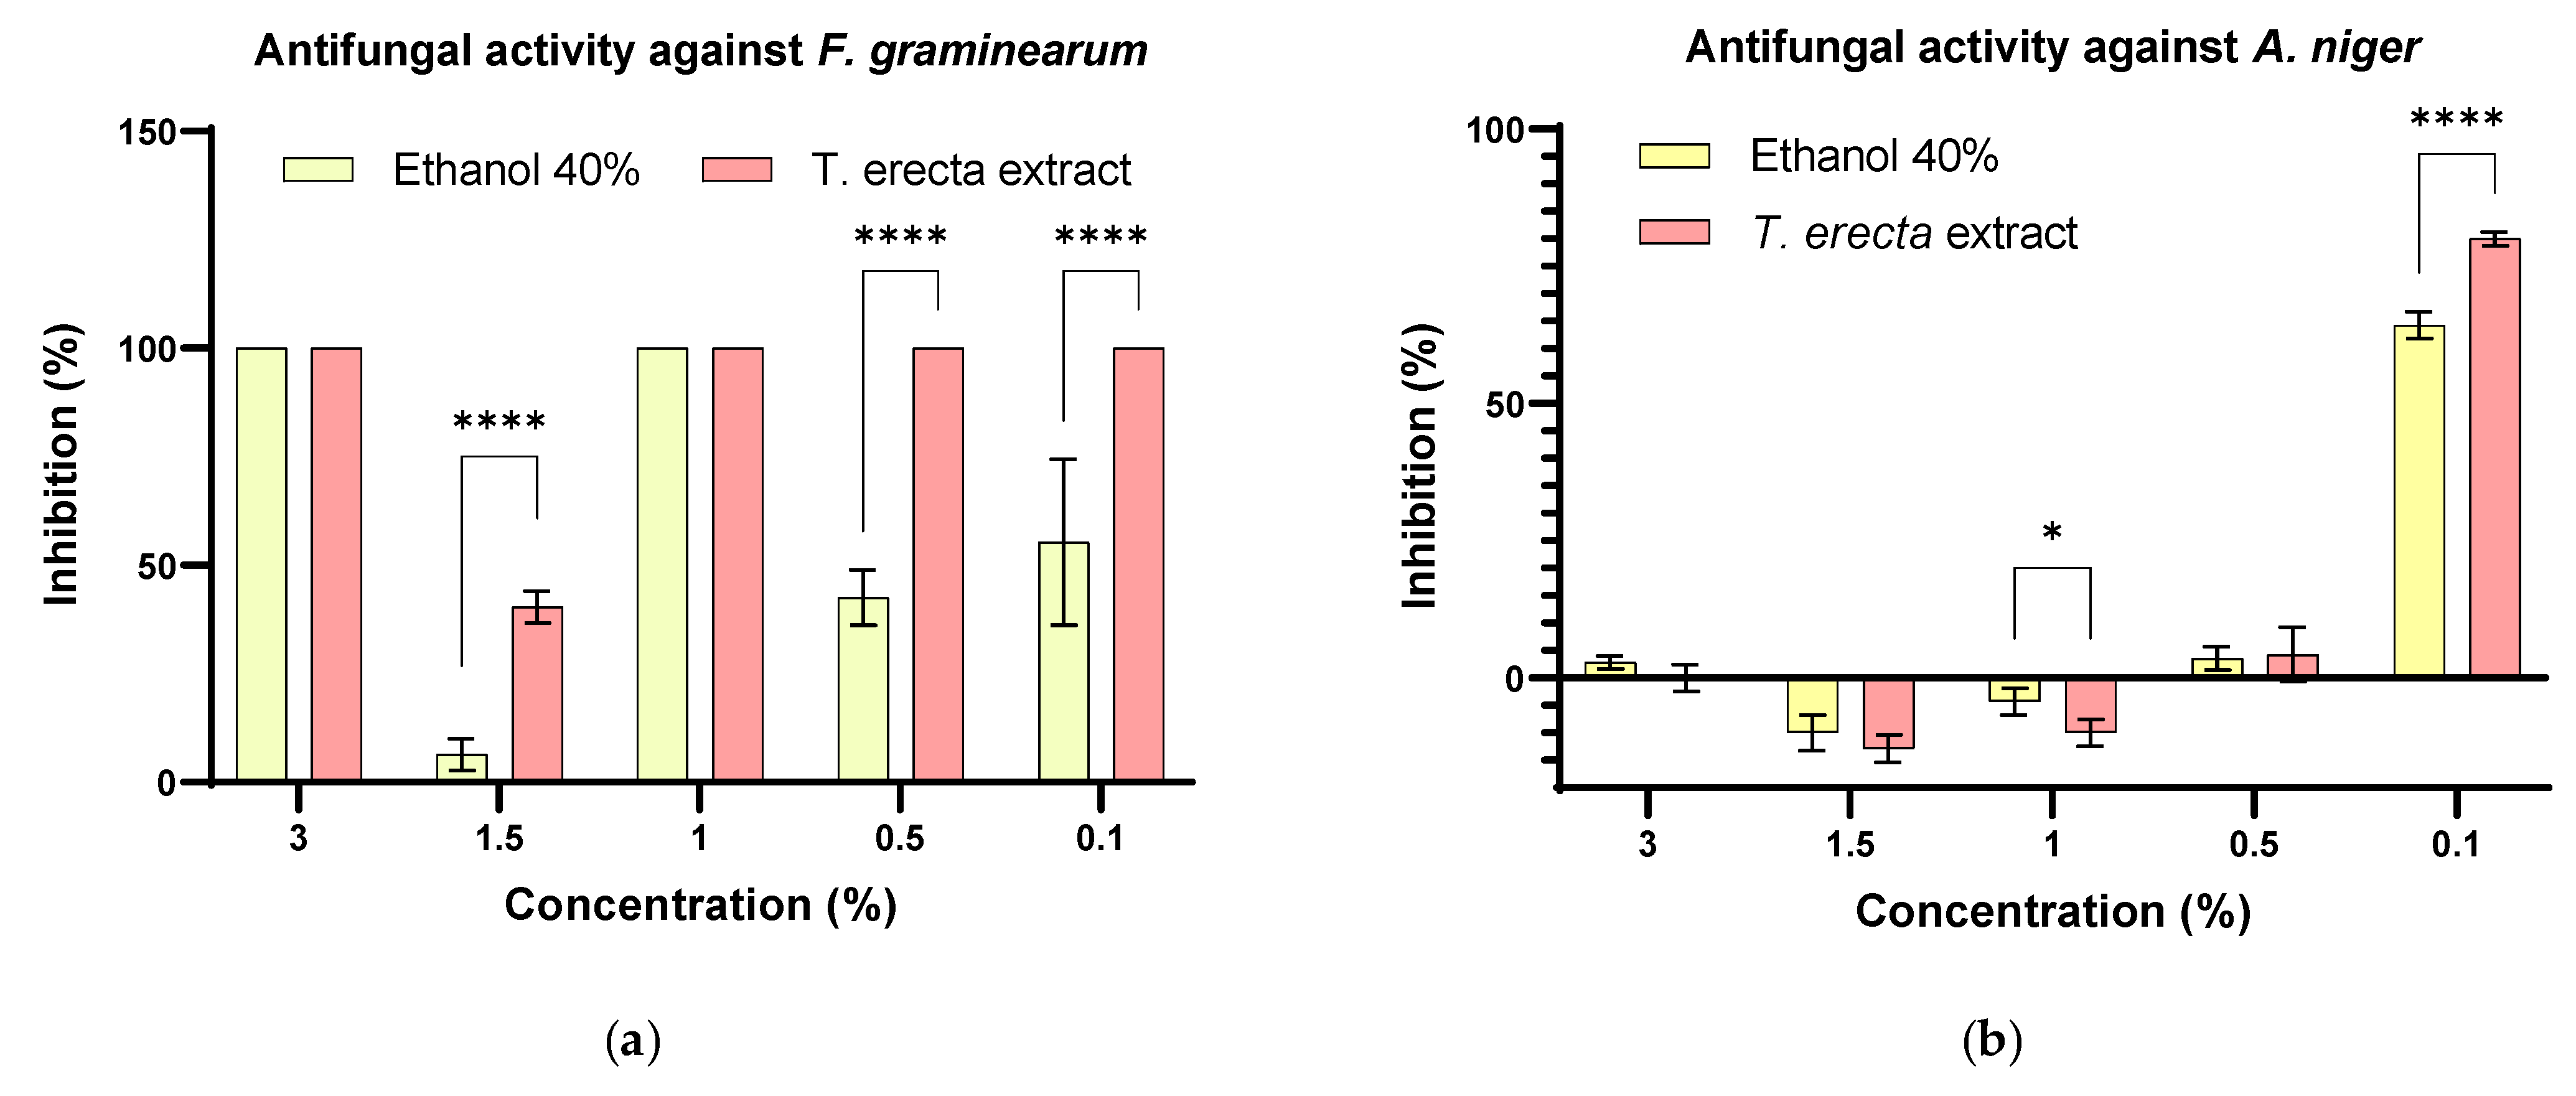
3.5. Antifungal Activity of T. erecta Extract

The use of a biological control is considered an environmentally friendly alternative for the treatment of phytopathogens [65]. According to Janakiev et al. [66], phytopathogenic fungi reduce up to 80% of crop yield, as well as the quality of the crops; the pathogens responsible are fungi from the Fusarium and Monilinia genus [66]. The Fusarium genus representatives are the responsible agents that generate the most significant diseases of the culture worldwide, causing production losses up to 50%. They synthesize mycotoxins, and have the ability to easily accumulate in the cereals and fruit tissues and severely affect human and animal biological systems [67]. Moreover, brown rot caused by Monilinia sp. is one of the most economically significant diseases that affect both fruits and vegetables and leads to yield losses both in pre-harvest and post-harvest stages [68] A. niger causes the “black mold” disease and it is the most common contaminant of stored food, being responsible for postharvest decay of fresh fruits, vegetables, grains, and crops [69]. This fungus is well known as a biodeteriogen and also causes economic losses due to the spoilage of fruit and vegetable products. A. niger has also been reported as a postharvest pathogen of citrus, onion, cherry, maize, and peanuts. This pathogen is recognized as a mycotoxin producers (fumonisins and ochratoxin A) [70,71]. Therefore, through the present study, it can be seen that the T. erecta extract had antifungal activity at concentrations of 5% and 1% on the F. graminearum by reducing mycelium growth diameter (Figure 4a) and M. laxa (Figure 4b). The results obtained were compared with the similar concentration of the solvent and showed a reduction in the mycelium growth capacity, depending on the concentrations used, except for M. laxa (Table 5). There was a decrease in mycelial diameter as the concentration increased. In fact, in the presence of T. erecta extract, the highest percentage of inhibition was obtained at the highest concentration used: 5% with a percentage of 54.17 ± 5.89% (compared to the solvent, p < 0.05) for F. graminearum, while for M. laxa, it was observed that the lowest concentration of extract inhibited the colony’s diameter by approximately 52.29 ± 2.60% (compared to the solvent, p < 0.05%). In the case of the A. niger strain, a significant increase of the mycelium was observed compared to the solvent (p < 0.05) (Table 6, Figure 4c).
For the quantitative evaluation of the antifungal activity, five extract concentrations were tested for each strain and the inhibitory cell proliferation fungi was evaluated. It was observed that in the case of M. laxa (Figure 5a), the reduction of cell viability was not significant, relative to the solvent (p > 0.5), for all concentrations, but significant to positive control (p < 0.0001). In the case of F. graminearum, the lower cell viability was for 3% extract (6.67 ± 2.31%), the significant difference was done by compared to the solvent activity (p < 0.0001). Related to positive control (untreated strain), the effect against F. graminearum was significantly different for all extract concentrations (p < 0.0001). (Figure 5b). For A. niger, an increase in cell proliferation was observed compared to the solvent control, which means that the phenolic compounds protect the cells by reducing the intracellular oxidative stress generated by the solvent (Figure 5c) for the first extract concentrations (3%–95.95 ± 1.91%, p < 0.05; 1.5%–93.24 ± 1.91%, p < 0.01), the differences being significant compared to the similar solvent concentration. Related to positive control (untreated strain), the effect against A. niger was not significant (p > 0.05).
To evaluate the antifungal effect, 10 µL were spotted on the PDA medium, using the same concentrations as the first quantitative method. It was observed that the M. laxa strain was completely inhibited, while for F. graminearum, the inhibition was almost complete for 0.5% (p < 0.0001) and 0.1% (p < 0.0001) extract with significant differences compared to the solvent control (Figure 6a). In the case of A. niger, the highest inhibition was observed for 0.1% (p < 0.0001) (Figure 6b).
According to Larmour and Marchant [72], sporulation levels are generally low and conidia production was progressively inhibited by the presence of a high concentration of carbohydrates, but at lower concentrations, carbohydrates could increase the nutritional value of the culture medium. Excess carbohydrates inhibit both the production and the appearance of conidia and, therefore, probably pre-prolongs the development time of the conidia. Thus, the inhibition of the mycelium formation after a 10-day incubation in the presence of the extract, in the case of M. laxa, may be due to the concentration of carbohydrates, implicitly leading to a degree of reduction of conidia production. The structures of the phenolic compounds are allowed to diffuse through the microbial membrane and can penetrate into the cell, where they can interfere in the metabolic pathways by interfering with the synthesis of ergosterol, glucan, chitin, proteins, and glucosamine in fungi. For instance, some of the phenolic compounds like phenolic acids, flavonoids, catechins, chalcones, stilbenes, and tannins being lipophilic are able to inhibit the activity of ABC transporters [73,74]. Polyphenols can also bind directly with the proteins, hence hindering the tertiary structure of proteins and thus effectively inhibiting the function of ABC transporters that makes the fungal pathogens resistant to the drug administered [75]. The effect of various phenols such as salicylic acid, phenol, and benzoic acid have been studied against Fusarium sp., and it was found that the phenol and salicylic acids were effective at higher concentrations only, while benzoic acid was effective at low concentrations as well [76].
It is well known that phytopathogens do not interact with the plant as individual entities, but rather at the population level, in which microorganisms are engaged in complex behavior in the response to the biotic surface, other organisms, and the extracellular environment. Thus, in general, plant pathogens form biofilm. Important signs of a biofilm-based infection are increased resistance to conventional biocides and their ability to evade host defenses. The most devastating and universal diseases of crops are caused by pathogenic fungi that parasitize plants. In this context, a few options are available for fungal pathogen control, and chemical fungicides continue to dominate the marketplace [16].
In this context, we sought to assess the influence of T. erecta extract and solvent on the adhesion ability to the inert substrate of the pathogenic fungal strains investigated.
From Figure 7, it can be observed that microbial adhesion was significantly inhibited for the F. graminearum strain at concentrations of 3% (18.06 ± 0.42%, p < 0.0001) and 1.5% (17.52 ± 0.55%, p < 0.0001) (Figure 7b) and for A. niger at 3% (57.84 ± 0.69%, p < 0.001), 1.5% (55.88 ± 0.35%, p < 0.001), and 1% (70.10 ± 2.08%, p < 0.001) T. erecta extract (Figure 7c). In the case of M. laxa, an adherence inhibition was observed for the positive control (untreated strain), but with a significant increase in the presence of the T. erecta extract, probably due to the reduced sugar content and the antioxidant effect of the polyphenols (Figure 7a). Basically, this extract has the ability to inhibit the formation of microbial biofilms for Fusarium and Aspergillus strains.
A recent study [77] highlighted the fact that A. niger is sensitive to the hydroalcoholic and hexane extract obtained from the T. erecta flowers and leaves, but there are no data on the solvent activity.

3.6. Synergistic Antifungal Activity between Bacillus sp. and T. erecta Extract

Phyllosphere microorganisms play an important role in a plant’s health, such as nutrient acquisition, plant growth hormone production, abiotic stress tolerance, and biocontrol abilities of plant pathogens. Biocontrol as a strategy for the suppression of phytopathogens by beneficial microorganisms of the phyllosphere is based on many mechanisms, such as competition, antibiosis, and induction of the host’s immune response [66].
The variants of Bacillus sp. strains and different concentrations of the T. erecta extract were selected so that the extract leads to the increase of cell proliferation, depending on the results obtained in the evaluation of MIC. The three selected variants led to a good inhibition of mycelium growth (28.33 ± 2.08 mm and 20.67 ± 1.53 mm in the case of B. subtilis strain supplemented with 3% and 1.5% T. erecta extract) on the F. graminearum strain. In time for M. laxa, the inhibition was complete for both extract and solvent (Table 7). The synergistic effect between the extract and the microbial suspension of B. subtilis was weaker for A. niger. In the case of B. licheniformis, the antagonistic effect was observed only for F. graminearum strain (p < 0.01).
Several mechanisms have been proposed to explain the inhibition of phytopathogenic fungi by Bacillus sp., including antibiotic production, hydrolytic enzyme synthesis, nutrient competition, surfactant production, or a combination of these mechanisms in synergy. Siderophore production is a major mechanism involved in biocontrol by many PGPR groups, including Bacillus sp. Chelation of iron in soil causes a decrease in this nutrient in the environment. Fungal growth will either be restricted or eliminated [78]. The two Bacillus strains have a variable antagonistic activity against the phytopathogenic fungi, being especially active on the F. graminearum strain.
This extract, therefore, has the ability to increase cell proliferation for bacteria in the PGPR group and at the same time, to inhibit the development of mycelium for phytopathogenic fungi.
According to Ali et al. [79], the metabolites responsible for the antifungal effect of Bacillus sp. are fengycins, iturins, and surfactins. Several studies have shown that B. licheniformis shows antifungal activity against Magnaporthe grisea, Curvularia lunata, Rhizoctonia bataticola, Monilinia fructicola, Sclerotinia sclerotiorum, Botrytis cinerea, Aspergillus niger, and Fusarium oxysporum [80,81,82]. From the results obtained in this study, it can be seen that B. licheniformis did not show antifungal activity for A. niger. In the case of the B. subtilis strain, it was highlighted the antifungal effect against Alternaria alternata, Alternaria solani, Alternaria tenuissima, Fusarium avenaceum, Fusarium solani, Fusarium oxysporum, Fusarium sp., Fusarium redolens, Colletotrichum coccodes, Doratomyces sp. [82,83].

4. Conclusions

The hydroalcoholic extract obtained from T. erecta flowers showed specific bands of phenolic and carbohydrate compounds, these being quantified by spectrophotometric methods. A total of 24 phenolic compounds were quantified. The main ones were quercetin, syringic acid, ellagic acid, and 3,4-dihydroxybenzoic acid, known for their cytoprotective effects due to their antioxidant properties. By evaluating the antimicrobial activity on the strains from the PGPR group, the optimal extract concentration was selected for which the increase of cell viability was observed related to the control strain. T. erecta extract stimulated the germination of small seeds such as radishes, while for larger seeds, such as cucumbers, there are no significant differences compared to the solvent control. The antifungal activity was evaluated both qualitatively and quantitatively on solid and liquid medium, noting that the studied extract reduced the development of the mycelium growth, especially for the F. graminearum and M. laxa strains. The fungal pathogenicity is given, especially by their character, to form biofilms on the surface of plant tissues. The application of this extract could prevent both the adhesion of phytopathogenic fungi and the stimulation of rhizobacteria for their naturally antifungal activity. PGPR strains treated with T. erecta extract may be applied as bio-control agents due to their antagonistic activity against plant pathogenic fungi, in particular, F. graminearum. These findings could also be applied in agricultural biotechnology for developing antifungal bacteria supplemented with T. erecta extract as potent biopesticides to control fungal plant pathogens and stimulate vegetable seedling. Therefore, the obtained results lead us to evaluate the compatibility and stability for efficient colonization and constant performance of the resuspended inoculum in the standardized T. erecta extract in a lyophilized form under field conditions.

Supplementary Materials

The following supporting information can be downloaded at: www.mdpi.com/article/10.3390/horticulturae8090779/s1, Figure S1: Radishes seedlings growth germination bioassay using 0.1% extract (a), solvent (b) and control (c).; Table S1: Main bands in the ATR-FTIR spectra of T. erecta flowers and their assignments. Peak positions are expressed in cm−1.

Author Contributions

Conceptualization, I.C.M. and A.P.; methodology, I.C.M., M.A. and A.P.; software, I.C.M.; validation, M.A., A.P., I.C.M., M.C. and E.I.G.; formal analysis, A.P., I.C.M., M.C., M.A. and E.I.G.; investigation, A.P., I.C.M., M.C., L.P. and E.I.G.; resources, S.C. and M.A.; data curation, A.P., L.P., I.C.M., M.C. and E.I.G.; writing—original draft preparation, I.C.M.; writing—review and editing, A.P. and I.C.M.; visualization, L.P. and S.C.; supervision, S.C.; project administration, A.P.; funding acquisition, A.P. All authors have read and agreed to the published version of the manuscript.

Funding

The research was funded by The University of Agronomical Sciences and Veterinary Medicine of Bucharest—Doctoral School Engineering and Management of Vegetal and Animal Resources, contract no. 1451/02.10.2019.

Institutional Review Board Statement

Not applicable.

Informed Consent Statement

Not applicable.

Data Availability Statement

Not applicable.

Acknowledgments

This research was funded by The University of Agronomical Sciences and Veterinary Medicine of Bucharest—Doctoral School Engineering and Management of Vegetal and Animal Resources. Doctoral university contract no. 1451/02.10.2019.

Conflicts of Interest

The authors declare no conflict of interest.

References

  1. Verma, S.; Pandey, A.K. Enhancement of Plant Nutrient Uptake by Bacterial Biostimulants. In New and Future Developments in Microbial Biotechnology and Bioengineering; Elsevier: Amsterdam, The Netherlands, 2022; pp. 435–456. [Google Scholar]
  2. Yakhin, O.I.; Lubyanov, A.A.; Yakhin, I.A.; Brown, P.H. Biostimulants in Plant Science: A Global Perspective. Front. Plant Sci. 2017, 7, 2049. [Google Scholar] [CrossRef]
  3. Rouphael, Y.; Colla, G. Toward a Sustainable Agriculture Through Plant Biostimulants: From Experimental Data to Practical Applications. Agronomy 2020, 10, 1461. [Google Scholar] [CrossRef]
  4. Hasanuzzaman, M.; Parvin, K.; Bardhan, K.; Nahar, K.; Anee, T.I.; Masud, A.A.C.; Fotopoulos, V. Biostimulants for the Regulation of Reactive Oxygen Species Metabolism in Plants under Abiotic Stress. Cells 2021, 10, 2537. [Google Scholar] [CrossRef]
  5. Shahrajabian, M.H.; Chaski, C.; Polyzos, N.; Petropoulos, S.A. Biostimulants Application: A Low Input Cropping Management Tool for Sustainable Farming of Vegetables. Biomolecules 2021, 11, 698. [Google Scholar] [CrossRef]
  6. Ghimire, B.K.; Ghimire, B.; Yu, C.Y.; Chung, I.-M. Allelopathic and Autotoxic Effects of Medicago Sativa—Derived Allelochemicals. Plants 2019, 8, 233. [Google Scholar] [CrossRef]
  7. Mihalache, G.; Mihasan, M.; Zamfirache, M.M.; Stefan, M.; Raus, L. Phosphate Solubilizing Bacteria from Runner Bean Rhizosphere and Their Mechanism of Action. Rom. Biotechnol. Lett. 2018, 23, 13853–13861. [Google Scholar]
  8. Drobek, M.; Frąc, M.; Cybulska, J. Plant Biostimulants: Importance of the Quality and Yield of Horticultural Crops and the Improvement of Plant Tolerance to Abiotic Stress—A Review. Agronomy 2019, 9, 335. [Google Scholar] [CrossRef]
  9. Alexander, S.A.; Waldenmaier, C.M. Suppression of Pratylenchus Penetrans Populations in Potato and Tomato Using African Marigolds. J. Nematol. 2002, 34, 130–134. [Google Scholar]
  10. Natarajan, N.; Cork, A.; Boomathi, N.; Pandi, R.; Velavan, S.; Dhakshnamoorthy, G. Cold Aqueous Extracts of African Marigold, Tagetes erecta for Control Tomato Root Knot Nematode, Meloidogyne Incognita. Crop Prot. 2006, 25, 1210–1213. [Google Scholar] [CrossRef]
  11. Benítez-García, I.; Vanegas-Espinoza, P.E.; Meléndez-Martínez, A.J.; Heredia, F.J.; Paredes-López, O.; del Villar-Martínez, A.A. Callus Culture Development of Two Varieties of Tagetes erecta and Carotenoid Production. Electron. J. Biotechnol. 2014, 17, 107–113. [Google Scholar] [CrossRef]
  12. Rajkumari, J.; Choudhury, Y.; Bhattacharjee, K.; Pandey, P. Rhizodegradation of Pyrene by a Non-Pathogenic Klebsiella Pneumoniae Isolate Applied with Tagetes erecta L. and Changes in the Rhizobacterial Community. Front. Microbiol. 2021, 12, 593023. [Google Scholar] [CrossRef]
  13. Ullah, Z.; Abbas, S.J.; Naeem, N.; Lutfullah, G.; Malik, T.; Khan, M.A.U.; Khan, I. Effect of Indolebutyric Acid (IBA) and Naphthaleneacetic Acid (NAA) Plant Growth Regulaters on Mari Gold (Tagetes erecta L.). Afr. J. Agric. Res. 2013, 8, 4015–4019. [Google Scholar]
  14. Niu, Y.; Han, S.; Wu, Z.; Pan, C.; Wang, M.; Tang, Y.; Zhang, Q.; Tan, G.; Han, B. A Push–Pull Strategy for Controlling the Tea Green Leafhopper (Empoasca flavescens F.) Using Semiochemicals from Tagetes erecta and Flemingia macrophylla. Pest Manag. Sci. 2022, 78, 2161–2172. [Google Scholar] [CrossRef] [PubMed]
  15. Hashem, A.; Tabassum, B.; Fathi Abd_Allah, E. Bacillus subtilis: A Plant-Growth Promoting Rhizobacterium that also Impacts Biotic Stress. Saudi J. Biol. Sci. 2019, 26, 1291–1297. [Google Scholar] [CrossRef]
  16. Villa, F.; Cappitelli, F.; Cortesi, P.; Kunova, A. Fungal Biofilms: Targets for the Development of Novel Strategies in Plant Disease Management. Front. Microbiol. 2017, 8, 654. [Google Scholar] [CrossRef]
  17. Marinas, I.C.; Oprea, E.; Geana, E.-I.; Tutunaru, O.; Pircalabioru, G.G.; Zgura, I.; Chifiriuc, M.C. Valorization of Gleditsia triacanthos Invasive Plant Cellulose Microfibers and Phenolic Compounds for Obtaining Multi-Functional Wound Dressings with Antimicrobial and Antioxidant Properties. Int. J. Mol. Sci. 2020, 22, 33. [Google Scholar] [CrossRef]
  18. Formagio, A.S.N.; Kassuya, C.A.L.; Neto, F.F.; Volobuff, C.R.F.; Iriguchi, E.K.K.; Vieira, M.D.C.; Foglio, M.A. The Flavonoid Content and Antiproliferative, Hypoglycaemic, Anti-Inflammatory and Free Radical Scavenging Activities of Annona dioica St. Hill. BMC Complement. Altern. Med. 2013, 13, 14. [Google Scholar] [CrossRef]
  19. Khatri, D.; Chhetri, S.B.B. Reducing Sugar, Total Phenolic Content, and Antioxidant Potential of Nepalese Plants. BioMed Res. Int. 2020, 2020, 7296859. [Google Scholar] [CrossRef]
  20. Corbu, V.M.; Gheorghe, I.; Marinaș, I.C.; Geană, E.I.; Moza, M.I.; Csutak, O.; Chifiriuc, M.C. Demonstration of Allium sativum Extract Inhibitory Effect on Biodeteriogenic Microbial Strain Growth, Biofilm Development, and Enzymatic and Organic Acid Production. Molecules 2021, 26, 7195. [Google Scholar] [CrossRef]
  21. Madhu, G.; Bose, V.C.; Aiswaryaraj, A.S.; Maniammal, K.; Biju, V. Defect Dependent Antioxidant Activity of Nanostructured Nickel Oxide Synthesized through a Novel Chemical Method. Colloids Surf. A: Physicochem. Eng. Asp. 2013, 429, 44–50. [Google Scholar] [CrossRef]
  22. Çelik, S.E.; Özyürek, M.; Güçlü, K.; Apak, R. Determination of Antioxidants by a Novel On-Line HPLC-Cupric Reducing Antioxidant Capacity (CUPRAC) Assay with Post-Column Detection. Anal. Chim. Acta 2010, 674, 79–88. [Google Scholar] [CrossRef] [PubMed]
  23. Mitelut, A.C.; Popa, E.M. Seed Germination Bioassay for Toxicity Evaluation of Different Composting Biodegradable Materials. Rom. Biotechnol. Lett. 2011, 16, 121–129. [Google Scholar]
  24. Milon, A.R.; Chang, S.W.; Ravindran, B. Biochar Amended Compost Maturity Evaluation Using Commercial Vegetable Crops Seedlings through Phytotoxicity Germination Bioassay. J. King Saud Univ. -Sci. 2022, 34, 101770. [Google Scholar] [CrossRef]
  25. Fan, B.; Blom, J.; Klenk, H.-P.; Borriss, R. Bacillus amyloliquefaciens, Bacillus velezensis, and Bacillus siamensis Form an “Operational Group B. amyloliquefaciens” within the B. subtilis Species Complex. Front. Microbiol. 2017, 8, 22. [Google Scholar] [CrossRef] [Green Version]
  26. Gutiérrez-Mañero, F.J.; Ramos-Solano, B.; Probanza, A.; Mehouachi, J.; Tadeo, F.R.; Talon, M. The Plant-Growth-Promoting Rhizobacteria Bacillus pumilus and Bacillus licheniformis Produce High Amounts of Physiologically Active Gibberellins. Physiol. Plant. 2001, 111, 206–211. [Google Scholar] [CrossRef]
  27. Marinas, I.C.; Oprea, E.; Buleandra, M.; Badea, I.A.; Tihauan, B.M.; Marutescu, L.; Angheloiu, M.; Matei, E.; Chifiriuc, M.C. Chemical Composition, Antipathogenic and Cytotoxic Activity of the Essential Oil Extracted from Amorpha fruticosa Fruits. Molecules 2021, 26, 3146. [Google Scholar] [CrossRef]
  28. Javed, S.; Shoaib, A.; Mahmood, Z.; Mushtaq, S.; Iftikhar, S. Analysis of Phytochemical Constituents of Eucalyptus citriodora L. Responsible for Antifungal Activity against Post-Harvest Fungi. Nat. Prod. Res. 2012, 26, 1732–1736. [Google Scholar] [CrossRef]
  29. Lee, H.-A.; Kim, J.-H. Isolation of Bacillus amyloliquefaciens Strains with Antifungal Activities from Meju. Prev. Nutr. Food Sci. 2012, 17, 64–70. [Google Scholar] [CrossRef]
  30. Kaboré, D.; Gagnon, M.; Roy, D.; Sawadogo-Lingani, H.; Diawara, B.; LaPointe, G. Rapid Screening of Starter Cultures for Maari Based on Antifungal Properties. Microbiol. Res. 2018, 207, 66–74. [Google Scholar] [CrossRef]
  31. Nogales-Bueno, J.; Baca-Bocanegra, B.; Rooney, A.; Hernández-Hierro, J.M.; Byrne, H.J.; Heredia, F.J. Study of Phenolic Extractability in Grape Seeds by Means of ATR-FTIR and Raman Spectroscopy. Food Chem. 2017, 232, 602–609. [Google Scholar] [CrossRef]
  32. Guillén, M.D.; Cabo, N. Infrared Spectroscopy in the Study of Edible Oils and Fats. J. Sci. Food Agric. 1997, 75, 1–11. [Google Scholar] [CrossRef]
  33. Reddy, J.P.; Rhim, J.-W. Extraction and Characterization of Cellulose Microfibers from Agricultural Wastes of Onion and Garlic. J. Nat. Fibers 2018, 15, 465–473. [Google Scholar] [CrossRef]
  34. Barth, A. Infrared Spectroscopy of Proteins. Biochim. Et Biophys. Acta (BBA)-Bioenerg. 2007, 1767, 1073–1101. [Google Scholar] [CrossRef]
  35. Cozzolino, R.; Malorni, L.; Martignetti, A.; Picariello, G.; Siano, F.; Forte, G.; de Giulio, B. Comparative Analysis of Volatile Profiles and Phenolic Compounds of Four Southern Italian Onion (Allium cepa L.) Landraces. J. Food Compos. Anal. 2021, 101, 103990. [Google Scholar] [CrossRef]
  36. Fernández, K.; Agosin, E. Quantitative Analysis of Red Wine Tannins Using Fourier-Transform Mid-Infrared Spectrometry. J. Agric. Food Chem. 2007, 55, 7294–7300. [Google Scholar] [CrossRef] [PubMed]
  37. Oh, S.Y.; Yoo, D.I.; Shin, Y.; Kim, H.C.; Kim, H.Y.; Chung, Y.S.; Park, W.H.; Youk, J.H. Crystalline Structure Analysis of Cellulose Treated with Sodium Hydroxide and Carbon Dioxide by Means of X-Ray Diffraction and FTIR Spectroscopy. Carbohydr. Res. 2005, 340, 2376–2391. [Google Scholar] [CrossRef] [PubMed]
  38. Xu, H.; Wang, W.; Jiang, J.; Yuan, F.; Gao, Y. Subcritical Water Extraction and Antioxidant Activity Evaluation with On-Line HPLC-ABTS·+ Assay of Phenolic Compounds from Marigold (Tagetes erecta L.) Flower Residues. J. Food Sci. Technol. 2014, 52, 3803–3811. [Google Scholar] [CrossRef] [PubMed]
  39. Gong, Y.; Liu, X.; He, W.-H.; Xu, H.-G.; Yuan, F.; Gao, Y.-X. Investigation into the Antioxidant Activity and Chemical Composition of Alcoholic Extracts from Defatted Marigold (Tagetes erecta L.) Residue. Fitoterapia 2012, 83, 481–489. [Google Scholar] [CrossRef]
  40. de Matos, Y.M.L.S.; Vasconcelos, D.L.M.; Barreto, A.C.H.; Rocha, J.E.; de Araújo-Neto, J.B.; Campina, F.F.; da Silva, M.M.C.; al Yafawi, T.T.; Sobral-Souza, C.E.; Pinheiro, J.C.A.; et al. Protection against the Phytotoxic Effect of Mercury Chloride by Catechin and Quercetin. J. Chem. 2022, 2022, 3770935. [Google Scholar] [CrossRef]
  41. El-Soud, W.A.; Hegab, M.M.; AbdElgawad, H.; Zinta, G.; Asard, H. Ability of Ellagic Acid to Alleviate Osmotic Stress on Chickpea Seedlings. Plant Physiol. Biochem. 2013, 71, 173–183. [Google Scholar] [CrossRef]
  42. Parađiković, N.; Teklić, T.; Zeljković, S.; Lisjak, M.; Špoljarević, M. Biostimulants Research in Some Horticultural Plant Species—A Review. Food Energy Secur. 2019, 8, e00162. [Google Scholar] [CrossRef]
  43. Khan, W.; Rayirath, U.P.; Subramanian, S.; Jithesh, M.N.; Rayorath, P.; Hodges, D.M.; Critchley, A.T.; Craigie, J.S.; Norrie, J.; Prithiviraj, B. Seaweed Extracts as Biostimulants of Plant Growth and Development. J. Plant Growth Regul. 2009, 28, 386–399. [Google Scholar] [CrossRef]
  44. Apak, R.; Güçlü, K.; Demirata, B.; Özyürek, M.; Çelik, S.; Bektaşoğlu, B.; Berker, K.; Özyurt, D. Comparative Evaluation of Various Total Antioxidant Capacity Assays Applied to Phenolic Compounds with the CUPRAC Assay. Molecules 2007, 12, 1496–1547. [Google Scholar] [CrossRef]
  45. Arnao, M.B. Some Methodological Problems in the Determination of Antioxidant Activity Using Chromogen Radicals: A Practical Case. Trends Food Sci. Technol. 2000, 11, 419–421. [Google Scholar] [CrossRef]
  46. Prior, R.L.; Wu, X.; Schaich, K. Standardized Methods for the Determination of Antioxidant Capacity and Phenolics in Foods and Dietary Supplements. J. Agric. Food Chem. 2005, 53, 4290–4302. [Google Scholar] [CrossRef]
  47. Radhakrishnan, R.; Hashem, A.; Abd_Allah, E.F. Bacillus: A Biological Tool for Crop Improvement through Bio-Molecular Changes in Adverse Environments. Front. Physiol. 2017, 8, 667. [Google Scholar] [CrossRef]
  48. Qiao, J.; Yu, X.; Liang, X.; Liu, Y.; Borriss, R.; Liu, Y. Addition of Plant-Growth-Promoting Bacillus subtilis PTS-394 on Tomato Rhizosphere Has No Durable Impact on Composition of Root Microbiome. BMC Microbiol. 2017, 17, 131. [Google Scholar] [CrossRef]
  49. Dame, Z.T.; Rahman, M.; Islam, T. Bacilli as Sources of Agrobiotechnology: Recent Advances and Future Directions. Green Chem. Lett. Rev. 2021, 14, 246–271. [Google Scholar] [CrossRef]
  50. Barnawal, D.; Maji, D.; Bharti, N.; Chanotiya, C.S.; Kalra, A. ACC Deaminase-Containing Bacillus subtilis Reduces Stress Ethylene-Induced Damage and Improves Mycorrhizal Colonization and Rhizobial Nodulation in Trigonella foenum-graecum Under Drought Stress. J. Plant Growth Regul. 2013, 32, 809–822. [Google Scholar] [CrossRef]
  51. Kuan, K.B.; Othman, R.; Abdul Rahim, K.; Shamsuddin, Z.H. Plant Growth-Promoting Rhizobacteria Inoculation to Enhance Vegetative Growth, Nitrogen Fixation and Nitrogen Remobilisation of Maize under Greenhouse Conditions. PLoS ONE 2016, 11, e0152478. [Google Scholar] [CrossRef] [PubMed]
  52. Xu, M.; Sheng, J.; Chen, L.; Men, Y.; Gan, L.; Guo, S.; Shen, L. Bacterial Community Compositions of Tomato (Lycopersicum esculentum Mill.) Seeds and Plant Growth Promoting Activity of ACC Deaminase Producing Bacillus subtilis (HYT-12-1) on Tomato Seedlings. World J. Microbiol. Biotechnol. 2014, 30, 835–845. [Google Scholar] [CrossRef] [PubMed]
  53. Akhtar, S.S.; Amby, D.B.; Hegelund, J.N.; Fimognari, L.; Großkinsky, D.K.; Westergaard, J.C.; Müller, R.; Moelbak, L.; Liu, F.; Roitsch, T. Bacillus licheniformis FMCH001 Increases Water Use Efficiency via Growth Stimulation in Both Normal and Drought Conditions. Front. Plant Sci. 2020, 11, 297. [Google Scholar] [CrossRef]
  54. Dursyn, A.; Ekinci, M.; Donmez, M.F. Effects of Foliar Application of Plant Growth Promoting Bacterium on Chemical Contents, Yield and Growth of Tomato (Lycopersicon esculentum L.) and Cucumber (Cucumis sativus L.). Pak. J. Bot. 2010, 42, 3349–3356. [Google Scholar]
  55. Chowdhury, S.P.; Hartmann, A.; Gao, X.; Borriss, R. Biocontrol Mechanism by Root-Associated Bacillus amyloliquefaciens FZB42 —A Review. Front. Microbiol. 2015, 6, 780. [Google Scholar] [CrossRef]
  56. Latifian, E.; Otur, C.; Abanoz-Secgin, B.; Arslanoglu, S.F.; Kurt-Kizildogan, A. Evaluation of Antimicrobial Activity in Extracts of Different Parts of Three Tagetes Species. Turk. J. Field Crops 2021, 26, 117–122. [Google Scholar] [CrossRef]
  57. Huang, R.; Feng, H.; Xu, Z.; Zhang, N.; Liu, Y.; Shao, J.; Shen, Q.; Zhang, R. Identification of Adhesins in Plant Beneficial Rhizobacteria Bacillus velezensis SQR9 and Their Effect on Root Colonization. Mol. Plant-Microbe Interact. 2022, 35, 64–72. [Google Scholar] [CrossRef]
  58. Townsley, L.; Yannarell, S.M.; Huynh, T.N.; Woodward, J.J.; Shank, E.A. Cyclic Di-AMP Acts as an Extracellular Signal That Impacts Bacillus subtilis Biofilm Formation and Plant Attachment. MBio 2018, 9, e00341-18. [Google Scholar] [CrossRef]
  59. Li, F.; Tang, M.; Tang, X.; Sun, W.; Gong, J.; Yi, Y. Bacillus subtilisArabidopsis thaliana: A Model Interaction System for Studying the Role of Volatile Organic Compounds in the Interchange between Plants and Bacteria. Botany 2019, 97, 661–669. [Google Scholar] [CrossRef]
  60. Cho, W.-M.; Ravindran, B.; Kim, J.K.; Jeong, K.-H.; Lee, D.J.; Choi, D.-Y. Nutrient Status and Phytotoxicity Analysis of Goat Manure Discharged from Farms in South Korea. Environ. Technol. 2017, 38, 1191–1199. [Google Scholar] [CrossRef]
  61. Ravindran, B.; Mupambwa, H.A.; Silwana, S.; Mnkeni, P.N.S. Assessment of Nutrient Quality, Heavy Metals and Phytotoxic Properties of Chicken Manure on Selected Commercial Vegetable Crops. Heliyon 2017, 3, e00493. [Google Scholar] [CrossRef]
  62. Šamec, D.; Karalija, E.; Šola, I.; Vujčić Bok, V.; Salopek-Sondi, B. The Role of Polyphenols in Abiotic Stress Response: The Influence of Molecular Structure. Plants 2021, 10, 118. [Google Scholar] [CrossRef]
  63. Rice-Evans, C.A.; Miller, N.J.; Paganga, G. Structure-Antioxidant Activity Relationships of Flavonoids and Phenolic Acids. Free. Radic. Biol. Med. 1996, 20, 933–956. [Google Scholar] [CrossRef]
  64. Santos, P.C.; Santos, V.H.M.; Mecina, G.F.; Andrade, A.R.; Fegueiredo, P.A.; Moraes, V.M.O.; Silva, L.P.; Silva, R.M.G. Phytotoxicity of Tagetes erecta L. and Tagetes patula L. on Plant Germination and Growth. South Afr. J. Bot. 2015, 100, 114–121. [Google Scholar] [CrossRef]
  65. Hulot, J.F.; Hiller, N. Exploring the Benefits of Biocontrol for Sustainable Agriculture—A Literature Review on Biocontrol in Light of the European Green Deal; Institute for European Environmental Policy: Brussels, Belgium, 2021. [Google Scholar]
  66. Janakiev, T.; Berić, T.; Stević, T.; Stanković, S.; Bačić, J.; Majstorović, H.; Fira, D.; Dimkić, I. The Microbiome of the ‘Williams’ Pear Variety Grown in the Organic Orchard and Antifungal Activity by the Autochthonous Bacterial and Yeast Isolates. Microorganisms 2022, 10, 1282. [Google Scholar] [CrossRef]
  67. Perincherry, L.; Lalak-Kańczugowska, J.; Stępień, Ł. Fusarium-Produced Mycotoxins in Plant-Pathogen Interactions. Toxins 2019, 11, 664. [Google Scholar] [CrossRef] [Green Version]
  68. Zhu, X.-Q.; Niu, C.-W.; Chen, X.-Y.; Guo, L.-Y. Monilinia Species Associated with Brown Rot of Cultivated Apple and Pear Fruit in China. Plant Dis. 2016, 100, 2240–2250. [Google Scholar] [CrossRef]
  69. Gautam, A.K.; Sharma, S.; Avasthi, S.; Bhadauria, R. Diversity, Pathogenicity and Toxicology of A. niger: An Important Spoilage Fungi. Res. J. Microbiol. 2011, 6, 270–280. [Google Scholar] [CrossRef]
  70. Akhtar, N.; Shoaib, A.; Munir, S.; Ali, A.; Khurshid, S. Isolation, Identification and Enzyme Production Profile of A. niger. J. Anim. Plant Sci. 2014, 24, 1438–1443. [Google Scholar]
  71. Soares, C.; Calado, T.; Venâncio, A. Mycotoxin Production by Aspergillus niger Aggregate Strains Isolated from Harvested Maize in Three Portuguese Regions. Rev. Iberoam. De Micol. 2013, 30, 9–13. [Google Scholar] [CrossRef]
  72. Larmour, R.; Marchant, R. The Induction of Conidiation in Fusarium culmorum Grown in Continuous Culture. J. Gen. Microbiol. 1977, 99, 49–58. [Google Scholar] [CrossRef]
  73. You, M.; Wickramaratne, D.B.M.; Silva, G.L.; Chai, H.; Chagwedera, T.E.; Farnsworth, N.R.; Cordell, G.A.; Kinghorn, A.D.; Pezzuto, J.M. (-)-Roemerine, an Aporphine Alkaloid from Annona Senegalensis That Reverses the Multidrug-Resistance Phenotype with Cultured Cells. J. Nat. Prod. 1995, 58, 598–604. [Google Scholar] [CrossRef]
  74. Meschini, S.; Marra, M.; Calcabrini, A.; Federici, E.; Galeffi, C.; Arancia, G. Voacamine, a Bisindolic Alkaloid from Peschiera Fuchsiaefolia, Enhances the Cytotoxic Effect of Doxorubicin on Multidrug-Resistant Tumor Cells. Int. J. Oncol. 2003, 23, 1505–1513. [Google Scholar] [CrossRef] [PubMed]
  75. Ansari, M.A.; Anurag, A.; Fatima, Z.; Hameed, S. Natural Phenolic Compounds, A Potential Antifungal Agent; Mendez-Vilas, A., Ed.; Microbial pathogens and strategies for combating them: Science, technology and education; Formatex Research Center: Badajoz, Spain, 2013; pp. 1189–1195. [Google Scholar]
  76. Shukla, A.; Dwivedi, S.K. Antifungal Approach of Phenolic Compounds against Fusarium udum and Fusarium oxysporum f.sp.ciceri. Afr. J. Agric. Res. 2013, 8, 596–600. [Google Scholar]
  77. Patel, R.; Pandya, J.; Rajpurohit, N.; Chaudhary, R.; Bhalakiya, H. Antifungal Activity of Tithonia rotundifolia Blake and Tagetes erecta L against Aspergillus niger. Int. J. Creat. Res. Thoughts 2020, 8, 4193–4198. [Google Scholar]
  78. Nabti, E.H.; Mokrane, N.; Ghoul, M.; Manyani, H.; Dary, M.; Megias, M.G. Isolation and Characterization of Two Halophilic Bacillus (B. licheniformis and Bacillus sp.) with Antifungal Activity. J. Ecol. Health Environ. 2013, 1, 13–17. [Google Scholar] [CrossRef]
  79. Ali, S.; Hameed, S.; Shahid, M.; Iqbal, M.; Lazarovits, G.; Imran, A. Functional Characterization of Potential PGPR Exhibiting Broad-Spectrum Antifungal Activity. Microbiol. Res. 2020, 232, 126389. [Google Scholar] [CrossRef]
  80. Tendulkar, S.R.; Saikumari, Y.K.; Patel, V.; Raghotama, S.; Munshi, T.K.; Balaram, P.; Chattoo, B.B. Isolation, Purification and Characterization of an Antifungal Molecule Produced by Bacillus licheniformis BC98, and Its Effect on Phytopathogen Magnaporthe Grisea. J. Appl. Microbiol. 2007, 103, 2331–2339. [Google Scholar] [CrossRef] [PubMed]
  81. Ji, Z.-L.; Peng, S.; Chen, L.-L.; Liu, Y.; Yan, C.; Zhu, F. Identification and Characterization of a Serine Protease from Bacillus licheniformis W10: A Potential Antifungal Agent. Int. J. Biol. Macromol. 2020, 145, 594–603. [Google Scholar] [CrossRef]
  82. Mardanova, A.M.; Fanisovna Hadieva, G.; Tafkilevich Lutfullin, M.; Valer’evna Khilyas, I.; Farvazovna Minnullina, L.; Gadelevna Gilyazeva, A.; Mikhailovna Bogomolnaya, L.; Rashidovna Sharipova, M. Bacillus subtilis Strains with Antifungal Activity against the Phytopathogenic Fungi. Agric. Sci. 2017, 8, 1–20. [Google Scholar] [CrossRef]
  83. Cui, T.-B.; Chai, H.-Y.; Jiang, L.-X. Isolation and Partial Characterization of an Antifungal Protein Produced by Bacillus licheniformis BS-3. Molecules 2012, 17, 7336–7347. [Google Scholar] [CrossRef]
Figure 1. ATR-FTIR spectra of T. erecta flowers and plant materials.
Horticulturae 08 00779 g001
Figure 2. Quantitative antimicrobial activity against planktonic microbial strains belonging to Bacillus genus of T. erecta extract and the corresponding solvent concentration (* p < 0.05, ** p < 0.01, **** p < 0.0001, two-way ANOVA): (a) B. subtilis, (b) B. licheniformis, (c) B. amyloliquefaciens.
Horticulturae 08 00779 g002aHorticulturae 08 00779 g002b
Figure 3. Relative seed germination (%) ((a)—C. sativus, (b)—R. sativus), relative root elongation (%) ((c)—C. sativus, (d)—R. sativus) and germination index (%) ((e)—C. sativus, (f)—R. sativus) for T. erecta extract and the corresponding concentration of solvent treatments (* p < 0.05, ** p < 0.01, *** p < 0.001, **** p < 0.0001).
Horticulturae 08 00779 g003aHorticulturae 08 00779 g003b
Figure 4. Antifungal activity for different concentrations of T. erecta extract (1–0.5%, 2–1%, 3–5%, 4–0%) and positive control against F. graminearum (a), M. laxa (b), and A. niger (c) strains.
Horticulturae 08 00779 g004
Figure 5. Quantitative antifungal activity of T. erecta extract compared to that obtained for solvent on the M. laxa (a), F. graminearum (b), and A. niger (c) strains, where * p < 0.05, ** p < 0.01, *** p < 0.001, **** p < 0.0001.
Horticulturae 08 00779 g005
Figure 6. Evaluation of the antifungal effect by inhibiting mycelium growth (%) on PDA medium related to the positive control (untreated strain), both for the extract and solvent used at similar concentrations (* p < 0.05, **** p < 0.0001) on (a) F. graminearum and (b) A. niger strains.
Horticulturae 08 00779 g006
Figure 7. MBEC (%) values for T. erecta extract and the corresponding solvent concentration against phytopathogenic fungal strains: M. laxa (a), F. graminearum (b) and A. niger (c) (* p < 0.05, *** p < 0.001, **** p < 0.0001).
Horticulturae 08 00779 g007
Table 1. The quantification of main class compounds obtained by spectrophotometric methods.
ParameterT. erecta Extract Values
TPC (mg GAE/mL)15.12 ± 0.27
TFC (mg QE/mL)2.01 ± 0.03
% Flavonoids from total phenols13.29
Reducing sugar content (mg D-glucose/mL)5.97 ± 0.48
Table 2. Identification and quantitative data regarding the bioactive compounds in the T. erecta extract in negative ionization mode.
NoCompoundRetention Time
[min]
Accurate Mass [M-H]−Mass FragmentsConcentration
(mg/L)
1Gallic acid1.99169.0131125.02316.16
23,4-Dihydroxybenzoic acid4.18153.0181109.028120.50
34-Hydroxybenzoic acid6.47137.023193.03313.13
4Chlorogenic acid7.91353.0876191.055311.85
5Syringic acid8.24197.0447182.0212, 166.9976, 153.0547, 138.0311, 123.007530.71
6Caffeic acid8.01179.0340135.0441.27
7Vanillic acid8.44167.0339152.0105, 124.0154, 111.0075, 139.0025, 95.01250.75
8p-Coumaric acid8.69163.0389119.04890.50
9t-Ferulic acid8.90193.0498178.0262, 134.03610.51
10Ellagic acid9.69300.9988300.999026.80
11Cinnamic acid10.34147.0441119.0489, 103.03870.36
12Abscisic acid10.04263.1288179.9803, 191.94540.03
Ʃ phenolic acids (mg/L) 102.57
13Quercetin10.69301.0354151.0226, 178.9977, 121.0282, 107.0125383.74
14Hesperidin9.29609.1824377.08760.14
15Rutin8.99609.14643345.06140.07
16Kaempferol11.04285.0403151.0389, 117.01800.31
17Isorhamnetin11.78315.0512300.02766.49
18Apigenin11.80269.0454117.0333, 151.0027, 107.01260.21
19Pinocembrin12.56255.0660213.0551, 151.0026, 107.01250.11
20Chrysin13.40253.0503143.0491, 145.0284, 107.0125, 209.0603, 63.0226, 65.00190.14
21Galangin13.62269.0454169.0650, 143.04910.09
22Myricetin8.70317.0304178.9986, 164.9263, 151.0036, 137.0244, 107.012513.64
Ʃ flavonoids (mg/L) 404.97
23t-Resveratrol9.55227.0707185.0813, 143.03370.04
24Caffeic Acid Phenethyl Ester13.18283.0975174.9551, 112.98430.07
Table 3. Antioxidant activity evaluation by different methods (mean ± SD).
ParameterAntioxidant Activity
CUPRAC (mM Trolox/mL)65.81 ± 1.51
FRAP (mM Trolox/mL)22.36 ± 1.47
TEAC (mM Trolox/mL)20.64 ± 0.93
DPPH (mM Trolox/mL)19.37 ± 0.09
Table 4. Comparative qualitative evaluation of antibacterial activity between T. erecta extract and the solvent (40% ethanol) against PGPR strains.
PGPR StrainsSampleDiameter Zone
Inhibition (mm)
B. subtilisT, erecta extract13.33 ± 1.15
Ethanol 40%10.33 ± 1.15
p-value<0.01
B. ligheniformisT, erecta extract12.33 ± 1.15
Ethanol 40%9.66 ± 0.58
p-value<0.05
B. amyloliquefaciensT, erecta extract13.33 ± 1.15
Ethanol 40%9.33 ± 1.15
p-value<0.01
Table 5. Antibiofilm activity of T. erecta extract and the corresponding solvent concentration against Bacillus sp.
Concentrations (%)SampleB. subtilisB. licheniformisB. amyloliquefaciens
MBEC (%)MBEC (%)MBEC (%)
MIC/2 (6.25%)T, erecta extract47.22 ± 5.97157.98 ± 24.5482.93 ± 13.07
Ethanol 40%133.5 ± 34.2964.89 ± 1.04132.51 ± 2.93
p-value (vs. ethanol 40%)
p-value (vs. positive control)
<0.001
<0.01
<0.0001
<0.01
<0.05
>0.05
MIC/4 (3.125%)T, erecta extract32.04 ± 0.48220.54 ± 7.69137.67 ± 20.52
Ethanol 40%135.0 ± 31.11216.24 ± 14.28105.18 ± 6.01
p-value (vs. ethanol 40%)
p-value (vs. positive control)
<0.0001
<0.001
>0.05
<0.0001
>0.05
>0.05
MIC/8 (1.56%)T, erecta extract97.67 ± 17.55224.67 ± 38.57138.15 ± 21.98
Ethanol 40%268.0 ± 44.55106.13 ± 10.91132.98 ± 3.58
p-value (vs. ethanol 40%)
p-value (vs. positive control)
<0.0001
>0.05
<0.0001
<0.0001
>0.05
>0.05
Table 6. Comparative qualitative evaluation of antifungal activity for different concentrations of T. erecta extract (0.5%, 1%, 5%) and similar solvent concentrations (40% ethanol) against phytopathogenic strains.
Concentrations (%)SampleF. graminearumM. laxaA. niger
Inhibition (%)Inhibition (%)Inhibition (%)
0.5%T, erecta extract27.08 ± 2.9552.29 ± 2.6021.18 ± 0.00
Ethanol 40%0.00 ± 0.0032.11 ± 2.6026.47 ± 4.16
p-value (vs. ethanol 40%)<0.01<0.05>0.05
p-value (vs. positive control)<0.0001<0.0001<0.0001
1%T, erecta extract37.50 ± 5.8938.53 ± 3.8919.71 ± 0.42
Ethanol 40%0.00 ± 0.0010.09 ± 2.6026.76 ± 0.42
p-value (vs. ethanol 40%)<0.05<0.05<0.01
p-value (vs. positive control)<0.0001<0.0001<0.0001
5%T, erecta extract54.17 ± 5.8913.76 ± 2.6023.82 ± 0.42
Ethanol 40%19.71 ± 0.4211.01 ± 1.3034.18 ± 1.66
p-value (vs. ethanol 40%)<0.05>0.05<0.05
p-value (vs. positive control)<0.0001<0.0001<0.0001
Table 7. The diameters of the inhibition zone to phytopathogens’ mycelial growth given by Bacillus licheniformis or Bacillus subtilis in the presence of different T. erecta extract concentrations.
SampleConcentrations (%)F. graminearumM. laxaA. niger
Diameter Zone Inhibition (mm)Diameter Zone Inhibition (mm)Diameter Zone Inhibition (mm)
B. licheniformis strainT, erecta extract1.5%15.67 ± 0.58Complete inhibitionResistant
Ethanol 40%11.33 ± 1.15Complete inhibitionResistant
p-value<0.01--
T, erecta extract3%28.33 ± 2.08Complete inhibition17.67 ± 1.53
B. subtilis strainEthanol 40%20.67 ± 1.53Complete inhibition14.33 ± 0.58
p-value<0.01-<0.05
T, erecta extract1.5%26.67 ± 1.53Complete inhibition19.67 ± 1.53
Ethanol 40%25.33 ± 1.53Complete inhibition17.33 ± 2.52
p-value>0.05->0.05
Publisher’s Note: MDPI stays neutral with regard to jurisdictional claims in published maps and institutional affiliations.

