1. Introduction
Affordable housing is a policy-based residence guided by the government for moderate and low-income citizens [
1]; it is a concept with Chinese characteristics and is usually termed communal housing in other countries [
2,
3]. In 2021, China completed the building of a moderately prosperous society, so solving the conflict between housing demand and supply in the urban area through affordable housing projects is quite crucial for improving social equity [
4,
5]. Because site selection of affordable housing is fundamental to planning construction and is decisive for the maximum benefit of affordable housing policy, the optimum site selection of affordable housing is academically significant [
6,
7].
In the 1970s, the United States presented a strategy to select housing sites for communal and private residences simultaneously, and the high dependence on public transportation for moderate and low-income citizens facilitated the development of the TOD mode [
8]. In the study of site selection of communal housing in Singapore, Belinda Yuen (2007) favored the concept of TOD [
9]. B.M.T.LIN (2009) considered that site selection of communal housing in Boston should be adaptive to the mixture dwelling of people from various classes and be affiliated with some commercial housing. Generally, related studies of site selection of communal housing have been scarce in recent years [
10].
Although affordable housing policy has been studied at a later time in China, site selection is already involved [
11]. According to significance, variance, hierarchy, and operation of economical housing, and the benefits to the economy, society, and environment, Zhang Aihua (2009) constructed a comprehensive assessment model with multiple factors; this model includes five aspects as land economic benefit, transportation accessibility, environment performance, public service facility completeness, and infrastructure completeness [
12]. Wang Dongning (2012) empirically assessed the metropolitan area of Nanjing on GIS technological platform by a qualitative and quantitative assessment model of land-use potential with the assistance of indicator weights analysis through AHP [
13]. Chen Chingfu (2011) used AHP to evaluate nearest-neighbor queries efficiently and help support a decision in the site section [
14] Li Baiyun (2016) constructed a binomial logistic regression model based on site selection satisfaction of affordable housing to generate that tenants’ satisfaction was positively correlated to existing the housing area, regional school education environment, and shopping environment, and was negatively correlated to maximum commuting distance [
15]. Qing (2018) used GIS to analyze the distribution characteristics of Longhua District in Shenzhen, assessed existing housing adaptability according to influential elements’ POI, and finally decided on site selection according to the assessment result [
16].
Generally, methods of site analysis mainly include the logistic model, GIS, and AHP, which are commonly adopted to discuss the practical case of affordable housing [
17,
18]. According to the real living demand of residents, public service facilities and employment are relatively crucial factors to site selection [
19,
20]. In quantitative site selection comprehensive assessment, distance to transportation facility and spatial agglomeration are mainly considered in quantitative analysis, while political factors are mainly considered in qualitative one [
21,
22].
The aim of this study is to focus on the modeling of affordable housing’s site selection assessment and expects to offer reasonable guidance to site selection according to the result of the model operation. Furthermore, this study takes Jiangbei new district as an example to verify the universal significance of the model.
2. Study Area
The direct management area under Jiangbei New District of Nanjing, Jiangsu Province, locates on the north bank of the Yangtze River, covering 386.25 km
2. In 2017, Nanjing municipal government adjusted the spatial structure of Jiangbei New District into 3 areas a direct management area, a communal construction area, and a coordinative area [
23,
24]. The direct management area locates in the center of Jiangbei downtown, consisting of Taishang, Dingshan, Yanjiang, Pancheng, Getang, Dachang, and Changlu Neighborhood [
25] (
Figure 1). According to the data from the management commission and real estate platform of Jiangbei New District, the direct management area owns 55 affordable housing projects, 28 of which have been built up with a floor area of 4.2238 million km
2, and 27 of which are under construction with a floor area of 5.4794 million km
2. Exceptionally, most land use in Changlu Neighborhood is industrial, so no affordable housing has been built there.
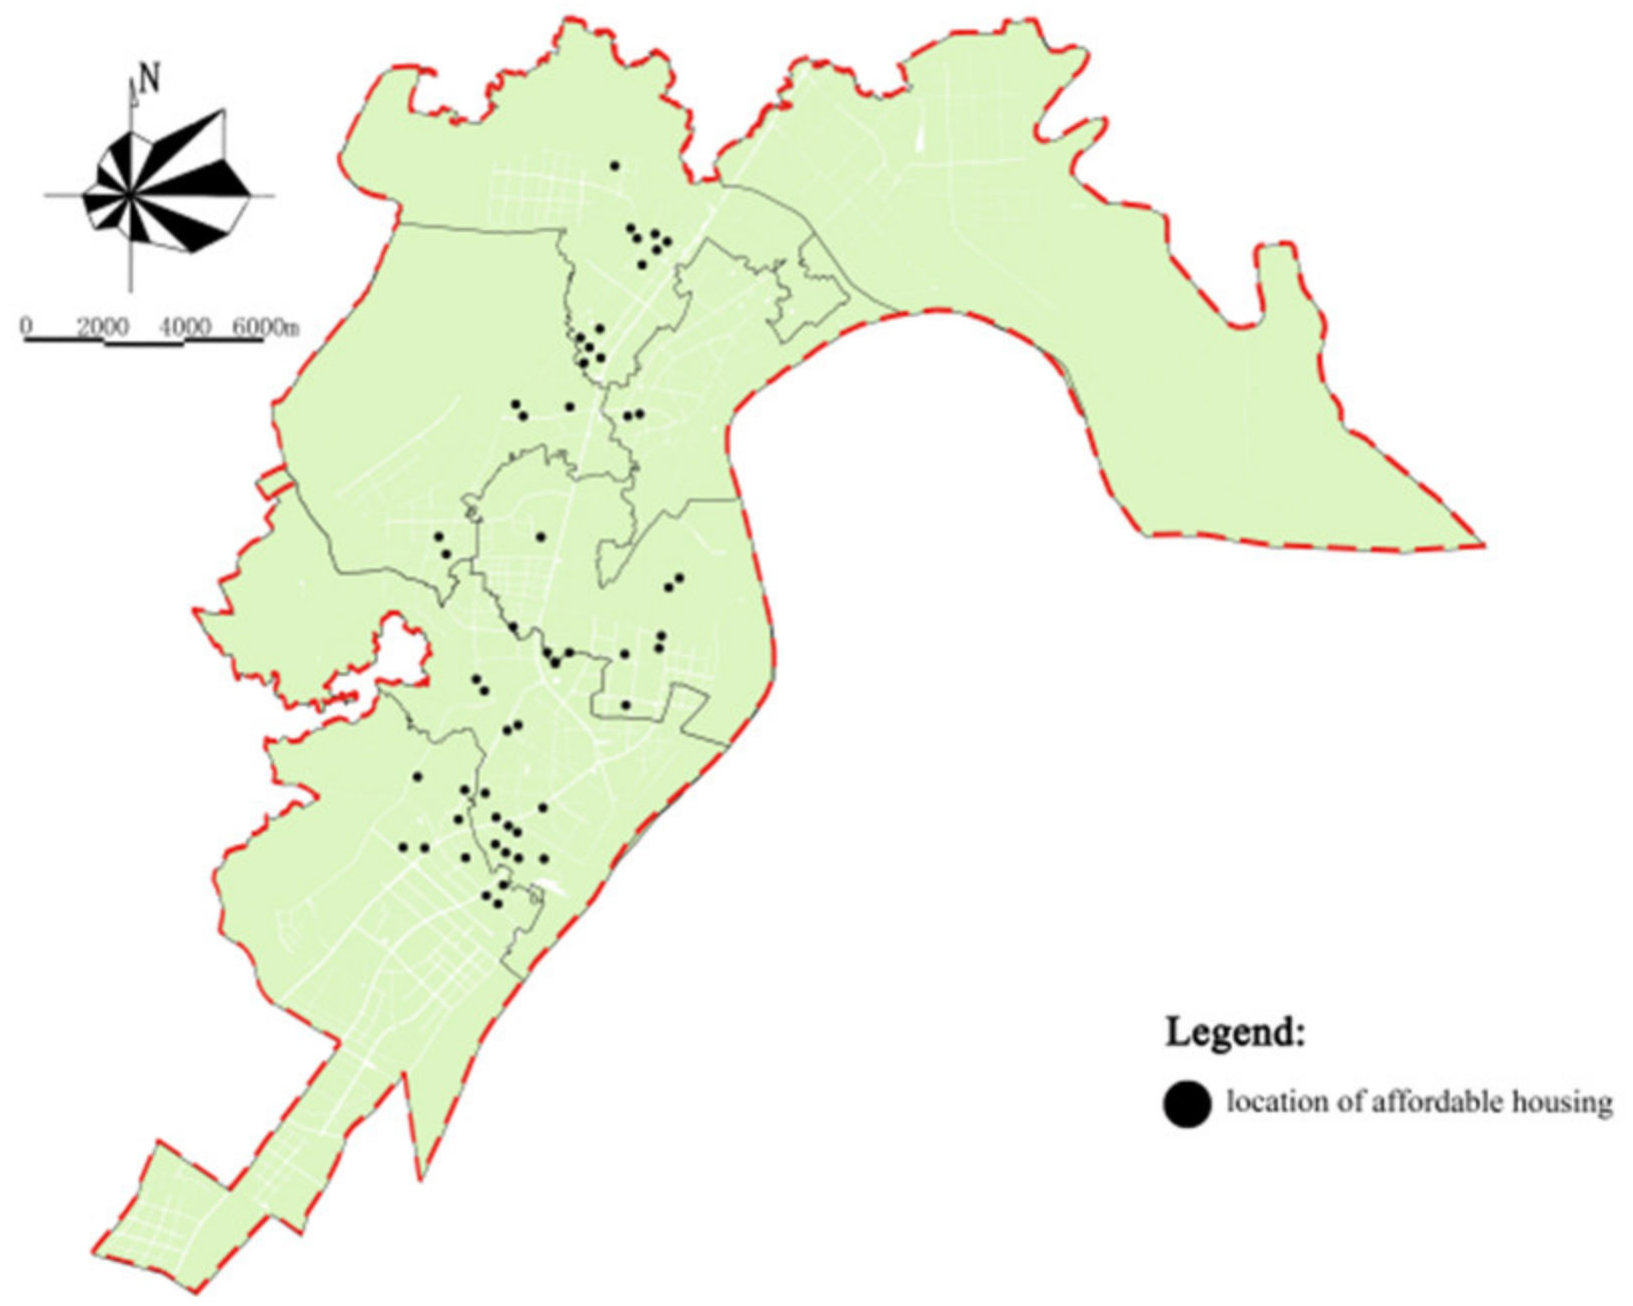
Currently, 3 characteristics of affordable housing in the direct management area are shown. At first, affordable housings are distant from the bustling downtown center and distributed along the streetside (
Figure 2). 46.9% of interviewed residents take 30 to 60 min to go to work, and 16% of them take over 60 min for commuting, which expresses the isolation between affordable housing and the workplace. In addition, spatial agglomeration also exists in affordable housing in the direct management area, especially in some neighborhoods with clustering development and also in some newly planned communities of independent projects. Furthermore, affiliated public service facilities are not well-considerate. Only some medium and small-sized super-markets surrounding affordable housing can satisfy residents’ daily needs, while the lack of commercial centers and farmer’s markets still makes inconvenience. Some affordable housing is even located beyond the proper service radius of middle and primary school, which means some residents cannot equally share the convenient resource of education.
3. Model Construction
3.1. Modeling of Site Selection Assessment and Analysis Methods
3.1.1. Overview of the Site-Selection-Assessment Modeling
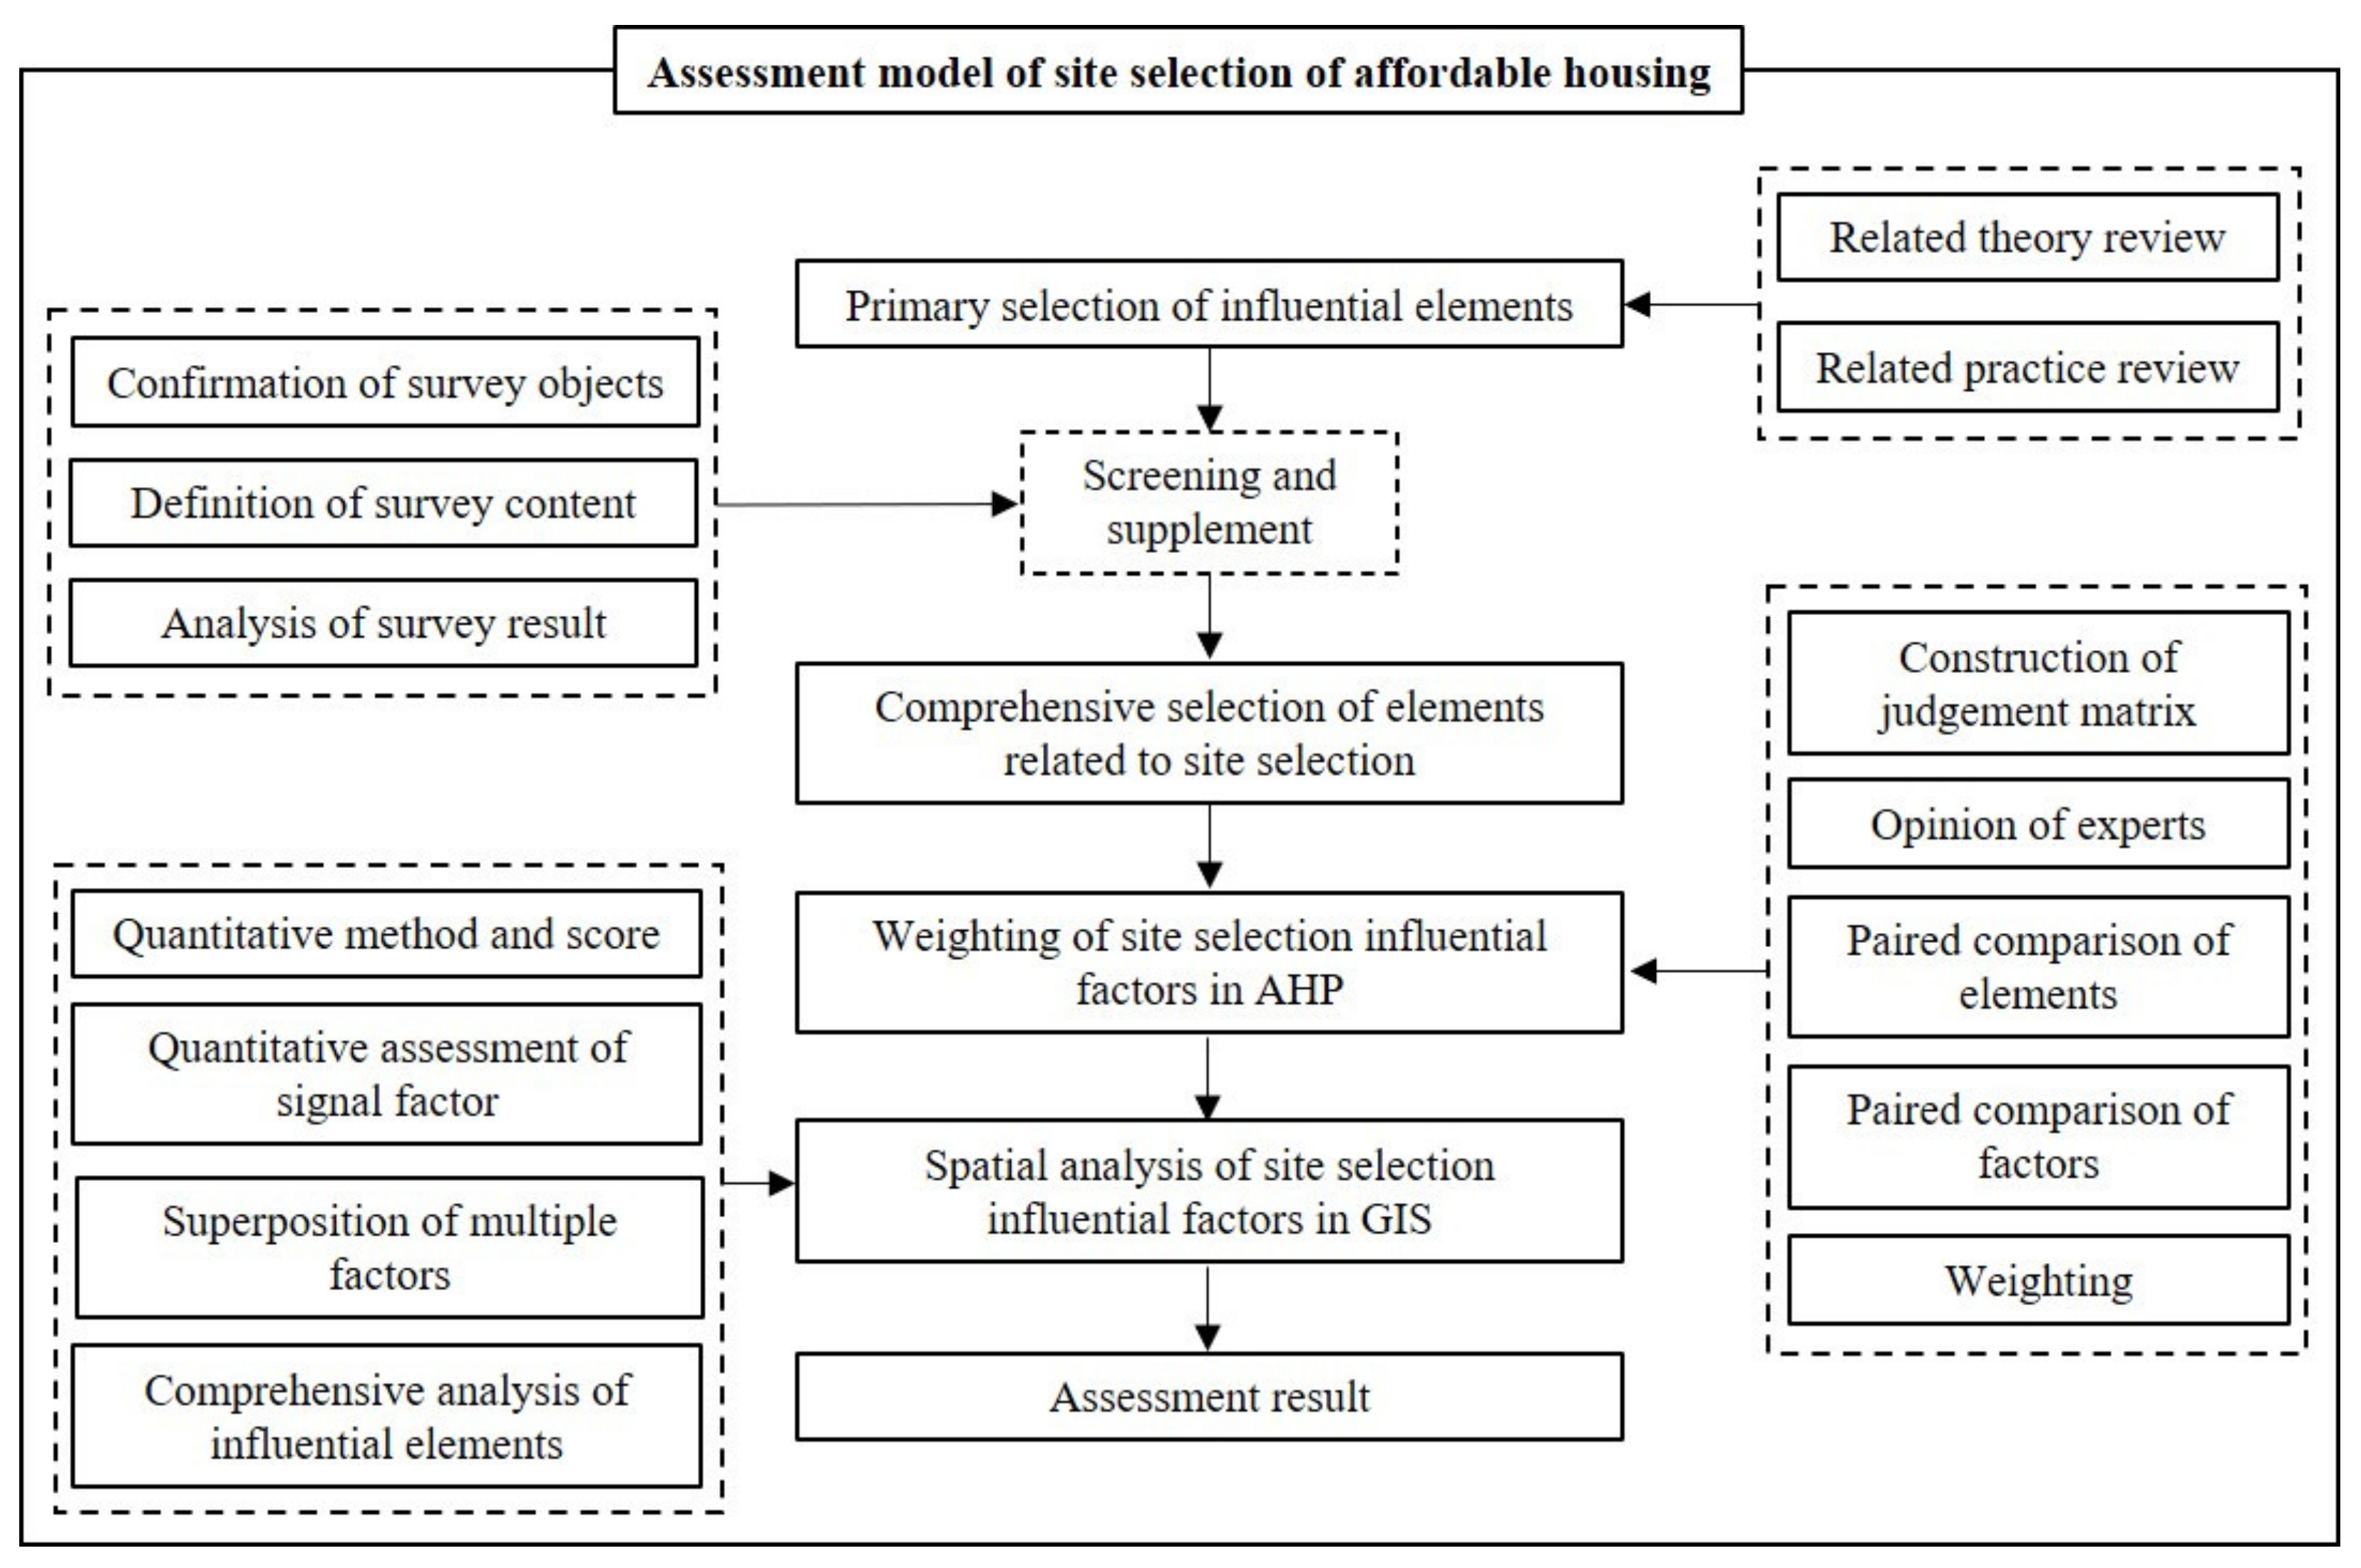
Modeling of site selection assessment follows several steps (
Figure 3). Initially, elements related to site selection are generalized by the analysis of affordable housing site selection theory, which is summarized in the literature review. Then, influential elements are corrected and screened according to the survey of residents. In addition, experts’ assessment comments on each influential element are collected and weights of elements are calculated by the formula of AHP weighing. Finally, an assessment is conducted by GIS based on the above analysis.
3.1.2. Comparison of Different Analysis Methods
With reference to literature, major analysis methods of affordable housing’s site selection are PSO, Logistic regression model, entropy, GIS, and AHP, which can be divided into two categories as weight analysis and spatial analysis. The comparison of weight analysis methods of AHP, logistic regression, and entropy tells that AHP is the most professional one because of expert scoring. Thus, AHP is selected for weight analysis of elements related to site selection (
Table 1).
Both GIS and PSO (particle swarm optimization) possess objective and scientific calculation results (
Table 2), but GIS is more operational because of the less boundary restraining in the process of spatial analysis. Thus, GIS spatial analysis is more favorable in the site selection scenarios [
26].
3.1.3. Process of Analysis Methods
AHP is the aggregation and combination of various factors within multi-hierarchies and the quantitative comparison among each factor by mixed measure to get the outcome by meticulous structural algorithm [
29,
30]. At first, the analysis of factor’s indicators is modeled with the assumption that this model (U) is comprised of m elements and each element is comprised of multiple secondary indicators. Thus, primary elements’ indicators are set as (U
1, U
2, U
3, … U
m), and secondary factors’ indicators are set as (U
i1, U
i2, U
i3, …U
im), and in which i = 1, 2, 3, …, X. After the construction of the aggregation of factor’s indicators, according to different importance of each element for achieving the goal, the element weighing set W = (W
1, W
2, W
3, …, W
m) is constructed to form judgment matrix A for the comparison of elements in pairs:
The geometrical mean βi of elements aij in each line of A is calculated. In Equations (2) and (3), Mi = Πni = 1rij (j = 1, 2, 3, …, j). With the normalization of vector quantity β (β1, β2, β3…)r, the weight is calculated.
W (W1, W2, W3, …, Wn) is the calculated eigenvector, which is the relative score for the assessment element. At last, consistency is checked. If the consistency test is passed, W becomes the calculated eigenvector, which affects the relative weight of the element. The indicator of consistency is CI could be calculated with Equation (4). In this equation, γmax is the maximum eigenvalue for the judgement matrix. Equation (4) is the random consistent ratio is, and in this equation, RI is the indicator of consistency assessment, and the judgement matrix is acceptable only when CR < 0.1.
GIS spatial analysis is the weighted assessment of multi-factors and the expression in drawing by computer technology [
31]. First, the product of each influential element’s interval score and its weight is generated; later, the assessment element score is acquired through the superposition of the influential elements’ weight score in the assessment factor interval; at last, the site selection assessment is modeled by the product of assessment element score and relevant weight. The calculation process is:
In this equation, Pi is the score X of assessment element i; Fij is the weight score of the jth influential element in assessment element i; Xj is the weight score of the Xth indicator; n is the number of influential elements in assessment element i.
Then, it is assumed that P is the score of comprehensive assessment in the affordable housing site selection model, Pi is the assessment score of the ith element, Wi is the weight of the ith element, m is the number of total elements, and the total score of comprehensive assessment is the sum of each element’s score:
3.2. Preliminary Selection of Influential Elements
3.2.1. Analysis of Relevant Influential Elements
Keywords such as “affordable housing”, “site selection”, “location”, “influential elements”, “factors”, “site selection assessment model”, and “housing construction”, and their combinations are searched in the academic database for screening literature related to “influential element of affordable housing’s site selection”. The review of these literature shows that elements affecting site selection may be different due to various construction periods, urban development, and zoning, so 16 elements related to site selection are preliminarily summarized (
Table 3).
Influential elements mentioned over seven times are selected, and four elements with the least frequency (land cost, natural environment, society constitution, policy support, and large evacuation refuge) are eliminated to guarantee the selected elements are highly relevant to site selection of affordable housing; these elements are summarized into six categories: policy, landscape environment, public transportation, employment, service facility, and spatial agglomeration.
3.2.2. Screening and Supplement of Influential Elements
With the help of field investigation and professional judgement by experts, oriented by real feelings and needs of residents, the 12 preliminary elements are corrected and verified. For considering people’s diverse demands, the investigation not only involves residents in affordable housing are interviewed, but also includes management officers, surrounding residents, and people from universities. Venues of investigation are mainly at affordable housing, adjacent communities, administrative office, and some universities. The first interview aims to check the reliability of 12 influential elements. The interviewee is asked to fill out a questionnaire, and the occurrence frequency of the mentioned element is counted (
Table 4). Initial interview tells that these 12 influential elements are all mentioned during the talk, and elements such as rail transit, educational facility, medical facility, and industrial park are especially with higher frequency, which is consistent with the result from the literature review and expresses the reliability of these 12 elements.
The second interview is based on the first one. The significance of different site selection influential elements by interviewees is gathered through subjective assessment for re-correction and re-screening of the 12 reliable elements. Using SD semantic scale, the interviewee is asked to score the significance of each element in a 5-scale rating system, in which 5–1 mark, respectively, very important, important, average, not important, and irrelevant; moreover, additional comments are recorded in this questionnaire.
One hundred questionnaires are distributed in the first-round interview, and 100 questionnaires are collected, 100 questionnaires of which are valid. 200 questionnaires are distributed in the second-round interview, and 200 questionnaires are collected, 180 questionnaires of which are valid. According to the statistics of investigation, in personnel distribution, affordable housing 59.98% of interviewees are affordable housing residents, 15.36% of interviewees are commercial housing residents, 4.31% of interviewees are administrative officers, and 20.35% of interviewees are people from university. In sex ratio, male interviewees account for 52.5% while female interviewees account for 47.5%. 53.9% of interviewees hold with degrees above bachelor’s, and 46.1% of interviewees do not attend university, which indirectly means that most affordable housing residents are less educated.
Data from 180 questionnaires in the second-round interview are analyzed and divided into 5 scales by SPSS according to their significance. The significance of each element is valued in ascending order by 1–5 marks (
Table 5).
It is because different interviewee holds different opinion of element’s significance that mean value of each element is various too; since most mean values are slightly over or less than 3, a moderate reduction of the mean value can secure the rationality of factor choice. As a result, 2.5 becomes the critical point of the mean value of significance: an element with mean value over 2.5 is more crucial for site selection, while an element with a mean value lower than 2.5 is less crucial. The result shows that three elements’ mean values are lower than 2.5, which are policy support (2.14), environmental pollution (2.35), and business center (1.35). Thus, these three elements can be eliminated from the influential elements set.
3.3. Finalization of Influential Elements
With the analysis and conclusion in literature and the screening and correction during field investigation, site selection influential elements of affordable housing in this study are summarized into five categories and nine types, and an AHP model is constructed according to the classification (
Table 6). For scientifically weighting each assessment factor, comments of experts from the Bureau of Land and Resources, Bureau of Building and Transportation and Planning and Design Institute of Jiangbei New District, and professors from universities are also consulted.
4. Results
4.1. Weighting of Influential Elements Based on AHP
After the construction of the aggregation of factor’s indicators, according to the different importance of each element for achieving the goal, the element weighing set W = (W
1, W
2, W
3, …W
m) is constructed. Expert comments are collected to compare and calculate the relative significance among elements, and results show that the RI of judgment matrix of affordable housing’s site selection is 0.0336, and the W is 1.000 (
Table 7).
Expert comments are collected to compare and calculate the relative significance among public transportation elements, and results show that the RI of judgment matrix of public transportation element is 0.0025, and the W
i is 0.2941 (
Table 8).
Expert comments are collected to compare and calculate the relative significance among public transportation elements, and results show that the RI of judgment matrix of public service facility element is 0.0035, and the W
i is 0.1956 (
Table 9).
With the superposition of a unified ranking of each element from the same hierarchy, significance weights of all elements from former hierarchy are acquired. In the end, total weight of each element from each hierarchy is calculated to achieve the general goal and the ranking of the weight system (
Table 10).
4.2. Quantitative Assessment of Site Selection Influential Elements in GIS
All the selected influential elements can be quantitatively analyzed according to data from related laws, codes, regulations, and building experience, so quantitative assessment is feasible in this study. Four buffer zones centered on influential elements are generated and divided into 4 levels given by 1–4 marks, respectively. The higher the score, the more favorable the site for affordable housing.
4.2.1. Quantitative Assessment of Single Factor
The assessment of the landscape environment element is related to 15-min life service circle [
32,
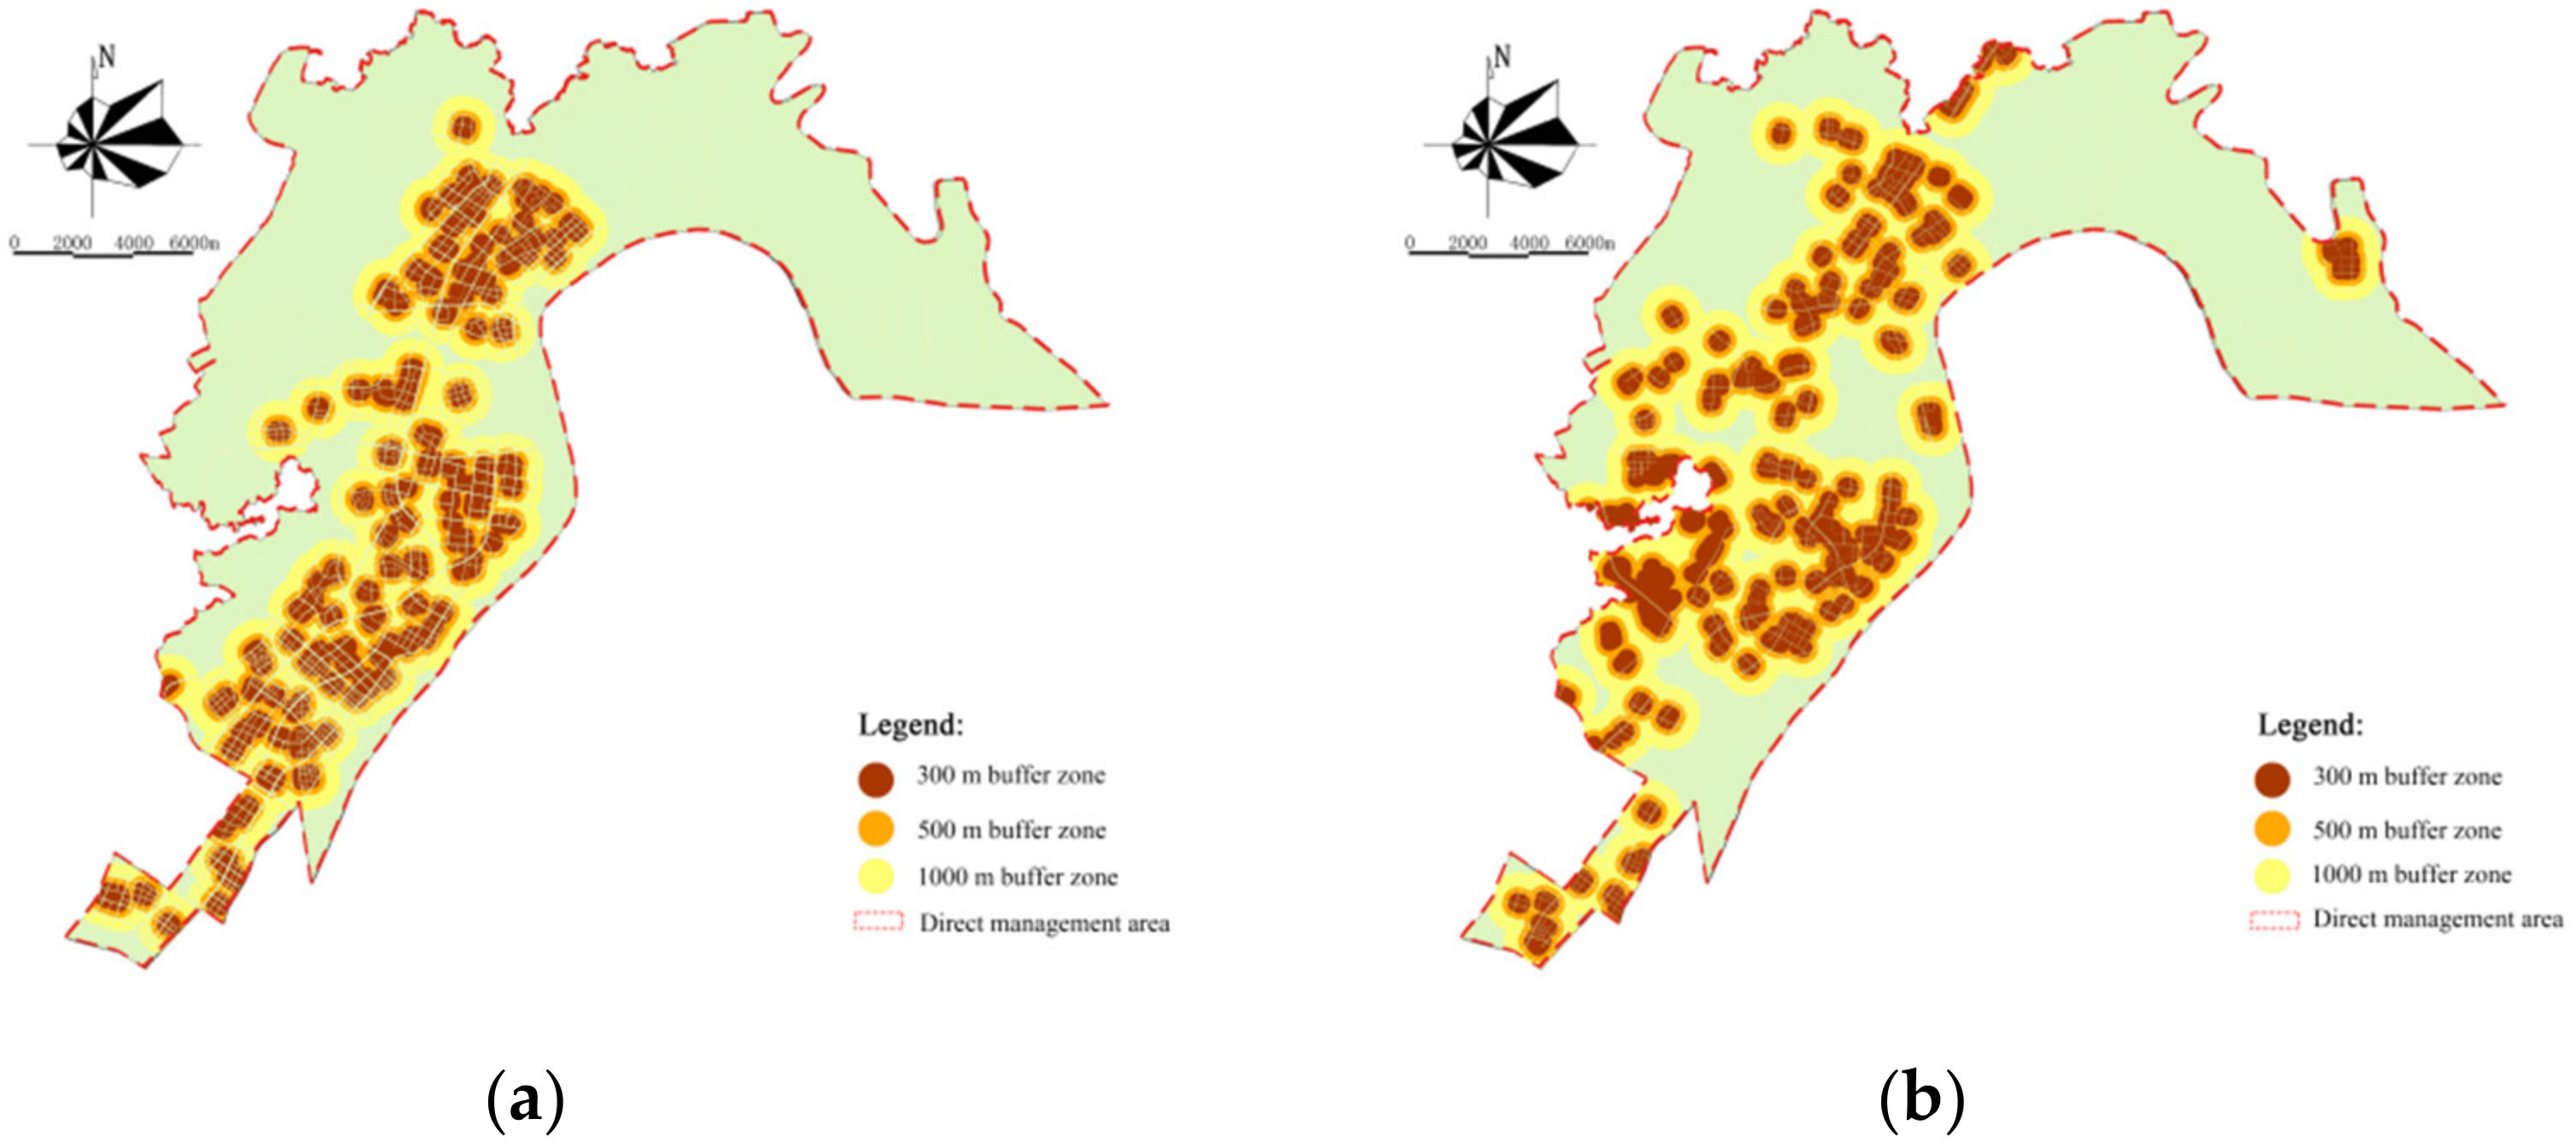
33]. Walking is quite preferred by residents in their neighborhood, and normal walking distance in 15 min is usually 1500 m. Thus, according to impacts varying from the distance to public landscape greenspace, different marks are assigned to these rings, and multi-ring buffer zone of public landscape greenspace is generated (
Figure 4).
The impact of residential community by public transportation derives from TOD theory, a community development mode that commerce, business, and residence are located within the radiation radius of a large-scale transportation hub [
34]. According to TOD, real estate built within 0.3–1 km to the station witness obvious value increasing because of the development of public transportation, and these locations are usually arrived by 15 to 20 min walking [
35,
36]. In Singapore, the spatial radius of TOD mode is 900–1200 m [
37]; in Hong Kong, the public community is built within 10–15 min pedestrian-scale neighborhood; in Beijing, affordable housing locates in the ring with 500–1000 m radius centering on transportation station. With these references, the influential range of public transportation element can be classified into 4 rings as shown in multi-ring buffer zone analysis of rail transit and bus stop (
Figure 5).
According to Standard for Urban Residential Area Planning and Design (GB50180-2018), Guidance of Affiliated Public Facility Standard in Newly-built Area of Nanjing [
38,
39], and the concept of 15-min life service circle, the influential range of public service facility element is set and shown by multi-ring buffer zone analysis of educational facility, commercial service facility, medical facility, and cultural and sports facility (
Figure 6).
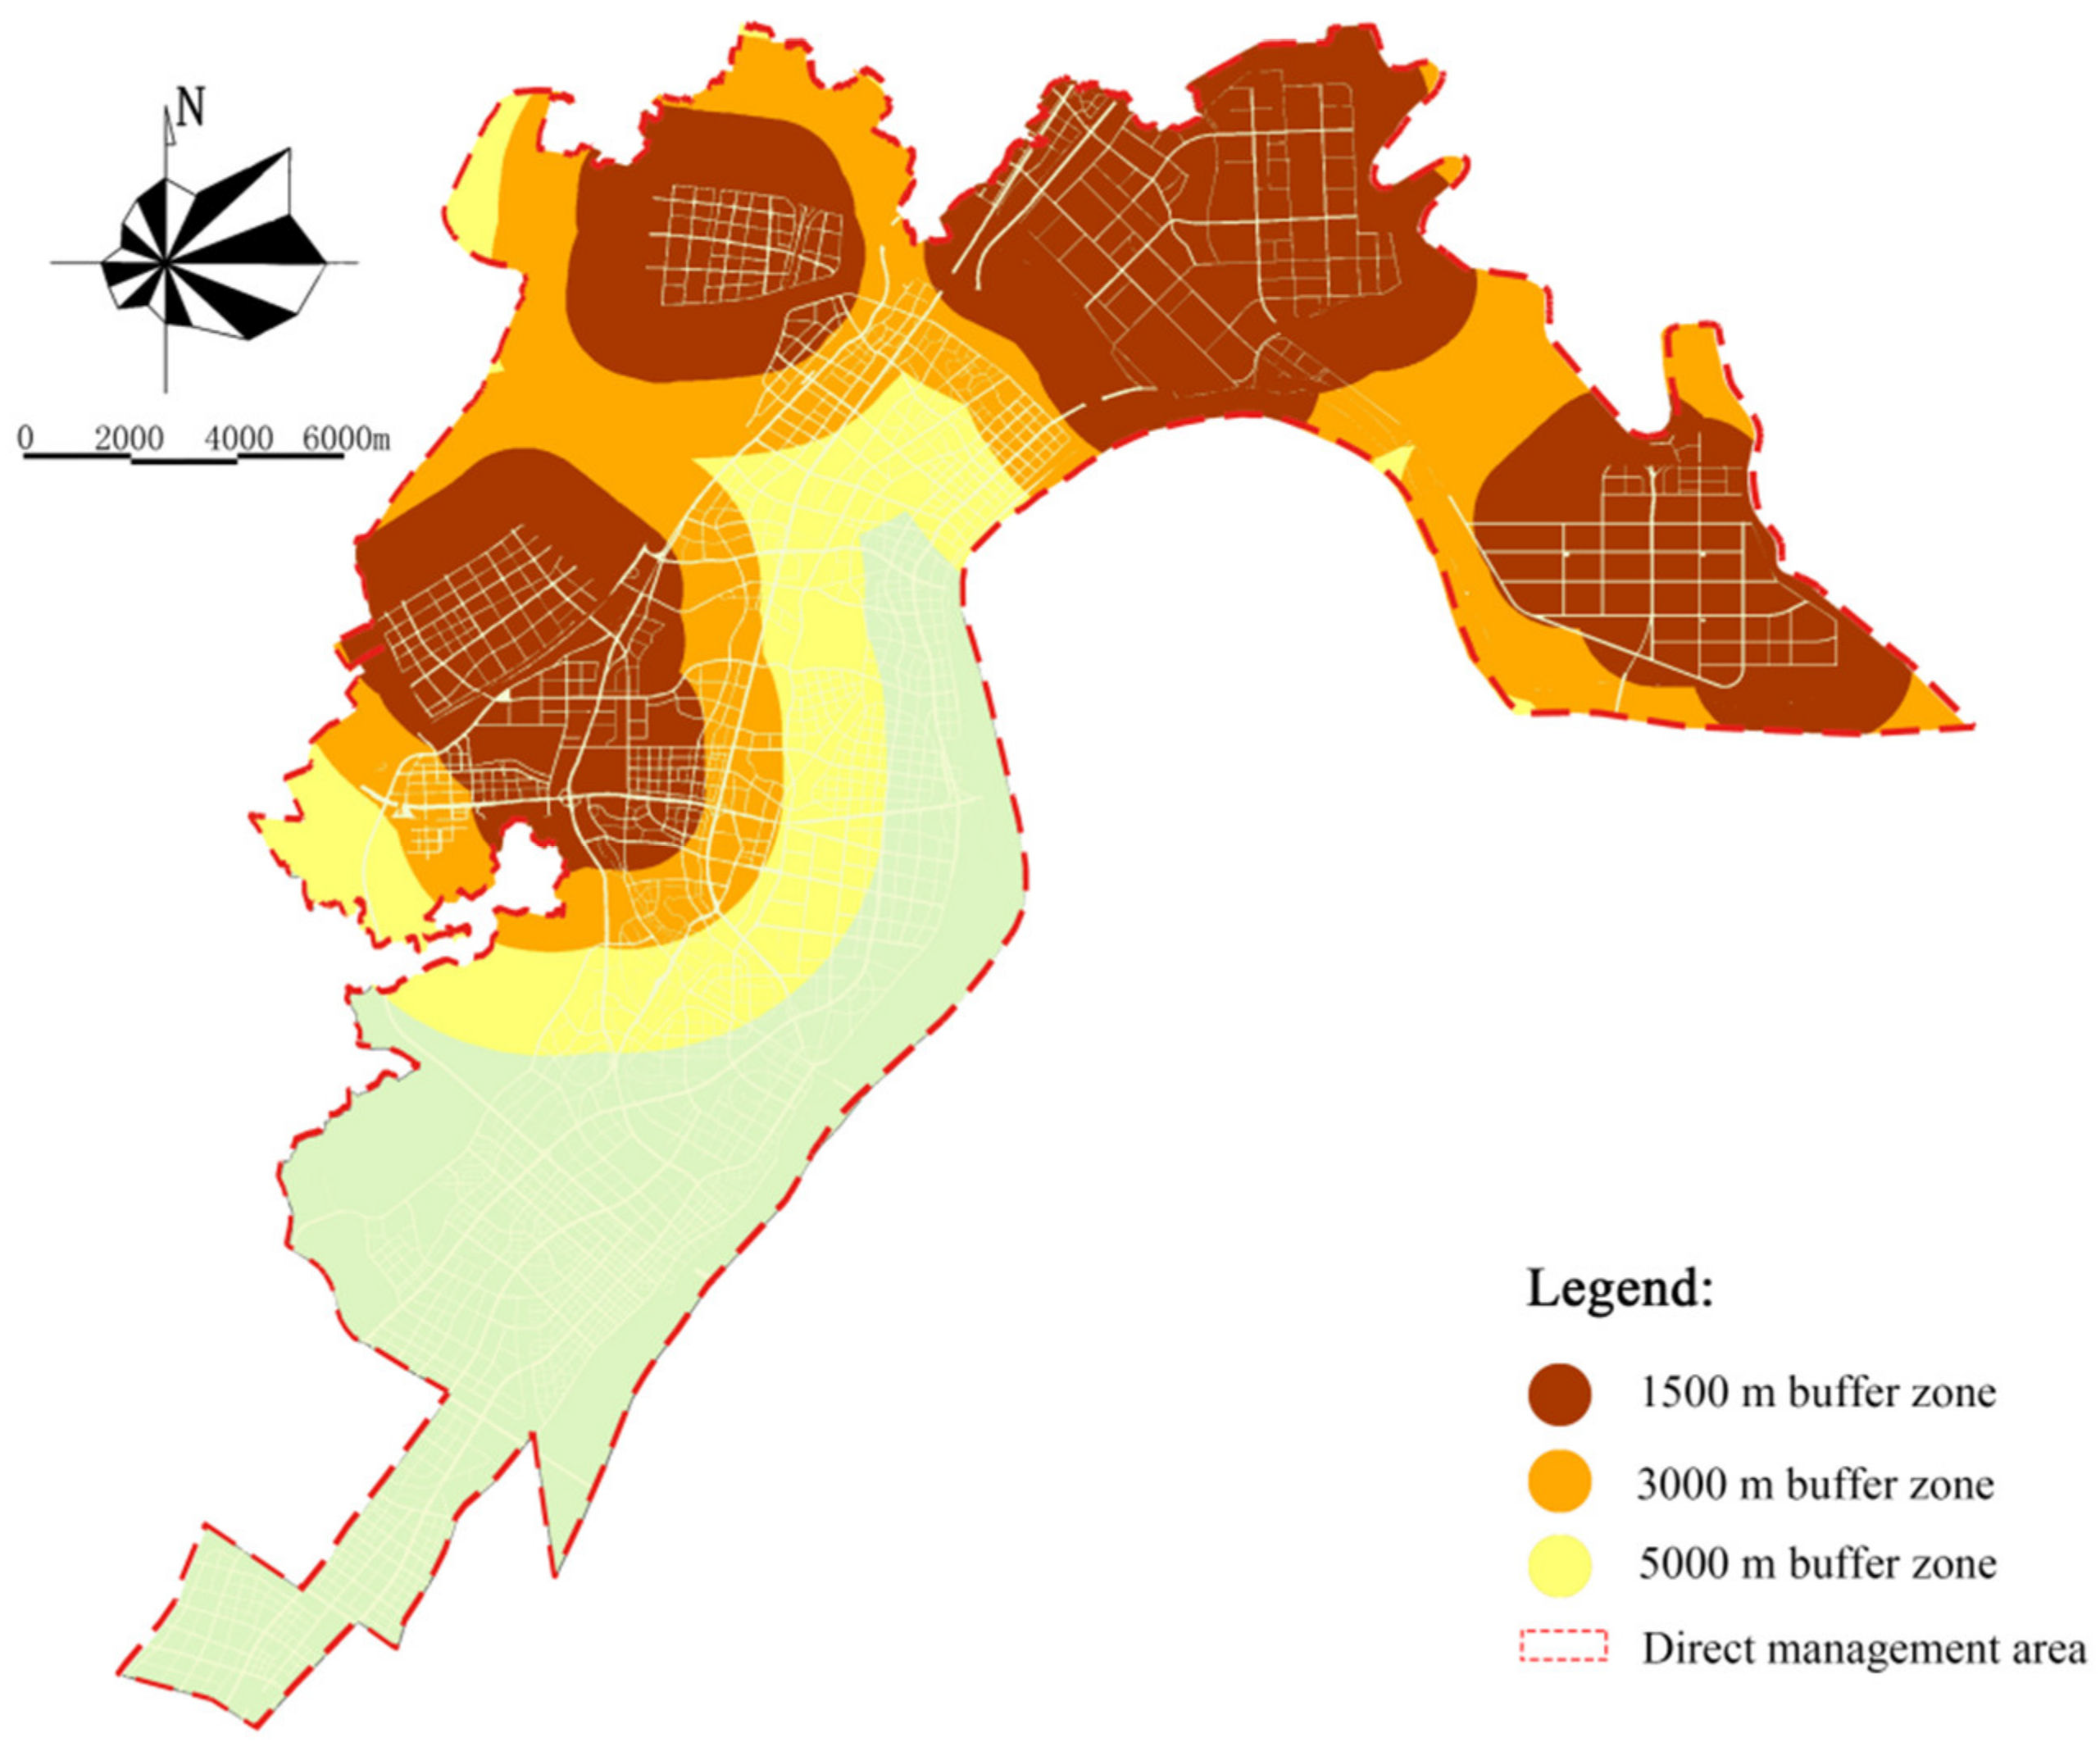
The balance between working and housing is closely related to commuting behavior. According to the concept of 15-min life service circle and planning of industry distribution structure in Jiangbei New District, the influential range of industrial park factors can be classified into 4 rings as shown by multi-ring buffer zone analysis of industrial park (
Figure 7).
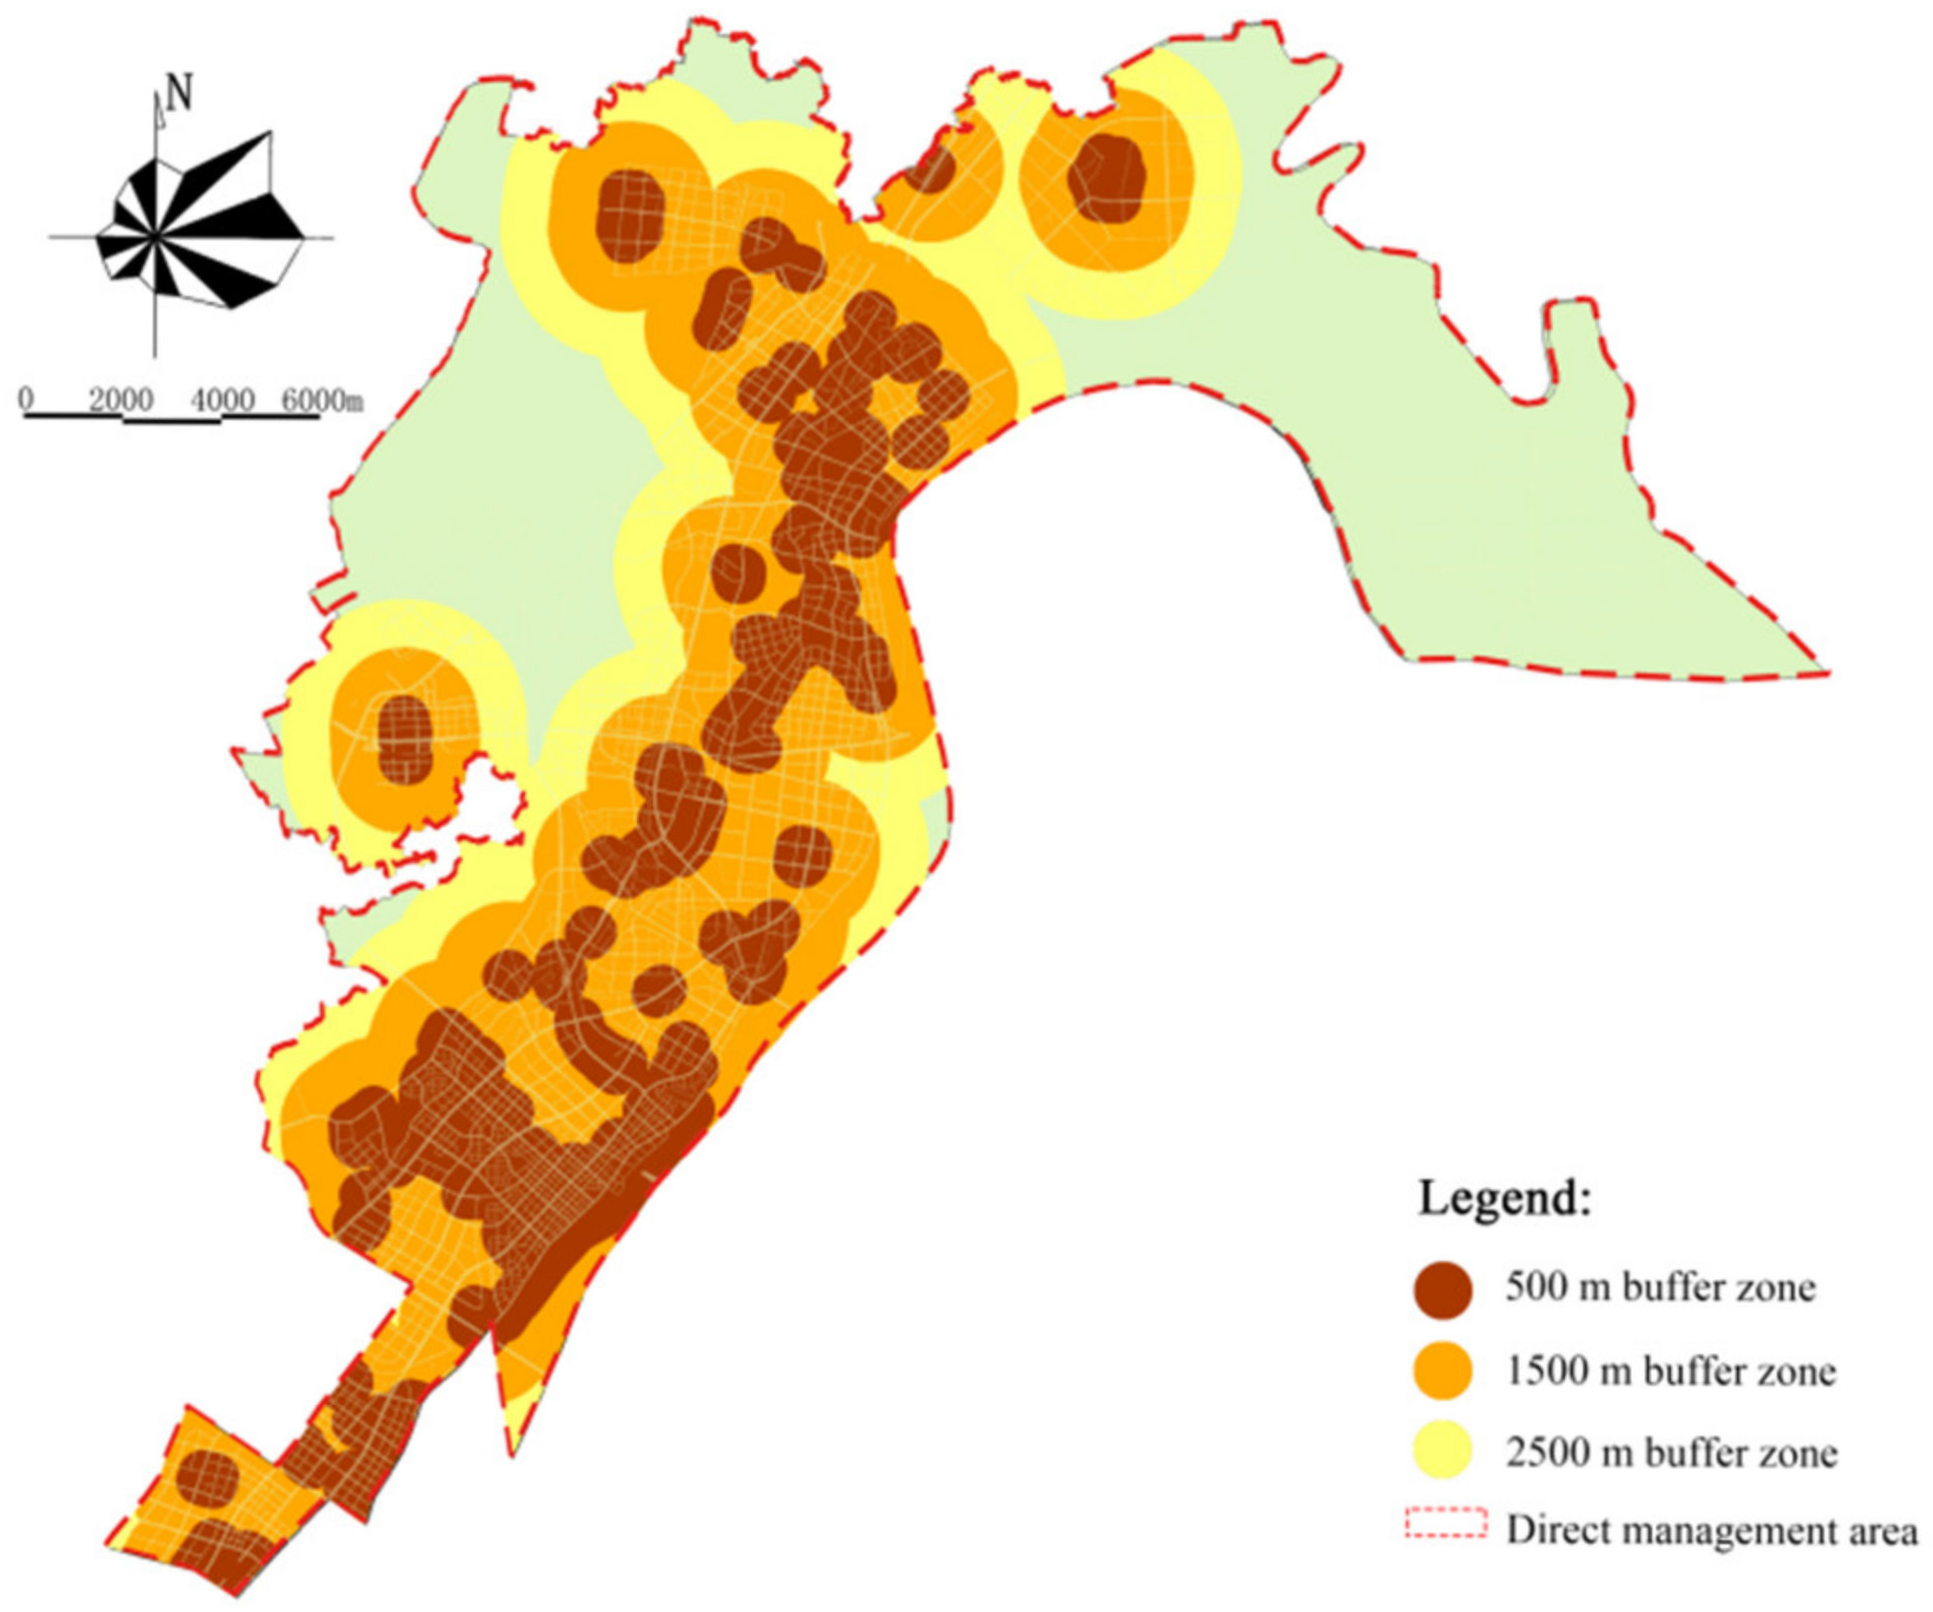
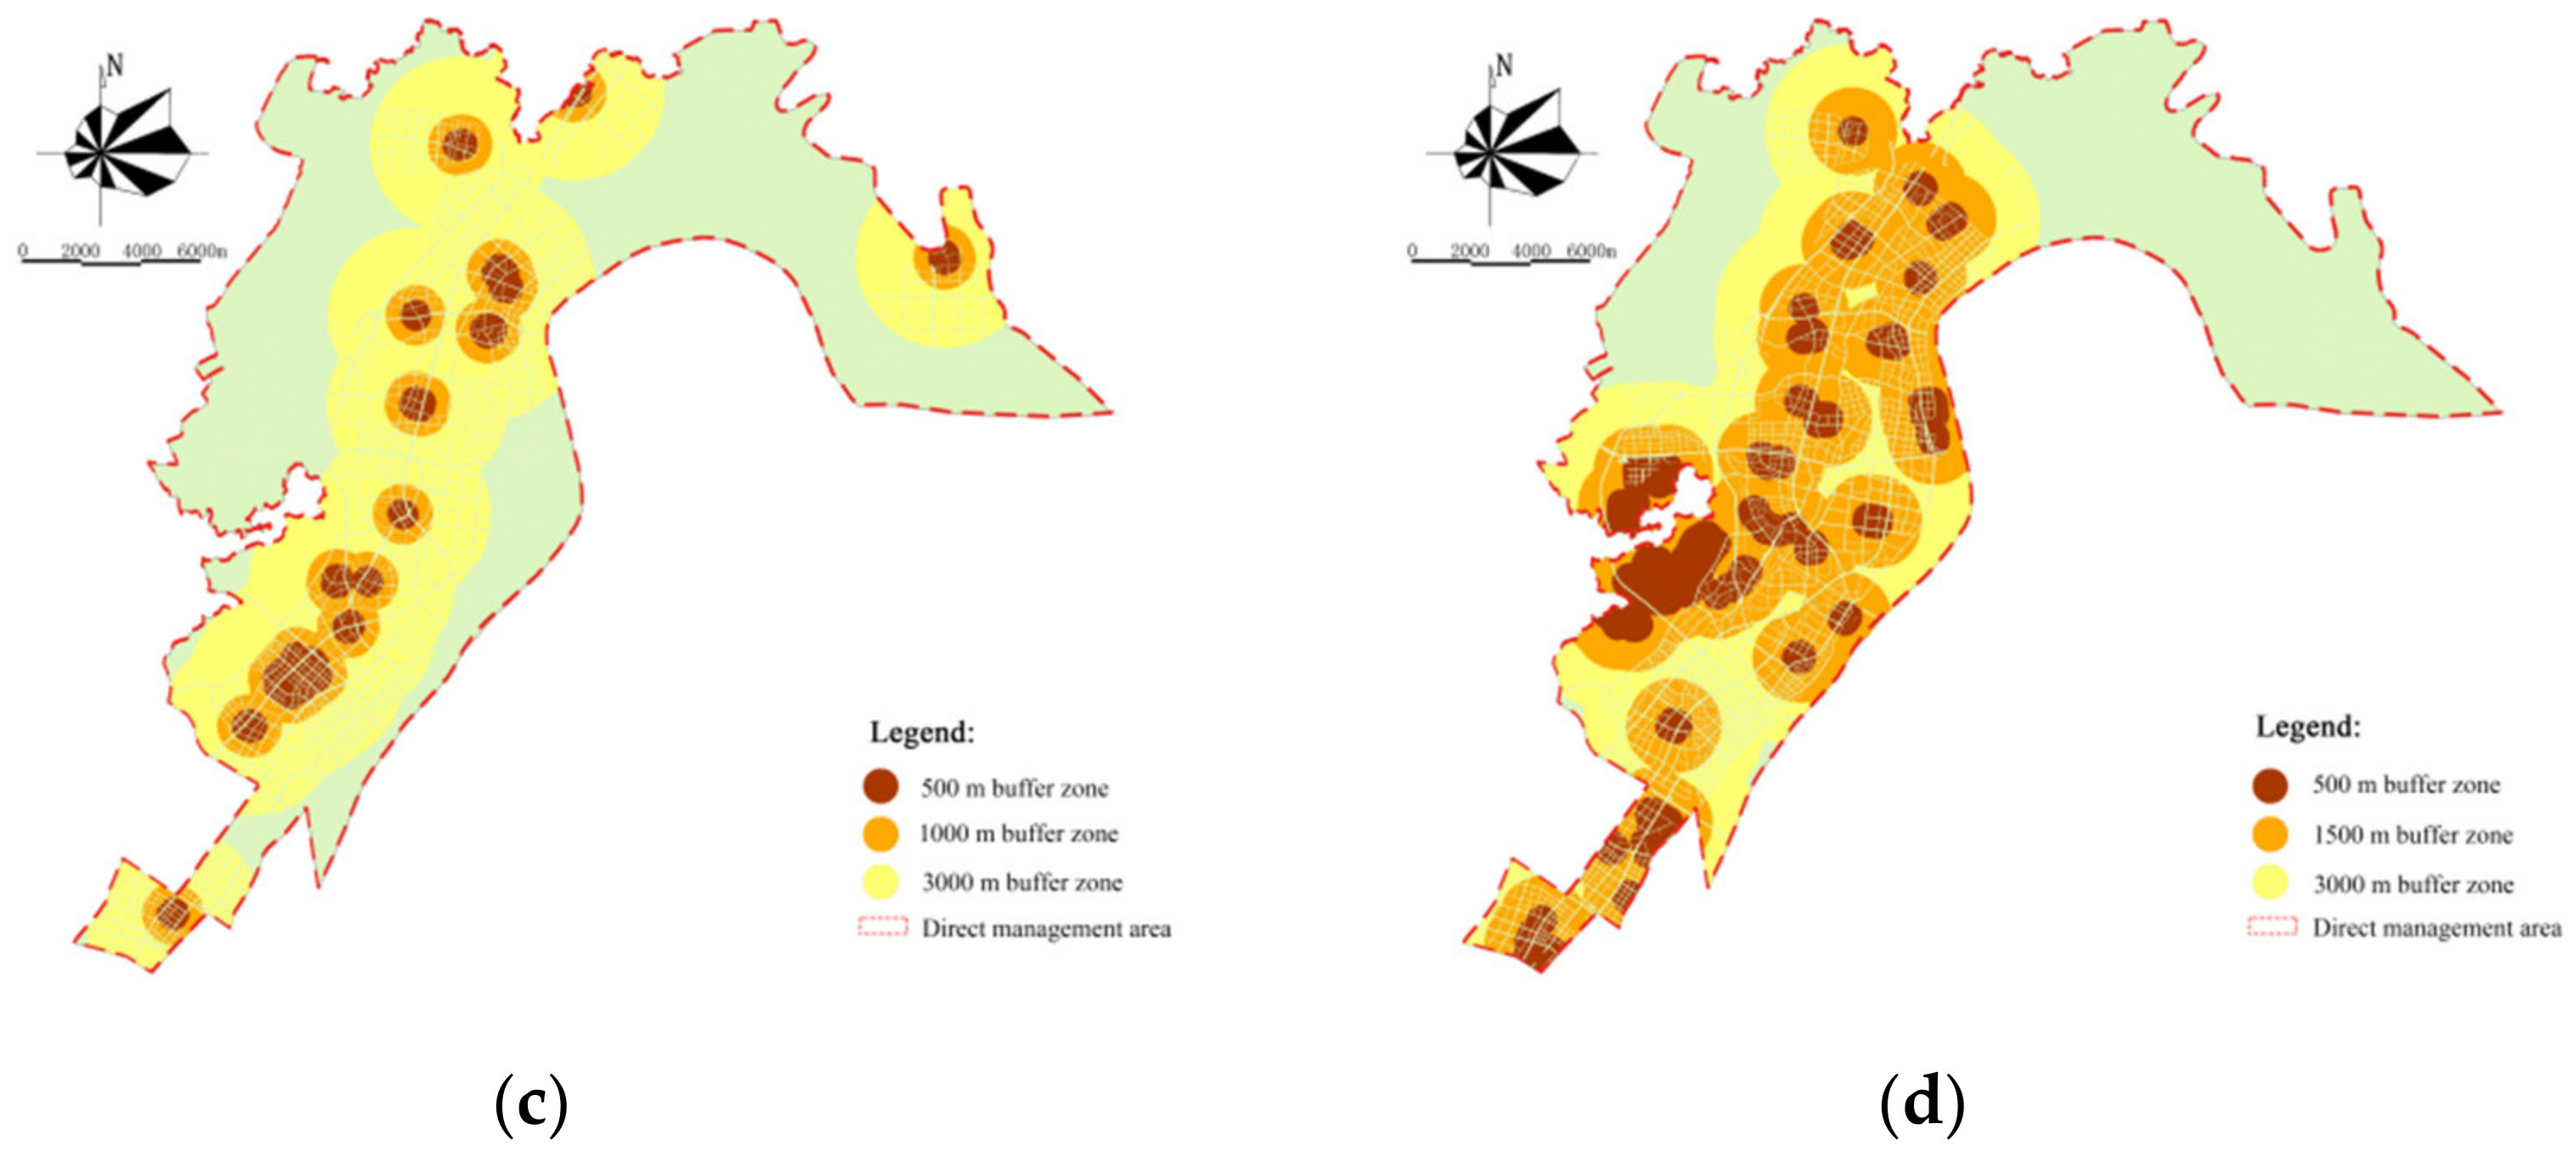
The factor of spatial agglomeration mainly influences living environment and social security, so 4 rings are set by the proximity between planning residential area and existing low-income community. According to existing affordable housing scale and layout, the influential range of spatial agglomeration is defined and shown by a multi-ring buffer zone analysis of spatial agglomeration (
Figure 8).
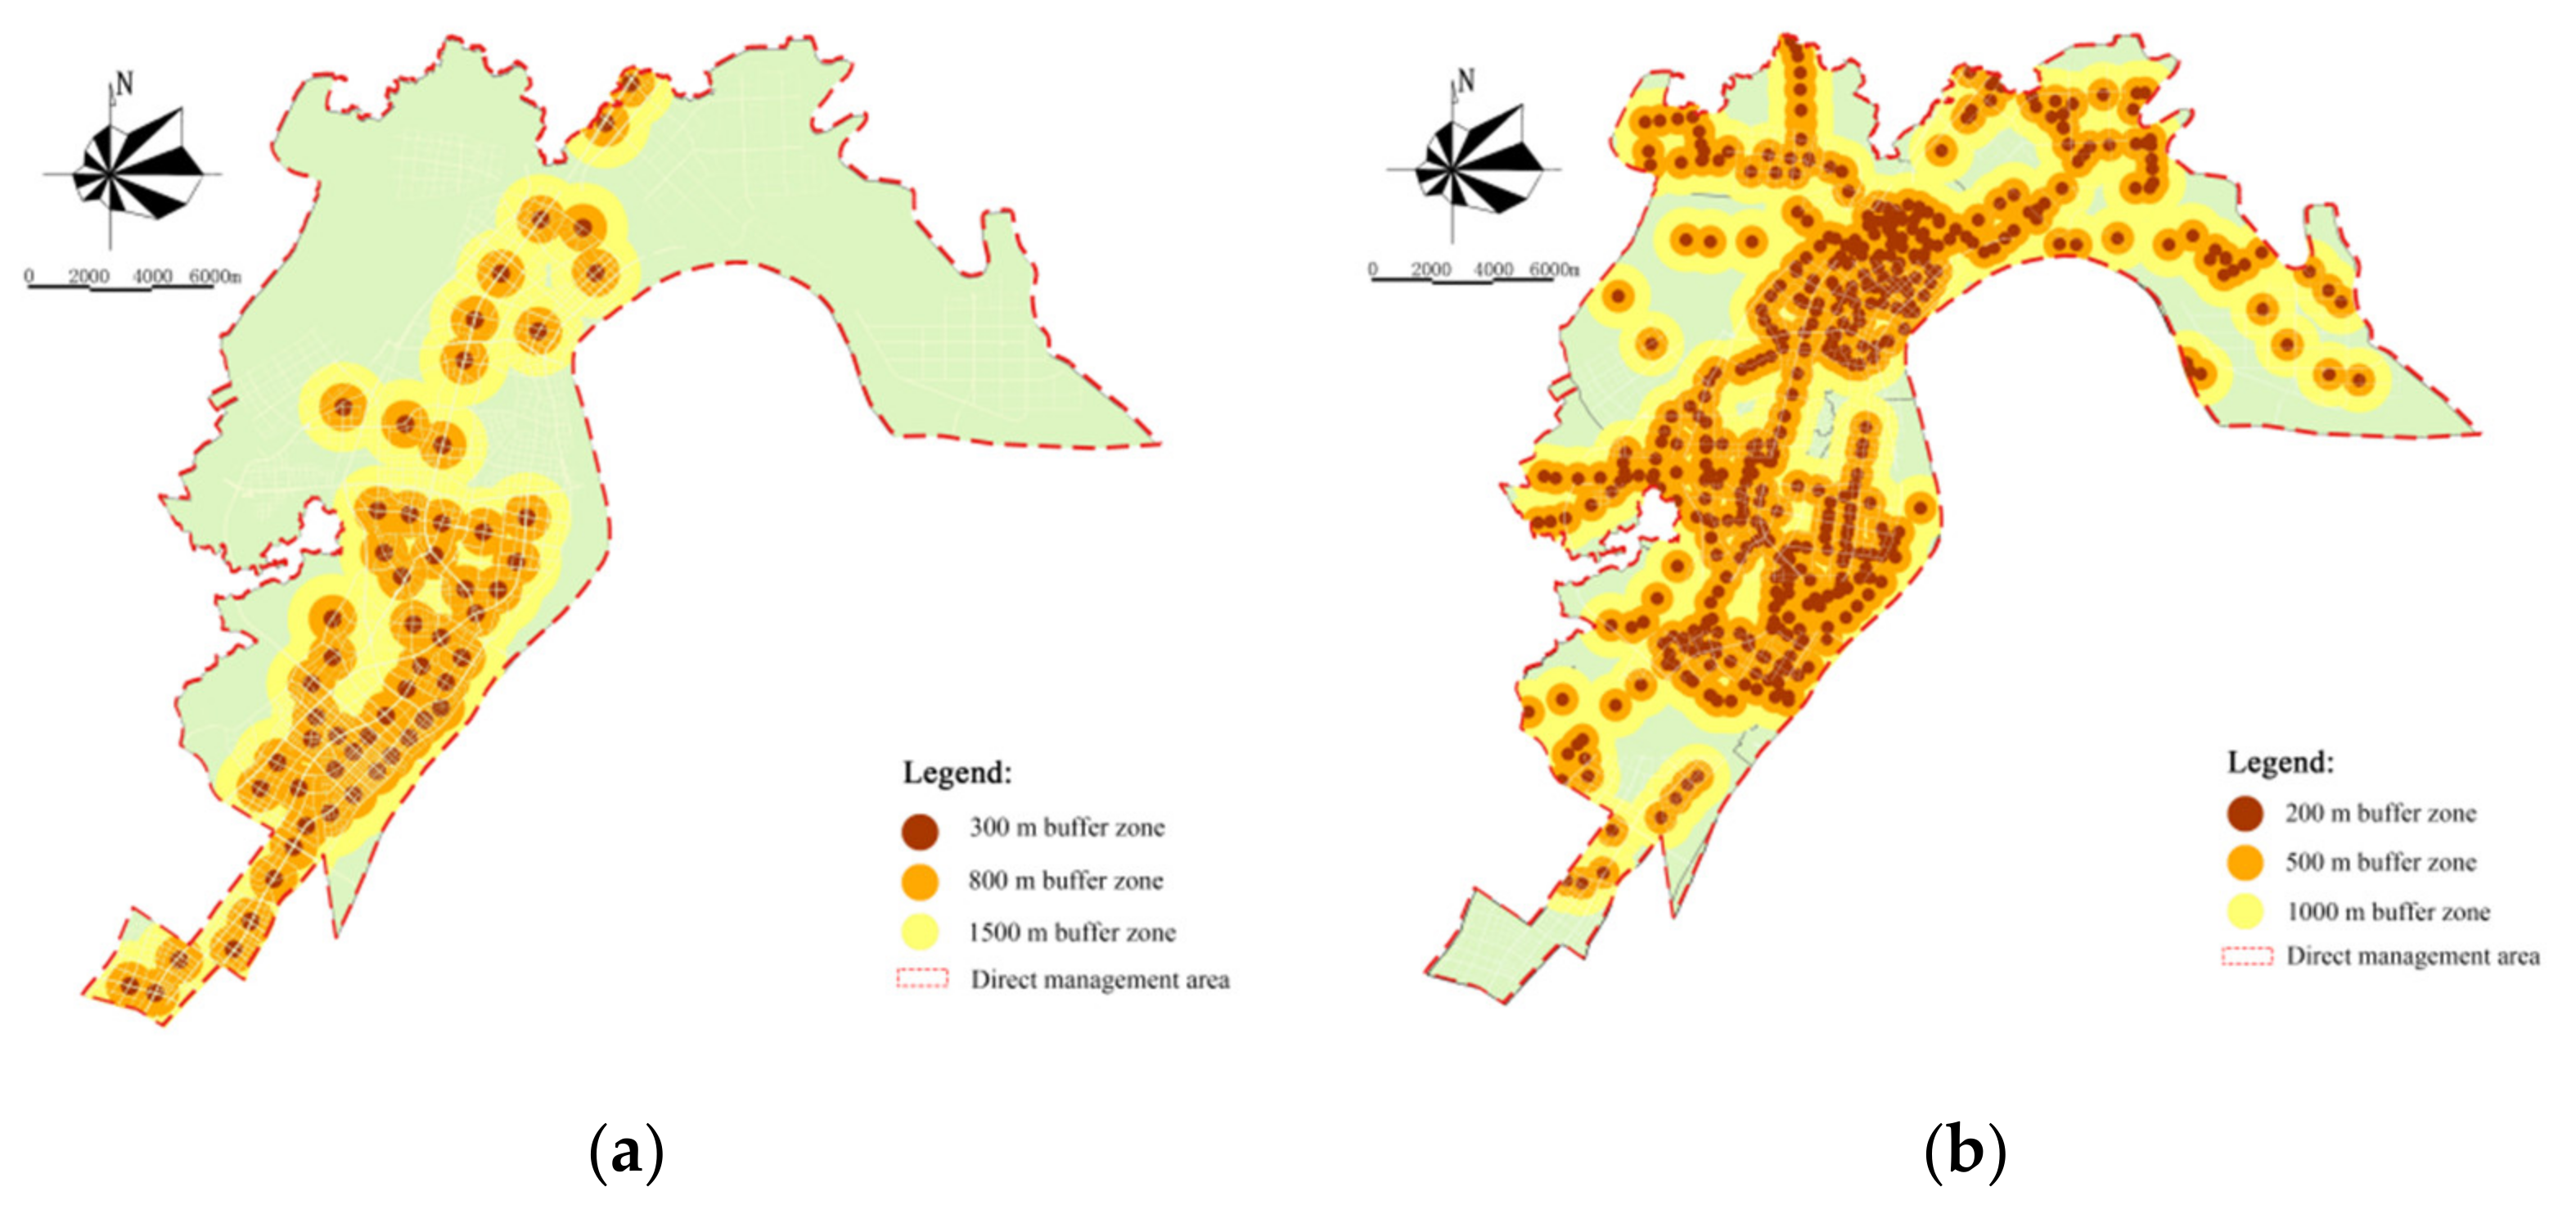
4.2.2. Superposition Analysis of Site Selection Influential Elements
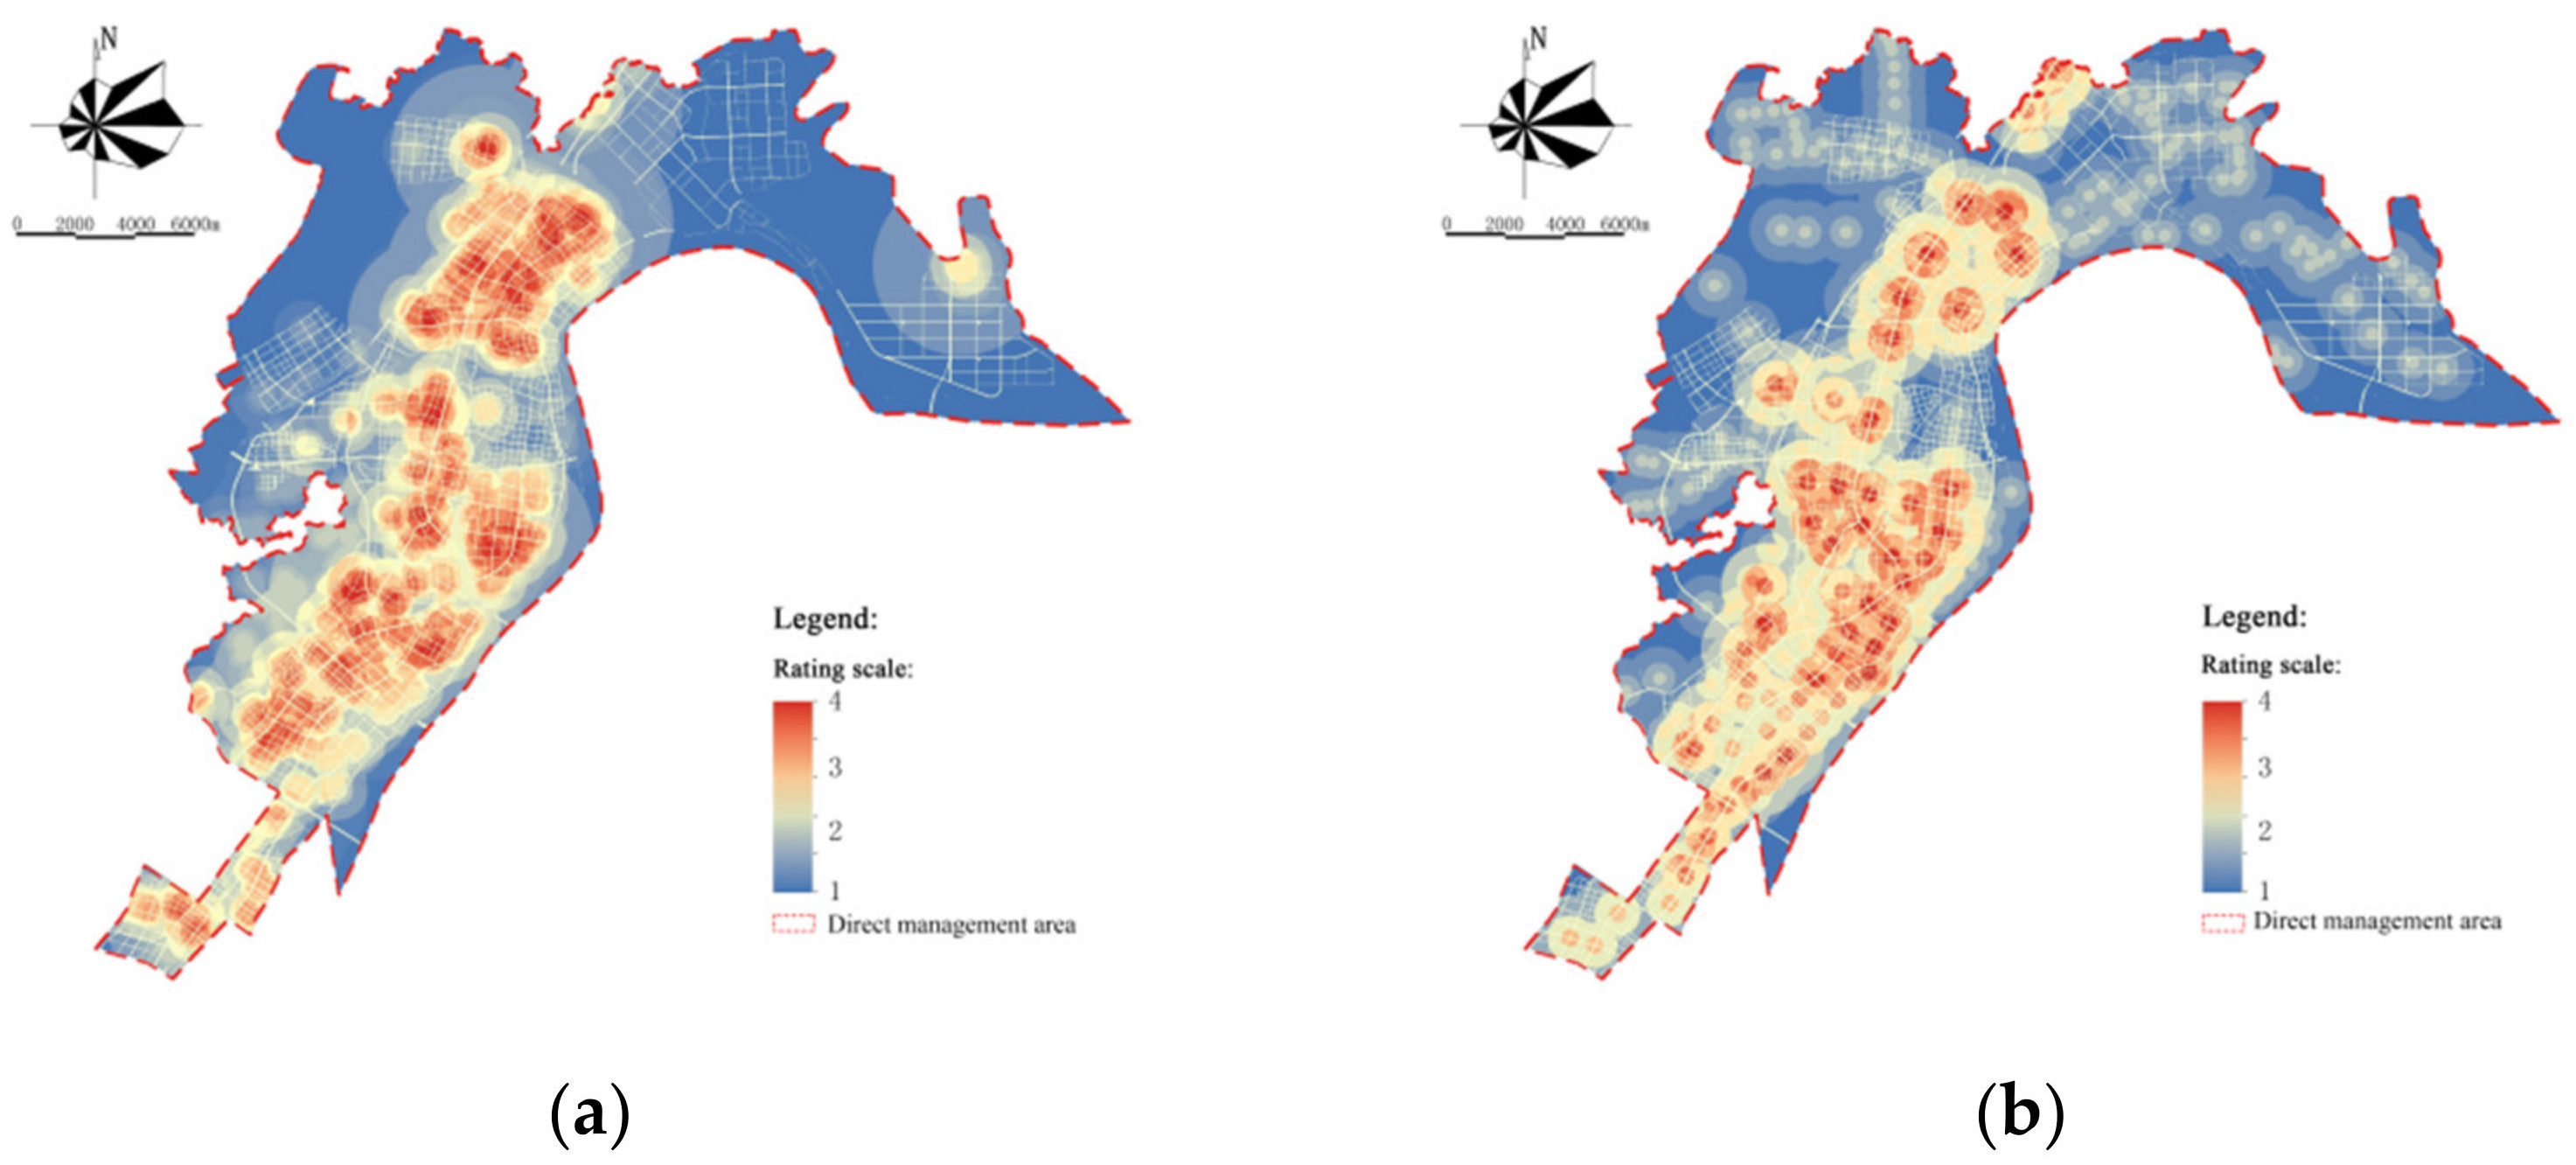
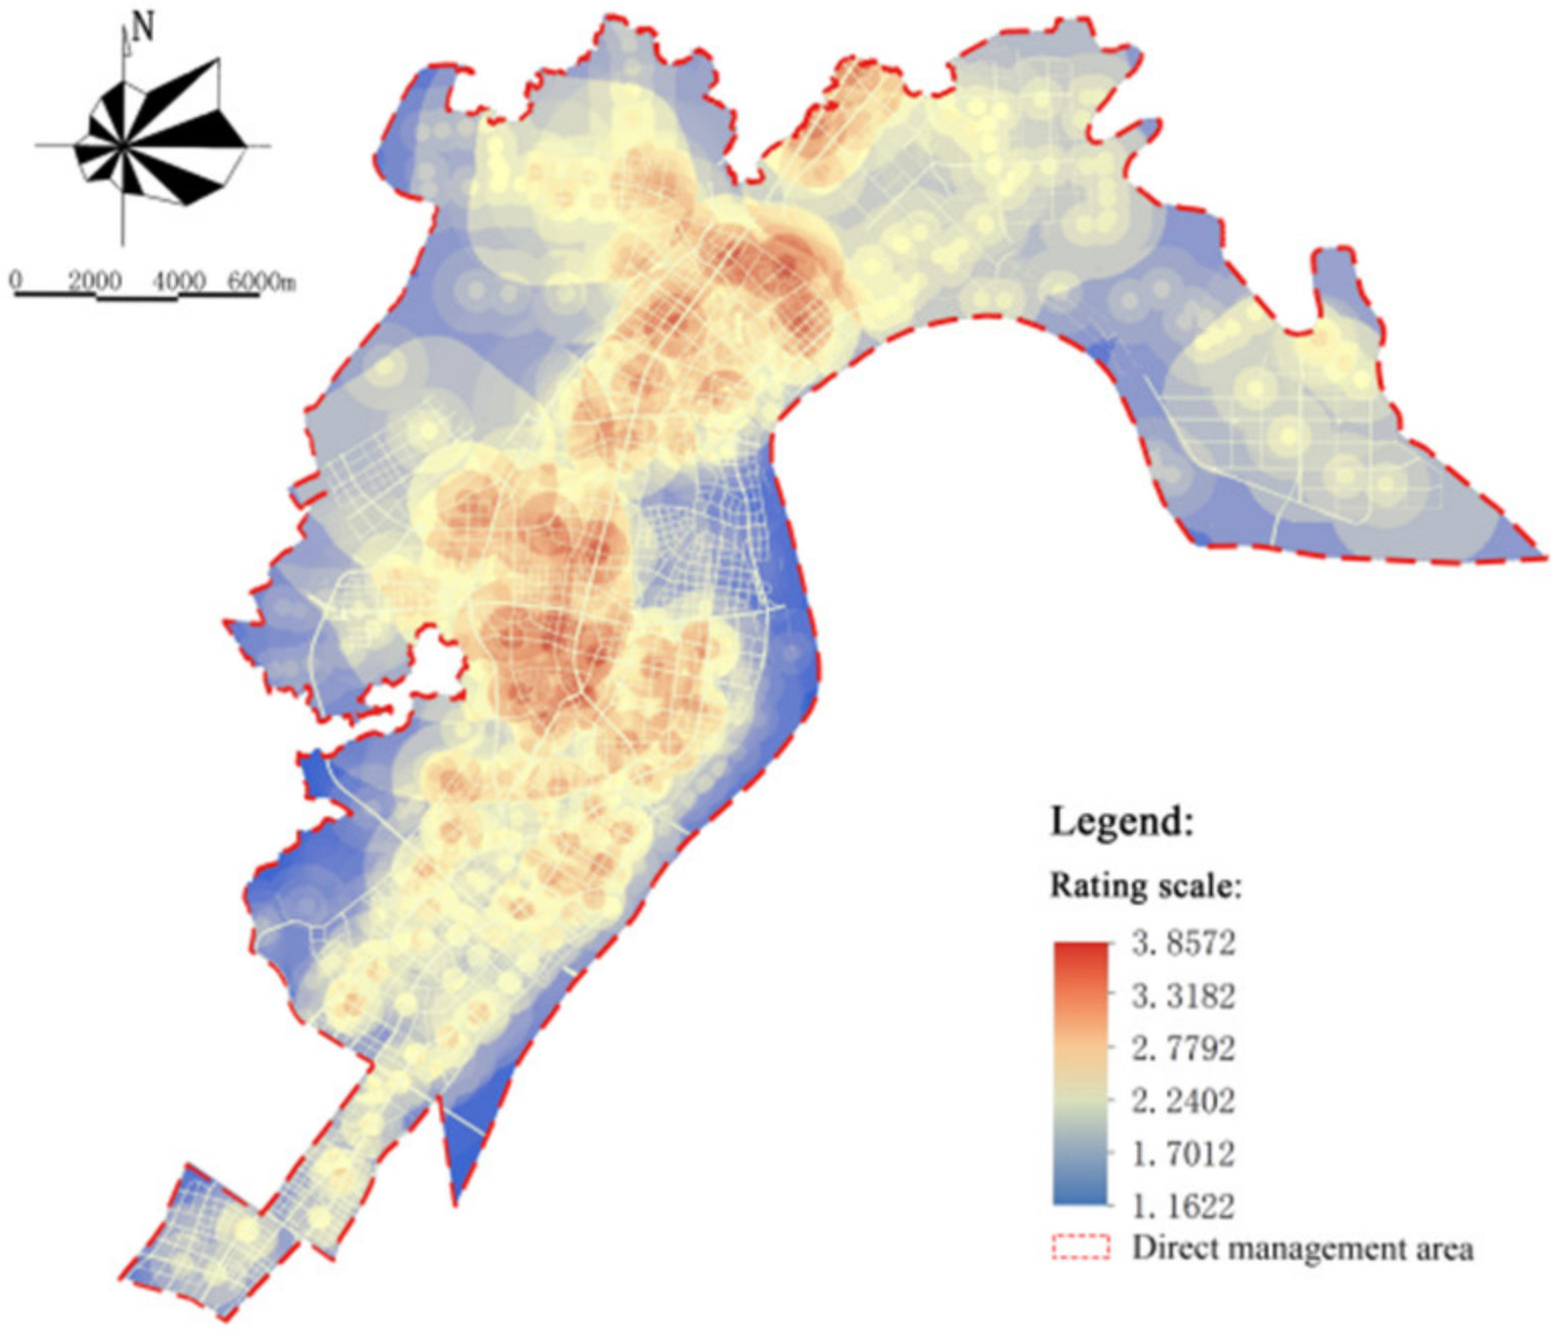
With the rasterization of quantitative results and the superposition and integration of each influential element’s weight, a comprehensive assessment diagram of the public service facility element and public transportation element is acquired (
Figure 9). Finally, a comprehensive assessment diagram of influential elements of affordable housing’s site selection is generated by weighted calculation (
Figure 10). As shown in
Figure 9, except for Changlu Neighborhood, other neighborhoods in the direct management area possess a relatively agglomerated layout of public service facilities. The distribution in Dingshan Neighborhood, Taishan Neighborhood, and Dachang Neighborhood is comparatively balanced, while Yanjiang Neighborhood, Getang Neighborhood, and Pancheng Neighborhood should pay more attention to the element of public service facility. The distribution of public transportation facilities in the direct management area is relatively balanced.
In a comprehensive assessment of site selection influential elements of affordable housing, the higher the score, the more favorable the site for affordable housing. Thus, the diagram can be the basis for site selection of affordable housing in direct management areas in the future. The comprehensive assessment score of most favorable site is 3.8572, while that of the least favorable one is 1.1622. In practice, site with score ranged from 2.7792 to 3.8572 is recommended for affordable housing.
5. Discussion and Suggestions
With rapid urbanization, the conflict between the demand and supply of housing is escalating. Currently, site selection of affordable housing in China still faces problems as unbalanced arrangement of living and working area, lack of affiliated facilities and disparity of settlement [
40]. After years of development and improvement, developed countries have taken measures such as decentralized layout or mixed community to improve social integration [
41]; they incorporated the location of affordable housing into the land use planning in the early stage, paid attention to the related supporting facilities such as work living balance, transportation and public service facilities, and the housing layout strategies such as the updating and maintenance of affordable housing, which offers valuable experience have high reference significance for the future affordable housing construction ofin China in the future. At the meanwhile, with the accelerated development of direct management area, future trend of housing composition is still pending. In this background, optimization of affordable housing development in direct management area under Jiangbei New District in Nanjing is suggested.
In the beginning, because the low-income residents living in affordable housing usually are not able to afford automobiles. Due to low income of residents in affordable housing, most of them cannot afford automobiles, which requires the necessity of public transportation. If it is difficult to build affordable housing along main transportation route, public transportation facility should be added into the community in future planning, or certain site along the route of public transportation should be reserved for affordable housing.
In addition, public service facilities should be completed around affordable housing, since affordable housing not only aims to solve the housing problem of the moderate and low-income groups, but also offers habitable living. Within practical conditions and the further development planning of the direct management area, residents in all social classes should enjoy the same social resource through the optimization of the affiliated public facilities.
Finally, the site of affordable housing should be adjacent to an industrial park. Isolated community is very hard to support sufficient job opportunities, and low employment could correspondingly bring low occupancy, which disables the original function of affordable housing. For residents, locating affordable housing around an industrial parks can solve the problem of living and work simultaneously through the close connection between home and workplace; for the government, the housing problem of the moderate and low-income groups is solved, and enterprises also get sufficient labor resources, which is a win-win situation for both locating affordable housing and improving the local economy.
6. Conclusions
A preliminary research system has been formed for the research on the suitability of the space location of affordable housing land use [
42]. In terms of research methods, it has become a widely accepted research method to build a multi-criteria decision-making model and conduct research on the spatial location of affordable housing land with the aid help of mathematical statistics, GIS, and other spatial analysis technologies. Research often lacks multi-faceted consideration and professional evaluation of complex elements.
From the existing relevant studies, the previous studies often only involved a single factor affecting the location of affordable housing. The assessment model of site selection of affordable housing is constructed, and the optimization measures and suggestions are proposed according to related theory and techniques in the study of affordable housing site selection in the direct management area under Jiangbei New District in Nanjing. At the same time, through the comparison of various research methods, since the regression analysis method is easy to ignore the variable information other than the principal component information and the entropy method lacks the horizontal comparison between samples, this paper selects AHP technology as the weight analysis method of the site selection influencing factors and GIS spatial analysis method for the spatial analysis of the site selection influencing factors.
Although this study scientifically identifies site selection influential element for affordable housing and offers valuable suggestions for further planning, two limitations still exist. First, influential elements of site selection mostly derive from the research of related scholars, so the opinion of authors is not fully revealed; furthermore, in the process of screening, interviewees as residents and relevant people of affordable housing may give subjective views, which affects the objectivity of elements selection. Thus, a more scientific screening approach should be considered in further study. Second, affordable housing in this study only refers to economical housing, low-rent housing, price-limit commercial housing, and other types of affordable housing that are beyond consideration. So, in further steps, features of other types of affordable housing should also be concluded to comprehensively guide the site selection of affordable housing.
In summary, this study pays more attention to the micro level of site selection and implementation, and builds a dynamic evaluation model for the suitability of affordable housing site selection based on the comprehensive impact of multiple factors such as livability, urban development potential and land opportunity cost, and improves the suitability assessment evaluation system for affordable housing site selection. Meanwhile, according to the assessment evaluation results of the suitability of comprehensive housing site selection, it is conducive to improving the rationality of Nanjing’s future affordable housing site selection, promoting the optimization and improvement of the relevant policies and technical standards of Nanjing’s affordable housing site selection; moreover, it provides technical references for other cities to carry out research on affordable housing site selection location.
Author Contributions
Conceptualization, Y.F. and S.Z.; methodology, Y.F. and Y.Y.; software, Y.Y.; validation, J.X. and Y.Y.; formal analysis, M.Y. and J.X.; investigation, J.X. and Y.Y.; resources, Y.F. and Y.Y.; data curation, J.X. and Y.Y.; writing—original draft preparation, Y.F.; writing—review and editing, M.Y. and K.L.; visualization, J.X.; supervision, S.Z.; project administration, Y.F. All authors have read and agreed to the published version of the manuscript.
Funding
This research received no external funding.
Institutional Review Board Statement
Not applicable.
Informed Consent Statement
Not applicable.
Data Availability Statement
Not applicable.
Conflicts of Interest
The authors declare no conflict of interest.
References
- Ravit, H. From central to marginal: The trajectory of Israel’s public-housing policy. Urban Stud. 2016, 54, 2432–2447. [Google Scholar] [CrossRef]
- Glass, M.R. Remaking Singapore’s heartland: Sustaining public housing through home and neighbourhood upgrade programmes. Int. J. Hous. Policy 2018, 18, 479–490. [Google Scholar] [CrossRef]
- Whipple, Z.Q. The experience of affordable housing development in USA and Singapore and its reference to China. Hainan Financ. 2011, 5, 55–59,64. [Google Scholar]
- Lin, Y.; Meulder, D.B.; Cai, X.; Hu, H. Linking social housing provision for rural migrants with the redevelopment of ‘villages in the city’: A case study of Beijing. Cites 2014, 40, 111–119. [Google Scholar] [CrossRef]
- Zou, Y. Contradictions in China’s affordable housing policy: Goals vs. structure. Habitat Int. 2014, 41, 8–16. [Google Scholar] [CrossRef]
- Needs, H.F. Commission on Affordable Housing and Health Facility Needs for Seniors in the 21st Century. Cybercemetery 2001. Available online: https://digital.library.unt.edu/ark:/67531/metadc793/ (accessed on 9 June 2022).
- Hui, C.M.; Wong, K.W. Affordable housing in China. Habitat Int. 2006, 30, 275–276. [Google Scholar] [CrossRef]
- Song, Y.; Yves, Z.; Ding, C. Let’s not throw the baby out with the bath water: The role of urban villages in housing rural migrants in China. Urban Stud. 2008, 2, 313–330. [Google Scholar] [CrossRef]
- Yuen, B. Squatters No More:Singapore Social Housing. Glob. Urban Dev. Mag. 2007, 11. Available online: https://www.globalurban.org/GUDMag07Vol3Iss1/Yuen.htm (accessed on 9 June 2022).
- Mohammad, A.M.; Mansor, L.; Yong, R.R. Assessment of residential satisfaction in newly designed public low-cost housing in Kuala Lumpur, Malaysia. Habitat Int. 2010, 34, 18–27. [Google Scholar]
- Jing, D.; Zhao, X. The Analysis of Decision Factors of Our Countiy’s Affordable Housing Location: The Nanjing Case. J. Eng. Manag. 2012, 26, 84–88. [Google Scholar]
- Zhang, A.; Feng, C. A study on the spatial distribution of urban affordable housing: A case study of Langfang City. Urban Dev. Res. 2009, 16, 26–32. [Google Scholar]
- Wang, D.; Jin, X.; Wang, J. Study on site selection and evaluation method of affordable residential land: A Case Study of Nanjing metropolitan area. Urban Plan. 2012, 3, 85–89. [Google Scholar]
- Chen, C. Applying the Analytical Hierarchy Process (AHP) Approach to Convention Site Selection. J. Travel Res. 2006, 45, 167–174. [Google Scholar] [CrossRef]
- Li, B.; Hwangbo, X.; Xiao, Y. Study on location selection of affordable housing space based on tenant satisfaction: A Case Study of Wuhan. J. Hubei Univ. Technol. 2016, 31, 114–119. [Google Scholar]
- An, Q. Application of Big Data in Affordable Housing Layout and Planning: A Case Study of Longhua District, Shenzhen. China Urban Planning Society, Hangzhou Municipal People’s Government. Sharing and Quality-2018 China Urban Planning Annual Conference Proceedings-LRB-20 Housing Construction Planning); China Urban Planning Society, Hangzhou Municipal People’s Government: Hangzhou, China, 2018; pp. 36–49. [Google Scholar]
- Mulliner, E.; Maliene, V. An Analysis of Professional Perceptions of Criteria Contributing to Sustainable Housing Affordability. Sustainability 2015, 7, 248–270. [Google Scholar] [CrossRef]
- Malczewski, J. GIS-based multicriteria decision analysis: A survey of the literature. Int. J. Geogr. Inf. Sci. 2006, 20, 703–726. [Google Scholar] [CrossRef]
- Gan, X.; Zuo, J.; Baker, E.; Chang, R.; Wen, T. Exploring the determinants of residential satisfaction in public rental housing in China: A case study of Chongqing. J. Hous. Built Environ. 2019, 34, 869–895. [Google Scholar] [CrossRef]
- Ibem, E.O.; Alagbe, O.A. Investigating dimensions of housing adequacy evaluation by residents in public housing: Factor analysis approach. Facilities 2015, 33, 465–484. [Google Scholar] [CrossRef]
- Miller, J.S. Feasibility of Using Jobs/Housing Balance in Virginia Statewide Planning. Sustain. Transp. 2010, 8, 1–78. [Google Scholar]
- Tao, L.; Hai, Y. Distribution Prediction Correction Based on the Analysis of Job/Housing Balance between Old and New Districts. Open J. Appl. Sci. 2017, 7, 57–67. [Google Scholar]
- Jegede, F.O.; Ibem, E.O.; Oluwatayo, A.A. The influence of location, planning and design features on residents’ satisfaction with security in public housing estates in Lagos, Nigeria. Urban Des. Int. 2021, 26, 174–196. [Google Scholar] [CrossRef]
- Bulletin of the Nanjing Municipal People’s Government. Circular of the Municipal Government of the People’s Republic of Nanjing on the Issuance of the Measures for the Placement of Qualified Personnel (for Trial Implementation); Bulletin of the Nanjing Municipal People’s Government: Nanjing, China, 2017; pp. 13–22.
- Nanjing Planning Design & Research Institute Co., Ltd. Master Plan for Jiangbei New District, Nanjing 2014–2030; Nanjing Planning Design & Research Institute Co., Ltd.: Nanjing, China, 2016. [Google Scholar]
- Yun, L.I.; Xun, L.I. Analysis of Influential Elements of Urban Land Scale in China. City Plan. Rev. 2006, 10, 14–18. [Google Scholar]
- Adediran, O.J. An Assessment of Service Quality and Airport Elements Influential to Travellers’ Experience at Ilorin International Airport. J. Tour. Manag. Res. 2020, 7, 86–101. [Google Scholar] [CrossRef]
- Wei, Y.; Li, Q. Survey on Particle Swarm Optimization Algorithm. Eng. Sci. 2004. [Google Scholar] [CrossRef]
- Dong, Y.; Zhang, G.; Hong, W.C.; Xu, Y. Consensus models for AHP group decision making under row geometric mean prioritization method. Decis. Support Syst. 2010, 49, 281–289. [Google Scholar] [CrossRef]
- Wang, G.; Qin, L.; Li, G.; Chen, L. Landfill site selection using spatial information technologies and AHP: A case study in Beijing, China. J. Environ. Manag. 2009, 90, 2414–2421. [Google Scholar] [CrossRef] [PubMed]
- Liu, X.; Huang, F.; Wang, P. GIS Spatial Analysis Principle and Method; Science Press: Beijing, China, 2005. [Google Scholar]
- Zhang, B.; Su, H. Study on spatial measure of 15-minute community life circle in Beijing based on Poi. World Res. 2018, 5, 17–24. [Google Scholar]
- Loo, B.P.Y.; Chen, C.; Chan, E.T.H. Rail-based transit-oriented development: Lessons from New York City and Hong Kong. Landsc. Urban Plan. 2010, 97, 202–212. [Google Scholar] [CrossRef]
- Du, X.; Zhang, Y.; Ren, G. Transit Planning in medium and small cities based on Tod Model. J. Transp. Eng. Inf. 2010, 2, 109–114. [Google Scholar]
- Nie, M. A theoretical review of the Tod Model. Theor. Res. Urban Constr. Electron. Ed. 2015, 5. [Google Scholar]
- Zhao, G.; Zheng, X.; Yuan, Z.; Zhang, L. Spatial and Temporal Characteristics of Road Networks and Urban Expansion. Land 2017, 6, 30. [Google Scholar] [CrossRef] [Green Version]
- Niu, S. A Research on the Built Environment of Rail Transit Station Areas Based on Green TOD Theory. Archit. Pract. 2019, 2, 17–18. [Google Scholar]
- GB 50180-1993; Code of Urban Residential Areas Planning & Design. Ministry of Construction ER, China: Beijing, China, 2016.
- NJGBC04-2005; The Guide of Public Facilities Planning in New Developed Areas in Nanjing. Nanjing Urban Planning Bureau Nanjing Urban Planning & Research Center: Nanjing, China, 2006.
- Li, Y.; Jiao, Y.; Gao, H.; Zhang, L. Research on the Construction Characteristics of Affordable Housing in China. Urban Dev. Stud. 2020, 27, 19–25. [Google Scholar]
- Schoen, Y.G. Conversion of Residential Neighborhoods into Affordable Assisted Age-in-Place Communities. Master’s Thesis, Massachusetts Institute of Technology, Cambridge, MA, USA, 2011. [Google Scholar]
- Chris, B.; Alex, K. Low-wage jobs-housing fit: Identifying locations of affordable housing shortages. Urban Geogr. 2016, 37, 883–903. [Google Scholar]
Figure 1.
(a) Administrative divisions of Jiangbei New District; (b) Administrative divisions of Direct, Management Area (Luhe District, Direct Management Area, Pukou District, Coordinative Area under Jiangbei New District, Communal Construction Area under Jiangbei New District, Direct Management Area under Jiangbei New District, Center of Jiangbei Downtown; Yanjiang Neighborhood, Taishang Neighborhood, Pancheng Neighborhood, Dachang Neighborhood, Changlu Neighborhood, Dingshan Neighborhood, Getang Neighborhood).
Figure 2.
Spatial distribution of current affordable housing (location of affordable housing).
Figure 2.
Spatial distribution of current affordable housing (location of affordable housing).
Figure 3.
Assessment model of site selection of affordable housing.
Figure 3.
Assessment model of site selection of affordable housing.
Figure 4.
Multi-ring buffer zone analysis of public landscape greenspace.
Figure 4.
Multi-ring buffer zone analysis of public landscape greenspace.
Figure 5.
(a) Multi-ring buffer zone analysis of rail transit; (b) Multi-ring buffer zone analysis of bus stop.
Figure 5.
(a) Multi-ring buffer zone analysis of rail transit; (b) Multi-ring buffer zone analysis of bus stop.
Figure 6.
(a) Multi-ring buffer zone analysis of educational facility; (b) Multi-ring buffer zone analysis of commercial service facility; (c) Multi-ring buffer zone analysis of medical facility; (d) Multi-ring buffer zone analysis of cultural and sports facility.
Figure 6.
(a) Multi-ring buffer zone analysis of educational facility; (b) Multi-ring buffer zone analysis of commercial service facility; (c) Multi-ring buffer zone analysis of medical facility; (d) Multi-ring buffer zone analysis of cultural and sports facility.
Figure 7.
Multi-ring buffer zone analysis of industrial park.
Figure 7.
Multi-ring buffer zone analysis of industrial park.
Figure 8.
Multi-ring buffer zone analysis of spatial agglomeration.
Figure 8.
Multi-ring buffer zone analysis of spatial agglomeration.
Figure 9.
(a) Comprehensive assessment diagram of public service facility element; (b) Comprehensive assessment diagram of public transportation element.
Figure 9.
(a) Comprehensive assessment diagram of public service facility element; (b) Comprehensive assessment diagram of public transportation element.
Figure 10.
Comprehensive assessment diagram of site selection influential elements of affordable housing.
Figure 10.
Comprehensive assessment diagram of site selection influential elements of affordable housing.
Table 1.
Comparison of weight analysis methods.
Table 1.
Comparison of weight analysis methods.
| Weight Analysis Method | Advantage | Disadvantage |
|---|
| AHP | Major influential elements are directly identified with broad indicators involved. | Multiple revisions in the judgement matrix give rise to more subjective results. |
| Logistic Regression Analysis | A small amount of major information is effectively computed through software. | Variables other than major information are likely to be ignored. The result highly relies on samples with strong subjectivity. |
| Entropy | Objective data reflects the difference among indicators. | The indicator’s weight highly relies on samples, and paralleled comparison among samples is needed. |
Table 2.
Comparison of spatial analysis methods.
Table 2.
Comparison of spatial analysis methods.
| Spatial Analysis Method | Advantage | Disadvantage |
|---|
| (Multiple influential elements analysis) | The importance of influential elements is reflected, and the assessment result is scientific and clear [27]. | Many parameters are involved in the analysis of the assessment model, so the analysis process is restrained by the number of indicators. |
| PSO (Particle swarm optimization algorithm) | It has a faster computing speed and smaller computing scale than the traditional method [28]. | Consecutive space is required during the computing process. |
Table 3.
Summary of site selection influential elements.
Table 3.
Summary of site selection influential elements.
| Number | Influential Element of Site Selection | Frequency of Occurrence | Number | Influential Element of Site Selection | Frequency of Occurrence |
|---|
| 1 | Rail transit | 25 | 9 | Public landscape greenspace | 10 |
| 2 | Bus stop | 25 | 10 | Spatial agglomeration | 18 |
| 3 | Educational facility | 22 | 11 | Commercial service facility | 17 |
| 4 | Medical facility | 22 | 12 | Land cost | 4 |
| 5 | Cultural and sports facility | 12 | 13 | Natural environment | 2 |
| 6 | Business center | 15 | 14 | Society constitution | 1 |
| 7 | Industrial Park | 15 | 15 | Policy support | 8 |
| 8 | Environmental pollution | 7 | 16 | Large evacuation refuge | 2 |
Table 4.
Influential elements set of affordable housing site selection in the preliminary interview.
Table 4.
Influential elements set of affordable housing site selection in the preliminary interview.
| Influential Element | Influential Element | Frequency of Mention |
|---|
| Policy element | Policy support | 5 |
| Landscape environment element | Park landscape greenspace | 7 |
| Environmental pollution | 5 |
| Public transportation element | Rail transit | 20 |
| Bus stop | 12 |
| Public service facility element | Educational facility | 15 |
| The comprehensive commercial service facility | 12 |
| Medical facility | 11 |
| Cultural and sports facility | 5 |
| Employment element | Business center | 4 |
| Industrial park | 17 |
| Spatial agglomeration element | Spatial agglomeration | 9 |
Table 5.
Descriptive analysis and statistical result of influential elements.
Table 5.
Descriptive analysis and statistical result of influential elements.
| Influential Element | Influential Element | Mean Value | Maximum Value | Minimum Value | Standard Deviation | Mode | Total N |
|---|
| Policy element | Policy support | 2.14 | 5 | 1 | 1.35 | 3 | 180 |
| Landscape environment element | Park landscape greenspace | 2.98 | 5 | 1 | 1.05 | 4 | 180 |
| Environmental pollution | 2.13 | 5 | 1 | 1.35 | 2 | 180 |
| Public transportation element | Rail transit | 4.35 | 5 | 1 | 0.45 | 5 | 180 |
| Bus stop | 3.85 | 5 | 1 | 0.76 | 5 | 180 |
| Public service facility element | Educational facility | 3.25 | 5 | 1 | 0.90 | 5 | 180 |
| Commercial service facility | 2.79 | 5 | 1 | 1.25 | 4 | 180 |
| Medical facility | 3.13 | 5 | 1 | 0.89 | 5 | 180 |
| Cultural and sports facility | 2.98 | 5 | 1 | 2.35 | 4 | 180 |
| Employment element | Industrial park | 4.10 | 5 | 1 | 0.68 | 5 | 180 |
| Business center | 1.35 | 5 | 1 | 1.23 | 3 | 180 |
| Spatial agglomeration element | Spatial agglomeration | 2.51 | 5 | 1 | 2.38 | 3 | 180 |
Table 6.
The analytic hierarchy process model of site selection.
Table 6.
The analytic hierarchy process model of site selection.
| Goal | Criteria | Number | Element | Number |
|---|
| AHP assessment model of site selection of affordable housing | Landscape environment element | U1 | Park landscape greenspace | U11 |
| Public transportation element | U2 | Rail transit | U21 |
| Bus stop | U22 |
| Employment element | U3 | Industrial park | U31 |
| Public service facility element | U4 | Educational facility | U41 |
| Commercial service facility | U42 |
| Cultural and sports facility | U43 |
| Medical facility | U44 |
| Spatial agglomeration element | U5 | Spatial agglomeration | U51 |
Table 7.
Judgement matrix of criteria.
Table 7.
Judgement matrix of criteria.
| Site Selection of Affordable Housing | Policy Element | Landscape Environment Element | Public Transportation Element | Employment Element | Public Service Facility Element | Spatial Agglomeration Element | Wi |
|---|
| Landscape environment element | 5 | 1 | 1/9 | 1/9 | 1/7 | 3 | 0.0582 |
| Public transportation element | 7 | 9 | 1 | 3 | 3 | 7 | 0.4242 |
| Employment element | 7 | 9 | 1/3 | 1 | 3 | 7 | 0.2941 |
| Public service facility element | 7 | 7 | 1/3 | 1/3 | 1 | 7 | 0.1956 |
| Spatial agglomeration element | 1/3 | 1/3 | 1/7 | 1/7 | 1/7 | 1 | 0.0279 |
Table 8.
Judgement matrix of public transportation element.
Table 8.
Judgement matrix of public transportation element.
| Public Transportation Element | Rail Transit | Bus Stop | Wi |
|---|
| Rail transit | 1 | 7/5 | 0.5833 |
| Bus stop | 5/7 | 1 | 0.4167 |
Table 9.
Judgment matrix of public service facility element.
Table 9.
Judgment matrix of public service facility element.
Public Service Facility
Element | Educational Facility | Commercial Service Facility | Medical Facility | Cultural and Sports Facility | Wi |
|---|
| Educational facility | 1 | 3 | 1 | 5 | 0.3908 |
| Commercial service facility | 1/3 | 1 | 1/3 | 3 | 0.1511 |
| Medical facility | 1 | 3 | 1 | 5 | 0.3908 |
| Cultural and sports facility | 1/5 | 1/3 | 1/5 | 1 | 0.0673 |
Table 10.
Weight distribution of site selection AHP assessment model.
Table 10.
Weight distribution of site selection AHP assessment model.
| Goal | Criteria | Wi | Element | Wi |
|---|
| AHP assessment model of site selection of affordable housing | Landscape environment element | 0.0582 | Park landscape greenspace | 0.0582 |
| Public transportation element | 0.4242 | Rail transit | 0.2474 |
| Bus stop | 0.1768 |
| Employment element | 0.2941 | Industrial park | 0.2941 |
| Public service facility element | 0.1956 | Educational facility | 0.0764 |
| Commercial service facility | 0.0296 |
| Medical facility | 0.0764 |
| Cultural and sports facility | 0.0132 |
| Spatial agglomeration element | 0.0279 | Spatial agglomeration | 0.0279 |
| Publisher’s Note: MDPI stays neutral with regard to jurisdictional claims in published maps and institutional affiliations. |
© 2022 by the authors. Licensee MDPI, Basel, Switzerland. This article is an open access article distributed under the terms and conditions of the Creative Commons Attribution (CC BY) license (https://creativecommons.org/licenses/by/4.0/).


