Review

Effectiveness of Drought Indices in the Assessment of Different Types of Droughts, Managing and Mitigating Their Effects

College of Hydraulic Science and Engineering, Yangzhou University, Yangzhou 225009, China
*
Author to whom correspondence should be addressed.
Climate 2022, 10(9), 125; https://doi.org/10.3390/cli10090125
Submission received: 23 June 2022 / Revised: 19 August 2022 / Accepted: 23 August 2022 / Published: 25 August 2022
(This article belongs to the Special Issue Natural Disasters and Extreme Hazards under Changing Climate)

Abstract

:
Droughts are the most destructive catastrophes in the world. The persistence of drought is considered to cause many challenges for both humans and animals and ruins the ecosystem. These challenges have encouraged scientists to search for innovative methods and models that are effective for assessing and predicting drought events. The use of drought indices has been extensively employed in many regions across the globe and their effectiveness demonstrated. This review illustrates the effectiveness of drought indices in the assessment of droughts, with a focus on drought management and mitigation measures. Additionally, several ways of managing drought risk and proactive strategies that need to be implemented to mitigate droughts have been illustrated. In conclusion, this article suggests that drought mitigation should be done more naturally, in ways that strongly protect the environment rather than involve engineering projects which might cause the degradation of rivers and land, and damage the ecosystem.

1. Introduction

Droughts are natural catastrophes that, depending on their severity and duration, can have dangerous consequences for both humanity and the environment, notably on societal, economic, and ecological systems [1]. Many parts of the world are experiencing droughts because of undeniable variations in the climate leading to the scarcity of precipitation. In recent decades, drought incidents have occurred almost everywhere in the world, such as the North America [2,3], Africa which is a more highly vulnerable continent to drought incidence than other continents, especially in the sub-Saharan countries [4,5], Asia [6], Australia [7], and Europe [8]. The rise in global warming might affect the hydrological cycle, which is the main factor that influences extreme climate change related events such as drought, floods, and storms [9]. People who live there are either directly or indirectly affected by not having enough water or food and the spread of certain diseases [10,11]. For example, the Food Security and Nutrition Working Group (FSNGW2010) reported that about 100,000 people are victims of drought catastrophes every year in Burundi [12], and in 2012 the World Bank reported that the economy of west Africa declined from 68.4 to 17.4 billion FCFA because of the 2000 drought that caused a great decline in peanut production; also the revenues from grain production such as sorghum fell and millet declined from 30 to 12 billion FCFA in the same year [13]. During the year of 2021 only, a global estimation of natural hazards indicated that a total number of 432 disastrous events were recorded including both drought and floods. Over 101.8 million people were directly affected, and 10,492 deaths were registered together with an estimate of economic losses of about USD 252.1 billion [14]. Compared to other hazard events, such as wildfires and floods that immediately strike the region, all types of droughts aggravate gradually over time except flash drought, which can occur and intensify drought severity within a short time. The realization of drought incidents is typically observed when the community and organisms begin to feel their consequences. That is why the exact determination of a drought’s starting, ending, and recovering times is complicated.
Droughts must be accurately assessed to effectively plan and manage the environment, water resources, and ecosystems [15]. In recent decades, the application of drought indices has been a major concern for both scholars and scientists and a greater emphasis has been placed on to understand drought phenomenon and to analyze the characteristics of drought [16,17,18,19]. Considerable effort has been expended on developing reliable and effective statistical drought prediction models through the development of new or improved methods and the selection of indicators [20,21,22,23]. The fact that drought is strongly linked to climatological events means that parameters including precipitation, air temperature, and streamflow can serve as excellent indicators of whether drought is occurring. Drought indices can visualize a drought incident’s occurrence, magnitude, lasting time, and intensity. Therefore, the transformation of drought indicators into drought indices is indispensable [24]. It is tough to identify the leading cause of a drought. It is commonly known that it occurs in the case of the non-existence of, or less than average precipitation, and human activities such as land use, mining, deforestation, and poor management of water re-sources can easily aggravate both the frequency and severity of drought [25,26]. Many studies have been carried out to monitor and quantify drought by applying various drought indices [27,28,29]. However, there is limitation on the knowledge and the understanding of societal-economic consequences of drought and drought mitigation strategies. This study aims to achieve a deeper understanding of the causes and societal-economic effects of drought and to illustrate the strategies for its mitigation. Moreover, drought risk management policies have been highlighted and discussed. To achieve the goals of this review, the authors developed a strategical methodology of searching published articles exactly related to drought monitoring and climate change. For suitable and reliable investigation, Google Scholar and PubMed were the sources. In addition to the computerization investigation, a manual search was also conducted.

2. Results

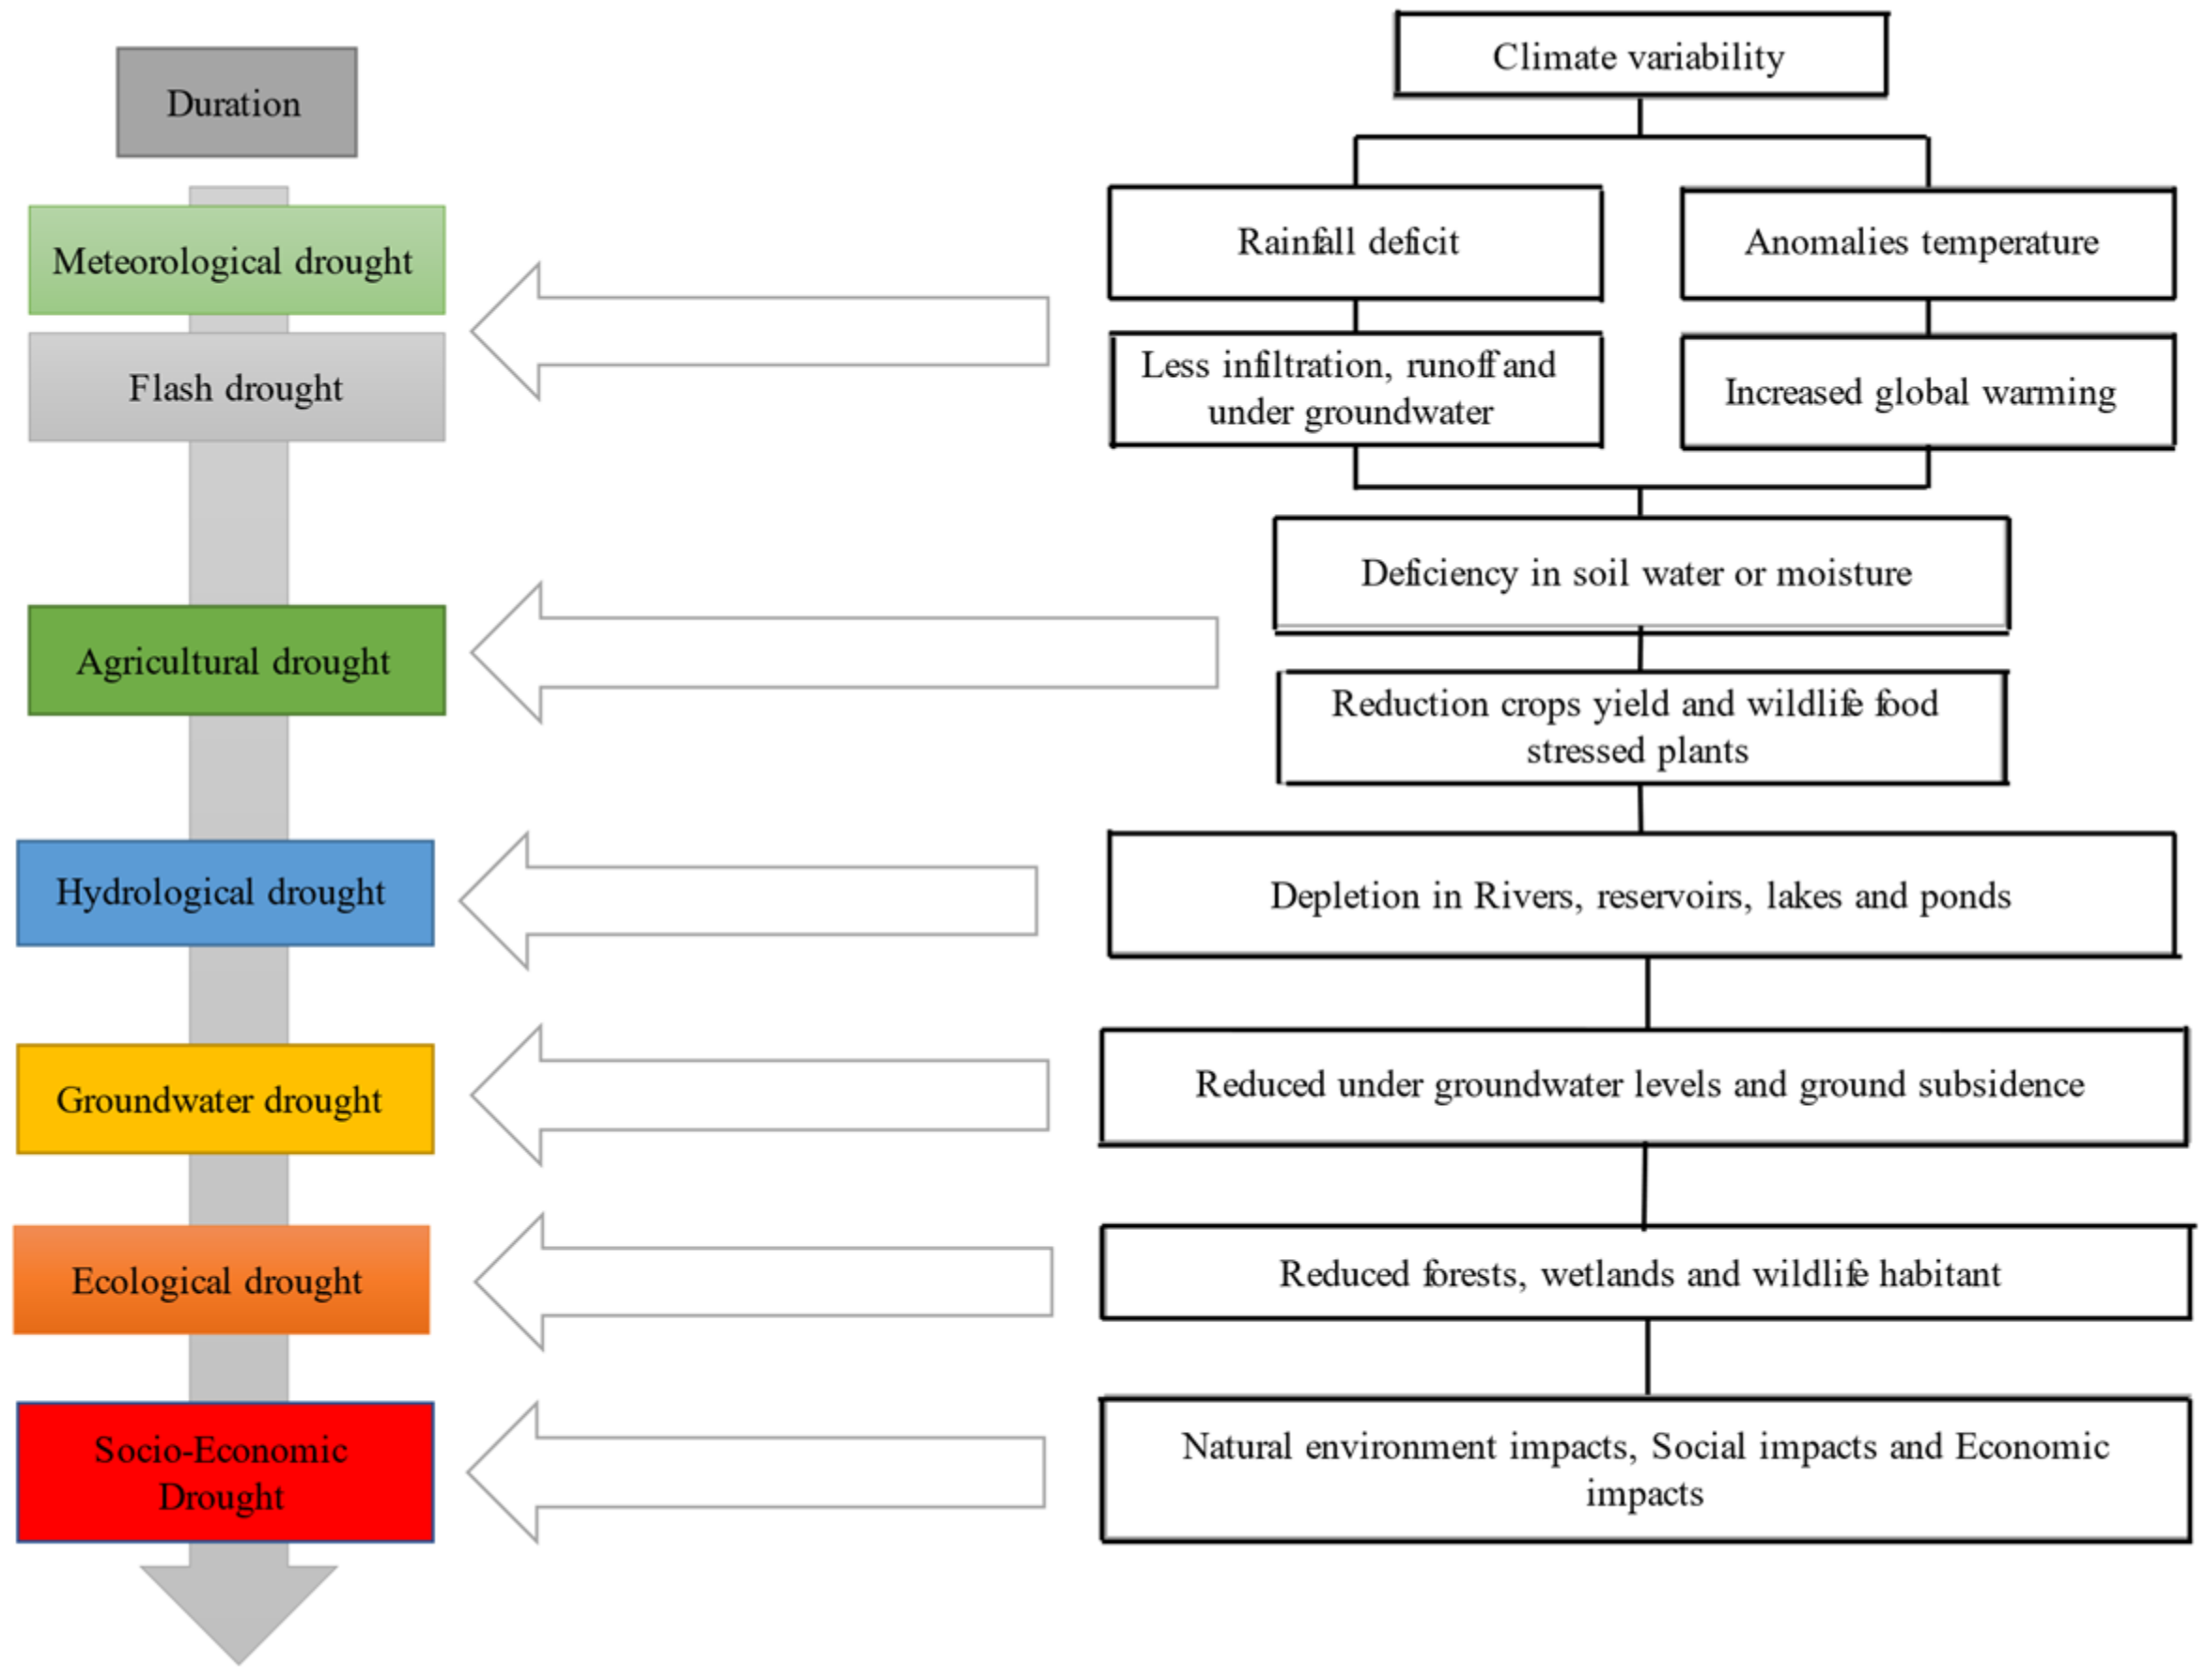
2.1. Types of Droughts

Different types of droughts have been defined and classified from a disciplinary point of view. The definitions were classified into four categories: meteorological, agricultural, hydrological, and socio-economic. These four categories can be grouped into two: the first to third approaches are concerned with measuring drought as a physical phenomenon, and the fourth discusses drought in terms of supply and demand for water, following the impacts of water scarcity as it spreads throughout socio-economic sectors [30]. Besides those commonly known and widely considered by many researchers, Crausbay et al. [31] defined ecological drought, which is a novel type of drought that takes into account the environmental, climatic, hydrological, socio-economic, and cultural aspects of drought, and Peters [32] defined groundwater drought which is key in drought phenomenon as reduced groundwater levels and discharges to surface water bodies result from groundwater. A study that first coined the term “flash drought” was conducted to call attention to the abnormally quick intensification of some droughts and to better differentiate the events from typical droughts that progress more slowly [33], therefore droughts of various types may coexist or occur separately.

2.1.1. Meteorological Drought

A considerable drop in typically expected rainfall over a vast area is a meteorological drought. It is usually a measure of how far precipitation deviates from normal over time and one among the driving forces behind the occurrence of agricultural drought [34]. Meteorological drought can be characterized on a decadal, yearly, monthly, and daily scale [35]. Typically, these definitions are region-specific, implying a thorough understanding of the region’s climatological conditions.

2.1.2. Agricultural Drought

Agricultural drought is declared in the event of insufficient soil moisture and soil water to meet the needs of a given crop and pasture growth at a specific time [36,37]. Agronomists are frequently preoccupied with soil moisture shortages and how they affect crop development and production. Agricultural drought is determined by rainfall and how well that water is used. Water scarcity during critical crop stages can severely limit agricultural output [38], even short also water scarcity is considered a particular area’s long-term average balance of precipitation and evapotranspiration. In contrast to natural vegetation, agricultural drought is specifically concerned with cultivated plants.

2.1.3. Hydrological Drought

The term "hydrological drought" refers to a lack of surface and groundwater supplies. The way this shortage manifests itself throughout the hydrological cycle is of greater interest to hydrologists and this is testified by numerous studies that have been conducted to monitor, assess, and predict hydrological drought in recent years from different regions of the globe [39,40,41,42,43,44]. Everyday water supplies cannot be sustained when water levels in streams, reservoirs, groundwater, and soil are below average. A catchment-based hydrological drought analysis is used. It is measured in streamflow and pools, lakes, and underground water levels, among other places [45]. Hydrological measurements are not the first signs of drought because of a lag between a shortage of rainfall and a deficit in river water, lakes, and dams. When rainfall is low or non-existent for a prolonged period, scarcity manifests itself as a drop in both above-and groundwater levels.

2.1.4. Socio-Economic Drought

A water deficit begins to harm society, both personally and communally, by reducing the availability of goods that are dependent on precipitation. Reduced water in lakes, rivers or ponds might cause death of fishes or extremely reduce their reproduction, farmers are not getting water to irrigate their farming land and gardens, for instance in Texas during 2011 occurred a severe drought and cause losses of $7.62 billion in the sector of agriculture alone [46], also industries and other activities paralyze due to the insufficient water supply. Therefore, a socio-economic drought emerges when water resources are not enough to meet the water demand [47]. Most socio-economic definitions of drought, in more abstract terms, link it to the supply and demand for water as a commercial good and industrial service.

2.1.5. Ecological Drought

Ecological drought is defined as a periodic shortage of water availability that pushes ecological systems ahead of their vulnerability thresholds, affects ecosystem services, and causes feedback loops in both natural and human systems. Due to the direct relationship between ecological environment and both human survival and development [48], ecological drought has become a major concern in recent years and a new ecological drought index has been introduced [49].

2.1.6. Groundwater Drought

A groundwater drought is a momentary drop in subsurface water availability that lasts for an extended time. A distinctive class of drought that resulting from the decrease in groundwater recharge was considered as groundwater drought by Goodarzi et al. [50], and Eltahir and Yeh [51] stated groundwater as the effects of drought resulting from meteorological to hydrological to agricultural drought that impact groundwater storage. Groundwater drought can occur naturally or because of human activities [52].

2.1.7. Flash Drought

Flash drought is distinguished by an infrequently quick beginning, followed by several weeks of accelerated intensification, resulting in consequences on one or more sectors. It occurs in every region of the world, and it has drawn the attention of many researchers in recent years [53,54]. Figure 1 shows the classification of different types of droughts.

3. Socio-Economic and Environmental Impacts of Drought

3.1. Socio-Economic Impacts of Drought

Many people in the most developing countries rely on rain-fed agriculture and find work in small businesses. A hydrological drought, for instance, will automatically affect hydropower generation, potentially resulting in a national electricity deficit and, as a result, joblessness. Even though a lack of rainfall causes all droughts, drought usually affects agriculture first, as it is the most vulnerable economic sector [30,55]. Here are the following social and economic consequences of a drought:
  • The most severe effects of the drought appeared to be economical, with significant effects on household income.
  • Food insecurity and poor sanitation, spreading of more diseases lead to losses of life, result in the nation’s economic decline.
  • Increasing joblessness rate due to the reduction in crop yields and the failure of business-related activities; less employment in the agriculture sector or other jobs in rural areas.
  • The temporary dispersion of family members moving to the regions with economic opportunities, subpopulation, and urban enlargement might result in pollution and increasing criminal activity.
  • Less water and de-vegetation of the landscape drive livestock to the lower number, when there might be many disasters that supplement droughts, such as soil erosion, wildfires, and heatwaves. All this affects both public health and wealth.

3.2. Environmental Impacts of Droughts

The occurrence of drought in a region, resulting in degradation of land and water resources definitely have a significant impact on the existing environment. Drought does not only lead to the lack of water and food for humans but also for wildlife [56,57]. Biodiversity depends on the forest and any kind of vegetation, water (lakes, ponds, and rivers), including moisture in soil and atmosphere, for their existence. The depletion of lakes and rivers, wildfires, and the dryness of forest as results of drought, cause death or migration of wildlife such as hippopotamus and elephants and other organisms that are living in the forest and in the water [58]. In many parts of the world the cities are increasingly being vulnerable to droughts [59], and this might cause migration of the population and result in wide expansion of the urbanization and water pollution. The urbanization leads to high water demands of cities [60]. The construction of new infrastructures for the victims of drought, and water supply systems changes the form of natural landscape and cause death to the organisms that are living in soil, all these result in impacting the environment. For instance, Van de Vuurst and Escobar [61], stated that the relocation of cities because of events that are allied to the climate change could lead to a major biodiversity catastrophe, unless there is an implementation of multidisciplinary and sustainable transition.

4. Drought’s Causes and Their Characteristics

Droughts are generated naturally by coalition interaction between regional and distant influences. Droughts are caused by the nonexistence of rainfall in a specific area for an extended period. Droughts are caused by various variables, including climate change, land-atmosphere interactions, ocean temperature, jet stream variations, and changes in the local topography. Drought can be aggravated by human activities such as deforestation, land usage, and poor water resources management [62]. Therefore, there are both natural and artificial causes of drought.

4.1. Natural Causes of Drought

Drought is caused by natural factors such as changing weather patterns, air circulation, fluctuating ocean temperatures, and decreased soil moisture. Many places in the world are becoming more dangerous to live in due to climate change, causing heat and increased evaporation. At the same time other areas receive less rainfall, both increasing the risk of drought.

4.2. Artificial Causes of Drought

Agriculture: land use, as well as the use of large amounts of water to irrigate crops. Farmers can deplete lakes, rivers, and groundwater by over taking a greater volume of water than the amount of water falling as precipitation. The rapidly growing population leads to a high demand for food, which is linked to the increase of farming area to produce enough food to meet the demand of the population. Agriculturalists get water from groundwater and river supplies for irrigation to keep their plants alive; this causes a severe decline in the water bodies availability, which lead to the occurrence of hydrological and groundwater drought [63].
Hydraulic structures: large dams built across rivers to generate electricity and store water in reservoirs can restrict river water flow downstream, resulting in drought below the dam. The construction of hydraulic infrastructures requires the use of land and sometimes relocation of people, leading to the urbanization and modifications of landscape, which often intensify the impacts of climate change on streamflow [64].
Deforestation and mining: in the less developed countries, the level of poverty, il-literacy, and lack of alternative sources of livelihood is high and these are the factors that directly cause people to involve in activities such as over exploitation of natural, cutting trees for charcoal burning and making wooden materials, hunting among others to earn sustenance [65]. Mining activities with a lack of technology may damage the aquifer which is the permeable rock protecting water from leaking away, and damage the earth surface automatically leading to the deterioration of the ecological environment, the result is drought [66,67]. Moreover, the amount of water held in the soil can be reduced by removing trees and mining. Surface run-off causes water to fall and wash off the earth, leaving the ground exposed to erosion and desertification, which can quickly lead to drought.

4.3. Drought Characteristics

Drought frequency is described by the number of times a drought strikes in a period. Drought duration curves and reoccurrence period curves are indispensable tools for predicting droughts occurrence. Drought volume is a common way to describe the severity of a drought. The entire sum of shortages is “drought volume during a drought event”. It can be calculated by adding up precipitation deficits over time. The need for precipitation is characterized by the difference between the expected amount of rain and the actual rainfall. Various methods for representing drought are suitable for providing significant amounts of information, such as graphical methods and mapping techniques, among others [68]. Duration: each drought event has its onset and ending time and might last less than three months before subsiding, yet they may last two years. The effects of drought severity are strictly correlated to the commencement time of the rainfall scarcity, the intensity of that event, and its length. Droughts have a much more potential impact when they last from one season to the next and from one year to the next; groundwater sources continue to be exhausted, impacting a considerable number of users. From a farming and hydropower generation standpoint, successive years of drought reduce farming revenue and jeopardize the financial viability of farm or ranch operations. Drought intensity is a value that indicates how severe the drought is; greater intensity is significant, the more the drought is catastrophic [69]. It is calculated by taking the magnitude of a drought event and dividing it by the duration. The quantity of rainfall shortage and the severity of the consequences of that shortage are linked and referred to as “intensity”. It is commonly quantified by the deviation of various climatical indicators from ordinary and is strongly related to the extended duration in determining effect, furthermore, concerning severity, indicators of drought are used to assess how severe a drought is. It is both drought duration, intensity, and spatial extent, that determine the severity of a drought incident. It is also dependent on the demands placed on a county’s water sources by human activities and vegetation. Drought characteristics, inter-arrival time, and drought conditions are critical for planning and managing available water resources. For this reason, Montaseri et al. [70] conducted a comprehensive study to analyze and monitor the long-term behavior of drought characteristics in twelve parts of the world with varying climatic conditions using seven meteorological indices and Monte-Carlo simulation methods. Their findings illustrated that some of the indices are better for the analyses of drought whereas others indicated unreliable results for predicting long-term drought characteristics and highlighted the advantages of comparing drought indexes.

5. Drought Indicators

To describe and indicate the aforementioned characteristics of drought, variables and drought indicators are required for their significant role in defining the level of drought reaction and timing, quantifying, monitoring, and detecting drought conditions [71]. Frequently, drought indicators are classified into two categories: meteorological indicators that include climatic parameters such as precipitation, temperature and evapotranspiration, and hydrological indicators that involve parameters such as streamflow, soil moisture and snowpack, groundwater, and reservoir levels [72,73].

6. Drought Indices and Their Effectiveness in Monitoring Drought

Drought indices are numerical representations of drought severity which are calculated based on climatic or hydro-meteorological inputs. Indicators of drought are used to quantify the magnitude, location, timing, as well as durability of drought episodes. The deviation from the normal of an index is referred to as the severity. Drought indices can help in making the composite correlation easier by providing useful information tools to many concerned parties, practitioners, and the general community [74].
Many drought indices have been proposed, for instance, the Standardized Precipitation Index (SPI) introduced by Mckee et al. [75], and the (SPEI) Standard Precipitation Evapotranspiration Index was first developed by Vicente et al. [76]. It is a revised indicator of drought that is particularly well-suited to research into the impact of global warming on the severity of drought. The SPEI is calculated like SPI. The Palmer Drought Severity Index (PSDI) and Crop Moisture Index (CMI) were pioneered by Palmer [77] and Alley [78], and the Drought Area Index (DAI) was developed by Bhalme et al. [79] for assessment of moisture during the summer Indian monsoon. As a result, it may take into account the drought’s durability. It was specifically created for India, but it can be standardized for other parts of the world. The China Z Index (CZI), first used and developed in 1995 by the National Climate Centre of China, has the capability to identify droughts of various durations [80]. The Rainfall Anomaly Index (RAI) that incorporates a rating process for assigning magnitudes of both negative and positive anomalies in rainfall was compared to SPI to characterize droughts and investigate their impacts on agriculture production in Nepal; the results illustrated that both indices could similarly analyze the severity of drought [81].
In recent decades and today, drought indices have been widely used as tools to assess and monitor drought conditions [82,83,84]. For assessing the most prominent indexes for each type of drought, Keyantash et al. [85] used a weighted total of six evaluation criteria for the period 1980–2015, and Li et al. [86] used two universally used meteorological drought indexes, the SPI and SPEI, to elucidate drought conditions across China. The results revealed that SPEI characterizes on the overall increase in drought severity, area and frequency from 1998 to 2015 when compared to 1980–1997, owing to rising potential evapotranspiration. Given the possibility of increased water evaporation with a rising temperature, their research recommended that SPEI be a better option for drought detecting when facing climatical variation than SPI. Drought indices play a significant role in detecting, monitoring, and planning for drought incidences. Ogunrinde et al. [87] conducted a study to evaluate the effectiveness of 1, Thornthwaite, 2, Hargreaves, and 3, Penman–Monteith potential evapotranspiration as inputs into SPEI concerning identified historical incidents of drought for five agroecological zones in Nigeria. The results illustrated that all models correlated with one another, but SPEI-H vs. SPEI-P showed higher correlation for all timesteps than SPEI-P vs. SPEI-T and SPEI-H vs. SPEI-T. In addition, the results generated by the indicators were compared to that of the Emergency Events Database (EM-DAT). Though the EM-DAT indicates that SPEI-P has a higher comparative predictive capability, they found SPEI-H to be a suitable alternative for places with a scarcity of data. Drought indices are critical tools for quantifying and comparing characteristics such as durability, severity, and extent in the areas characterized by different climate and hydrological regimes. Stagge et al. [88] conducted a study to determine whether SPEI is considerably different from SPI. Their study concluded that SPEI includes PET in the calculation, which SPI does not. Therefore, SPEI is highly recommended for the quantification of drought. In a study on the Flash droughts affecting the study domain of southeastern Australia, Parker et al. [89] stated that flash droughts struck in all seasons. They used the same study domain to precisely demonstrate the effectiveness of two indices, the Evaporative Demand Drought Index (EDDI) and the Evaporative Stress Index (ESI) in monitoring flash-drought development compared to monitoring precipitation to capture its beginning. Kitachew et al. [90] investigated the expansion of drought through the hydrological cycle, focusing on evaluating the effects of drought on an underground water-fed wetland ecosystem. They also used meteorological drought indices to assess the severity of meteorological droughts and created and employed a methodology for determining subsurface water droughts and their rapid spread within the aquifer. The results revealed an attenuation of droughts in the groundwater resources. The spread of droughts in the hydrological cycle illustrated that not all meteorological droughts result in underground water scarcity. The research declared an expansion of drought in wetland areas. Projecting the impacts of climate change on drought patterns over East Africa, Haile et al. [91] assessed upcoming variations of drought across Eastern African countries by compering SPI and SPEI indices. For determining the coming droughts, SPEI was used because it can incorporate temperature effects. The findings confirmed that drought fluctuations over Eastern Africa regions maintain the “dryness becoming more drier, wetness becoming more wetter” model. Kalisa et al. [92] applied the Spatial Multi-Criterion Decision Making (SMDM) algorithm to an integrated approach of Ordinary Least Square (OLR) and the Hurst exponent to drought assessment over East Africa at various time scales from 1982 to 2015. Their report combined four drought indicators to create a spatial drought risk mapping; SPEI, SPI, Vegetation Condition Index (VCI), and Temperature Condition Index (TCI) were among the indicators. Detrended Fluctuation Analysis (DFA-1) represented merged Hurst exponent maps at one month timescale, whereas OLR-1 represented merged drought indices trends, at one month timescale. The findings of this analysis revealed that SPEI, SPI, and VCI have both decreasing and increasing trends, while TCI showed only downward trends. Furthermore, the VCI and TCI indices have been highlighted to be most suitable for predicting rice yield by Shams et al. in a study conducted on the assessment of drought in the paddy rice farms in Iran [93].
Zarei et al. [94] used meteorological information from 22 stations having various climate conditions for the calculation of (RDI) Reconnaissance Drought Index and the Effective Reconnaissance Drought Index (eRDI) values and compared their results to evaluate drought severity in Iran. The results stated that in humid stations, the difference of the average between RDI and eRDI indices was not considerable at the 5% level. Still the mean difference between RDI and eRDI was substantial at the 5% level in the stations located in hyper-arid and arid climate areas. In hyper-arid and arid regions, it is recommended that RDI be replaced with eRDI. For the SPEI, it is critical to thoroughly investigate drought tendencies in higher elevation regions over a range of timescales; these recommendations have correspondence with the study evaluated the sensitivity of SPI, agricultural standardized precipitation index (aSPI), RDI and eRDI meteorological drought indices to predict rainfed maize yield in Sinalao, Mexico [95]. Feng et al. [96] used information from 274 meteorological stations distributed in the Qinghai-Tibet Plateau (QTP) and its neighboring zones, for 1970 to 2017. The study concluded that the SPEI trend showed altitude dependency, with the regions with altitude higher than 4000 m having a tendency for change that was approximately 6.3 times higher compared to those lower than 4000 m. This was primarily due to decreasing temperature and PET trends and increasing precipitation. Finally, both QTP and its nearby regions will keep getting dry and wet in the future, with the likelihood of future drought increasing in the summer. Wang et al. [97] developed a daily SPEI dataset according to the information record for 58 years (1961–2018) at four hundred and twenty-seven (427) meteorological stations distributed across China’s mainland. The study revealed that the SPEI value with a three month (approximately 90 days) timesteps illustrated that there are no significant trends toward intensification in terms of frequency, severity, and duration of drought incidents; additionally, it was highlighted that the daily SPEI dataset might be used not only to determine the onset and the termination days of drought, but to explore droughts on a variety of timesteps, including meteorological, agricultural, hydrological, and social-economic. Yang et al. [98], based on SPEI values, investigated spatiotemporal drought variation patterns in the Haihe River Basin (HRB) from 1962 to 2010. The findings revealed that during the study period, the drought occurrence and severity in the yearly and seasonal scales have increased. The affected areas by all degrees of drought have temporal variability of an increasing trend. To determine the optimal combination of drought index and time scale for drought detection, Fluixá–Sanmartín et al. [99] estimated the meteorological drought indices SPI, RAI, Percent of Normal Precipitation (PN), and Deciles (DEC) at various localities and timescales in the Jinsha River catchment to develop two drought indicators, the Overall Drought Extension (ODE) and the Overall Drought Intensity (ODI). Furthermore, the method was efficaciously employed in China’s lower Jinsha River catchment, which is a region frequently struck by severe drought. The results showed that the index and time scale combinations accurately reproduced the observed events. Mekonen et al. [100] used SPI to calculate the drought severity categories of both humid months and seasons at 1-month, four-month, and 8-month timescales in a study on the investigation of space-time drought occurrence in Ethiopia’s northeast highlands. The study discovered extreme severe drought during the belg rainy season and suggested further research into an additional index of climatic parameters for instance evapotranspiration and soil water content.
Tirivarombo et al. [101] conducted a study in the Kafue basin in northern Zambia to monitor and analyze drought by comparing two different drought indices, SPI and SPEI. The SPEI identified more droughts in the severe and moderate categories. The findings indicated that temperature is crucial in describing droughts and that using SPI to characterize droughts should be done with caution. Borona et al. [102] generated an ensemble of 40 calculations of SPEI to assess uncertainties in drought identification in Kitwi west, in south-eastern Kenya. The study found uncertainties linked to the selection of rainfall and temperature and concluded that using an ensemble of gridded meteorological data blending in the calculation of drought indices, such as the SPEI, facilitated a better understanding of the uncertainties in the onset, duration, and magnitude of past droughts. Almedeij [103] employed SPI to assess droughts observed in Kuwait’s desert environment. The results revealed no long-term drought trend for the given rainfall data, but only a seasonal variation pattern of the time series component. Hui-mean et al. [104] used SPEI to analyze drought and water resource availability to identify drought periods and calculate the mean return interval according to SPEI. According to the results, annual PET showed an upward trend, while annual Climatic Water Balance (CWB) showed a downward trend. The findings can help policy-makers and practitioners improve water resources planning and management, particularly reducing the impacts of future droughts. Under the use of SPEI Araneda-Cabrera et al. [105] characterized drought conditions and evaluated the effect of the main climatical drivers on drought incidents (1950–2019) across Mozambique and the findings revealed a significant trend toward a greater event of droughts and long-term durability in all regions. Rehana et al. [106] proposed a hydro-meteorological index, Standardized Precipitation Actual Evapotranspiration Index (SPAEI), which is based on both energy and available moisture supply under climate change and compared it to SPEI, which is based on PET. Due to the inclusion of hydrologically induced Actual Evapotranspiration (AET) in the drought characteristics instead of PET, the study indicated that the SPAEI could provide greater insight into capturing severe and extreme drought features in a watershed than the SPEI and the drought characteristics projected by SPEI are more severe due to the consideration of PET as compared to SPAEI, which is the maximum possible moisture loss based on energy demand. Salimi et al. [107] used SPI and SPEI to determine dryness and wetness climatological seasons, and the Standard Streamflow Index (SSI) was used to investigate hydrological drought. The study high-lighted that, due to the use of precipitation and evapotranspiration input data, the SPEI is suitable and highly recommended compared to the SPI for applications exploring the changeability of drought. Based on information recorded from forty-four meteorological stations distributed across Province of Sichuan, Liu et al. [108] calculated the SPI and SPEI values to analyze and explore the differences in drought characteristics. The results revealed that these two indices could accurately represent the changing features of drought in various Sichuan geomorphological contexts. Hao et al. [109] employed the SPEI and VCI to estimate the length of drought time (DDT) and recovery time of drought (DRT) in the Lake Victoria basin in East of Africa. The results highlighted that less precipitation and a rise in potential evapotranspiration caused the decreasing SPEI. Taking 102 meteorological stations across Inner Mongolia, Pei et al. [110] analyzed the applicability and compared the performance of SPI and SPEI in detecting drought. The major findings were that both drought indices have advantages and that they can normally monitor regional drought but highlighted that detecting drought across Inner Mongolia, the SPEI may be more appropriate than the SPI. Based on the RDI index, Zarei [111] used climate data from 11 stations to predict periodical drought in Iran’s southern part. The outcomes of the drought projection categories illustrated that 2020 compared to 2014 was drier. Musonda et al. [112] analyzed drought features, for instance, duration, intensity, and severity at monthly, seasonal, and annual levels based on SPI at three different timescales to investigate drought patterns across Zambia. As a result, the SPI values from all timesteps showed an upward trend, indicating that drought has become more widespread over the last three decades. The SPEI and temperatures were used to investigate the impact of climate variability on crop yield in three agroecological regions of Gambia [113]. According to the findings, the combined effect of SPEI and temperatures reduced yields. The SPEI values revealed that all the study regions experienced alternate drought episodes. To analyze hydrological and meteorological droughts in the Turkey’s Seyhan and Ceyhan River Basins, Gumus et al. [114] employed the Streamflow Drought Index (SDI) and the SPI. Their research concluded that the use of SPI and SDI along with their categorizations are dependable methodology when analyzing hydrological and meteorological droughts. A study was conducted to assess meteorological drought in the Beed district of the Marathwada region, India under the use of SPI at various timescales (1, 3, 6, 9, and 12 months) for drought event identification and analysis. The findings revealed that SPI fluctuated on a shorter timescale, resulting in frequent droughts of short duration, and suggested that SPI1 be used to assess precipitation deficits on a smaller timescale, while SPI3 and SPI6 can be used to assess seasonal drought [115]. Assessing and monitoring meteorological drought in the Wadi Djelfa–Hadija sub-basin in the southern part of the Saharian Atlas, Haied et al. [116] used Decile, SPI, and RDI. The results indicated that the RDI index showed a higher number of drought months than SPI and Deciles. In the Asi basin, drought risk was assessed using the Deciles Index, SPEI, SRI, and SPI. The findings revealed that indicators computed for identical periods were more highly correlated than those computed for distinct time periods, e even though all indices were highly correlated, selecting the most appropriate index for the study domain, like SPEI was better [117]. The study assessed the effects of global warming on droughts across the East African area using the SPI and SPEI indices to quantify and detect PET’s role in drought projections and the findings revealed that projections of SPEI are more reliable compared to SPI projections [118]. The variability of SPI was investigated in a study on trend analysis of drought and precipitation in Turkey’s Aegean region [119]. The analysis of SPI values revealed that as the period lengthens, drought occurs less frequently. Still, for a longer period, whereas as the period shortens, the shift between positive and negative values occurs more frequently. The SPI values respond more slowly to changing precipitation conditions when the period lengthens. Ahmadalipour et al. [120] used three drought indices, SPEI, SPI, and SSI, to examine different spatiotemporal characteristics of the hydro-meteorological drought over the Willamette River Basin, western Oregon, U.S. According to the findings, there is an expectation of an increased recurrence of meteorological drought incidents in most events based on the SPEI results. While SPI showed intensification and frequency reduction in most events. The study came to the crucial conclusion that using the SPI to study meteorological drought is insufficient when assessing the effects of climatical variability. Furthermore, the importance of temperature in drought assessments must be taken into account.
Polong et al. [121] investigated the spatial and temporal variability of dryness and wetness conditions and their extent, intensity, and severity in the Tana River Basin in Kenya, using SPEI at timescales of 6 and 12 months, and monthly rainfall and temperature data collected between 1960 and 2013. The index revealed that dryness incidents frequently occurred within the 1960s–1980s, whereas wetness incidents dominated the period between 1990 and 2000. Because it can consider the potential climate change consequences in the region, the SPEI was deemed the most appropriate index. A Composite Drought Index (CDI) was created by Qaiser et al. [122] to detect and evaluate seasonal droughts over Pakistan’s Potwar Plateau using meteorological information that has been seen and discovered by remote sensing. The findings revealed that the index created can efficiently detect seasonal droughts in the areas of the study. This could aid in the implementing of policies aimed at mitigating the effects of such events.
Table 1 illustrates the effectiveness of droughts indices through their characteristics, advances and limitation.

7. Discussion

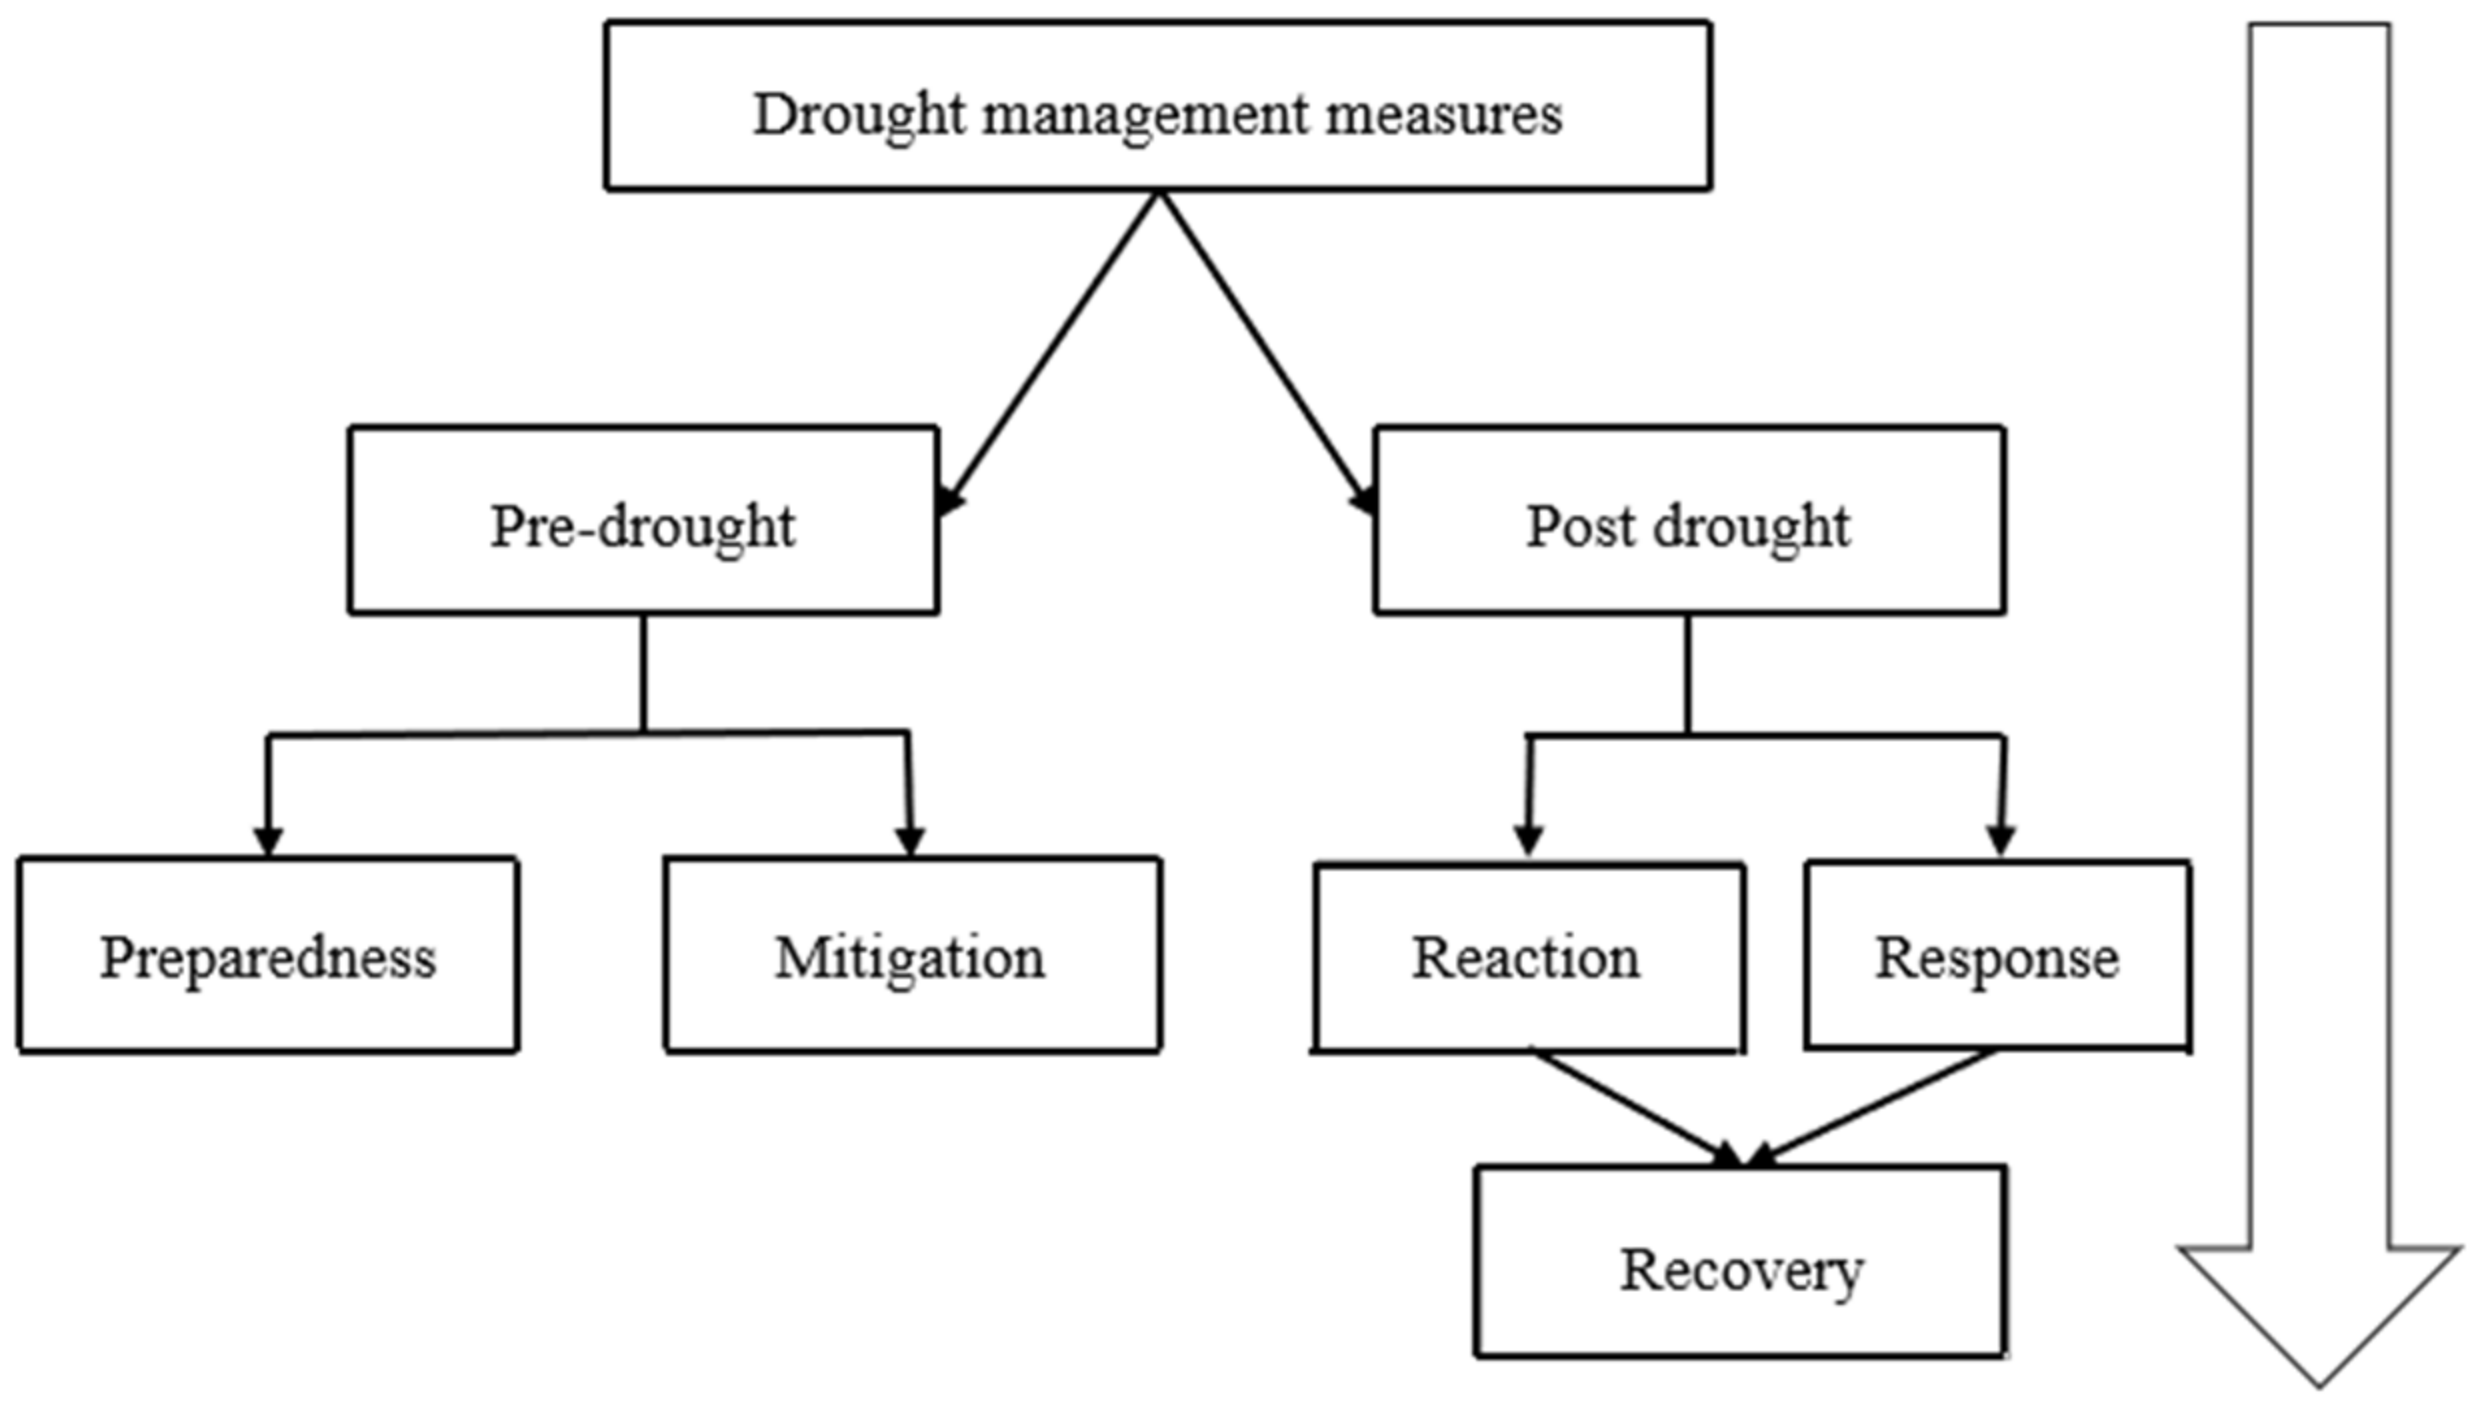
7.1. Drought Risk Management and Mitigation

Drought mitigation is crucial due to its complexity and effects on the natural environment and humanity. Because of climate change resulting in rising temperatures, and global warming causing floods and droughts, heatwaves, and storms to all increase, the living conditions are affected, especially for the people in rural areas. Drought control and catastrophe mitigation necessitate accurate and timely drought forecasts, which provide crucial information for developing and implementing effective drought mitigation strategies [123]. Drought early warning and management have advanced significantly in recent decades, due in large part to advances in drought tools [124,125,126]. Because change in global climate leads to the increased frequency and severity of drought incidents in the Greater Horn of Africa (GHA), Tadesse et al. [127] conducted a study on improving National and Regional drought early warning systems and highlighted the need for more effective drought planning and mitigation strategies. This enabled decision-makers to better understand drought consequences at all levels, as well as identify vulnerabilities and take actions to address and reduce those vulnerabilities. When government policies and political efforts are created to ultimately draw attention to the distinct phases of the drought, starting from an appropriate land utilization arrangement that maximizes drought resilience, all the way to the structure of practical and locally aimed reimbursement constitutions [55] they can be powerful motivators for the public to become involved in conservation efforts. Drought mitigation and preparedness refer to the actions usually undertaken by both governments and societies in advance aiming to reduce potential vulnerabilities in society, economy, and environment (see Figure 2). At the same time, response and recovery are actions taken in reaction to drought events aiming to help people face the effects of drought and restore the pre-drought living conditions of the drought-stricken region [55,128,129].

7.2. Preparedness

Before the occurrence of drought, any of the policies, plans and actions that are taken to prepare people and to enhance the ability to cope, to predict and forewarn of approaching dangers, and to ensure that there is a response that is coordinated and effective in the event of a drought, constitute drought preparedness. To be specific, that includes development of an early warning and forecast systems of climate change, as well as development and integration of drought indicator tools that can provide reliable information to regional or national decision-makers. This is critical to surviving a drought. In addition, hazards organizations must be put in place, which will oversee and guarantee a coordinated and effective response in the case of drought incident. Hazards organizations play a significant role in the management of disasters by having an emergency-response plan and providing clear guidance to the people that involved in response. At the agricultural level, measures to ensure crops against drought are crucial. This means cultivating appropriate seasonal crops that will not perish easily in the case of water deficit (traditional grains) and other drought-resistant crops. It as well means planting native and drought-tolerant grasses in both private and public gardens. Such measures though will not provide immunity to droughts, but will enhance the capacity to cope.

7.3. Mitigation Strategies

The aim of drought mitigation strategies is to limit the adverse effects of drought. They include both structural and non-structural measures. Specific measures for achieving mitigation objectives include, of first importance, efficient management of water resources. That implies increasing water recycling and reuse. In addition, water-saving irrigation devices, such as micro and drip irrigation and soaker hoses, should be installed. It is also important for reservoirs and dam management policies be based on scientific principles. In this vein, a lot of precaution should be taken in the construction of reservoirs and dams so that these engineering project do not degrade natural systems. In relation to natural resources, proactive resources management strategies that support natural processes (such as programs for afforestation and reforestation) should be developed and adopted. Moreover, it is essential to avoid wildfires and preserve natural parks and wetlands. This can guarantee a limited impact, in the event of s drought.

7.4. Reaction and Response

Reaction to drought involves the taking of immediate decisions and actions by the government and the disaster organizations concerning the people and natural resources of the threatened region, to prevent widespread deaths of both human and animals, when a drought strikes. This precedes the pragmatic efforts to be taken, that constitute drought response. Drought response measures can be immediate, short-term, or long-term. They include all efforts such as assisting or intervening, at the time of, or soon after a drought occurrence, with the aim of preserving life and providing the basic needs of drought victims. In general, response actions are the responsibility of the governments, provinces, or local communities. Depending on the severity of the drought impact, international organizations, for example International Disaster Response Fund can intervene. This involves supply of both food and clean water for drinking to the highly vulnerable people, especially to public places such as schools and hospitals. It may also involve in providing monthly allowance to the low-income people. It may be necessary to lower the prices of food for human and animal feed. The lack of clean water can easily result in rising the spread of diseases and probably outbreaks; therefore, world health organization (WHO) can help in preventing of and cure for diseases linked to hazards and lack of sanitation. Such measures lighten the burden of drought on the affected people and lead to the restoration and amelioration of pre-drought living conditions of the stricken community.

8. Recommendation and Future Directions

Drought as natural catastrophe can be very costly, ruining both human health and wealth and restricting agricultural production. But due to its slow onset and aggravation over time, except for the flash drought which can intensify in short period of time, drought provides an opportunity to prepare and mitigate its impact and lighten its burdens to the affected communities. It is crucial to have indices, models and tools that help in assessing vulnerability to drought and provide reliable information and understanding about the occurrence of drought to develop suitable measures to mitigate drought and be aware of drought risk management. For instance, Ali et al. [130] developed a new composite drought index to contribute to the assessment of drought across the Blue Nile River basin. Due to the complexity of drought, which may result from interconnected factors, to design a composite drought index that incorporates multiple drought indices can perfectly detect the drought incident. Feire et al. [131] proposed a drought risk assessment approach to aid decision-makers at the local level, addressing two risks that affected agricultural areas situated in Tagus Estuary, Portugal. Moreover, Le et al. [132] conducted a comprehensive drought risk assessment for Vietnam by including drought exposure and vulnerability based on Socio-economic conditions for the regions. An approach to drought risk assessment has potentialities to contribute to improving drought preparedness, mitigation, resilience, response, and adaptation of communities in danger. Despite this knowledge, there are limitations in the detailed systems by which droughts hold back a nation’s development and have far-reaching consequences in other areas. Therefore, further studies are needed to considerably explain the systems by which droughts occur and their effects on human and natural resources, moreover proactive drought and climate change mitigation activities and water resources management policy are highly recommended.

9. Conclusions

Droughts are natural disasters that can occur anywhere and at any time of year and depending on topography, may vary from one region to another or one country to another. They can significantly impede the development of a threatened region, all the way up to the national level. Accurately monitoring droughts, knowing their causes, and consequences to the community, is indispensable for the decision-makers in terms of environmental and natural resources protection and is a key component of food and water security for the sustainability of humans and livestock. Economic considerations cannot be overlooked when managing water resources, as water is one of the primary pillars of the world’s economy. Communities and humanity are particularly vulnerable to climatological incidents like droughts and flooding caused by less and extreme precipitation, respectively. Because droughts can be aggravated by human activities such as mining, deforestation, understanding the phenomenon of drought will help avoid certain activities that exacerbate the occurrence of droughts. Strategies for the protection of the environment and other natural resources will be in practical and this will provide a way towards securing food and water sustainability for the rapidly growing population.

Author Contributions

J.M.N., conceptualization, validation, writing—original draft preparation, writing—review and editing; F.L., supervision and funding acquisition. All authors have read and agreed to the published version of the manuscript.

Funding

This work was supported by the China Postdoctoral Science Foundation (No. 2019M651976).

Institutional Review Board Statement

Not applicable.

Informed Consent Statement

Not applicable.

Data Availability Statement

Not applicable.

Acknowledgments

I would like to express my sincere thanks to the China Postdoctoral Science Foundation (No. 2019M651976). Special appreciation goes to Yangzhou University (YZU) for granting a scholarship to study for a MSc and more gratitude to College of Hydraulic Science and Engineering for providing a good learning environment.

Conflicts of Interest

The authors declare no conflict of interest.

References

  1. FAO. The Impacts of Disasters on Agriculture and Food Security; FAO: Rome, Italy, 2015; p. 77. [Google Scholar]
  2. Cook, E.R.; Seager, R.; Cane, M.A.; Stahle, D.W. North American drought: Reconstruction, causes, and consequences. Earth Sci. Rev. 2007, 81, 93–134. [Google Scholar] [CrossRef]
  3. Kauffman, G.J.; Vonck, K.J. Frequency and Intensity of extreme drought in the Delaware Basin 1600–2002. Water Resour. Res. 2011, 47, W05521. [Google Scholar] [CrossRef]
  4. Shiru, M.S.; Shahid, S.; Chung, E.; Alias, N. Changing characteristics of meteorological droughts in Nigeria during 1901–2010. Atmos. Res. 2019, 223, 60–73. [Google Scholar] [CrossRef]
  5. Kamali, B.; Jahanbakhshi, F.; Dogaru, D.; Dietrich, J.; Nendel, C.; Aghakouchak, A. Probabilistic Modelling of Crop-Yield Loss Risk under Drought: A Spatial Showcase for Sub-Saharan Africa. Environ. Res. Lett. 2022, 17, 024028. [Google Scholar] [CrossRef]
  6. Guo, H.; Bao, A.; Ndayisaba, F.; Liu, T.; Jiapaer, G.; El-Tantawi, A.M.; De Maeyer, P. Space-time characterization of drought events and their impacts on vegetation in central Asia. J. Hydrol. 2018, 564, 1165–1178. [Google Scholar] [CrossRef]
  7. Kirono, D.G.C.; Round, V.; Heady, C.; Chiew, F.H.S.; Osbrough, S. Drought Projection for Australia: Updated Results and Analysis of Models Simulations. Weather. Clim. Extrem. 2020, 30, 100280. [Google Scholar] [CrossRef]
  8. Hansel, S.; Ustrnul, Z.; Lupikasza, E.; Skalak, P. Assessing Seasonal droughts variations and trends over central Europe. Adv. Water Resour. 2019, 127, 53–75. [Google Scholar] [CrossRef]
  9. IPCC. Summary for policymakers. In Global Warming of 1.5 °C; An IPCC Special Report on the impacts of global warming of 1.5 °C above pre-industrial levels and related global greenhouse gas emission pathways, in the context of strengthening the global response to the treat of climate change, sustainable development, and efforts to eradicate poverty; Masson-Delmotte, V., Zhai, P., Pörtner, H.-O., Roberts, D., Skea, J., Shukla, P.R., Pirani, A., Moufouma-Okia, W., Péan, C., Pidcock, R., et al., Eds.; World Meteorological Organization: Geneva, Switzerland, 2018. [Google Scholar]
  10. Yusa, A.; Berry, P.; Cheng, J.J.; Ogden, N.; Bonsal, B.; Stewart, R.; Waldick, R. Climate Change, Drought and Human Health in Canada. Int. J. Environ. Res. Public Health 2015, 12, 8359–8412. [Google Scholar] [CrossRef]
  11. Marengo, J.A.; Cunha, A.P.; Cuartas, L.A.; Deusdará Leal, K.R.; Broedel, E.; Seluchi, M.E.; Michelin, C.M.; de Praga Baião, C.F.; Chuchón Ângulo, E.; Almeida, E.K.; et al. Extreme Drought in the Brazilian Pantanal in 2019–2020: Characterization, Causes, and Impacts. Front. Water 2021, 3, 639204. [Google Scholar] [CrossRef]
  12. FSNWG Update-Central & Eastern Africa, 11 March 2010 “Humanitarian Emergency Declared in Northern Burundi”. Available online: https://reliefweb.int/report/burundi/fsnwg-update-central-eastern-africa-11-march-2010 (accessed on 17 May 2022).
  13. World Bank. Doing Business in the East African Economies; IFC/World Bank Rep; World Bank: Washington, DC, USA, 2012; p. 116. [Google Scholar]
  14. CRED. 2021 Disasters in Numbers. Brussels: CRED. 2022. Available online: https://cred.be/sites/default/files/2021_EMDAT_report.pdf (accessed on 10 August 2022).
  15. Mishra, A.K.; Sivakumar, B.; Singh, V.P. Drought processes, modeling, and mitigation. J. Hydrol. 2015, 526, 1–2. [Google Scholar] [CrossRef]
  16. Nkunzimana, A.; Shuoben, B.; Guojie, W.; Alriah, M.A.A.; Sarfo, I.; Zhihui, X.; Vuguziga, F.; Ayugi, B.O. Assessment of Drought Events, Their Trend and Teleconnection Factors over Burundi, East Africa. Theor. Appl. Climatol. 2021, 145, 1293–1316. [Google Scholar] [CrossRef]
  17. Myronidis, D.; Theofanous, N. Changes in climatic patterns and tourism and their concomitant effect on drinking water transfers into the region of South Aegean, Greece. Stoch. Environ. Res. Ris. Assess. 2021, 35, 1725–1739. [Google Scholar] [CrossRef]
  18. Stefanidis, S.; Alexandridis, V. Precipitation and potential evapotranspiration temporal variability and their relationship in two forest ecosystems in greece. Hydrology 2021, 8, 160. [Google Scholar] [CrossRef]
  19. Ndayiragije, J.M.; Li, F. Monitoring and analysis of drought characteristics based on climate change in Burundi using standardized precipitation evapotranspiration index. Water 2022, 14, 2511. [Google Scholar] [CrossRef]
  20. Chang, J.; Guo, A.; Wang, Y.; Ha, Y.; Zhang, R.; Xue, L.; Tu, Z. Reservoir operations to mitigate drought effects with a hedging policy triggered by the drought prevention limiting water level. Water Resour. Res. 2019, 55, 904–922. [Google Scholar] [CrossRef]
  21. Li, J.; Wang, Z.; Wu, X.; Xu, C.Y.; Guo, S.; Chen, X.; Zhang, Z. Robust meteorological drought prediction using antecedent SST fluctuations and machine learning. Water Resour. Res. 2021, 57, e2020WR029413. [Google Scholar] [CrossRef]
  22. Lin, Q.; Wu, Z.; Singh, V.P.; Sadeghi, S.H.R.; He, H.; Lu, G. Correlation between hydrological drought, climatic factors, reservoir operation, and vegetation cover in the Xijiang basin, South China. J. Hydrol. 2017, 549, 512–524. [Google Scholar] [CrossRef]
  23. Amininia, K.; Safarianzengir, V.; Soltani, N. Analyzing climate change and its effects on drought and water scarcity (case study: Ardabil, northwestern province of Iran, Iran). Sustain. Water Resour. Manag. 2021, 7, 16. [Google Scholar] [CrossRef]
  24. Zargar, A.; Sadiq, R.; Naser, B.; Khan, F.I. A review of drought indices. Environ. Rev. 2011, 19, 333–349. [Google Scholar] [CrossRef]
  25. Abara, M.; Budiastuti, S. Drought frequency, severity, and duration monitoring based on climate change in southern and southeastern Ethiopia. In Proceedings of the IOP Conference Series: Earth and Environment Science; Institute of Physics Publishing: Bristol, UK, 2020; Volume 477. [Google Scholar] [CrossRef]
  26. Ayugi, B.; Tan, G.; Rouyun, N.; Zeyao, D.; Ojara, M.; Mumo, L.; Babaousmail, H.; Ongoma, V. Evaluation of meteorological drought and flood scenarios over Kenya, East Africa. Atmosphere 2020, 11, 307. [Google Scholar] [CrossRef]
  27. Zhou, Z.; Shi, H.; Fu, Q.; Ding, Y.; Li, T.; Wang, Y.; Liu, S. Characteristics of propagation from meteorological drought to hydrological drought in the Pearl River Basin. J. Geophys. Res. Atmos. 2021, 126, e2020JD033959. [Google Scholar] [CrossRef]
  28. Zhao, Y.; Weng, Z.; Chen, H.; Yang, J. Analysis of the evolution of drought, flood, and drought-flood abrupt alternation events under climate change using the daily SWAP index. Water 2020, 12, 1969. [Google Scholar] [CrossRef]
  29. Khamisa, M.; Ndhleve, S.; Nakin, M.D.V.; Mngeni, A.; Kabiti, H.M. Analysis of trends, recurrences, severity and frequency of droughts using standardised precipitation index: Case of or tambo district municipality, Eastern Cape, South Africa. Jàmbá J. Disaster Ris. Stud. 2022, 14, 1147. [Google Scholar] [CrossRef]
  30. Ruwanza, S.; Thondhlana, G.; Falayi, M. Research progress and conceptual insights on drought impacts and responses among smallholder farmers in South Africa: A review. Land 2022, 11, 159. [Google Scholar] [CrossRef]
  31. Crausbay, S.D.; Ramirez, A.R.; Carter, S.L.; Cross, M.S.; Hall, K.R.; Bathke, D.J.; Betancourt, J.L.; Colt, S.; Cravens, A.E.; Dalton, M.S.; et al. Defining ecological drought for the twenty-first century. Bull. Am. Meteorol. Soc. 2017, 98, 2543–2550. [Google Scholar] [CrossRef]
  32. Peters, E. Propagation of Drought through Groundwater Systems Illustrated in the Pang (UK) and Upper-Guadiana (ES) Catchments. Ph.D. Thesis, Wageningen University, Wageningen, The Netherlands, 2003. [Google Scholar]
  33. Svoboda, M. Couauthors: The drought monitor. Bull. Am. Meteor. Soc. 2002, 83, 1181–1190. [Google Scholar] [CrossRef]
  34. Cao, S.; Zhang, L.; He, Y.; Zhang, Y.; Chen, Y.; Yao, S.; Yang, W.; Sun, Q. Effects and contributions of meteorological drought on agricultural drought under different climatic zones and vegetation types in Northwest China. Sci. Total Environ. 2022, 821, 153270. [Google Scholar] [CrossRef]
  35. Niaz, R.; Tanveer, F.; Almazah, M.M.A.; Hussain, I.; Alkhatib, S.; Al-Razami, A.Y. Characterization of meteorological drought using monte carlo feature selection and steady-state probabilities. Complexity 2022, 2022, 1172805. [Google Scholar] [CrossRef]
  36. Li, W.G.; Liu, S.J.; Hou, M.T.; Han, J.; Chen, X.M. Advance in the study on meteorological and agricultural drought indices. Meteorol. Environ. Sci. 2021, 196, 76–82. [Google Scholar]
  37. Zhou, Z.Y.; Long, Q.B.; Bai, P. Scale of meteorological drought index suitable for characterizing agricultural drought: A case study of hunan province. J. South–North Water Transf. Water Sci. Technol. 2021, 19, 119–128. [Google Scholar]
  38. D’Odorico, P.; Davis, K.F.; Rosa, L.; Carr, J.A.; Chiarelli, D.; Dell’Angelo, J.; Gephart, J.; MacDonald, G.K.; Seekell, D.A.; Suweis, S.; et al. The global food-energy-water nexus. Rev. Geophys. 2018, 56, 456–531. [Google Scholar] [CrossRef]
  39. Singh, A.; Reager, J.T.; Behrangi, A. Estimation of hydrological drought recovery based on precipitation and gravity recovery and climate experiment (GRACE) water storage deficit. Hydrol. Earth Syst. Sci. 2021, 25, 511–526. [Google Scholar] [CrossRef]
  40. Botai, C.M.; Botai, J.O.; de Wit, J.P.; Ncongwane, K.P.; Murambadoro, M.; Barasa, P.M.; Adeola, A.M. Hydrological drought assessment based on the standardized streamflow index: A case study of the three cape provinces of South Africa. Water 2021, 13, 3498. [Google Scholar] [CrossRef]
  41. Rivera, J.A.; Otta, S.; Lauro, C.; Zazulie, N. A decade of hydrological drought in Central-Western Argentina. Front. Water 2021, 3, 640544. [Google Scholar] [CrossRef]
  42. Sutanto, S.J.; van Lanen, H.A.J. Catchment memory explains hydrological drought forecast performance. Sci. Rep. 2022, 12, 2689. [Google Scholar] [CrossRef]
  43. Almikaeel, W.; Čubanová, L.; Šoltész, A. Hydrological drought forecasting using machine learning—Gidra river case study. Water 2022, 14, 387. [Google Scholar] [CrossRef]
  44. Jehanzaib, M.; Shah, S.A.; Son, H.J.; Jang, S.-H.; Kim, T.-W. Predicting hydrological drought alert levels using supervised machine-learning classifiers. KSCE J. Civ. Eng. 2022, 26, 3019–3030. [Google Scholar] [CrossRef]
  45. Achite, M.; Bazrafshan, O.; Wałęga, A.; Azhdari, Z.; Krakauer, N.; Caloiero, T. Meteorological and Hydrological Drought Risk Assessment Using Multi-Dimensional Copulas in the Wadi Ouahrane Basin in Algeria. Water 2022, 14, 653. [Google Scholar] [CrossRef]
  46. Ziolkowska, J.R. Socio-Economic Implications of Drought in the Agricultural Sector and the State Economy. Economies 2016, 4, 19. [Google Scholar] [CrossRef]
  47. Zhao, M.; Huang, S.; Huang, Q.; Wang, H.; Leng, G.; Xie, Y. Assessing Socio-Economic Drought Evolution Characteristics and Their Possible Meteorological Driving Force. Geomat. Nat. Hazards Ris. 2019, 10, 1084–1101. [Google Scholar] [CrossRef]
  48. Wang, J.; He, G.; Fang, H.; Han, Y. Climate Change Impacts on the Topography and Ecological Environment of the Wetlands in the Middle Reaches of the Yarlung Zangbo-Brahmaputra River. J. Hydrol. 2020, 590, 125419. [Google Scholar] [CrossRef]
  49. Jiang, T.; Su, X.; Singh, V.P.; Zhang, G. A Novel Index for Ecological Drought Monitoring Based on Ecological Water Deficit. Ecol. Indic. 2021, 129, 107804. [Google Scholar] [CrossRef]
  50. Goodarzi, M.; Abedi-Koupai, J.; Heidarpour, M.; Safari, H.R. Development of a new drought index for Groundwater and its application in Sustainable groundwater extraction. J. Water Resour. Plan. Manag. 2016, 142, 04016032. [Google Scholar] [CrossRef]
  51. Eltahir, E.A.; Yeh, P.J.F. On the asymmetric response of aquifer water level to floods and droughts in Illinois. Water Resour. Res. 1999, 35, 1199–1217. [Google Scholar] [CrossRef]
  52. Thomas, B.F.; Famiglietti, J.S.; Landerer, F.W.; Wiese, D.N.; Molotch, N.P.; Argus, D.F. GRACE Groundwater Drought Index: Evaluation of California Central Valley Groundwater Drought. Remote Sens. Environ. 2017, 198, 384–392. [Google Scholar] [CrossRef]
  53. Otkin, J.A.; Svoboda, M.; Hunt, E.D.; Ford, T.W.; Anderson, M.C.; Hain, C.; Basara, J.B. Flash Droughts: A Review and Assessment of the Challenges Imposed by Rapid-Onset Droughts in the United States. Bull. Am. Meteorol. Soc. 2018, 99, 911–919. [Google Scholar] [CrossRef]
  54. Pendergrass, A.G.; Meehl, G.A.; Pulwarty, R.; Hobbins, M.; Hoell, A.; AghaKouchak, A.; Bonfils, C.J.W.; Gallant, A.J.E.; Hoerling, M.; Hoffmann, D.; et al. Flash Droughts Present a New Challenge for Subseasonal-to-Seasonal Prediction. Nat. Clim. Chang. 2020, 10, 191–199. [Google Scholar] [CrossRef]
  55. García-León, D.; Standardi, G.; Staccione, A. An Integrated Approach for the Estimation of Agricultural Drought Costs. Land Use Policy 2021, 100, 104923. [Google Scholar] [CrossRef]
  56. Marshall, S. The Water Crisis in Kenya: Causes, Effects and Solutions. Glob. Major. E-J. 2011, 2, 31–45. [Google Scholar]
  57. Pérez-Flores, J.; Mardero, S.; López-Cen, A.; Contreras-Moreno, F.M. Human-Wildlife Conflicts and Drought in the Greater Calakmul Region, Mexico: Implications for Tapir Conservation. Neotrop. Biol. Conserv. 2021, 16, 539–563. [Google Scholar] [CrossRef]
  58. Kupika, O.L.; Gandiwa, E.; Kativu, S.; Nhamo, G. Impacts of Climate Change and Climate Variability on Wildlife Resources in Southern Africa: Experience from Selected Protected Areas in Zimbabwe. Sel. Stud. Biodivers. InTech. 2018. [Google Scholar] [CrossRef]
  59. Wang, P.; Qiao, W.; Wang, Y.; Cao, S.; Zhang, Y. Urban Drought Vulnerability Assessment—A Framework to Integrate Socio-Economic, Physical, and Policy Index in a Vulnerability Contribution Analysis. Sustain. Cities Soc. 2020, 54, 102004. [Google Scholar] [CrossRef]
  60. Cremades, R.; Sanchez-Plaza, A.; Hewitt, R.J.; Mitter, H.; Baggio, J.A.; Olazabal, M.; Broekman, A.; Kropf, B.; Tudose, N.C. Guiding Cities under Increased Droughts: The Limits to Sustainable Urban Futures. Ecol. Econ. 2021, 189, 107140. [Google Scholar] [CrossRef]
  61. van de Vuurst, P.; Escobar, L.E. Perspective: Climate Change and the Relocation of Indonesia’s Capital to Borneo. Front. Earth Sci. 2020, 8, 5. [Google Scholar] [CrossRef]
  62. Sheffield, J.; Wood, E.F.; Chaney, N.; Guan, K.; Sadri, S.; Yuan, X.; Olang, L.; Amani, A.; Ali, A.; Demuth, S.; et al. A Drought Monitoring and Forecasting System for Sub-Sahara African Water Resources and Food Security. Bull. Am. Meteorol. Soc. 2014, 95, 861–882. [Google Scholar] [CrossRef]
  63. Zhang, T.; Su, X.; Zhang, G.; Wu, H.; Wang, G.; Chu, J. Evaluation of the Impacts of Human Activities on Propagation from Meteorological Drought to Hydrological Drought in the Weihe River Basin, China. Sci. Total Environ. 2022, 819, 153030. [Google Scholar] [CrossRef]
  64. Singh, N.K.; Basu, N.B. The Human Factor in Seasonal Streamflows across Natural and Managed Watersheds of North America. Nat. Sustain. 2022, 5, 397–405. [Google Scholar] [CrossRef]
  65. Fagariba, C.J.; Song, S.; Soule, S.K.G. Livelihood Economic Activities Causing Deforestation in Northern Ghana: Evidence of Sissala West District. Open J. Ecol. 2018, 08, 57–74. [Google Scholar] [CrossRef]
  66. Guo, W.; Guo, M.; Tan, Y.; Bai, E.; Zhao, G. Sustainable Development of Resources and the Environment: Mining-Induced Eco-Geological Environmental Damage and Mitigation Measures-a Case Study in the Henan Coal Mining Area, China. Sustainability 2019, 11, 4366. [Google Scholar] [CrossRef]
  67. Shen, Z.; Zhang, Q.; Chen, D.; Singh, V.P. Varying Effects of Mining Development on Ecological Conditions and Groundwater Storage in Dry Region in Inner Mongolia of China. J. Hydrol. 2021, 597, 125759. [Google Scholar] [CrossRef]
  68. Meza, I.; Eyshi Rezaei, E.; Siebert, S.; Ghazaryan, G.; Nouri, H.; Dubovyk, O.; Gerdener, H.; Herbert, C.; Kusche, J.; Popat, E.; et al. Drought Risk for Agricultural Systems in South Africa: Drivers, Spatial Patterns, and Implications for Drought Risk Management. Sci. Total Environ. 2021, 799, 149505. [Google Scholar] [CrossRef] [PubMed]
  69. Cavus, Y.; Aksoy, H. Critical Drought Severity/Intensity-Duration-Frequency Curves Based on Precipitation Deficit. J. Hydrol. 2020, 584, 124312. [Google Scholar] [CrossRef]
  70. Montaseri, M.; Amirataee, B. Comprehensive Stochastic Assessment of Meteorological Drought Indices. Int. J. Climatol. 2017, 37, 998–1013. [Google Scholar] [CrossRef]
  71. Temam, D.; Uddameri, V.; Mohammadi, G.; Hernandez, E.A.; Ekwaro-Osire, S. Long-Term Drought Trends in Ethiopia with Implications for Dryland Agriculture. Water 2019, 11, 2571. [Google Scholar] [CrossRef]
  72. Bowell, A.; Salakpi, E.E.; Guigma, K.; Muthoka, J.M.; Mwangi, J.; Rowhani, P. Validating Commonly Used Drought Indicators in Kenya. Environ. Res. Lett. 2021, 16, 084066. [Google Scholar] [CrossRef]
  73. Alahacoon, N.; Edirisinghe, M. A Comprehensive Assessment of Remote Sensing and Traditional Based Drought Monitoring Indices at Global and Regional Scale. Geomat. Nat. Hazards Risk 2022, 13, 762–799. [Google Scholar] [CrossRef]
  74. Kim, J.S.; Park, S.Y.; Lee, J.H.; Chen, J.; Chen, S.; Kim, T.W. Integrated Drought Monitoring and Evaluation through Multi-Sensor Satellite-Based Statistical Simulation. Remote Sens. 2021, 13, 272. [Google Scholar] [CrossRef]
  75. Mckee, T.B.; Doesken, N.J.; Kleist, J. The relation of drought frequency and duration to time scales. In Proceedings of the Eighth Conference on Applied Climatology, Anaheim, CA, USA, 17–22 January 1993; Department of Atmospheric Science Colorado State University: Fort Collins, CO, USA, 1993; Volume 17, pp. 179–184. [Google Scholar]
  76. Vicente-Serrano, S.M.; Beguería, S.; López-Moreno, J.I. A Multiscalar Drought Index Sensitive to Global Warming: The Standardized Precipitation Evapotranspiration Index. J. Clim. 2010, 23, 1696–1718. [Google Scholar] [CrossRef]
  77. Palmer, W.C. Keeping Track of Crop Moisture Conditions, Nationwide: The New Crop Moisture Index. Weatherwise 1968, 21, 156–161. [Google Scholar] [CrossRef]
  78. Alley, W.M. The Palmer Drought Severity Index: Limitations and Assumptions. J. Clim. Appl. Meteorol. 1984, 23, 1100–1109. [Google Scholar] [CrossRef]
  79. Bhalme, H.N.; Mooley, D.A. Large-Scale Droughts/Floods and Monsoon Circulation. Mon. Weather Rev. 1980, 108, 1197–1211. [Google Scholar] [CrossRef]
  80. Mahmoudi, P.; Rigi, A.; Miri Kamak, M. A Comparative Study of Precipitation-Based Drought Indices with the Aim of Selecting the Best Index for Drought Monitoring in Iran. Theor. Appl. Climatol. 2019, 137, 3123–3138. [Google Scholar] [CrossRef]
  81. Aryal, A.; Maharjan, M.; Talchabhadel, R.; Thapa, B.R. Characterizing Meteorological Droughts in Nepal: A Comparative Analysis of Standardized Precipitation Index and Rainfall Anomaly Index. Earth 2022, 3, 409–432. [Google Scholar] [CrossRef]
  82. Yang, X.; Lu, M.; Wang, Y.; Wang, Y.; Liu, Z.; Chen, S. Response Mechanism of Plants to Drought Stress. Horticulturae 2021, 7, 50. [Google Scholar] [CrossRef]
  83. Mohseni, F.; Kiani Sadr, M.; Eslamian, S.; Areffian, A.; Khoshfetrat, A. Spatial and Temporal Monitoring of Drought Conditions Using the Satellite Rainfall Estimates and Remote Sensing Optical and Thermal Measurements. Adv. Space Res. 2021, 67, 3942–3959. [Google Scholar] [CrossRef]
  84. Chen, S.; Li, Q.; Zhong, W.; Wang, R.; Chen, D.; Pan, S. Improved Monitoring and Assessment of Meteorological Drought Based on Multi-Source Fused Precipitation Data. Int. J. Environ. Res. Public Health 2022, 19, 1542. [Google Scholar] [CrossRef]
  85. Keyantash, J.; Dracup, J.A. The Quantification of Drought: An Evaluation of Drought Indices. Bull. Am. Meteorol. Soc. 2002, 83, 1167–1180. [Google Scholar] [CrossRef]
  86. Li, L.; She, D.; Zheng, H.; Lin, P.; Yang, Z.-L. Elucidating Diverse Drought Characteristics from Two Meteorological Drought Indices (SPI and SPEI) in China. J. Hydrometeorol. 2020, 21, 1513–1530. [Google Scholar] [CrossRef]
  87. Ogunrinde, A.T.; Olasehinde, D.A.; Olotu, Y. Assessing the Sensitivity of Standardized Precipitation Evapotranspiration Index to Three Potential Evapotranspiration Models in Nigeria. Sci. Afr. 2020, 8, e00431. [Google Scholar] [CrossRef]
  88. Stagge, J.H.; Tallaksen, L.M.; Xu, C.-Y.; van Lanen, H.A.J. Standardized Precipitation-Evapotranspiration Index (SPEI): Sensitivity to Potential Evapotranspiration Model and Parameters. In Hydrology in a Changing World—Copernicus GmbH (IAHS-AISH Proceedings and Reports); Copernicus Publications: Göttingen, Germany, 2014; pp. 367–373. [Google Scholar]
  89. Parker, T.; Gallant, A.; Hobbins, M.; Hoffmann, D. Flash Drought in Australia and Its Relationship to Evaporative Demand. Environ. Res. Lett. 2021, 16, 064033. [Google Scholar] [CrossRef]
  90. Kitachew Wossenyeleh, B.; Asnake Worku, K.; Verbeiren, B.; Huysmans, M. Drought Propagation and Its Impact on Groundwater Hydrology of Wetlands: A Case Study on the Doode Bemde Nature Reserve (Belgium). Nat. Hazards Earth Syst. Sci. 2021, 21, 39–51. [Google Scholar] [CrossRef]
  91. Haile, G.G.; Tang, Q.; Hosseini-Moghari, S.M.; Liu, X.; Gebremicael, T.G.; Leng, G.; Kebede, A.; Xu, X.; Yun, X. Projected Impacts of Climate Change on Drought Patterns Over East Africa. Earth’s Future 2020, 8, e2020EF001502. [Google Scholar] [CrossRef]
  92. Kalisa, W.; Zhang, J.; Igbawua, T.; Kayiranga, A.; Ujoh, F.; Aondoakaa, I.S.; Tuyishime, P.; Li, S.; Simbi, C.H.; Nibagwire, D. Spatial Multi-Criterion Decision Making (SMDM) Drought Assessment and Sustainability over East Africa from 1982 to 2015. Remote Sens. 2021, 13, 5067. [Google Scholar] [CrossRef]
  93. Shams Esfandabadi, H.; Ghamary Asl, M.; Shams Esfandabadi, Z.; Gautam, S.; Ranjbari, M. Drought Assessment in Paddy Rice Fields Using Remote Sensing Technology towards Achieving Food Security and SDG2. British Food J. 2022. [Google Scholar] [CrossRef]
  94. Zarei, A.R.; Moghimi, M.M.; Bahrami, M. Comparison of Reconnaissance Drought Index (RDI) and Effective Reconnaissance Drought Index (ERDI) to Evaluate Drought Severity. Sustain. Water Resour. Manag. 2019, 5, 1345–1356. [Google Scholar] [CrossRef]
  95. Omar, L.-C.; Mariano, N.-C.; Alberto, G.; Ernestina, P.-G.; Jorge, M.-M.; Enrique, T.-D. Sensitivity of Four Indices of Meteorological Drought for Rainfed Maize Yield Prediction in the State of Sinaloa, Mexico. Agriculture 2022, 12, 525. [Google Scholar] [CrossRef]
  96. Feng, W.; Lu, H.; Yao, T.; Yu, Q. Drought Characteristics and Its Elevation Dependence in the Qinghai–Tibet Plateau during the Last Half-Century. Sci. Rep. 2020, 10, 14323. [Google Scholar] [CrossRef]
  97. Wang, Q.; Zeng, J.; Qi, J.; Zhang, X.; Zeng, Y.; Shui, W.; Xu, Z.; Zhang, R.; Wu, X.; Cong, J. A Multi-Scale Daily SPEI Dataset for Drought Characterization at Observation Stations over Mainland China from 1961 to 2018. Earth Syst. Sci. Data 2021, 13, 331–341. [Google Scholar] [CrossRef]
  98. Yang, M.; Yan, D.; Yu, Y.; Yang, Z. SPEI-Based Spatiotemporal Analysis of Drought in Haihe River Basin from 1961 to 2010. Adv. Meteorol. 2016, 2016, 7658015. [Google Scholar] [CrossRef]
  99. Fluixá-Sanmartín, J.; Pan, D.; Fischer, L.; Orlowsky, B.; García-Hernández, J.; Jordan, F.; Haemmig, C.; Zhang, F.; Xu, J. Searching for the Optimal Drought Index and Time Scale Combination to Detect Drought: A Case Study from the Lower Jinsha River Basin, China. Hydrol. Earth Syst. Sci. Discuss. 2018, 22, 889–910. [Google Scholar] [CrossRef]
  100. Mekonen, A.A.; Berlie, A.B.; Ferede, M.B. Spatial and Temporal Drought Incidence Analysis in the Northeastern Highlands of Ethiopia. Geoenviron. Disasters 2020, 7, 10. [Google Scholar] [CrossRef]
  101. Tirivarombo, S.; Osupile, D.; Eliasson, P. Drought Monitoring and Analysis: Standardised Precipitation Evapotranspiration Index (SPEI) and Standardised Precipitation Index (SPI). Phys. Chem. Earth 2018, 106, 1–10. [Google Scholar] [CrossRef]
  102. Borona, P.; Busch, F.; Krueger, T.; Rufin, P. Uncertainty in Drought Identification Due to Data Choices, and the Value of Triangulation. Water 2021, 13, 3611. [Google Scholar] [CrossRef]
  103. Almedeij, J. Drought Analysis for Kuwait Using Standardized Precipitation Index. Sci. World J. 2014, 2014, 451841. [Google Scholar] [CrossRef]
  104. Hui-Mean, F.; Yusop, Z.; Yusof, F. Drought Analysis and Water Resource Availability Using Standardised Precipitation Evapotranspiration Index. Atmos. Res. 2018, 201, 102–115. [Google Scholar] [CrossRef]
  105. Araneda-Cabrera, R.J.; Bermudez, M.; Puertas, J. Revealing the Spatio-Temporal Characteristics of Drought in Mozambique and Their Relationship with Large-Scale Climate Variability. J. Hydrol. Reg. Stud. 2021, 38, 100938. [Google Scholar] [CrossRef]
  106. Rehana, S.; Sireesha Naidu, G. Development of Hydro-Meteorological Drought Index under Climate Change—Semi-Arid River Basin of Peninsular India. J. Hydrol. 2021, 594, 125973. [Google Scholar] [CrossRef]
  107. Salimi, H.; Asadi, E.; Darbandi, S. Meteorological and Hydrological Drought Monitoring Using Several Drought Indices. Appl. Water Sci. 2021, 11, 11. [Google Scholar] [CrossRef]
  108. Liu, C.; Yang, C.; Yang, Q.; Wang, J. Spatiotemporal Drought Analysis by the Standardized Precipitation Index (SPI) and Standardized Precipitation Evapotranspiration Index (SPEI) in Sichuan Province, China. Sci. Rep. 2021, 11, 1280. [Google Scholar] [CrossRef]
  109. Hao, Y.; Baik, J.; Fred, S.; Choi, M. Comparative Analysis of Two Drought Indices in the Calculation of Drought Recovery Time and Implications on Drought Assessment: East Africa’s Lake Victoria Basin. Stoch. Environ. Res. Risk Assess. 2021, 36, 1943–1958. [Google Scholar] [CrossRef]
  110. Pei, Z.; Fang, S.; Wang, L.; Yang, W. Comparative Analysis of Drought Indicated by the SPI and SPEI at Various Timescales in Inner Mongolia, China. Water 2020, 12, 1925. [Google Scholar] [CrossRef]
  111. Zarei, A.R. Evaluation of Drought Condition in Arid and Semi- Arid Regions, Using RDI Index. Water Resour. Manag. 2018, 32, 1689–1711. [Google Scholar] [CrossRef]
  112. Musonda, B.; Jing, Y.; Iyakaremye, V.; Ojara, M. Analysis of Long-Term Variations of Drought Characteristics Using Standardized Precipitation Index over Zambia. Atmosphere 2020, 11, 1268. [Google Scholar] [CrossRef]
  113. Jabbi, F.F.; Li, Y.; Zhang, T.; Bin, W.; Hassan, W.; Songcai, Y. Impacts of Temperature Trends and Spei on Yields of Major Cereal Crops in the Gambia. Sustainability 2021, 13, 2480. [Google Scholar] [CrossRef]
  114. Gumus, V.; Algin, H.M. Meteorological and Hydrological Drought Analysis of the Seyhan−Ceyhan River Basins, Turkey. Meteorol. Appl. 2017, 24, 62–73. [Google Scholar] [CrossRef]
  115. Taji, S.G.; Keskar, A.P. Drought Identification and Analysis of Precipitation Trends in Beed District, Maharashtra. Mater. Today Proc. 2021, 61, 332–341. [Google Scholar] [CrossRef]
  116. Haied, N.; Foufou, A.; Chaab, S.; Azlaoui, M.; Khadri, S.; Benzahia, K.; Benzahia, I. Drought Assessment and Monitoring Using Meteorological Indices in a Semi-Arid Region. Energy Procedia 2017, 119, 518–529. [Google Scholar] [CrossRef]
  117. Dikici, M. Drought Analysis with Different Indices for the Asi Basin (Turkey). Sci. Rep. 2020, 10, 20739. [Google Scholar] [CrossRef]
  118. Nguvava, M.; Abiodun, B.J.; Otieno, F. Projecting Drought Characteristics over East African Basins at Specific Global Warming Levels. Atmos. Res. 2019, 228, 41–54. [Google Scholar] [CrossRef]
  119. Güner Bacanli, Ü. Trend Analysis of Precipitation and Drought in the Aegean Region, Turkey. Meteorol. Appl. 2017, 24, 239–249. [Google Scholar] [CrossRef]
  120. Ahmadalipour, A.; Moradkhani, H.; Demirel, M.C. A Comparative Assessment of Projected Meteorological and Hydrological Droughts: Elucidating the Role of Temperature. J. Hydrol. 2017, 553, 785–797. [Google Scholar] [CrossRef]
  121. Polong, F.; Chen, H.; Sun, S.; Ongoma, V. Temporal and Spatial Evolution of the Standard Precipitation Evapotranspiration Index (SPEI) in the Tana River Basin, Kenya. Theor. Appl. Climatol. 2019, 138, 777–792. [Google Scholar] [CrossRef]
  122. Qaiser, G.; Tariq, S.; Adnan, S.; Latif, M. Evaluation of a Composite Drought Index to Identify Seasonal Drought and Its Associated Atmospheric Dynamics in Northern Punjab, Pakistan. J. Arid Environ. 2021, 185, 104332. [Google Scholar] [CrossRef]
  123. Sutanto, S.J.; van Lanen, H.A.J.; Wetterhall, F.; Llort, X. Potential of Pan-European Seasonal Hydrometeorological Drought Forecasts Obtained from a Multihazard Early Warning System. Bull. Am. Meteorol. Soc. 2020, 101, e368–e393. [Google Scholar] [CrossRef]
  124. Johnson, L.E.; Geli, H.M.E.; Hayes, M.J.; Smith, K.H. Building an Improved Drought Climatology Using Updated Drought Tools: A New Mexico Food-Energy-Water (FEW) Systems Focus. Front. Clim. 2020, 2, 576653. [Google Scholar] [CrossRef]
  125. Andersson, L.; Wilk, J.; Graham, L.P.; Wikner, J.; Mokwatlo, S.; Petja, B. Local Early Warning Systems for Drought-Could add Value to Nationally Disseminated Seasonal Climate Forecasts? Weather. Clim. Extrem. 2020, 28, 100241. [Google Scholar] [CrossRef]
  126. Tindan, P.D.; Appiah, D.O.; Segbefia, A.Y. Attentive to Early Warning Drought Information: Implications for Policy Support and Climate Risk Reduction in Ghana. Int. J. Disaster Risk Sci. 2022, 13, 25–37. [Google Scholar] [CrossRef]
  127. Tadesse, T.; Wall, N.; Hayes, M.; Svoboda, M.; Bathke, D. Improving National and Regional Drought Early Warning Systems in the Greater Horn of Africa. Bull. Am. Meteorol. Soc. 2018, 99, ES135–ES138. [Google Scholar] [CrossRef]
  128. Maxwell, C.M.; Langarudi, S.P.; Fernald, A.G. Simulating a Watershed-Scale Strategy to Mitigate Drought, Flooding, and Sediment Transport in Drylands. Systems 2019, 7, 53. [Google Scholar] [CrossRef]
  129. Mushore, T.D.; Mhizha, T.; Manjowe, M.; Mashawi, L.; Matandirotya, E.; Mashonjowa, E.; Mutasa, C.; Gwenzi, J.; Mushambi, G.T. Climate Change Adaptation and Mitigation Strategies for Small Holder Farmers: A Case of Nyanga District in Zimbabwe. Front. Clim. 2021, 3, 676495. [Google Scholar] [CrossRef]
  130. Ali, M.; Ghaith, M.; Wagdy, A.; Helmi, A.M. Development of a New Multivariate Composite Drought Index for the Blue Nile River Basin. Water 2022, 14, 886. [Google Scholar] [CrossRef]
  131. Freire, P.; Rodrigues, M.; Fortunato, A.B.; Freitas, A. Flood and Drought Risk Assessment for Agricultural Areas (Tagus Estuary, Portugal). Nat. Hazards Earth Syst. Sci. 2021, 21, 2503–2521. [Google Scholar] [CrossRef]
  132. Le, T.; Sun, C.; Choy, S.; Kuleshov, Y. Regional Drought Risk Assessment in the Central Highlands and the South of Vietnam. Geomat. Nat. Hazards Risk 2021, 12, 3140–3159. [Google Scholar] [CrossRef]
Figure 1. Classification of different types of droughts.
Climate 10 00125 g001
Figure 2. Classification of drought risk management measures.
Climate 10 00125 g002
Table 1. The effectiveness of drought indices that are referenced in this article.
Drought IndexType of DroughtParametersCharacteristicsAdvancesLimitationsReferences Number in Manuscript for Each Index
CDIComposite or modelledModelled, precipitation, satelliteComposed of three warning levels (watch, warning, and alert) by integrating three drought indicators: SPI, soil moisture and remotely sensed vegetation data.The combination of remotely sensed and surface data make the spatial coverage to be good at a high resolution.Difficult replication and not available for regions outside of Europe. [122]
CMIMeteorologyPrecipitation, temperatureIt can determine any deficit by subtracting the difference between PET and moisture, it is intended to be suited to drought impacts on agriculture.Respond quickly to rapidly changing conditions, the output is weighted, therefore it can compare different climate regions.It was developed specifically for regions that produce grain in the United States of America, it may illustrate not a reliable sense of recovery from long-term drought incidents. [78]
CZIMeteorologyPrecipitationIs used to determine wet and dry periods Missing data are allowed, it can characterize bot wet and dry incidents, simple calculation. Shorter timescales may be less well represented.[80]
DIMeteorologyPrecipitationSimple calculation, it provides an accurate statistical measurement of precipitation.It can be used in meteorological, agricultural, and hydrological drought.A single input data[116,117]
EDDIAgricultureTemperature, humidity, wind speed, and net radiationThirst of the atmosphereFocusing on evaporative demand.
Can provide added value to other drought indicators, flash drought detection, and early warning.
Not directly measure on the ground conditions, not a drought predictor[89]
eRDI Monthly Precipitation and temperature. Inclusion of effective precipitation and PETIt is highly recommended to assess drought in hyper arid and arid regions.Similar to RDI [94,95]
ESIRemote sensingSatellite, potential evapotranspirationIt can use geostationary satellites to compare evapotranspiration to potential evapotranspiration. Very high resolution with a spatial coverage of any region.The results can be contaminated and affected by cloud cover. [89]
PSDIMeteorologyPrecipitation and temperatureIt considers moisture from precipitation and moisture stored in the soil.Applied around the world, its code and output are readily available, the ability to use soil data and total water balance makes it to be robust in identifying drought.Requirement of serial complete data, complexity of computation.[77]
RDIMeteorologyMonthly Precipitation and temperature.It can define drought duration, severity and predict the start and the end of drought periods, and incorporation of evaporation. The incorporation of PET provides a better representation of the full water balance of the specific region, it can better indicate the severity of drought, it can be computed at several time steps. The calculations of PET can be subjected to errors when using temperature only to create the estimate. For rapid developing droughts, reaction is not quickly enough at monthly timescales. [95,111,116]
RAIMeteorologyPrecipitationUtilizes normalized precipitation values depend on station history record of a given location.Simple calculation, with a single input data, the analysis can be done based on annual, seasonal, and monthly timescales.Serial complete dataset with estimates of missing values is required[81,99]
SPIMeteorologyPrecipitationEasy calculationsSPI data can be compared between regions with different climate conditions.A single input data[75,86,88,91,99,100,103,107,108,112,114,116,117,118]
SPEIMeteorologyPrecipitation and temperatureMulti-scalar index, Various methods of calculation. Inclusion of PET allows it to account for the impact of temperature on a drought situation.Require a long data record at least for 30 years.[19,76,86,87,91,98,102,104,105,107,108,109,110,113,117,118,121]
SPAEIHydro-meteorological Precipitation and temperatureIt can provide more insight in detecting the severe and extreme drought characteristics. Inclusion of actual evapotranspiration.It was first developed for India [106]
SDIHydrologyStreamflowInvestigation of dry and wet periods and severity of drought with an output related to that of SPI.Easy to use and readily available program, missing data are allowed, Provision of more accurate results.A single input data[114]
SRIHydrologyRunoffCalculations similar to that of SPI.It can investigate hydrological drought at various timescales and compare meteorological drought simultaneously at the same timescales.A single input data[117]
PNMeteorologyPrecipitationSimple calculations, can be computed at annual, seasonal, monthly, weekly, and daily timescales.Quicky and easy to compute with basic mathematics.It is very difficult to compare different climate regimes, especially those characterized by wet and dry seasons.[99]
VCIAssess drought that affect agriculture AVHRR satellite dataFocus on the impact of drought on vegetation and provide reliable information the characteristics of drought such as onset, duration, and severity by noticing vegetation changes and compering them with historical values.High resolution and good spatial coverage.Potential for cloud contamination and short period of record.[93,109]
TCIAssess drought of vegetation in the conditions where agricultural impacts are the major concern.AVHRR satellite dataIt used to determine stress on vegetation provoked by temperature and extreme wetness, High resolution and good spatial coverage.Potential for cloud contamination short period of record.[93]
Publisher’s Note: MDPI stays neutral with regard to jurisdictional claims in published maps and institutional affiliations.

