Article

Periods and Amplitudes of Southern Pine Beetle Infestations under Climate Change

1
Department of Forest Policy Research, Korea Rural Economic Institute, Naju-si 58321, Jeollanam-do, Korea
2
Department of Ecology and Conservation Biology, Texas A&M University, College Station, TX 77843, USA
*
Author to whom correspondence should be addressed.
Climate 2022, 10(9), 126; https://doi.org/10.3390/cli10090126
Submission received: 6 July 2022 / Revised: 25 August 2022 / Accepted: 26 August 2022 / Published: 28 August 2022
(This article belongs to the Special Issue Climate Change and Deforestation and Forest Degradation)

Abstract

:
The southern pine beetle (SPB), Dendroctonus frontalis Zimmermann, is one of the most destructive insects to pine forests in North and Central America. Historical SPB infestations have shown strong cyclical patterns and are attributed to an array of abiotic and biotic factors with climatic conditions being the dominant. Climate change has been projected to increase SPB infestations; however, its impacts on the cyclical patterns of SPB infestations remain unknown. Here, we estimated the statistical relationship between SPB infestations and climatic and other factors using generalized linear regression modeling and historical data, analyzed the cyclical patterns of SPB infestations via periodogram analysis and explored how these patterns would evolve with the projected future climate change in 11 states of the Southern United States. We found that SPB infestations intensified with increases in seasonal average temperatures and minimum winter temperatures and decreases in spring and winter precipitations. Compared to the historical SPB infestation patterns, climate change was estimated to nearly double SPB infestation frequencies although with smaller amplitudes in the region. Our findings advance the understanding of cyclical patterns of SPB infestations, especially climate change impacts on such patterns, aiding in developing and deploying future SPB management practices and strategies.

1. Introduction

Infestations of the southern pine beetle (SPB), Dendroctonus frontalis Zimmermann, are one of the most damaging disturbances to pine forests in North and Central America [1,2,3,4]. Major SPB outbreaks have been reported across its expanding range extending from Honduras and Nicaragua in the south in Central America to New Jersey in the north and Arizona in the west in the United States (US) [5,6,7,8,9]. The Southern US has been the epic center of SPB outbreaks, while this region is of national and international importance in the provisions of timber and non-timber ecosystem services. The region annually supplies approximately 60% of timber in the US and over 14% of industrial roundwood in the world [10,11,12], stores 14 Gt of carbon in its forests and harvested wood products with annual sequestration of about 87 Mt [13,14,15] and renders a variety of other ecosystem services ranging from water regulation to recreation and to biodiversity [11].
The outbreaks of the SPB in this region have threatened the health and productivity of its forest ecosystems and affected its short- and long-term provisions of timber and non-timber ecosystem services [1,2,16,17]. Climate change has been found to intensify SPB infestations and expand its range as the SPB population and host are likely to change under the projected climate change in a manner favorable to SPB outbreaks [18,19,20,21,22]. However, efforts to date on estimating the impact of climate change on the outbreaks of bark beetles in general and SPB in particular have been focused on infestation intensity, particularly linear trends [19,20,21,23]. Historical data, on the other hand, reveal that SPB infestations typically follow nonlinear patterns, especially cyclical patterns [24,25,26,27]. However, few studies have probed such patterns, particularly the climate change impact on the period (frequency) and amplitude of SPB infestations.
Previous work on SPB infestations was primarily focused on two aspects: identifying factors attributable to SPB population dynamics from entomological perspectives and modeling the relationship between SPB infestations and contributing factors using statistical tools and observed data. Considerable efforts have been made in entomology to identify and explain the factors and their influences on SPB outbreaks. Many biotic and abiotic factors have been found attributable to or correlated with SPB infestations, including forest structure and conditions, predators, droughts or water deficits, fire, silvicultural practices, and average and extreme temperatures [1,2,28,29,30,31,32]. Among these factors, climatic conditions, especially spring temperatures, summer maximum temperatures, winter minimum temperatures, and too much or too little precipitation, are arguably the most influential, as they affect the dynamics of SPB populations as well as the health of its host trees and natural predators [1,2,33,34]. The impacts of temperature and precipitation on SPB populations and infestations have long been recognized [35,36,37,38]. While warmer temperatures tend to stimulate beetle population growth and range expansion, exposure to hot temperatures in the summer and cold temperatures in the winter can cause insect mortality [2,33,39]. The stage of beetle development and response to seasonal temperature changes can influence beetle populations and infestations [27,40]. Moisture deficits or surpluses can also affect SPB populations and host trees, contributing to SPB infestations [37,38]. These findings have provided a solid theoretical basis for modeling the climate change impact.
Moreover, modeling studies have revealed that global climate change can accelerate the risk of SPB infestations, as changes in temperature and precipitation affect beetle populations and range expansion as well as the geographic distribution of pine forests [19,20,21,23]. These studies attempted to estimate the relationships between SPB infestations and biophysical attributes including climatic conditions using historical data and then, based on the estimated relationships, to project future SPB outbreaks under climate change [21,23]. However, the impacts of climate change on the cyclical partners (periodicities) of SPB infestations remain unknown, although such patterns are evident and vary across geographical locations [24,25,26].
Here, we attempted to uncover the impacts of climate change on the cyclical patterns of SPB infestations across 11 states in the Southern US. These states included Alabama, Arkansas, Florida, Georgia, Louisiana, Mississippi, North Carolina, South Carolina, Tennessee, Texas, and Virginia. In these states, pine forests are the dominant forest type [41], and annual data on SPB infestations have been consistently collected since the 1970s [42]. Pine forests in this region are primarily located in the ecological subregions of the Outer Coastal Plain Mixed Forest Province and Southeastern Mixed Forest Province [43]. The climate in the region is predominantly humid subtropical. The regional annual average temperature ranges from 15 to 20 °C with annual average precipitation varying from 1010 mm to 1520 mm [44]. The Southeastern Mixed Forest Province has mild winters and hot, humid summers, and the Outer Coastal Plain Mixed Forest Province has mild winters and warm summers. Precipitation in the region is generally abundant, although short periods of summer drought can occur from year to year [43]. However, there are considerable variations in temperature and precipitation among different parts of the region due to their different latitudes, longitudes, elevations, and distances from the coast of the Atlantic Ocean and the Gulf of Mexico. In general, temperature declines with a rise in latitude or elevation, and precipitation decreases with an increase in the distance from the Atlantic Ocean and the Gulf of Mexico.
This multi-state and multi-year modeling approach allowed us to examine SPB infestations by incorporating human (e.g., forest and SPB management) and natural (including SPB and its host and predators) adaptations across the regional climate gradient. Thus, our results can better reflect the reality of climate change impacts. Additionally, periodogram analysis was employed to identify and depict the cyclical patterns, revealing both amplitudes and periods of SPB infestations. Our results enrich the existing literature on climate change impacts on SPB infestations by advancing the understanding of likely cyclical SPB infestation patterns under the projected climate change, bridging a literature gap and aiding in developing and deploying future SPB infestation management practices and strategies.

2. Methods

2.1. Estimating the Relationship between SPB Infestation Risk and Climatic and Other Factors

2.1.1. Generalized Linear Model with a Fractional Response Variable

To estimate the statistical relationship between SPB infestations and climatic and other factors, we defined the SPB infestation risk as the ratio of the timber volume killed by SPB to the total volume of growing stock of pine trees. That is, S P B R i t = V K i t / V G i t , where V K i t and V G i t denote the volume of timber killed by SPB and the volume of pine growing stock in state i (11 states in the Southern US) and year t, respectively. Apparently, SPBRit is a fractional variable bounded by [0, 1]. Thus, the classical linear model estimated using the ordinary least squares method could be biased, as the estimated value of the response (dependent) variable could lie outside [0, 1] [45]. To avoid this complication, we adopted a generalized linear model (GLM):
g [ E ( y | X ) ] = X T β ,
where y is the response variable, X is a column vector of explanatory variables, β is a column vector of regression coefficients, T is the matrix transpose operator, and E is the expectation operator, and g[·] is also called the link function.
The logit or probit function is often used as the link function. We experimented with both functions, compared them using deviance and the Akaike information criterion (AIC) [46] and found the probit function was superior to logit in our case. Additionally, the probit model is computationally simple, especially with the presence of unobserved heterogeneity or endogenous explanatory variables [47] and thus preferred by modelers whose emphasis is on prediction rather than on parameter estimation [44]. Hence, the probit function was chosen in this study. From Equation (1), the regression of y on X can be recovered via the inverse link function, g−1(∙), namely:
E ( y | X ) = g 1 ( X T β ) .

2.1.2. Empirical Model and Data

The empirical model for estimating the statistical relationship between SPB infestation risk and climatic and other factors can be written as:
E ( S P B R i t | X i t ) = Φ [ ρ = 0 m ( β 0 + β 1 ρ U S V i , t ρ + β 2 ρ S P T i , t ρ + β 3 ρ S M T i , t ρ + β 4 ρ F L T i , t ρ + β 5 ρ W N T i , t ρ + β 6 ρ S P P i , t ρ + β 7 ρ S M P i , t ρ + β 8 ρ F L P i , t ρ + β 9 ρ W N P i , t ρ + β 10 ρ M i n S P T i , t ρ + β 11 ρ M i n S M T i , t ρ + β 12 ρ M i n F L T i , t ρ + β 13 ρ M i n W N T i , t ρ + β 14 ρ M a x S P T i , t ρ + β 15 ρ M a x S M T i , t ρ + β 16 ρ M a x F L T i , t ρ + β 17 ρ M a x W N T i , t ρ + β 18 ρ D S i , t ρ ) + β 19 d i ] ,
where Φ [ ] is the cumulative density function (CDF) of the standard normal distribution; i = 1, 2, …, n (state); t = 1, 2, …, T (year); ρ = 0, 1, …, m (lag operator); USV is the unsalvaged volume of pines killed by SPB (considered as an SPB control measure and measured in ‰ of pine growing stock); SPT, SMT, FLT, and WNT are the average spring, summer, fall, and winter temperatures, respectively; SPP, SMP, FLP, and WNP are the average spring, summer, fall, and winter precipitations, respectively; MinSPT, MinSMT, MinFLT, and MinWNT are the minimum spring, summer, fall, and winter temperatures, respectively; MaxSPT, MaxSMT, MaxFLT, and MaxWNT are the maximum spring, summer, fall, and winter temperatures, respectively; DS is the density of pine growing stock (m3/ha); and d is a dummy variable representing the 11 states to account for unobserved effects across states. The inclusion of these independent variables was based on the findings of previous studies as discussed earlier and the focus of this study on climate change impacts.
All temperatures were measured in °C, and precipitations were recorded in mm. March to May were considered the spring season, June to August were considered the summer, September to November were considered the fall season, and December to February were considered the winter season. Because climatic conditions and SPB control measure (e.g., salvage harvest) can have delayed effects on SPB infestations [1,21], lagged explanatory variables were also included in Equation (3). The partial F-test and AIC were used to determine the number of lags. Besides the function form expressed in Equation (3), we also experimented with the natural logarithms of variables and selected the best-fit model based on the AIC and F-test.
The data on the annual volume of pine trees killed by the SPB were obtained from the US Department of Agriculture (USDA) Forest Service Southern Research Station [42]. The data on the growing stock of pine forests were gathered from the forest inventory statistics [41]. Because the forest inventory data were only reported every 5–10 years, linear interpolations were applied to generate annual series of pine growing stock volume between two consecutive forest inventory times. Given the small changes in the growing stock for the study period and between any two consecutive forest inventory times (annual change rate of 0.05% or smaller on average) [41], linear interpolations were simple and appropriate. The SPB data represented annual series from 1973 to 2004 for each of the 11 states. The historical monthly average temperature and monthly total precipitation data were obtained from the National Climate Data Center [48], and the monthly maximum and minimum temperatures were from the fifth phase of the Coupled Model Intercomparison Project [49]. The monthly weather data were converted to quarterly data for our modeling purpose.

2.2. Projecting Climate Change Impacts on SPB Infestations

The final regression model estimated based on Equation (3) was used to project future SPB infestations under climate change. The future climates were based on the simulation results of two Global Climate Models (GCMs), GFDL-CM3 [50] and HadGEM2-ES [51], under three Representative Concentration Pathway (RCP) scenarios, RCP 4.5, RCP 6.0, and RCP 8.5. Both GFDL-CM3 and HadGEM2-ES included the features of both Atmosphere-Ocean General Circulation Models (AOGCMs) and Earth System Models (ESMs) with increased complexity and resolution compared to previous GCMs [52]. The RCP scenarios were defined based on the radiative forcing of cumulative greenhouse gas (GHG) emissions from all sources and expressed in watts per m2 (W/m2) [53,54]. The three RCP scenarios represent different targets/trajectories of global GHG emissions. We did not use RCP 2.6, because we thought that it is less likely to be achieved based on existing global GHG emission trends and mitigation commitments. Future SPB infestations were projected from 2020 to 2099.

2.3. Analyzing the Cyclical Patterns of SPB Infestations

Periodogram analysis was applied to analyze the periodicities of SPB infestations. This approach began with testing whether a SPB infestation risk data series followed a white noise or cyclical pattern. After a cyclical pattern was detected, the data series was decomposed, and its cyclical component was isolated. Finally, the period and amplitude of the SPB infestations were calculated based on the cyclical component. The periods and amplitudes of both the historical (from 1973 to 2004) and projected future SPB infestations under climate change (from 2020 to 2099) were calculated and compared.
Specifically, we used the Bartlett’s Kolmogorov−Smirnov (BKS) test [55,56] to check on the existence of any cyclical pattern of the SPB infestations. After a cyclical pattern was confirmed, we employed the Hodrick−Prescott (HP) filter [57] to extract the cyclical component from the SPB infestation risk data series. The use of the HP filter was largely because it does not require a stationary time series, can better deal with the problem associated with the ends of a sample and can perform comparably well with other alternative filters [57,58]. In applying the HP filter, the SPB infestation risk ( S P B R t ) was decomposed into two parts: S P B R t = τ t + c t , where τ t and c t are the trend and the cyclical component, respectively. The decomposition attempted to derive the trend component by minimizing:
t = 1 T { ( S P B R t τ t ) 2 + λ [ ( τ t τ t 1 ) ( τ t 1 τ t 2 ) ] 2 } ,
where λ is the smoothing factor. The first term of Equation (4) penalizes the cyclical component, while the second term penalizes changes in the growth rate of the trend component. As the value of λ increases, a larger penalty is imposed on the second term. By minimizing the sum of these two terms with an appropriately selected value of λ, the long-term trend (the trend component) is derived. In common practices, λ = 100 is used for annual data [59]. After the trend component was isolated, the cyclical component was obtained by subtracting τ t from S P B R t . Finally, the dominant frequency/period and corresponding amplitude of the cyclical component were derived via periodogram analysis. The periodogram is considered as an estimate of the spectral density of a time series, displaying its frequency/period and amplitude [55]. The dominant frequency/period can be detected where the periodogram peaks.

3. Results

3.1. Estimated Relationship between SPB Infestation Risk and Climatic and Other Factors

Table 1 shows the estimated statistical relationship between SPB risk and climatic and other factors using the historical data of the 11 states from 1973 to 2004. The regression results revealed that the average temperatures in spring, fall, and summer, the minimum winter temperature, and the spring and winter precipitations were strongly correlated with historical SPB infestations. An increase in average spring temperature tended to augment the SPB risk in the same year, whereas a rise in average spring temperature two years ago decreased the risk. An increase in average summer temperature two years ago intensified the SPB infestations in the current year; however, a rise in average fall temperature reduced the risk in the same year. Clearly, there was a complex relationship between the SPB infestation risk and seasonal average temperatures, including delayed and bidirectional impacts. Nevertheless, the combined effect of all these seasonal average temperatures was positive, suggesting that an equal percentage increase in all seasonal average temperatures will boost the SPB infestation risk.
Of all seasonal maximum and minimum temperatures included in the modeling, only the minimum winter temperature was found to be positively associated with SPB outbreaks. A decrease in spring and winter precipitation in the previous year stimulated SPB infestations in the current year.
The timber salvage of SPB infested trees helped reduce further infestations. Surprisingly, we did not find a statistically significant relationship between growing stock density and SPB infestations.

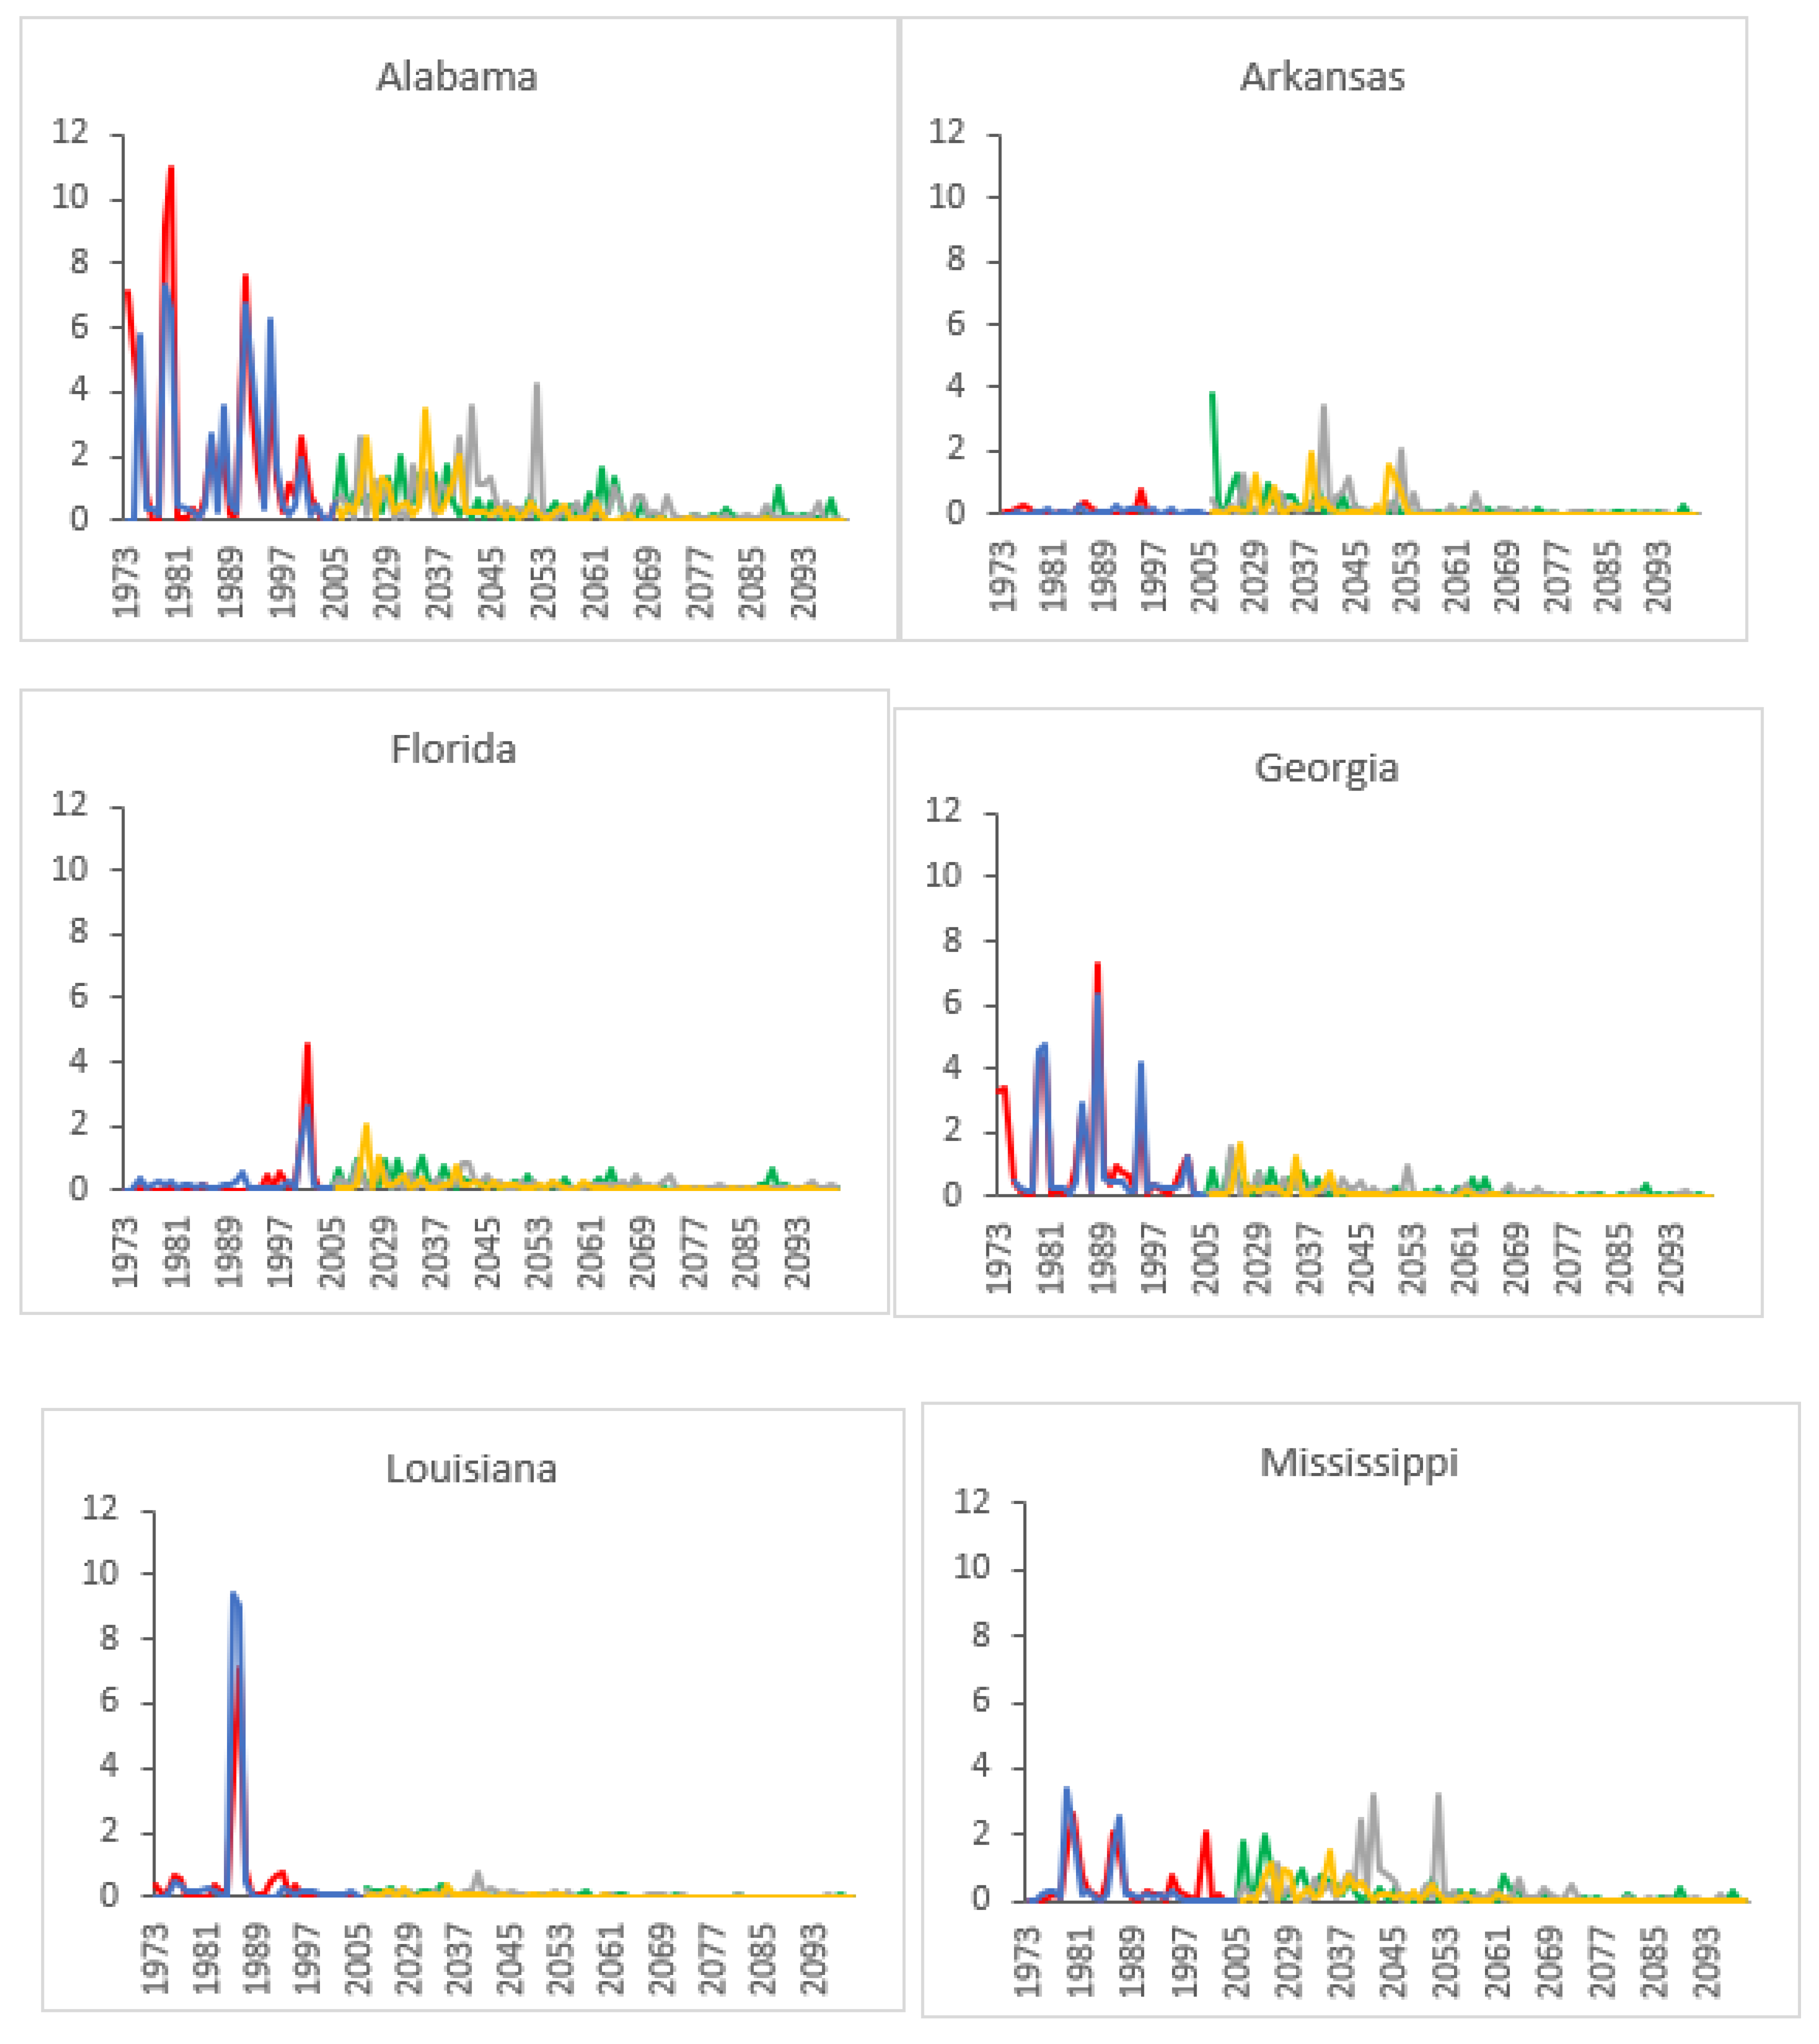
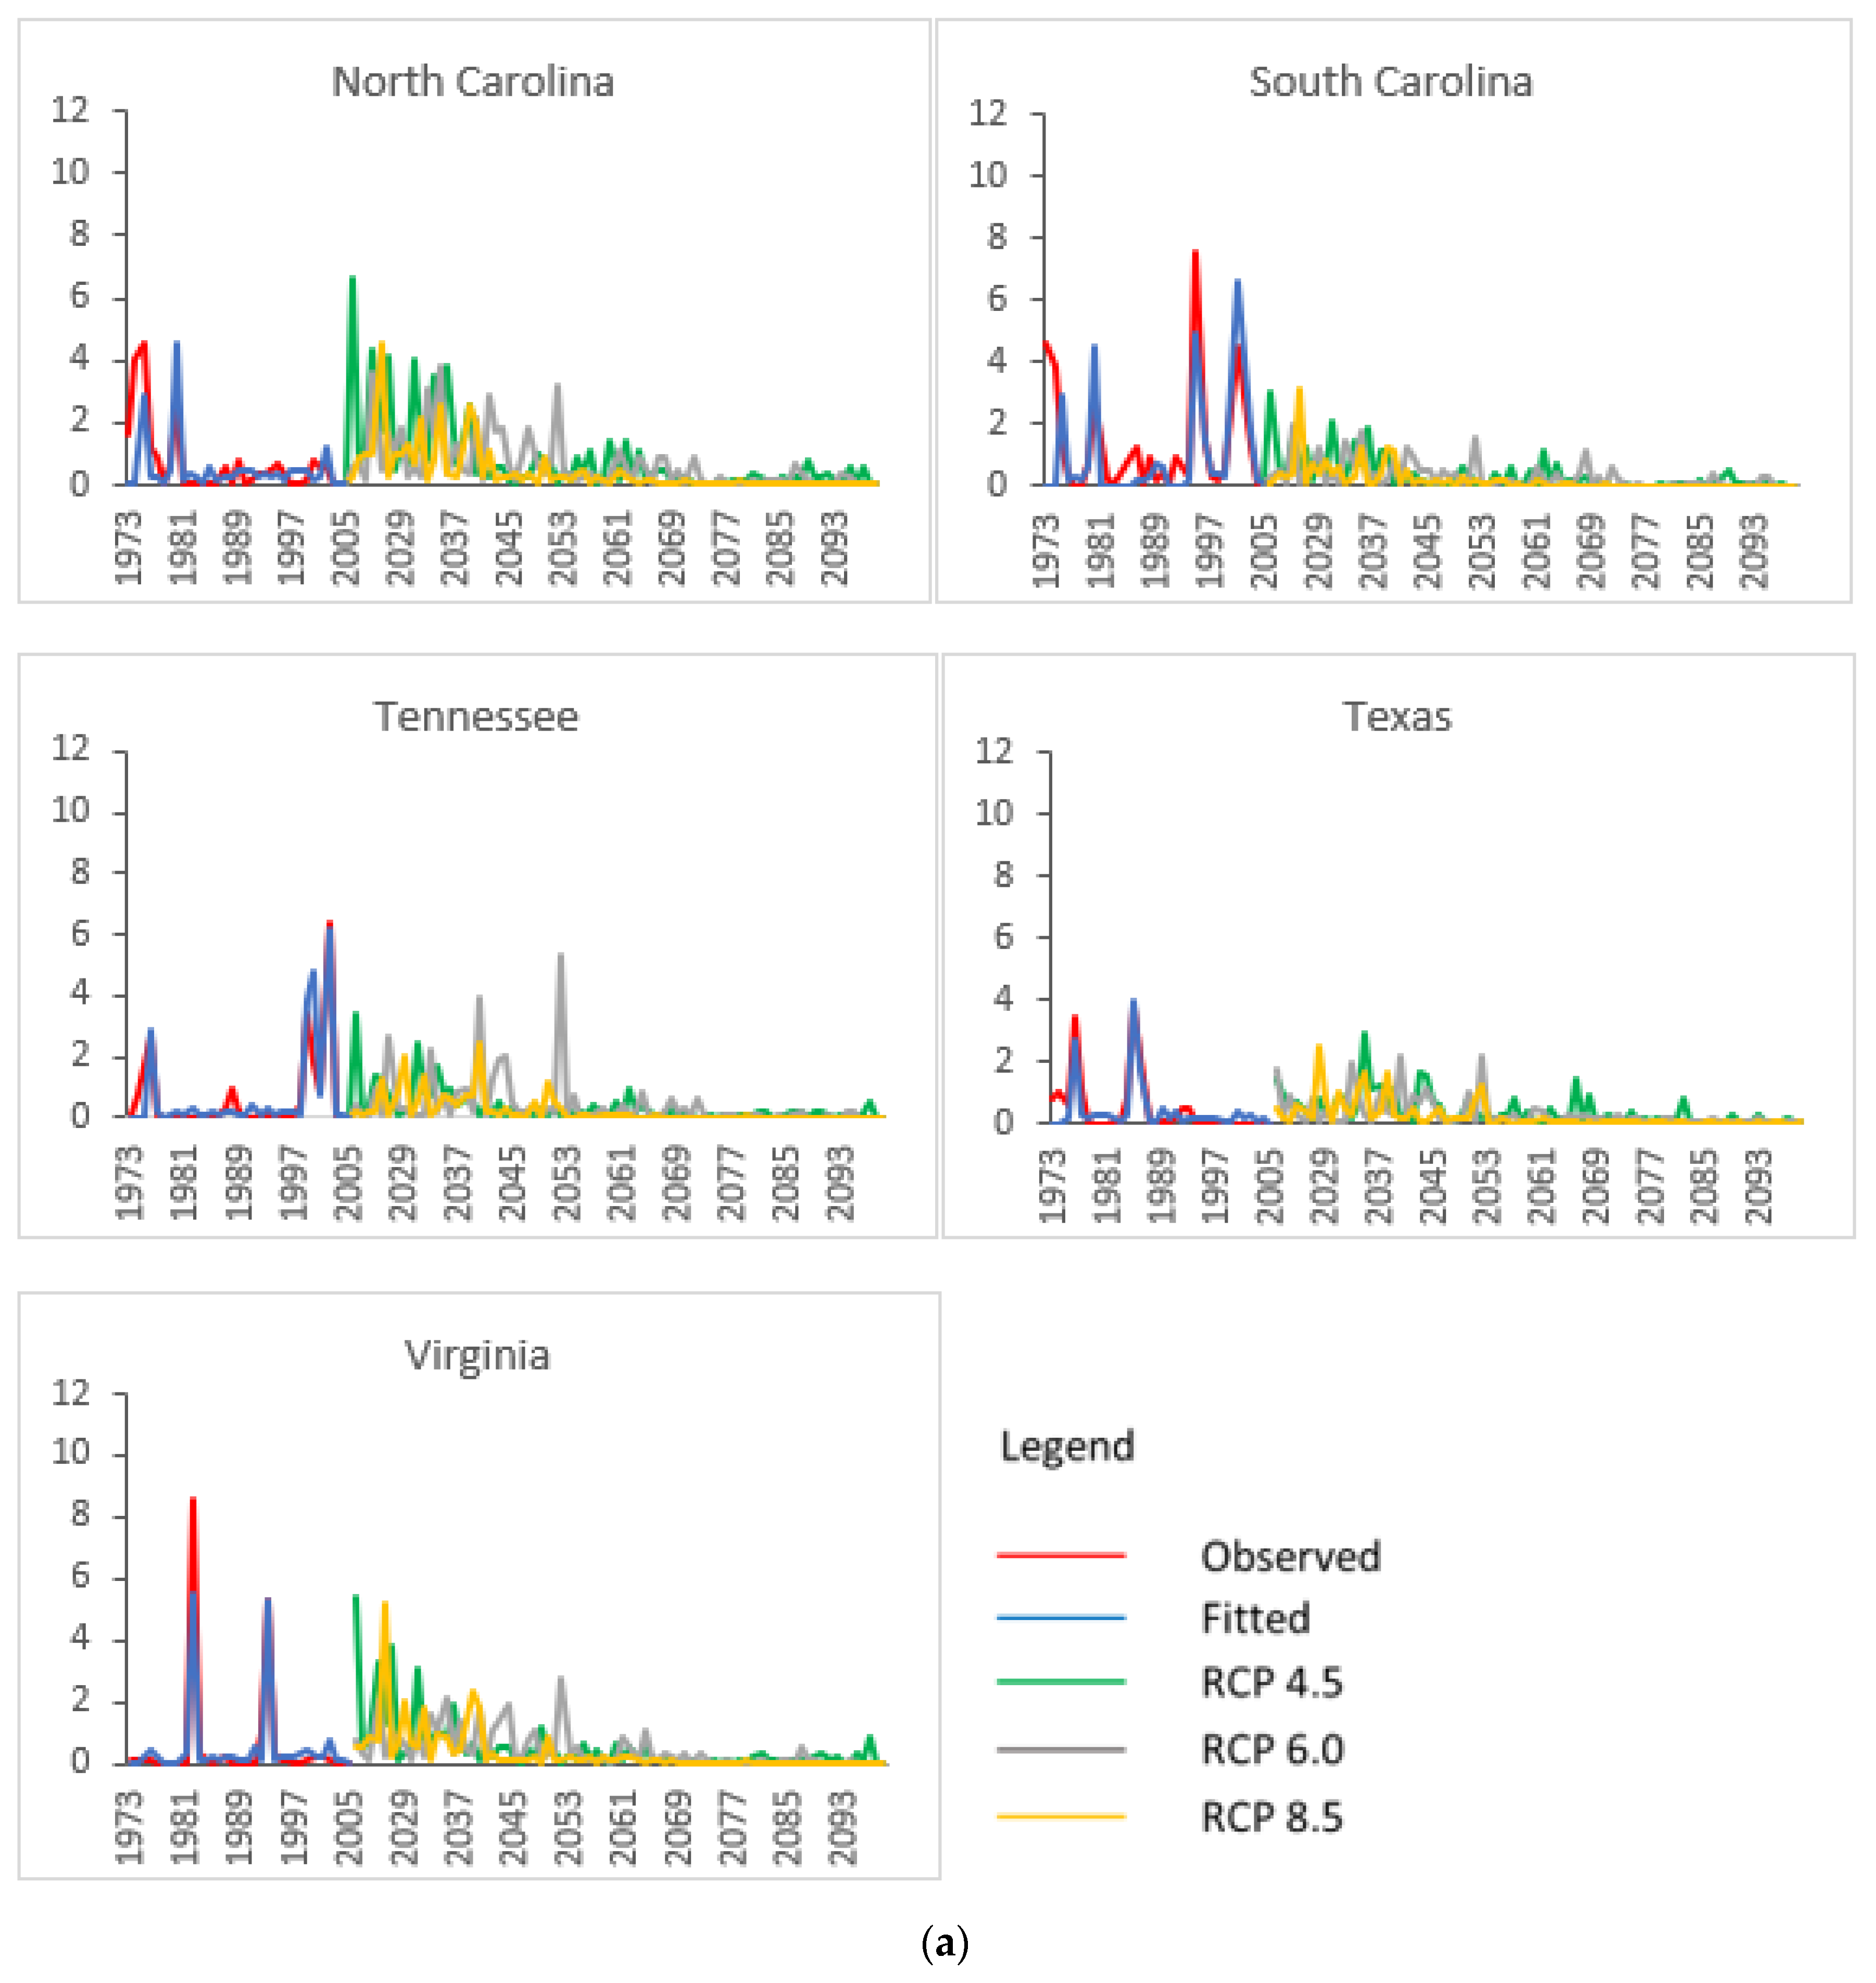
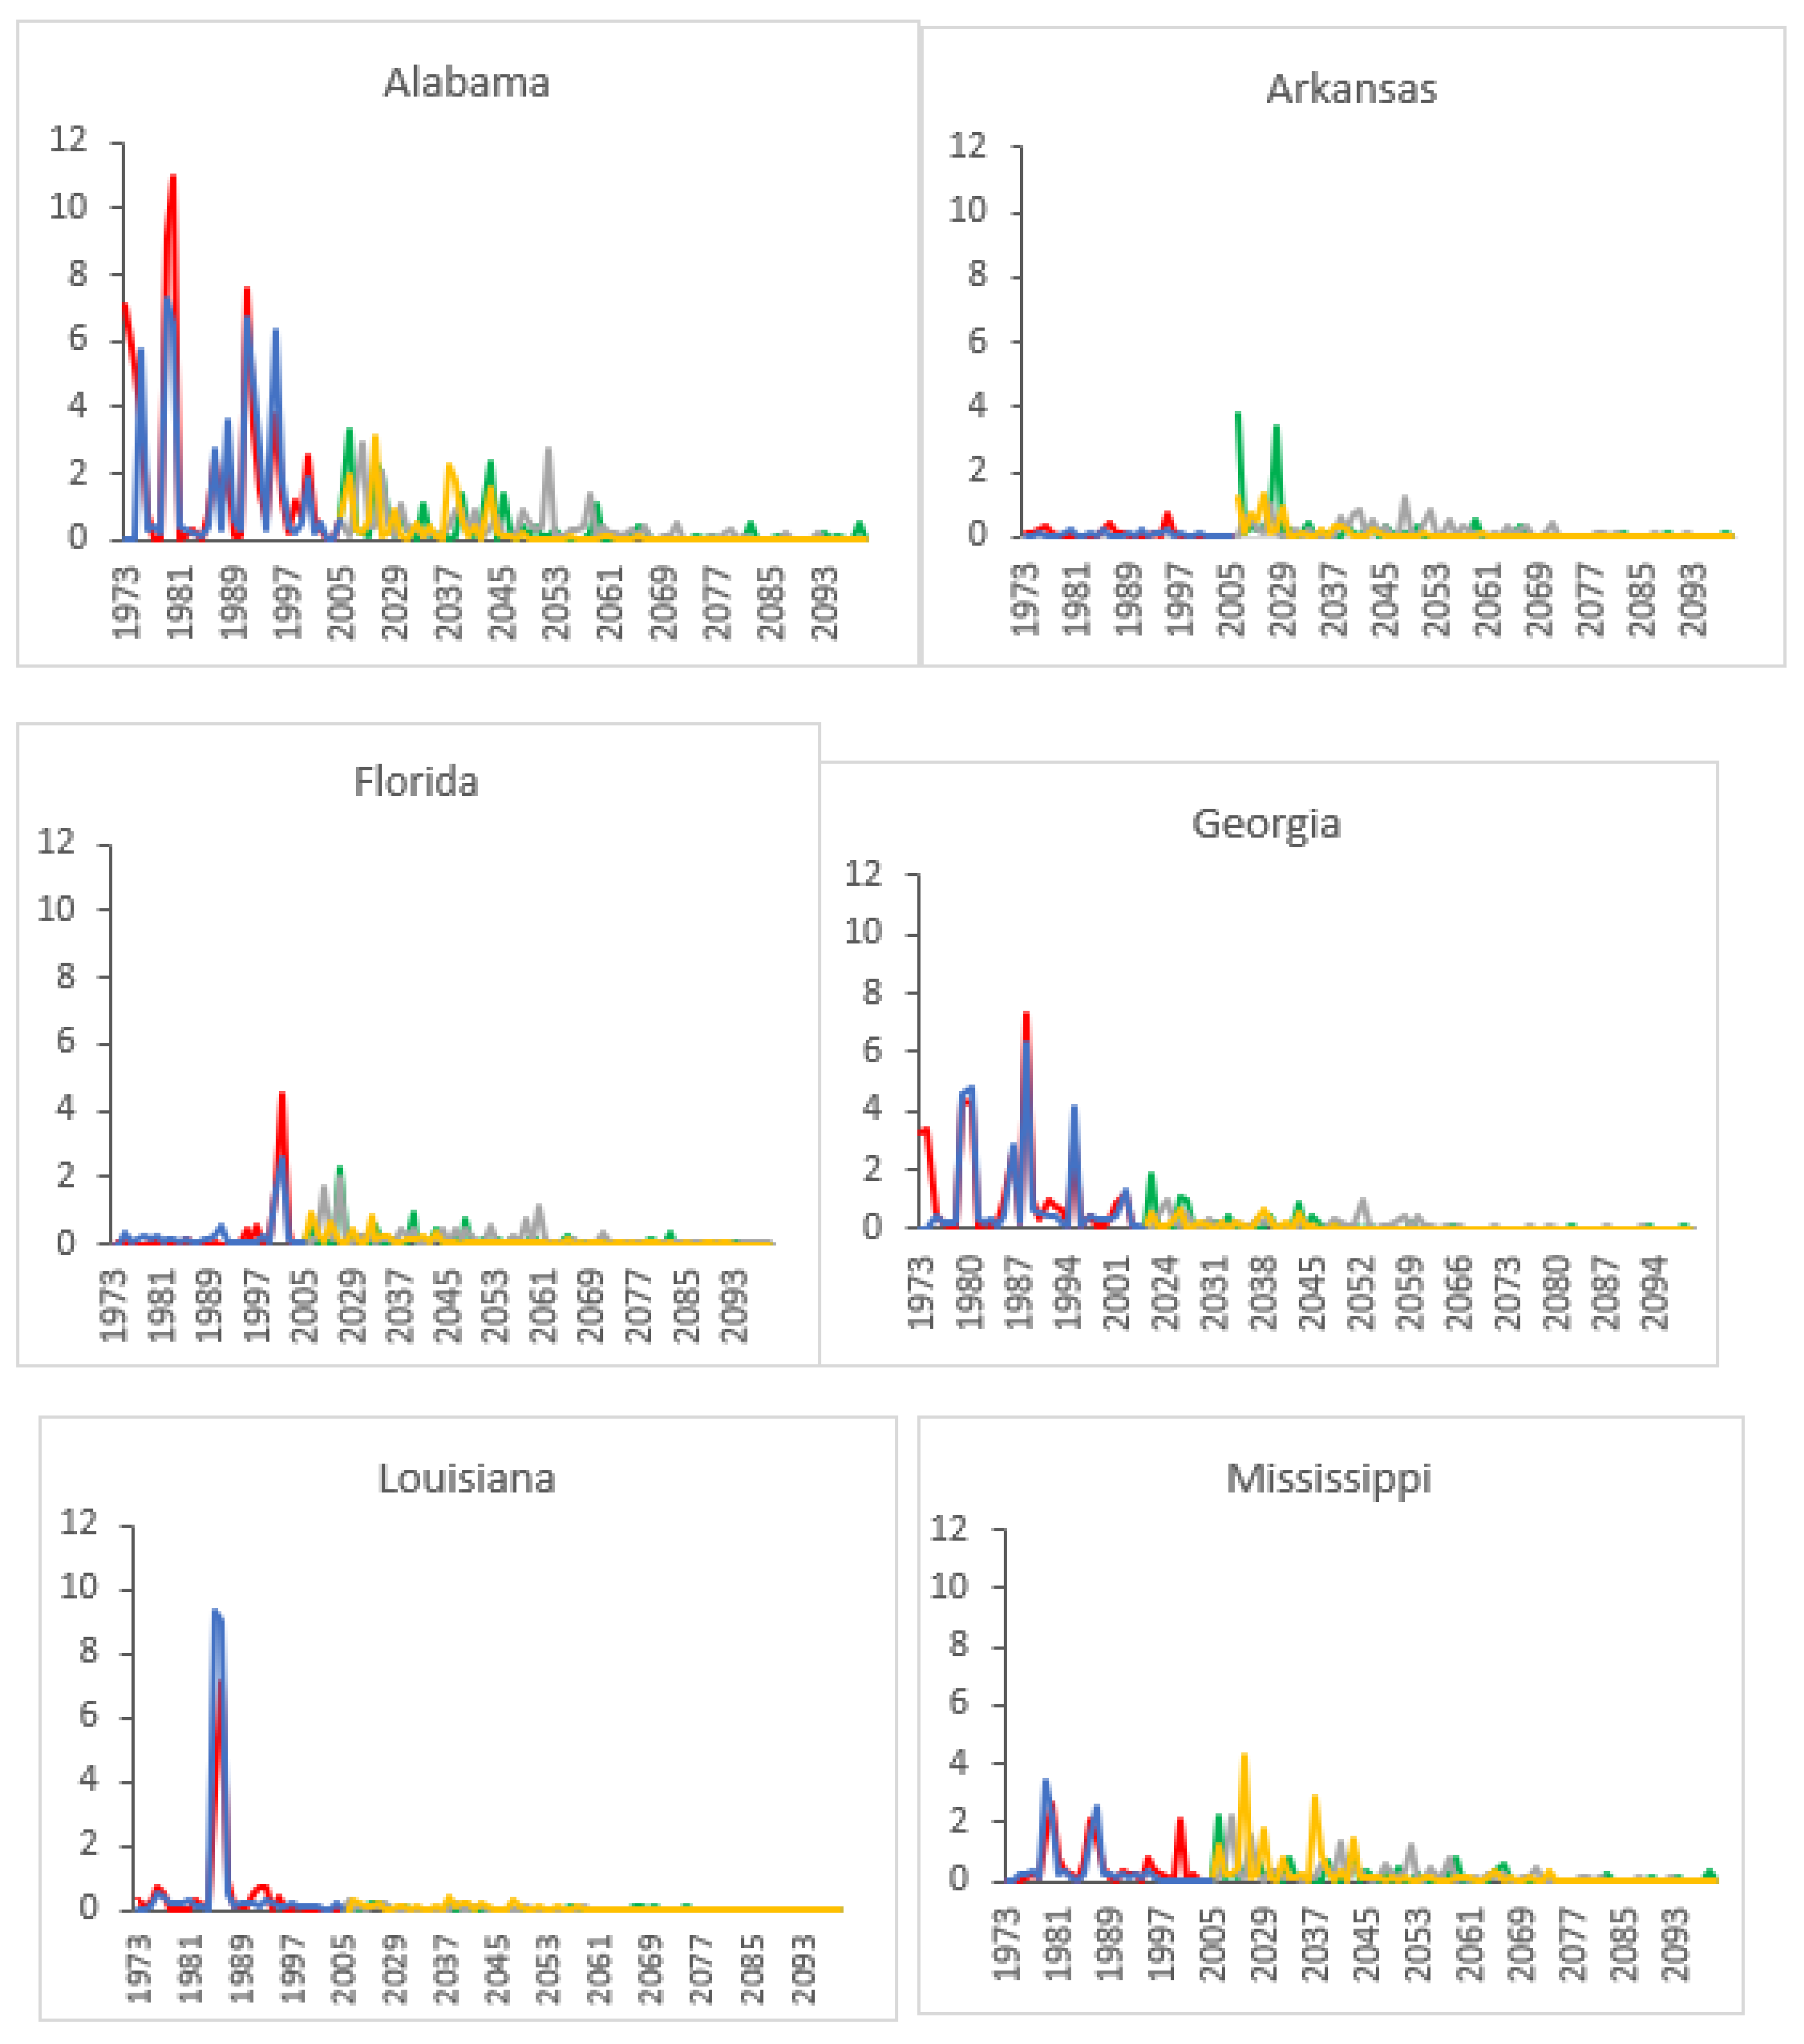
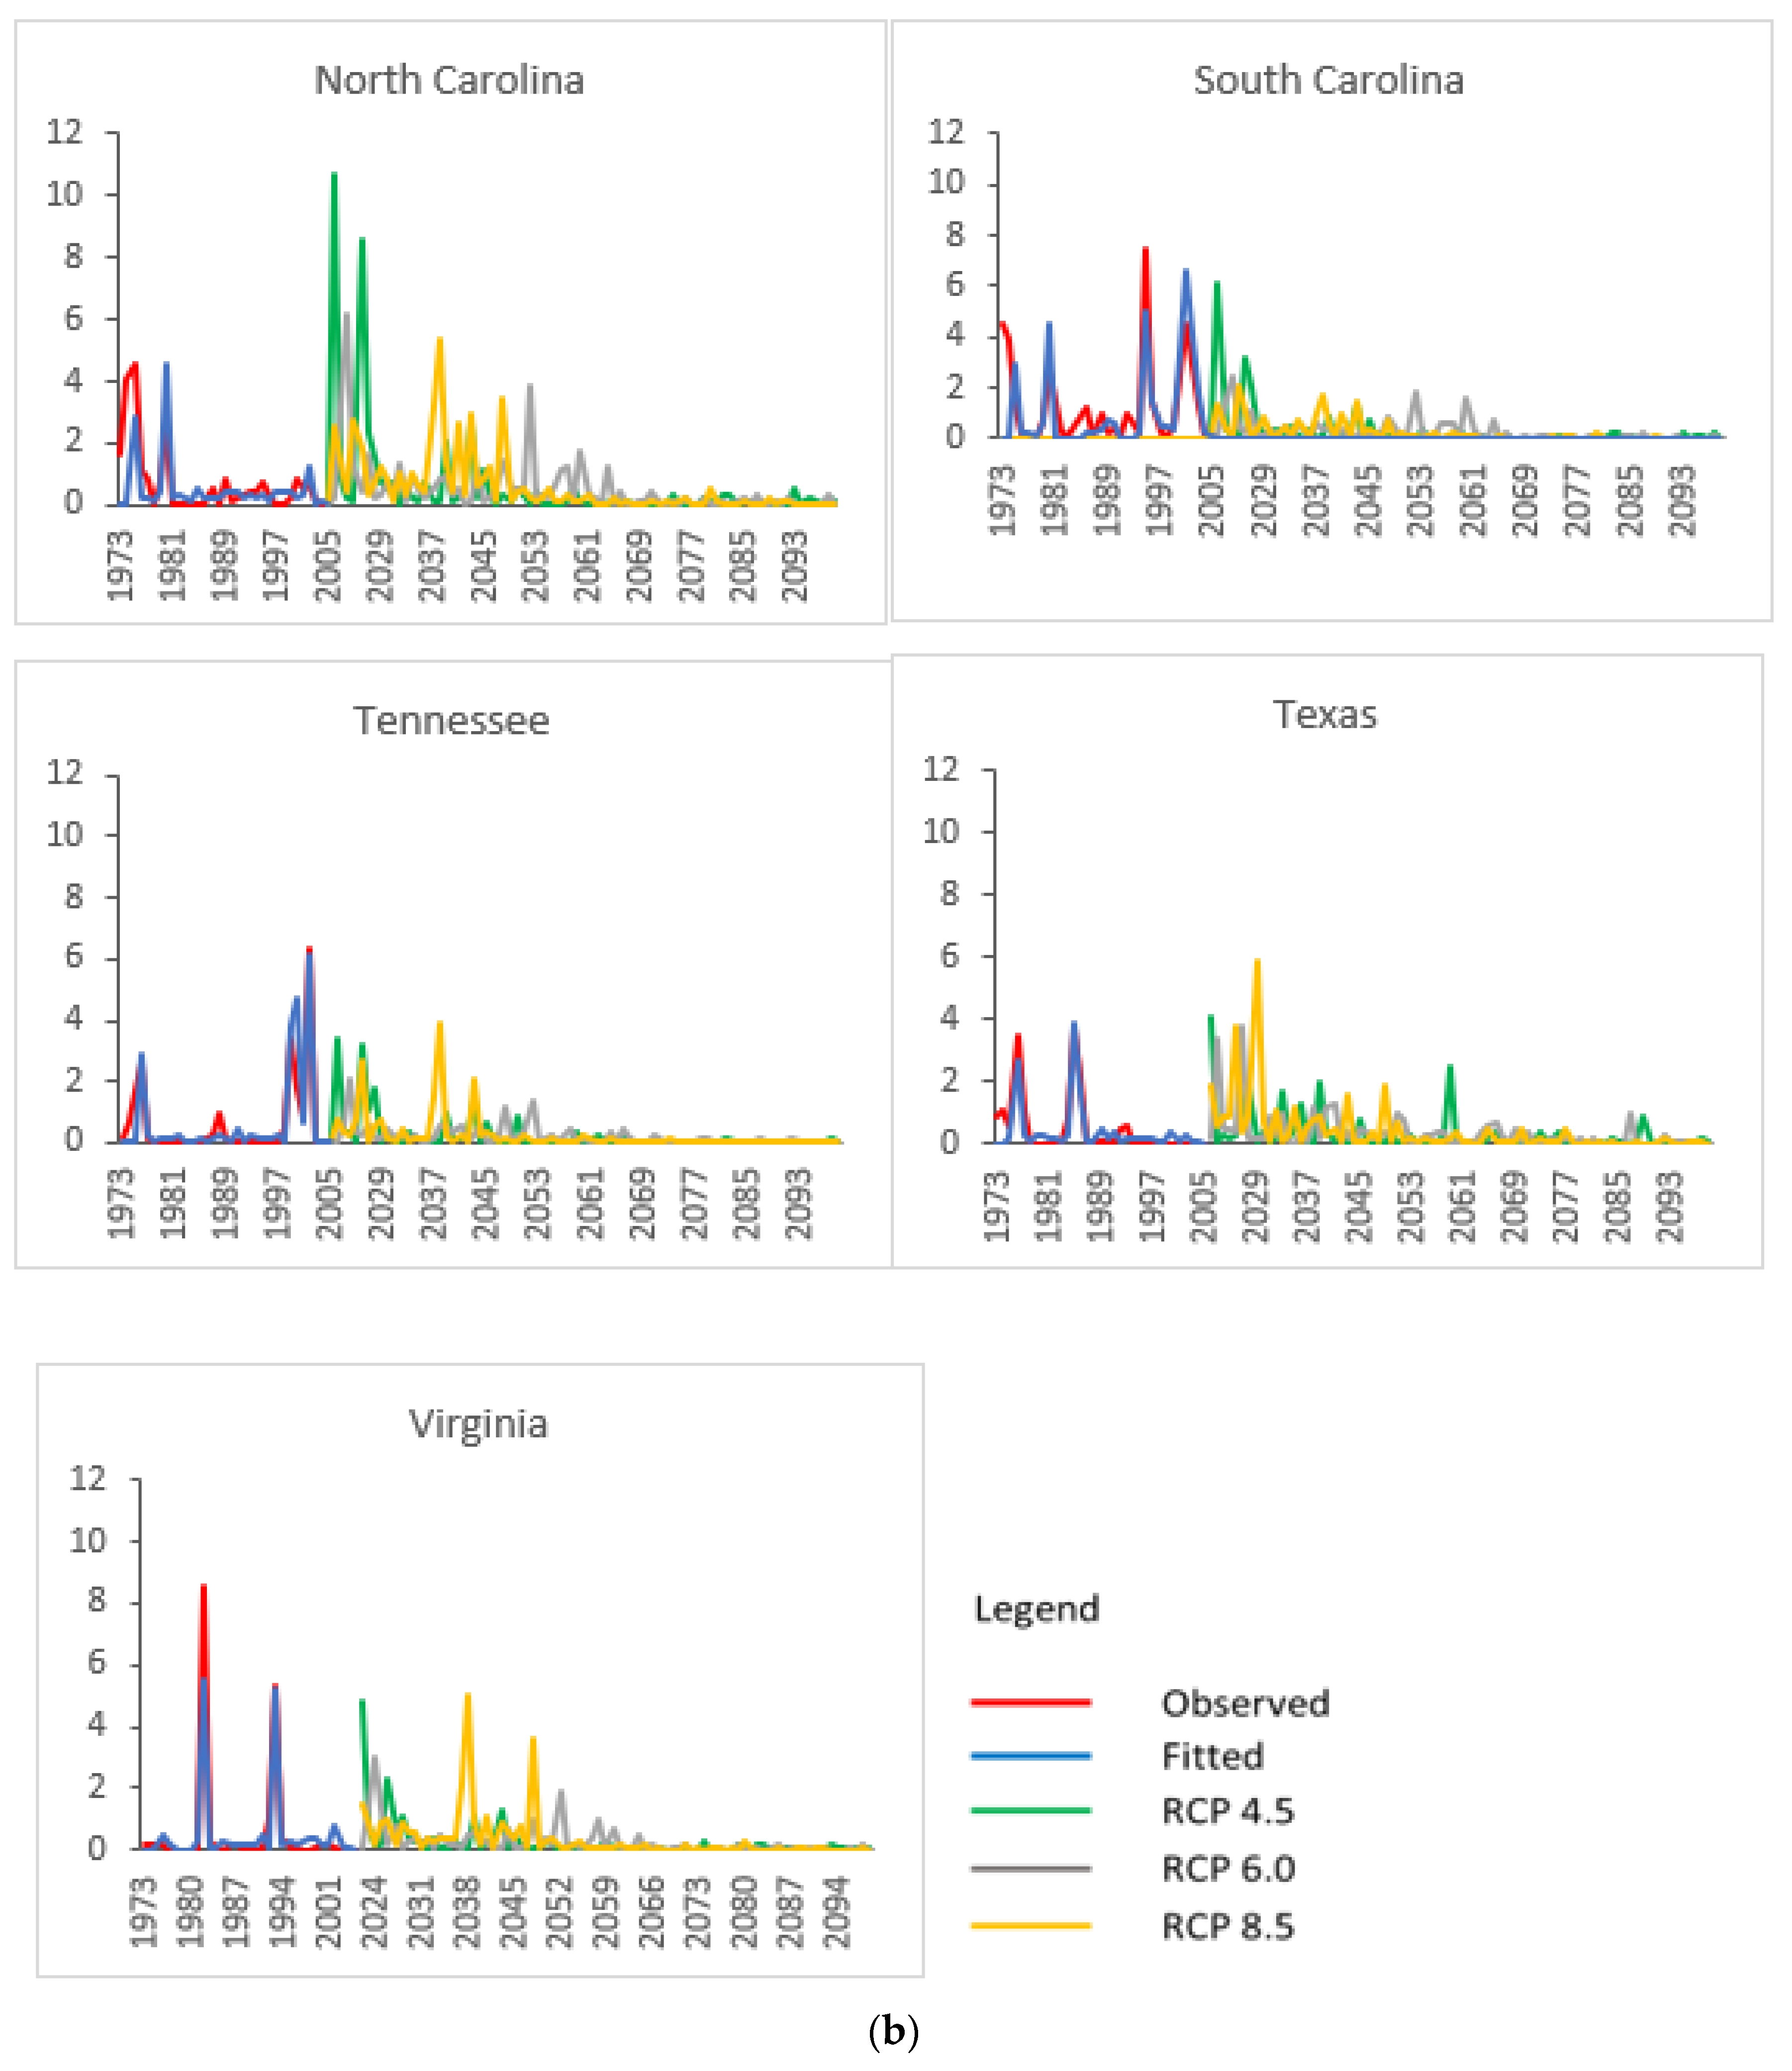
3.2. Projected SPB Infestation Risk under Climate Change

The BKS test results showed strong statistical evidence of cyclical patterns of SPB infestations under climate change (all statistically significant at the 1% level). Climate change in general would reduce the periods and amplitudes of SPB infestations in the Southern US, except for three states (Table 2), and this result was consistent across all three RCP scenarios and two GCMs, except for the estimated amplitudes in RCP 8.5 between the two GCMs. In terms of the regionwide average, climate change would reduce the period of SPB infestations by 44–49% (from 6.26 years to 3.22–3.49 years), with only small variations across the three RCP scenarios and two GCMs. The largest percentage reduction in the period of SPB infestations would occur in Georgia (71% reduction in RCP 4.5 with HadGEM2-ES), followed by Louisiana, Alabama, Mississippi, Texas, and North Carolina. Most states would experience shorter periods of SPB infestation recurrences under climate change. Only exceptions are Virginia in RCP 8.5 with HadGEM2-ES, Arkansas in RCP 6.0 with HadGEM2-ES, and Tennessee in RCP 4.5 with GFDL-CM3. In these cases, the period of SPB infestations would, instead, increase by 42%, 22%, and 8% in Virginia, Arkansas, and Tennessee, respectively.
The amplitudes of SPB infestations would also decline for most states in most RCP scenarios. With the future climates projected by HadGEM2-ES, the regional average amplitude of SPB infestations would fall by 46–57%; with the future climate projected by GFDL-CM3 in RCP 8.5, it would drop even more by 98%. Interestingly, larger reductions in the regional average amplitude would occur in RCP 8.5 than in RCP 4.5 or 6.0. However, there was a substantial difference in the estimated amplitudes in RCP 8.5 between the two GCMs, the only inconsistency in the estimated climate change impacts on SPB infestations between the two GCMs. The projected amplitudes would vary across states. For instance, Arkansas and North Carolina could experience augmented amplitudes in all three RCP scenarios based on the future climates projected by HadGEM2-ES; Arkansas, North Caroline, and Texas would face increased amplitudes based on the future climates projected by GFDL-CM3 under RCP 4.5 and RCP 6.0 (Table 2). Figure 1 displays the cyclical patterns of both historical and projected SPB infestations in more detail for each state over the entire historical and projection timeframe.

4. Discussion

We found that SPB infestations would become more frequent but with smaller amplitudes under climate change, which is counterintuitive and enriches the existing body of knowledge. There could be multiple reasons behind this, and it is unlikely to fully understand all of them without more comprehensive knowledge about biotic and abiotic drivers and mechanisms of SPB cyclical infestations. Here, we attempted to shed light on possible reasons based on our modeling results and the projected future climate attributes. According to the projected future climates under the three RCP scenarios in the region, temperatures would climb with oscillations rather than rise along a straight line, and precipitations would oscillate even more without a noticeable uptrend. Additionally, temperature and precipitation changes would not be identical across different seasons. These projected future climate attributes are consistent with those described in the US national climate assessment report [60]. The temperature and precipitation oscillations, their asymmetrical changes among seasons, and overall temperature rising trends were all attributed to the reduced periods and amplitudes of SPB infestations under climate change.
Specifically, although temperatures (average, maximum, and minimum) in the region were projected to increase, the magnitudes of temperature increases would not be equal in all seasons. For example, there would be a higher percentage increase in fall temperature than in summer temperature. The negative impact of the fall temperature increase would outweigh the combined positive impact of temperature increases in all other seasons (especially in the summer), because SPB infestations responded differently to temperature changes in different seasons (Table 1), leading to lower SPB infestation amplitudes. Additionally, the oscillations of seasonal temperatures (e.g., different directions and magnitudes of temperature changes in different seasons in the same year or in the same season over different years) would make the positive and negative impacts of temperature changes mutually compensated to some extent (Table 1), reducing the overall impacts of temperature changes on SPB infestation amplitudes. In terms of the reduced periods of SPB infestations, temperature extremes (maximum and minimum) would occur or oscillate more frequently under climate change. This will make SPB populations expand and contract in a higher pace, increasing the frequency of SPB infestations. Moreover, rainfall intensity was projected to increase without a noticeable rising trend in annual total precipitation in the region. That is, rainfalls would become more unevenly distributed temporally and oscillate more intensively under climate change. This rainfall change pattern, coupled with increased temperatures, would make droughts and floods (moisture deficits and surpluses of trees) occur more often, increasing the frequency of SPB infestations as well. Although several factors are attributable to the decreases in both SPB infestation period and amplitude under climate change, the increased oscillations of both temperature and precipitation and the asymmetric seasonal temperature change (especially the high percentage increase in fall temperature) and impact on SPB risk seem to be the main reason for the reduced period and amplitude, respectively.
Our result also showed no drastic differences in the impacts of climate change on SPB cyclical infestation patterns under RCPs 4.5, 6.0, and 8.5, except for the SPB infestation amplitude in the future climate projected by GFDL-CM3 in RCP 8.5. In other words, a mild climate change could alter SPB cyclical infestation patterns nearly as much as a more severe climate change. This could be partly because the projected future climates did not show large differences among the three RCP scenarios, especially before the last 2–3 decades of this century. Additionally, beetle populations do not respond drastically, until a temperature or precipitation change exceeds certain threshold [35,36,37,38,39,61,62], and of all regions in the US, the Southeast would experience the lowest temperature rise under all RCP scenarios [60]. The inconsistency in the predicted SPB infestation amplitudes in RCP 8.5 between the two GCMs was primarily due to the differences in their projected future climates, particularly in the last part of the century.
Besides new findings, this study also confirmed the complex relationships between SPB infestations and climatic and other factors (Table 1). For instance, we found that a rise in winter minimum temperatures can stimulate SPB infestations, as precious studies indicated that minimum winter temperatures act to limit the SPB population growth [34,39]. High mortality can occur among SPB populations, when temperatures drop below −12 °C [35,61,62]. Additionally, a change in temperatures or precipitation would have a delayed impact on SPB infestations, and changes in average temperatures in different seasons can have both positive and negative impacts on SPB infestations. Such complexity could be attributed to the multifaceted interactions among temperature, SPB population dynamics, and host trees [1,2,27,28]. Salvage harvest removes infested trees, acting like the cut-and-remove method of SPB management and thus controlling infestation expansions [63]. However, no statistical relationship between SPB infestation risk and pine forest growing stock density was detected. This may be partly due to relatively small variations in the growing stock density, as the growing stock and area of pine forests have remained relatively stable in the Southern United States since the 1970s [41].
Our findings have important implications for SPB management in the Southern US and beyond. With climate change, it is important for the region to develop and adopt SPB monitoring and management strategies that can effectively deal with more frequent but less intensive SPB infestations. This new pattern of SPB infestations has also been noticed in recent years [64] and considered to be related to more intensive forest management, particularly in plantation forests [65]. However, the forces behind this SPB infestation pattern shift could be more complex and may include changes in climatic conditions as well [64]. Most importantly, the shift in the SPB infestation pattern does not necessarily mean reduced aggregate SPB risk and damage for all states in the region. Some states, where the percentage reduction in amplitude would outweigh that in the period (AL, FL, GA, and LA) or both amplitude and frequency would decline (only in three cases: TN under RCP 4.5, HadGEM2-ES and GFDL-CM3 and VA under RCP 8.5, and HadGEM2-ES) and would experience lower aggregate SPB risk. However, aggregate SPB risk in some other states as well as regional average SPB risk may goes up under certain climate scenarios where the percentage period decrease would outweigh the percentage amplitude reduction (e.g., TN under RCP 6.0, HadGEM2-ES; TX under all three RCP scenarios, HadGEM2-ES; SC under RCP 4.5, HadGEM2-ES; VA under RCP 4.5, GFDL-CM3; regional average under RCP 4.5, GFDL-CM3 and RCP 6.0, HadGEM2-ES); needless to say, for several states (AR, MS, NC, and TX), amplitude would increase with a shorter period under some scenarios (Table 2). In sum, while aggregate SPB risk may reduce in AL, FL, GA, and LA, it is more likely to increase in AR, MS, NC, and TX with climate change. Therefore, the shifting SPB infestation pattern calls for adjusting SPB monitoring and management strategies in the region. The variations in SPB infestation patterns across states in the region, especially the increased SPB infestation frequencies and amplitudes in several states, precipitate the increased complexity for monitoring and managing SPB infestations in the region under climate change.
Here are suggestions for mitigating climate change impacts on SPB infestations. First, current SPB risk assessment and projection models/systems need to be updated to incorporate the complexity of climate change and resultant consequences on SPB infestations. For example, new climate attributes, including rising temperatures and the increased magnitudes and frequencies of temperature extremes and heavy rainfalls, and their impacts on SPB populations and host trees may entail the improvement of existing assessment tools. Thus, SPB infestations can be more accurately predicted, more effectively guiding SPB monitoring and management efforts. Second, more frequent SPB infestations and variations cross states imply more frequent monitoring efforts across the entire region, potentially increasing the costs of SPB monitoring. Remote sensing technology and devices, coupled with traditional approaches, can provide more timely and effective early warning and detections of SPB infestations. Additionally, developing and utilizing tools that are capable to simultaneously monitor multiple disturbances (e.g., SPB and wildfire) could also reduce the costs of SPB monitoring. Third, there is a need to enhance the capacity and efforts to salvage SPB damaged timber at both local and regional levels in response to more frequent SPB infestations. The expanded use of salvaged timber for manufacturing value-added bioproducts can further incentivize the salvation efforts. Lastly and above all, research aimed to better understand the drivers and mechanisms of SPB temporal and spatial infestation patterns and to enhance the resistance and resilience of southern pine forests to climate change in general and SPB infestations in particular through tree breeding and silvicultural innovations is more likely to hold the key to mitigating SPB infestation risk for years to come.
Although this study was focused on SPB in the Southern US, our findings may have implications for other bark beetles including mountain pine beetles in the Western US. Despite their differences, these beetles seem to share some commonalties in their response to changes in climatic conditions [62,66]. Likely, climate change is projected to change water availability patterns in the Southern and Western US alike, and the Western US would be likely to witness more severe water shortage with rising temperatures [60]. These changes will impact both beetles and their hosts, creating conditions favorable to beetle infestations and adding new challenges for mitigating beetle infestations.

5. Conclusions

We explored the cyclical patterns of SPB infestations in the Southern US and climate change impacts on such patterns. We found that compared to the historical trends, climate change would nearly double the regional average frequency of SPB infestations in the Southern US, although with smaller amplitudes. Moreover, the impacts of climate change on the periods and amplitudes of SPB infestations for many states in the region and the region as a whole would not worsen from RCP 4.5 to RCP 8.5, suggesting that even a moderate climate change could dramatically alter the cyclical patterns of SPB infestations in the region. These results advance the knowledge of climate change impacts on SPB cyclical infestation patterns and can be helpful in developing and deploying more effective SPB management strategies especially in response to climate change.
Focused on climate change impacts on the cyclical patterns of SPB infestations in the Southern US, this study did not consider potential SPB range expansions under climate change. Northern expansions of SPB infestations have also been observed in recent years [9,66]. Additionally, biological driving forces and mechanisms of SPB cyclical outbreaks are not well understood. Knowledge in this area is essential to more effectively mitigating SPB infestations. Future studies can explore these frontiers.

Author Contributions

Conceptualization, J.G. and H.A.; methodology, H.A. and J.G.; validation, J.G. and H.A.; formal analysis, H.A.; data curation, H.A. and J.G.; writing—original draft preparation, J.G. and H.A.; writing—review and editing, J.G. and H.A.; visualization, H.A.; supervision and project administration, J.G.; funding acquisition, J.G. All authors have read and agreed to the published version of the manuscript.

Funding

This study was financially supported in part by the US Department of Agriculture McIntire-Stennis Program.

Institutional Review Board Statement

Not applicable.

Informed Consent Statement

Not applicable.

Data Availability Statement

All data used in this study were obtained from published sources listed in the references.

Conflicts of Interest

The authors declare no conflict of interest.

References

  1. Billings, R.; Clarke, S.R.; Mendoza, V.E.; Cabrera, P.C.; Figueroa, B.M.; Campos, J.R.; Baeza, G. Bark beetle outbreaks and fire: A devastating combination for Central America’s pine forests. Unasylva 2004, 55, 15–21. [Google Scholar]
  2. Coulson, R.N.; Klepzig, K.D. Southern Pine Beetle II; USDA Forest Service Southern Research Station: Asheville, NC, USA, 2011.
  3. Pye, J.M.; Holmes, T.P.; Prestemon, J.P.; Wear, D.N. Economic impacts of the southern pine beetle. In Southern Pine Beetle II; Coulson, R.N., Klepzig, K.D., Eds.; USDA Forest Service Southern Research Station: Asheville, NC, USA, 2011; pp. 213–222. [Google Scholar]
  4. Krist, K.J., Jr.; Ellenwood, J.R.; Woods, M.E.; McMahan, A.J.; Cowardin, J.P.; Ryerson, D.E.; Sapio, F.J.; Zweifler, M.O.; Romero, S.A. 2013–2023 National Insect and Disease Forest Risk Assessment; USDA Forest Service: Fort Collins, CO, USA, 2014.
  5. Payne, T.L. Life history and habits. In The Southern Pine Beetle; Thatcher, R.C., Searcy, J.L., Coster, J.E., Hertel, G., Eds.; USDA Forest Service: Washington, DC, USA, 1980; pp. 7–28. [Google Scholar]
  6. Flamm, R.O.; Coulson, R.N.; Payne, T.L. The southern pine beetle. In Dynamics of Forest Insect Populations: Patterns, Causes, Implications; Berryman, A.A., Ed.; Plenum Press: New York, NY, USA, 1988; pp. 531–553. [Google Scholar]
  7. Salinas-Moreno, Y.; Mendoza, M.G.; Barrios, M.A.; Cisneros, R.; Macías-Sámano, J.; Zúñiga, G. Areography of the genus Dendroctonus (Coleoptera: Curculionidae: Scolytinae) in Mexico. J. Biogeogr. 2004, 31, 1163–1177. [Google Scholar] [CrossRef]
  8. Clarke, S.R.; Riggins, J.J.; Stephen, F.M. Forest management and southern pine beetle outbreaks: A historical perspective. For. Sci. 2016, 62, 166–180. [Google Scholar] [CrossRef]
  9. Dodds, K.J.; Aoki, C.F.; Arango-Velez, A.; Cancelliere, J.; D’Amato, A.W.; DiGirolomo, M.F.; Rabaglia, R.J. Expansion of southern pine beetle into northeastern forests: Management and impact of a primary bark beetle in a new region. J. For. 2018, 116, 178–191. [Google Scholar] [CrossRef]
  10. Smith, J.E.; Heath, L.S.; Skog, K.E.; Birdsey, R.A. Methods for Calculating Forest Ecosystem and Harvested Carbon with Standard Estimates for Forest Types of the United States; USDA Forest Service Northeastern Research Station: Newtown Square, PA, USA, 2005.
  11. Wear, D.; Greis, J. The Southern Forest Futures Project: Summary Report; USDA Forest Service Southern Research Station: Asheville, NC, USA, 2012.
  12. FAOSTAT. Available online: https://www.fao.org/faostat/en/#data/FO (accessed on 6 June 2022).
  13. Birdsey, R.A. Carbon Storage and Accumulation in United States Forest Ecosystems; USDA Forest Service Northeastern Forest Experiment Station: Radnor, PA, USA, 1992.
  14. Loeffler, D.; Anderson, N.; Stockmann, K.; Skog, K.; Healey, S.; Jones, J.; Morrison, J.; Young, J. Estimates of Carbon Stored in Harvested Wood Products from United States Forest Service Southern Region, 1911–2012; USDA Forest Service Rocky Mountain Research Station: Missoula, MT, USA, 2014; Unpublished report.
  15. USDA Forest Service. Baseline Estimates of Carbon Stocks in Forests and Harvested Wood Products for National Forest System Units: Southern Region; USDA Forest Service: Washington, DC, USA, 2015.
  16. Hicke, J.A.; Meddens, A.J.H.; Allen, C.D.; Kolden, C.A. Carbon stocks of trees killed by bark beetles and wildfire in the western United States. Environ. Res. Lett. 2013, 8, 035032. [Google Scholar] [CrossRef]
  17. Reed, D.E.; Ewers, B.E.; Pendall, E. Impact of mountain pine beetle induced mortality on forest carbon and water fluxes. Environ. Res. Lett. 2014, 9, 105004. [Google Scholar] [CrossRef]
  18. McNulty, S.; Lorio, P., Jr.; Ayres, M.P.; Reeve, J. Predictions of southern pine beetle populations using a forest ecosystem model. In The Productivity and Sustainability of Southern Forest Ecosystems in Changing Environment; Mickler, R., Fox, S., Eds.; Springer: New York, NY, USA, 1997; pp. 617–634. [Google Scholar]
  19. Ayres, M.P.; Lombardero, M.J. Assessing the consequences of global change for forest disturbance from herbivores and pathogens. Sci. Total Environ. 2000, 262, 263–286. [Google Scholar] [CrossRef]
  20. Williams, D.W.; Liebhold, A.M. Climate change and the outbreak ranges of two North American bark beetles. Agric. For. Entomol. 2002, 4, 87–99. [Google Scholar] [CrossRef]
  21. Gan, J. Risk and damage of southern pine beetle outbreaks under global climate change. For. Ecol. Manag. 2004, 191, 61–71. [Google Scholar] [CrossRef]
  22. Raffa, K.F.; Aukema, B.H.; Bentz, B.J.; Carroll, A.L.; Hicke, J.A.; Turner, M.G.; Romme, W.H. Cross-scale drivers of natural disturbances prone to anthropogenic amplification: The dynamics of bark beetle eruptions. Bioscience 2008, 58, 501–517. [Google Scholar] [CrossRef]
  23. Lesk, C.; Cofel, E.; D’Amato, A.W.; Dodds, K.; Horton, R. Threats to North American forests from southern pine beetle with warming winters. Nat. Clim. Chang. 2017, 7, 713–717. [Google Scholar] [CrossRef] [PubMed]
  24. Gan, J. Comovement and cyclical patterns of southern pine beetle outbreaks. In Environmental Modeling: New Research; Findley, P.N., Ed.; Nova Science: Hauppauge, NY, USA, 2008; pp. 87–100. [Google Scholar]
  25. Birt, A. Regional population dynamics. In Southern Pine Beetle II; Coulson, R.N., Klepzig, K.D., Eds.; USDA Forest Service Southern Research Station: Asheville, NC, USA, 2011; pp. 109–128. [Google Scholar]
  26. Weed, A.S.; Ayres, M.P.; Liebhold, A.M.; Billings, R. Spatio-temporal dynamics of a tree-killing beetle and its predator. Ecography 2016, 39, 1–14. [Google Scholar] [CrossRef]
  27. Lombardo, J.A.; Weed, A.S.; Aoki, C.F.; Sullivan, B.T.; Ayres, M.P. Temperature affects phenological synchrony in a tree killing bark beetle. Oecologia 2018, 188, 117–127. [Google Scholar] [CrossRef]
  28. Gara, R.I. Studies on the attack behavior of the southern pine beetle. I. The spreading and collapse of outbreaks. Contrib. Boyce Thompson Inst. 1967, 23, 349–354. [Google Scholar]
  29. Turchin, P.; Lorio, P., Jr.; Taylor, A.; Billings, R. Why do populations of southern pine beetle (Coleoptera: Scolytidae) fluctuate? Environ. Entomol. 1991, 20, 401–409. [Google Scholar] [CrossRef]
  30. Hain, F.P.; Duehl, A.J.; Gardner, M.J.; Payne, T.L. Natural history of the southern pine beetle. In Southern Pine Beetle II; Coulson, R.N., Klepzig, K.D., Eds.; USDA Forest Service Southern Research Station: Asheville, NC, USA, 2011; pp. 13–24. [Google Scholar]
  31. Martinson, S.J.; Ylioja, T.; Sullivan, B.T.; Billings, R.; Ayres, M.P. Alternate attractors in the population dynamics of a tree-killing bark beetle. Popul. Ecol. 2013, 55, 95–106. [Google Scholar] [CrossRef]
  32. Clarke, S.R.; Nowak, J.T. Forest Insect and Disease Leaflet 49; USDA Forest Service Pacific Northwest Research Station: Portland, OR, USA, 2009.
  33. Gagne, J.; Coulson, R.; Foltz, J.; Wagner, T.; Edson, L. Attack and survival of Dendroctonus frontalis in relation to weather during three years in east Texas. Environ. Entomol. 1980, 9, 222–229. [Google Scholar] [CrossRef]
  34. Ungerer, M.J.; Ayres, M.P.; Lombardero, M.J. Climate and the northern distribution limits of Dendroctonus frontalis Zimmermann (Coleoptera: Scolytidae). J. Biogeogr. 1999, 26, 1133–1145. [Google Scholar] [CrossRef]
  35. Beal, J.A. Temperature extremes as a factor in the ecology of the southern pine beetle. J. For. 1933, 31, 329–336. [Google Scholar]
  36. King, E. Rainfall and epidemics of the southern pine beetle. Environ. Entomol. 1972, 1, 279–285. [Google Scholar] [CrossRef]
  37. Kalkstein, L. The Effect of Climate upon Outbreaks of the Southern Pine Beetle; Publications in Climatology; C.W. Thornthwaite Associates: Dublin, OH, USA, 1974; Volume 27, pp. 1–65. [Google Scholar]
  38. Kalkstein, L. Effects of climatic stress upon outbreaks of the southern pine beetle. Environ. Entomol. 1976, 5, 653–658. [Google Scholar] [CrossRef]
  39. Trân, J.K.; Ylioja, T.; Billings, R.; Régnière, J.; Ayres, M.P. Impact of minimum winter temperatures on the population dynamics of Dendroctonus frontalis. Ecol. Appl. 2007, 17, 882–899. [Google Scholar] [CrossRef] [PubMed]
  40. Thatcher, R.C.; Pickard, L.S. Seasonal variations in activity of the southern pine beetle in east Texas. J. Econ. Entomol. 1964, 57, 840–842. [Google Scholar] [CrossRef]
  41. Smith, W.B.; Miles, P.D.; Perry, C.H.; Pugh, S.A. Forest Resources of the United States, 2007; USDA Forest Service: Washington, DC, USA, 2009.
  42. Pye, J.M.; Price, T.S.; Clarke, S.R.; Huggett, R.J., Jr. A History of Southern Pine Beetle Outbreaks in the Southeastern United States through 2004. Available online: https://www.srs.fs.usda.gov/econ/data/spb-withheld/ (accessed on 21 January 2015).
  43. McNab, W.H.; Cleland, D.T.; Freeouf, J.A.; Keys, J.E., Jr.; Nowacki, G.J.; Carpenter, C.A. Description of Ecological Subregions: Sections of the Conterminous United States; USDA Forest Service: Washington, DC, USA, 2007.
  44. Bailey, R.G. Description of the Ecoregions of the United States; USDA Forest Service: Washington, DC, USA, 1980.
  45. Papke, L.E.; Wooldridge, J.M. Econometric methods for fractional response variables with an application to 401(k) plan participation rates. J. Appl. Econom. 1996, 11, 619–632. [Google Scholar] [CrossRef]
  46. Hardin, J.W.; Hilbe, J. Generalized Linear Models and Extensions, 2nd ed.; Stata Press: College Station, TX, USA, 2007. [Google Scholar]
  47. Papke, L.E.; Wooldridge, J.M. Panel data methods for fractional response variables with an application to test pass rates. J. Econom. 2008, 145, 121–133. [Google Scholar] [CrossRef]
  48. Climate Data Online. Available online: https://www.ncdc.noaa.gov/cdo-web/ (accessed on 15 January 2015).
  49. BCSD-CMIP5 Climate Monthly Projections, Downscaled CMIP3 and CMIP5 Climate and Hydrology Projections. Available online: https://gdo-dcp.ucllnl.org/downscaled_cmip_projections/dcpInterface.html#Projections:%20Complete%20Archives (accessed on 6 March 2015).
  50. Donner, L.J.; Wyman, B.; Hemler, R.S.; Horowitz, L.; Ming, Y.; Zhao, M.; Golaz, J.-C.; Ginoux, P.; Lin, S.-J.; Schwarzkopf, M.D.; et al. The dynamical core, physical parameterizations, and basic simulation characteristics of the atmospheric component AM3 of the GFDL Global Coupled Model CM3. J. Clim. 2011, 24, 3484–3519. [Google Scholar] [CrossRef]
  51. Jones, C.; Hughes, J.K.; Bellouin, N.; Hardiman, S.C.; Jones, G.S.; Knight, J.; Liddicoat, S.; O’connor, F.M.; Andres, R.J.; Bell, C.; et al. The HadGEM2-ES implementation of CMIP5 centennial simulations. Geosci. Model Dev. 2011, 4, 543–570. [Google Scholar] [CrossRef]
  52. Flato, G.; Marotzke, J.; Abiodun, B.; Braconnot, P.; Chou, S.C.; Collins, W.; Cox, P.; Driouech, F.; Emori, S.; Eyring, V.; et al. Evaluation of climate models. In Climate Change 2013: The Physical Science Basis; Stocker, T.F., Qin, D., Plattner, G.-K., Tignor, M., Allen, S.K., Boschung, J., Nauels, A., Xia, Y., Bex, V., Midgley, P.M., Eds.; Cambridge University Press: Cambridge, UK; New York, NY, USA, 2013. [Google Scholar]
  53. van Vuuren, D.P.; Edmonds, J.; Kainuma, M.; Riahi, K.; Thomson, A.; Hibbard, K.; Hurtt, G.C.; Kram, T.; Krey, V.; Lamarque, J.-F.; et al. The representative concentration pathways: An overview. Clim. Chang. 2011, 109, 5. [Google Scholar] [CrossRef]
  54. IPCC. Climate Change 2013: The Physical Science Basis. Contribution of Working Group I to the Fifth Assessment Report of the Intergovernmental Panel on Climate Change; Stocker, T.F., Qin, D., Plattner, G.-K., Tignor, M., Allen, S.K., Boschung, J., Nauels, A., Xia, Y., Bex, V., Midgley, P.M., Eds.; Cambridge University Press: Cambridge, UK; New York, NY, USA, 2013. [Google Scholar]
  55. Bartlett, M.S. Periodogram analysis and continuous spectra. Biometrics 1950, 37, 1–16. [Google Scholar] [CrossRef]
  56. Bartlett, M.S. An Introduction to Stochastic Processes with Specifical References to Method and Applications, 2nd ed.; Cambridge University Press: Cambridge, UK, 1966. [Google Scholar]
  57. Hodrick, R.J.; Prescott, E.C. Postwar US business cycles: An empirical investigation. J. Money Credit Bank. 1997, 29, 1–16. [Google Scholar] [CrossRef]
  58. Hodrick, R.J. An Exploration of Trend-Cycle Decomposition Methodologies in Simulated Data; NBER Working Paper 26750; National Bureau of Economic Research: Washington, DC, USA, 2020. [Google Scholar]
  59. Ravn, M.O.; Uhlig, H. On adjusting the Hodrick-Prescott filter for the frequency of observations. Rev. Econ. Stat. 2002, 84, 371–376. [Google Scholar] [CrossRef]
  60. USGCRP. Climate Science Special Report: Fourth National Climate Assessment, Volume I; Wuebbles, D.J., Fahey, D.W., Hibbard, K.A., Dokken, D.J., Stewart, B.C., Maycock, T.K., Eds.; US Global Change Research Program: Washington, DC, USA, 2017. [Google Scholar]
  61. McClelland, W.T.; Hain, F.P. Survival of declining Dendroctonus frontalis populations during a severe and nonsevere winter. Environ. Entomol. 1979, 8, 231–235. [Google Scholar] [CrossRef]
  62. Lombardero, M.J.; Ayres, M.P.; Ayres, B.D.; Reeve, J.D. Cold tolerance of four species of bark beetle (Coleoptera: Scolytidae) in North America. Environ. Entomol. 2000, 29, 421–432. [Google Scholar] [CrossRef] [Green Version]
  63. Billings, R. Mechanical control of southern pine beetle infestations. In Southern Pine Beetle II; Coulson, R.N., Klepzig, K.D., Eds.; USDA Forest Service Southern Research Station: Asheville, NC, USA, 2011; pp. 399–414. [Google Scholar]
  64. Lombardo, J.A.; Sullivan, B.T.; Myers, S.W.; Ayres, M.P. Are southern pine forests becoming too warm for the southern pine beetle? Agric. For. Meteorol. 2022, 315, 108813. [Google Scholar] [CrossRef]
  65. Asaro, C.; Nowak, J.T.; Elledge, A. Why have southern pine beetle outbreaks declined in the southeastern US. with the expansion of intensive pine silviculture? A brief review of hypotheses. For. Ecol. Manag. 2017, 391, 338–348. [Google Scholar] [CrossRef]
  66. Man, G. Major Forest Insect and Disease Conditions in the United States: 2014 Update; USDA Forest Service: Washington, DC, USA, 2016.
Figure 1. Historical and projected southern pine beetle (SPB) outbreak patterns in the Southern United States. (a) The projected SPB infestations based on the future climates projected by the HadGEM2-ES global climate model under three Representative Concentration Pathways (RCP) scenarios (RCP 4.5, 6.0, and 8.5); and (b) the projected SPB infestations based on the future climates projected by GFDL-CM3 under the same three RCP scenarios. The SPB risk (the vertical axis) is measured in ‰ of the total pine growing stock volume killed by the SPB, and the horizontal axis is labeled with calendar years.
Climate 10 00126 g001aClimate 10 00126 g001bClimate 10 00126 g001cClimate 10 00126 g001d
Table 1. Statistical relationship between the southern pine beetle (SPB) infestation risk and climatic and other factors.
Independent VariableEstimated CoefficientStandard Error p-Value
USVt (unsalvaged timber in the current year)0.10320.00910.000
lnSPTt (log average spring temperature in the current year) 0.01540.00520.003
lnFLTt (log average fall temperature in the current year)−0.01410.00530.008
lnSPPt−1 (log spring total precipitation one year ago) −0.00100.00040.006
lnWNPt−1 (log winter total precipitation one year ago)−0.00110.00030.000
lnMinWNTt−1 (log winter min temperature one year ago)0.00470.00170.007
lnSPTt−2 (log average spring temperature two years ago) −0.00960.00490.049
lnSMTt−2 (log average summer temperature two years ago) 0.02180.01000.030
Note: SPB infestation risk (SPBRt) and unsalvaged timber (USVt) were measured in ‰ of the total pine growing stock volume, temperatures were measured in °C, and precipitations were measured in mm. Only independent variables significant at the 5% or lower were reported here.
Table 2. Amplitudes and periods of cyclical patterns of historical and projected southern pine beetle (SPB) infestations in the Southern United States.
StateHistorical (1973–2004)HadGEM2-ESGFDL-CM3
RCP 4.5RCP 6.0RCP 8.5RCP 4.5RCP 6.0RCP 8.5
APAPAPAPAPAPAP
AL1.5846.670.3932.350.6404.350.4602.440.4953.570.4663.850.0143.26
AR0.0864.550.4064.350.4095.560.2853.530.4672.500.2112.940.0013.53
FL0.4625.260.1942.300.1702.600.2263.890.2493.390.2733.850.0033.85
GA1.0028.330.1932.380.2002.600.1992.440.2273.520.1613.920.0113.23
LA1.2427.690.0612.900.0792.600.0502.330.0343.520.0382.510.0003.23
MS0.4086.670.3024.550.4812.600.2202.440.2723.570.3052.560.0043.13
NC0.5786.450.9333.570.6802.600.5862.441.2862.880.7883.920.0173.23
SC0.9635.260.4412.360.3462.600.3592.440.6834.080.3823.910.0093.26
TN0.7584.550.4404.550.7182.580.3432.440.4754.930.2783.030.0063.57
TX0.5038.000.4113.570.4043.270.3353.330.5263.570.5102.990.1323.39
VA0.9555.410.7324.550.4614.850.6027.690.5282.900.3883.010.0073.36
Regional average0.7766.260.4103.400.4173.290.3333.220.4773.490.3453.320.0193.37
Note: The projections of SPB infestations for 2020–2099 were based on the future climates projected by the HadGEM2-ES and GFDL-CM3 global climate models under three Representative Concentration Pathways (RCP) scenarios (RCP 4.5, 6.0, and 8.5). The amplitude (A) was measured in ‰ of the total pine growing stock volume killed by the SPB, and the period (P) was measured in years. AL, Alabama; AR, Arkansas; FL, Florida; GA, Georgia; LA, Louisiana; MS, Mississippi; NC, North Carolina; SC, South Carolina; TN, Tennessee; TX, Texas; and VA, Virginia.
Publisher’s Note: MDPI stays neutral with regard to jurisdictional claims in published maps and institutional affiliations.

