
Numerical Simulation of Lap-Spliced Ultra-High-Performance Concrete Beam Based on Bond–Slip

Abstract
:1. Introduction
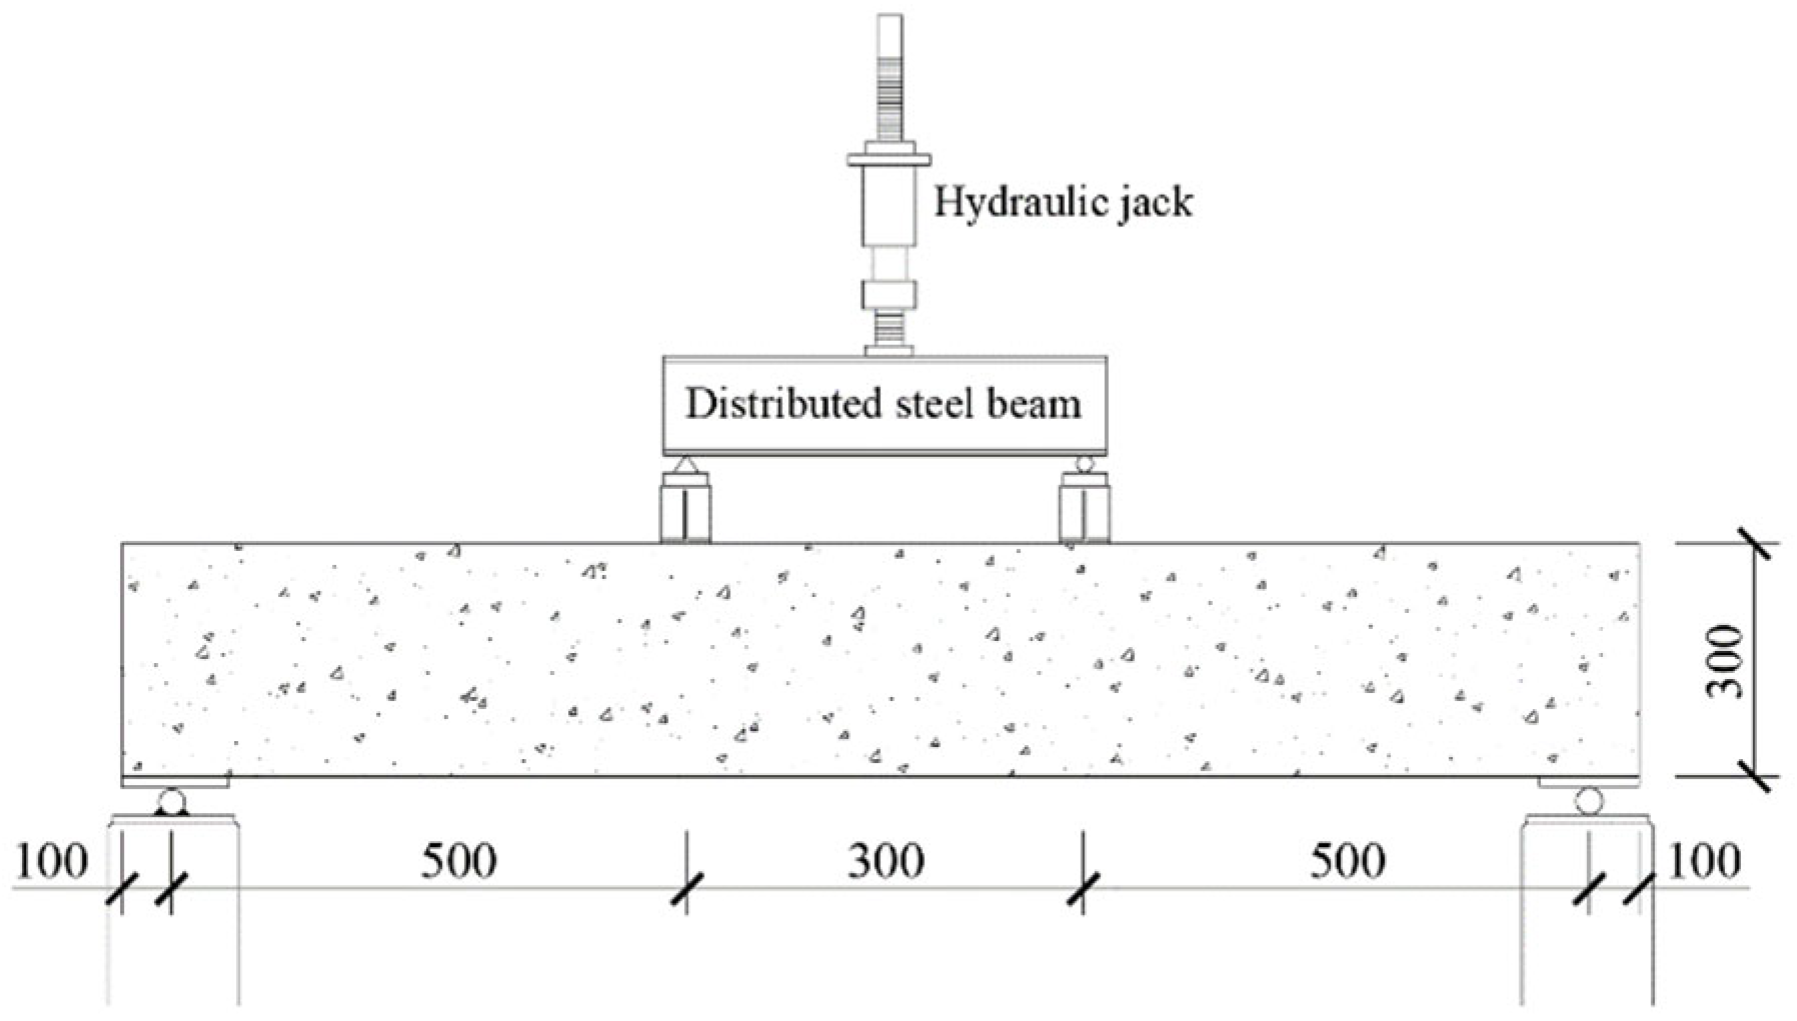
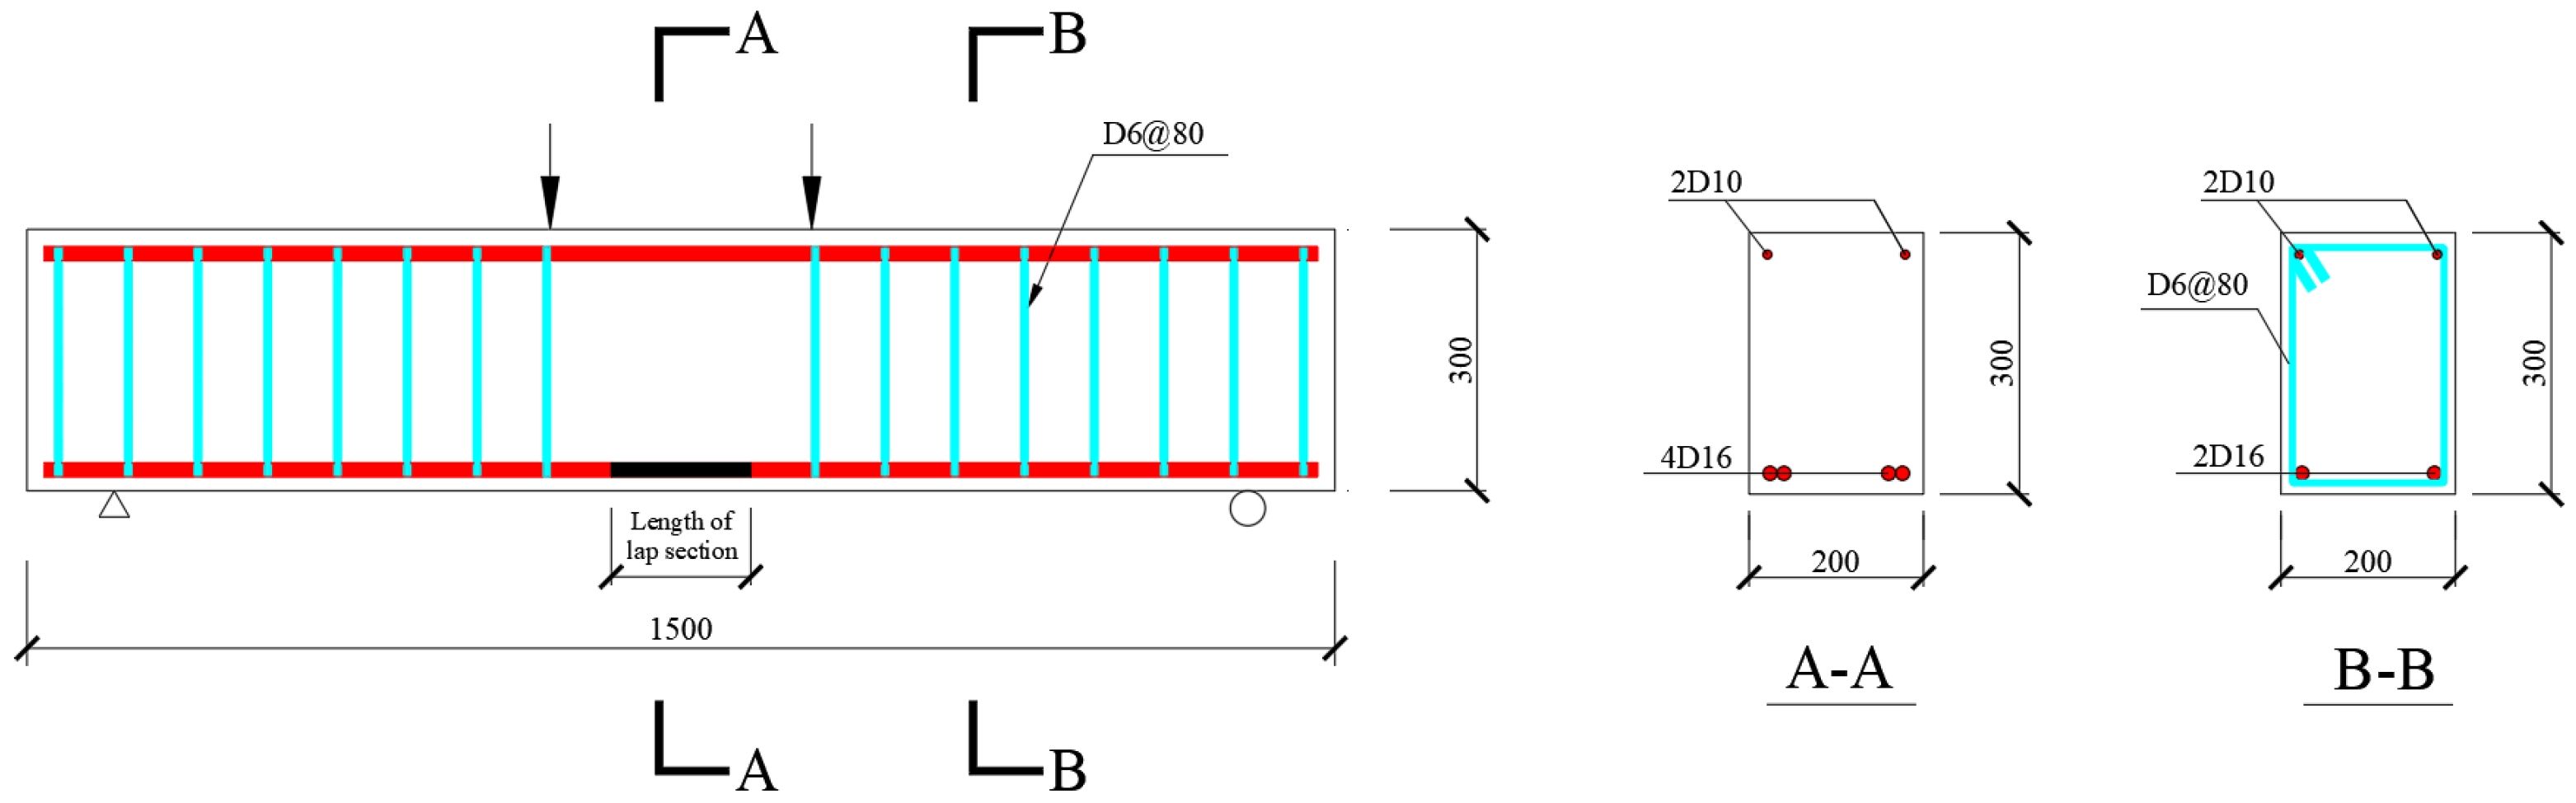
2. Test Overview
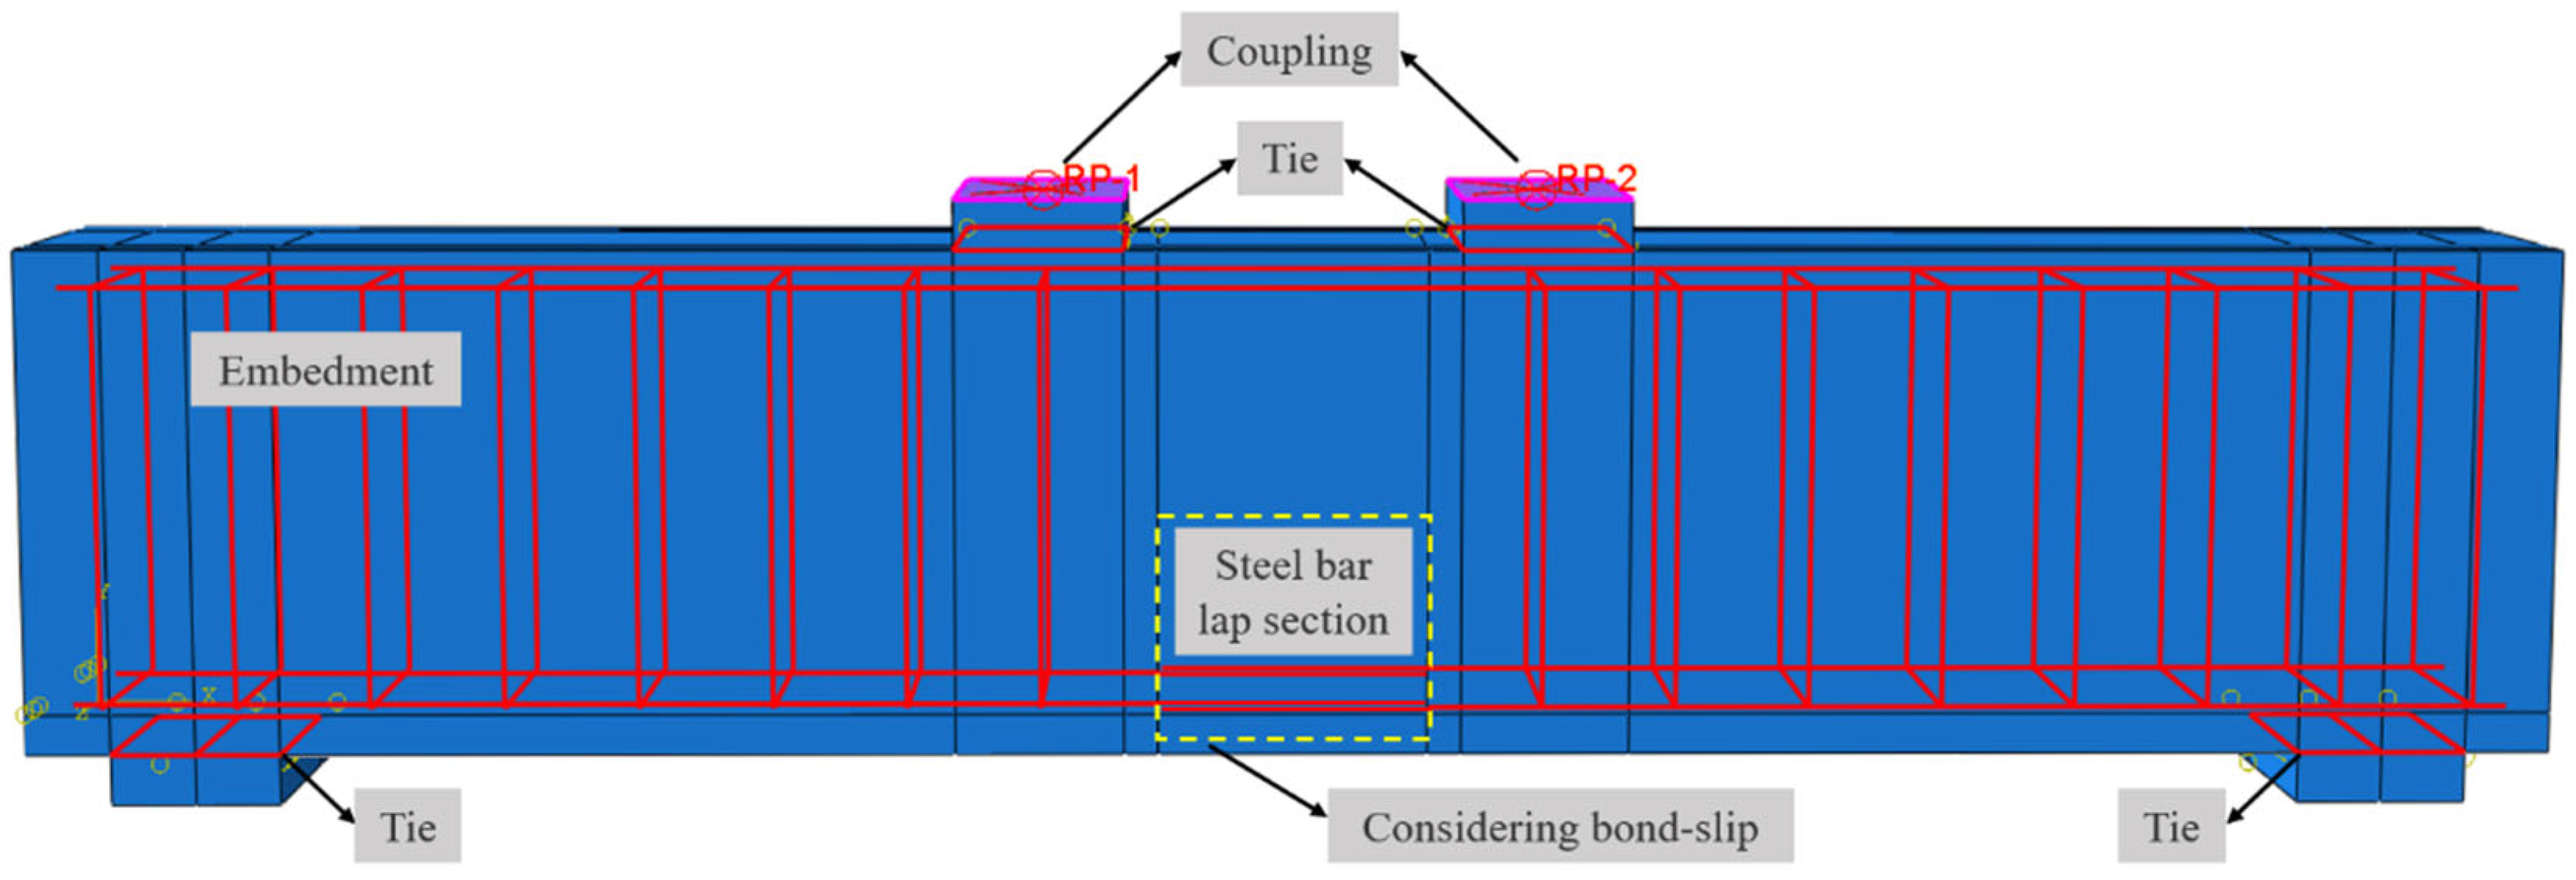
3. Finite Element Model of Lap-Spliced UHPC Beam
3.1. Material Constitutive Model
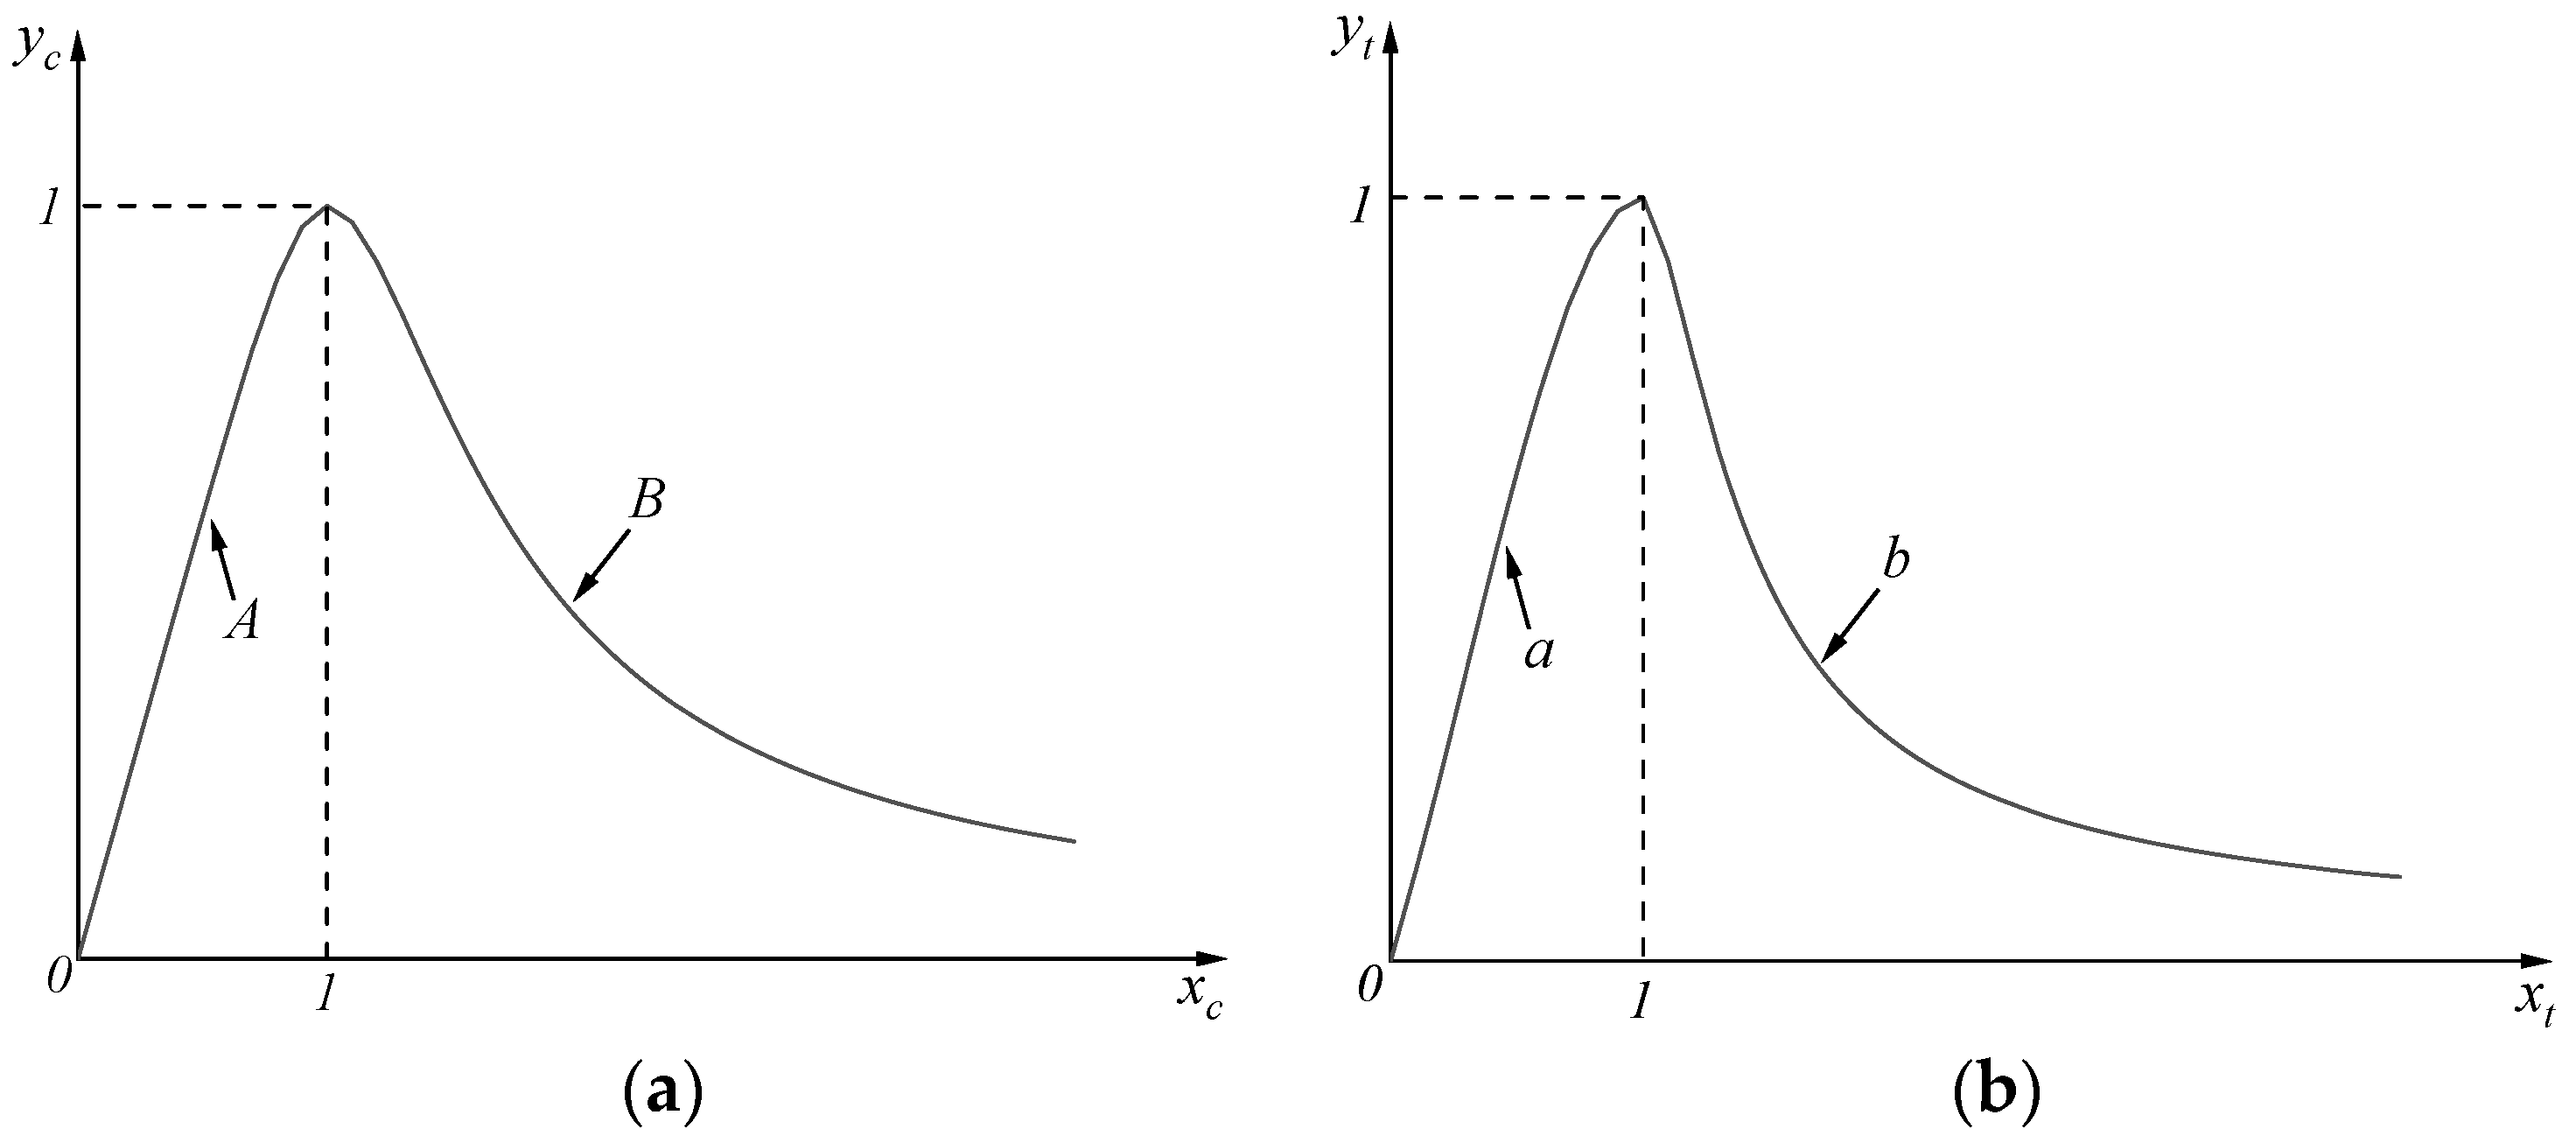
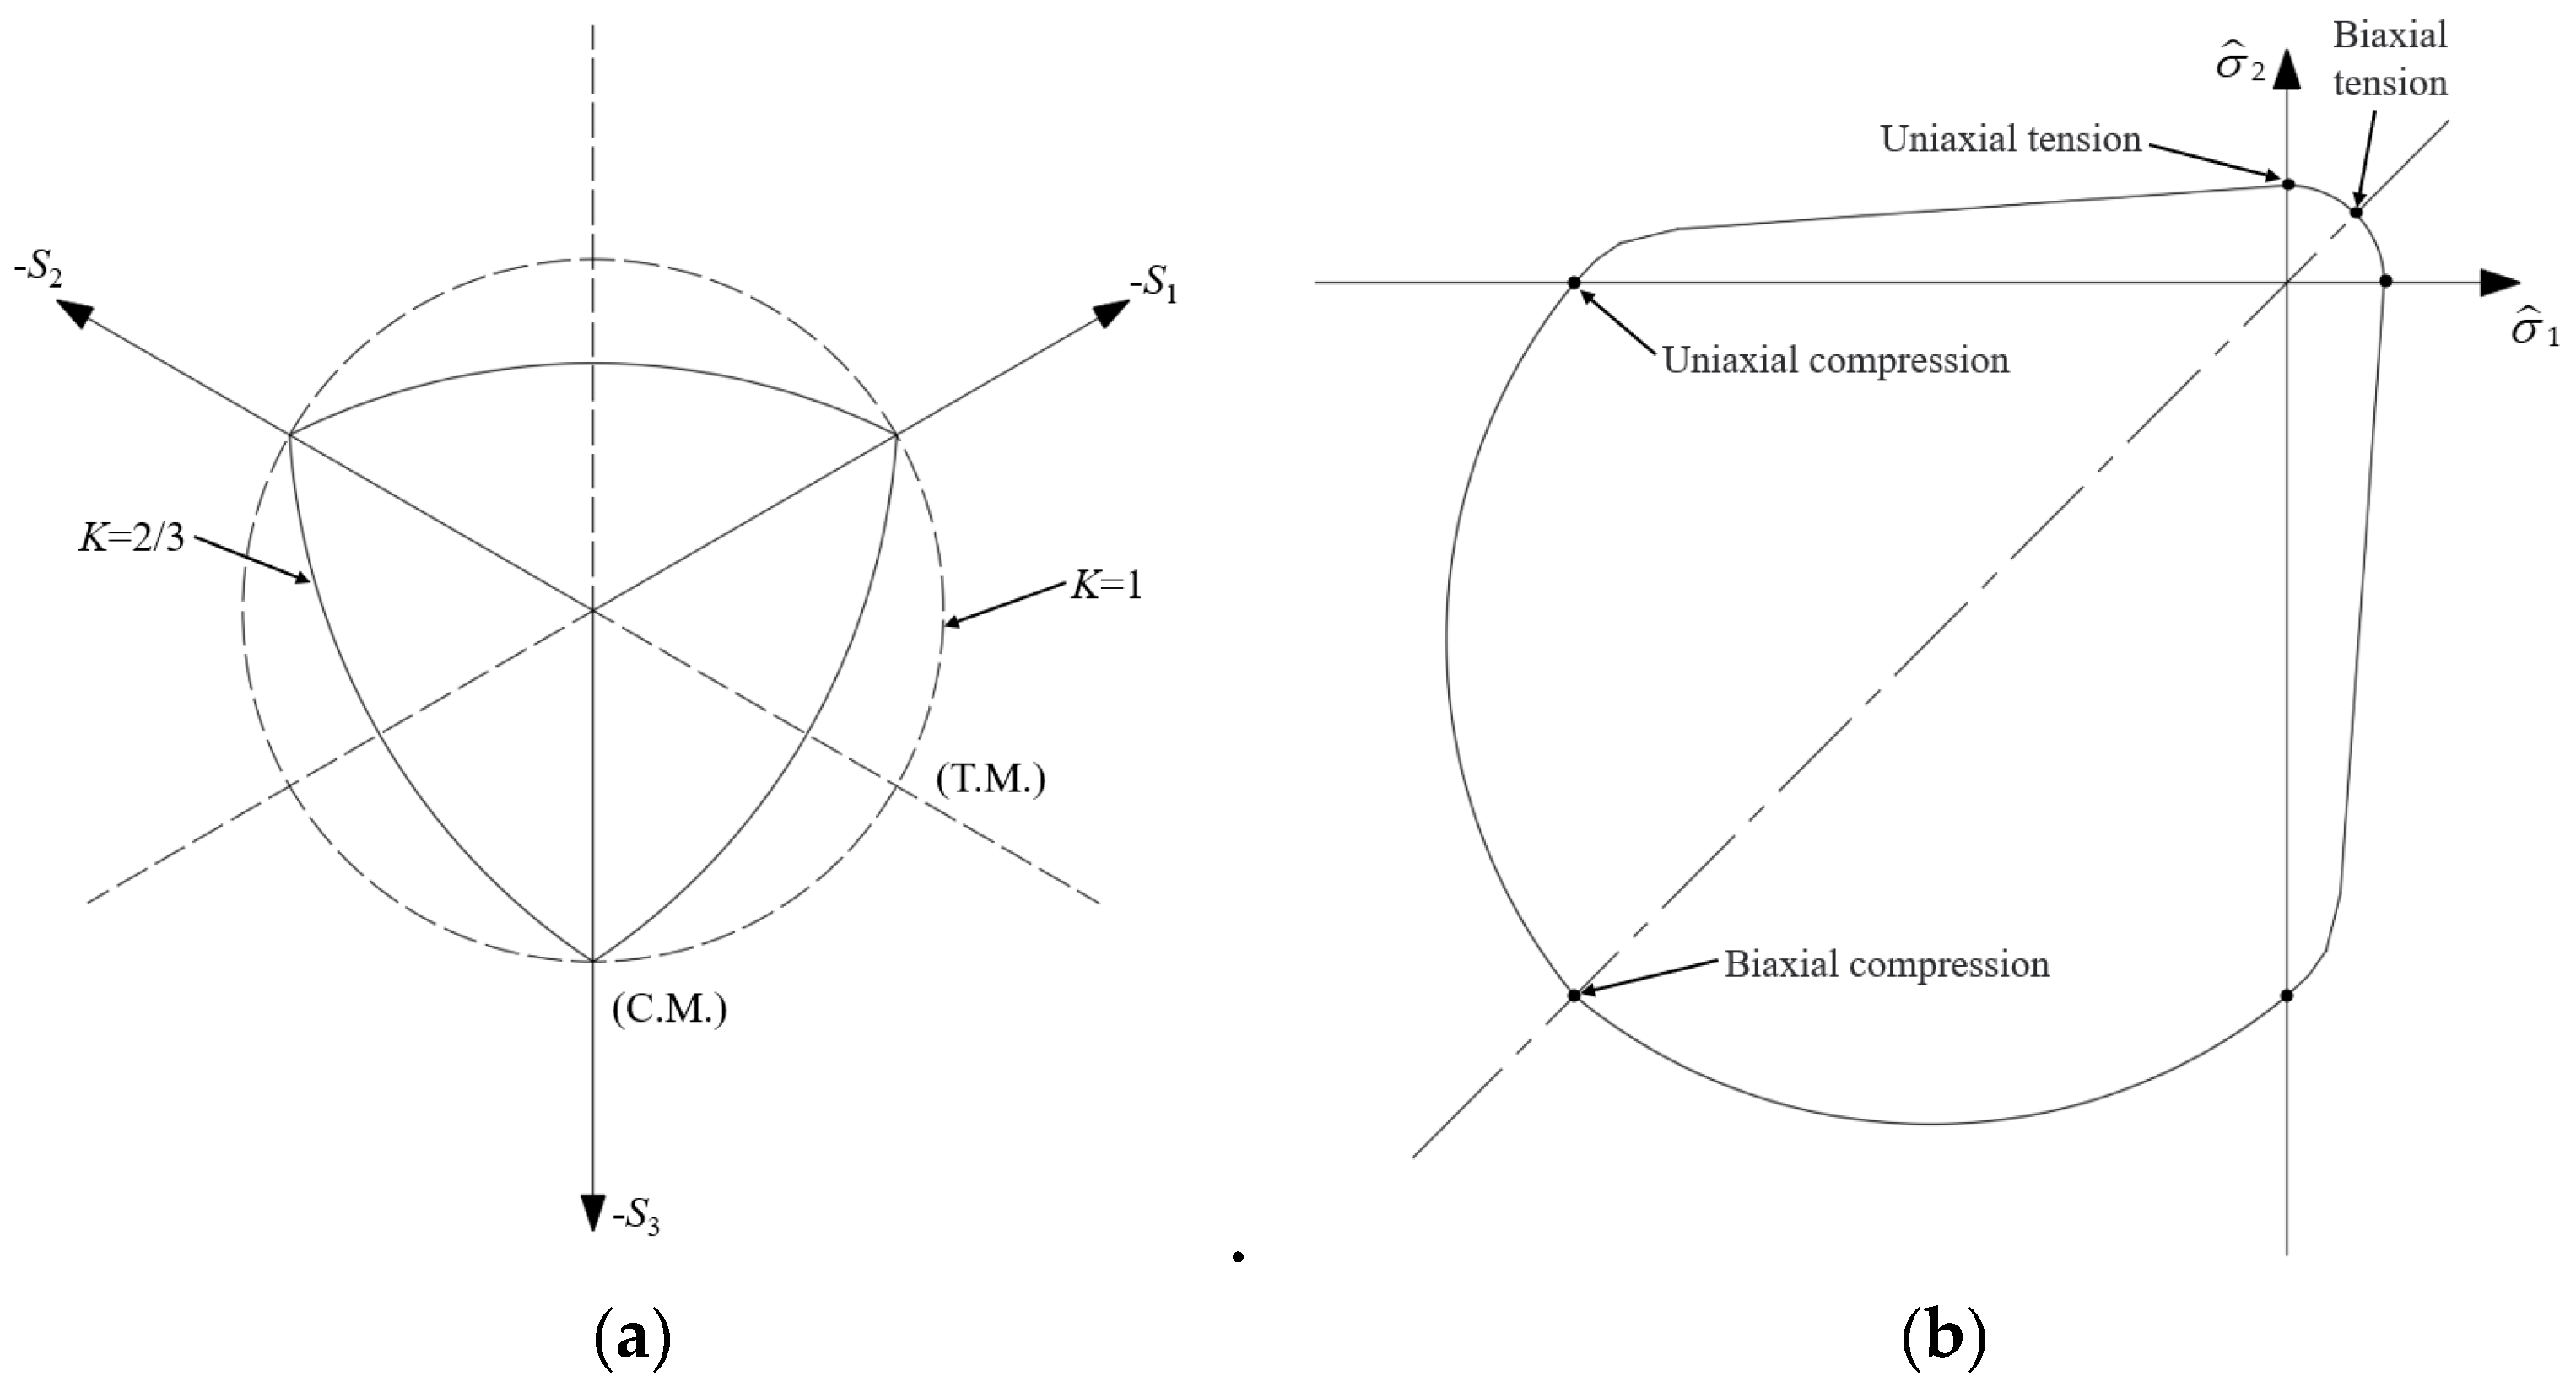
3.1.1. UHPC Constitutive Model
3.1.2. Steel Bar Constitutive Model
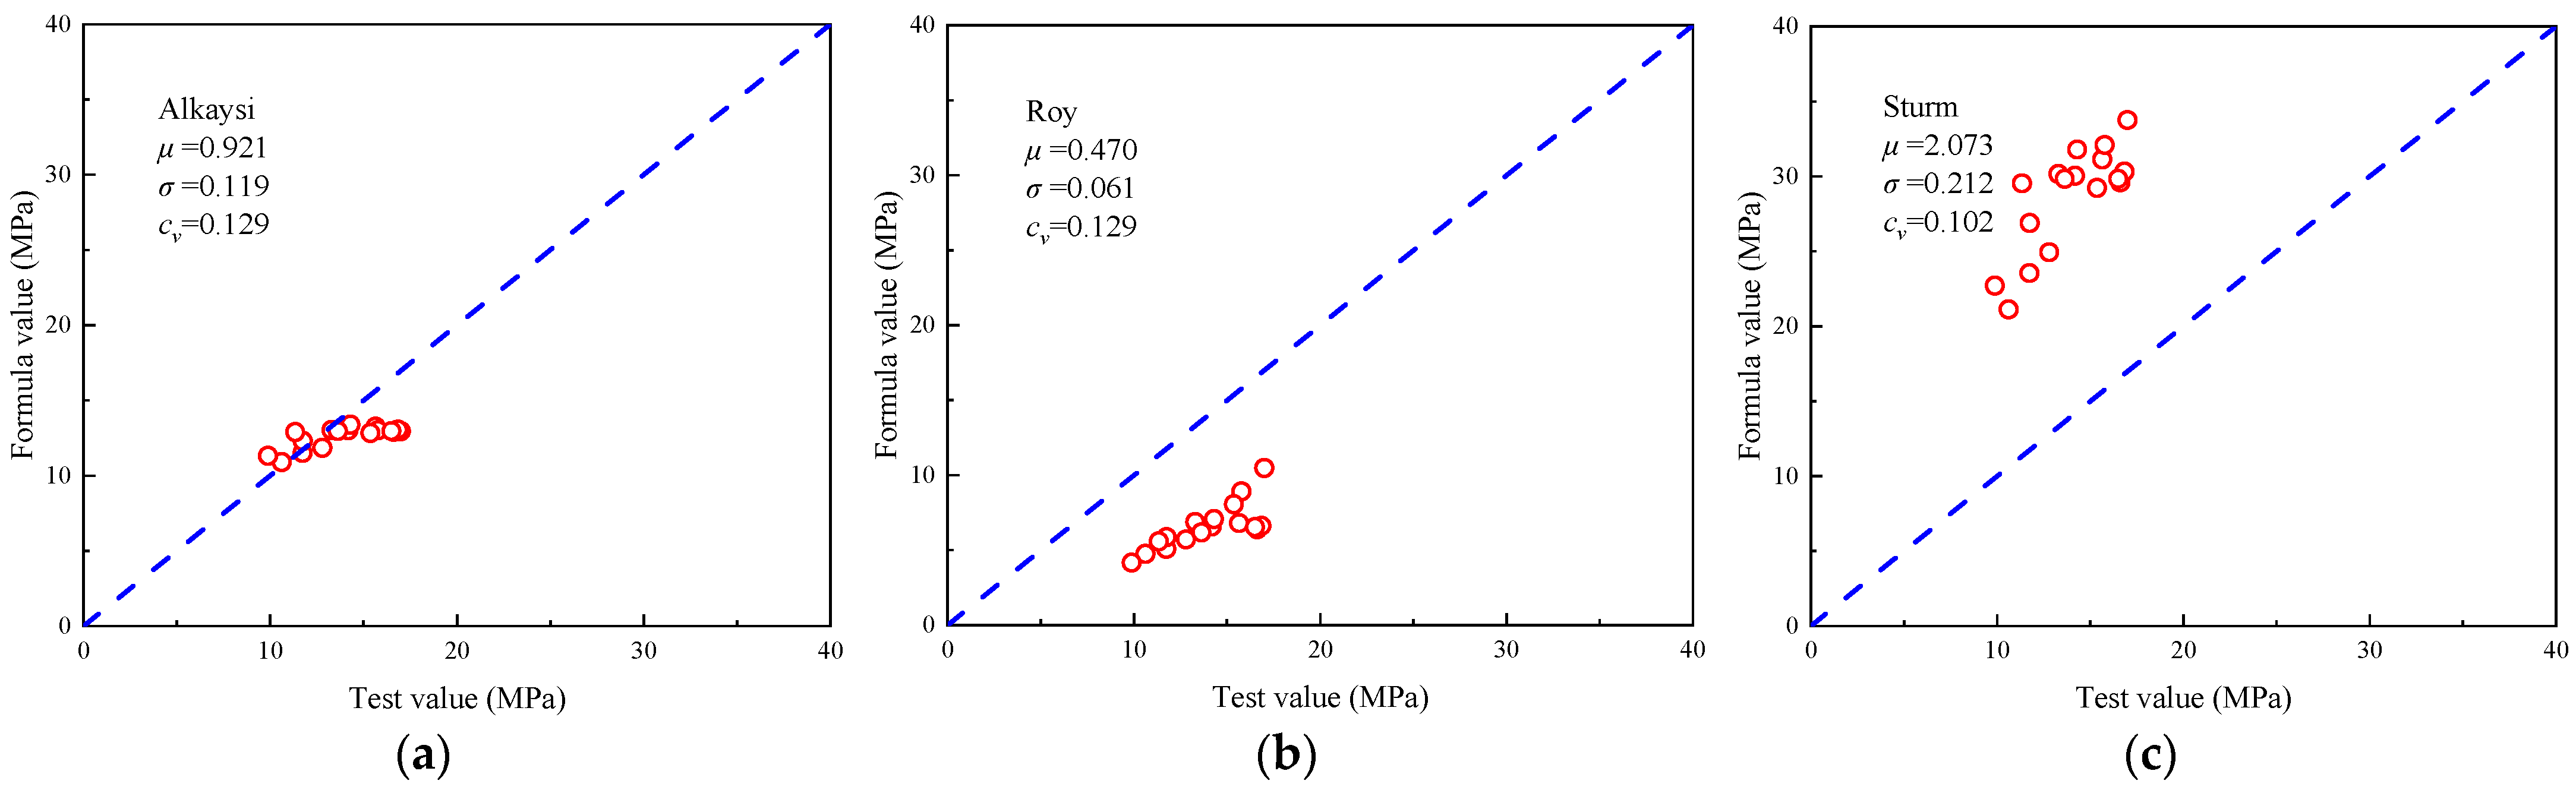
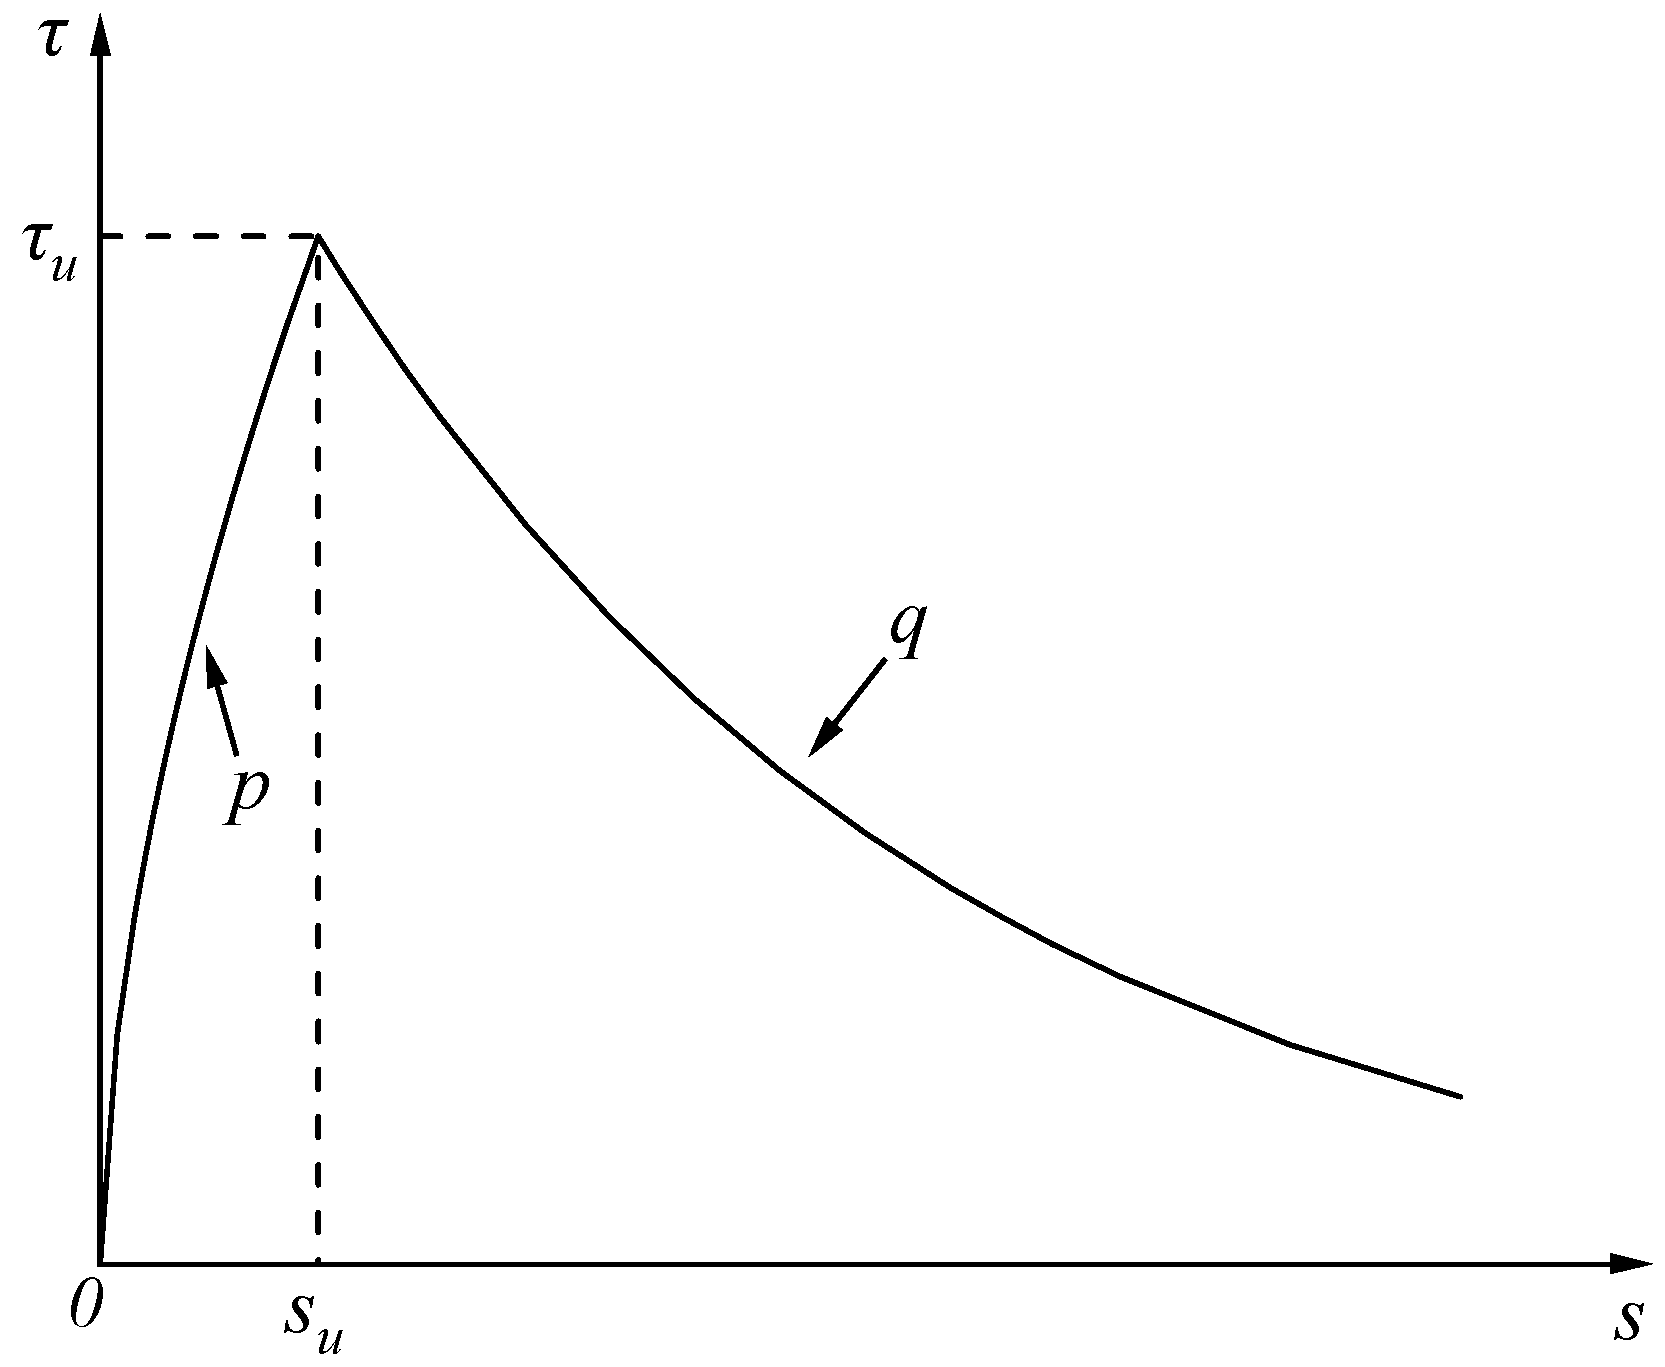
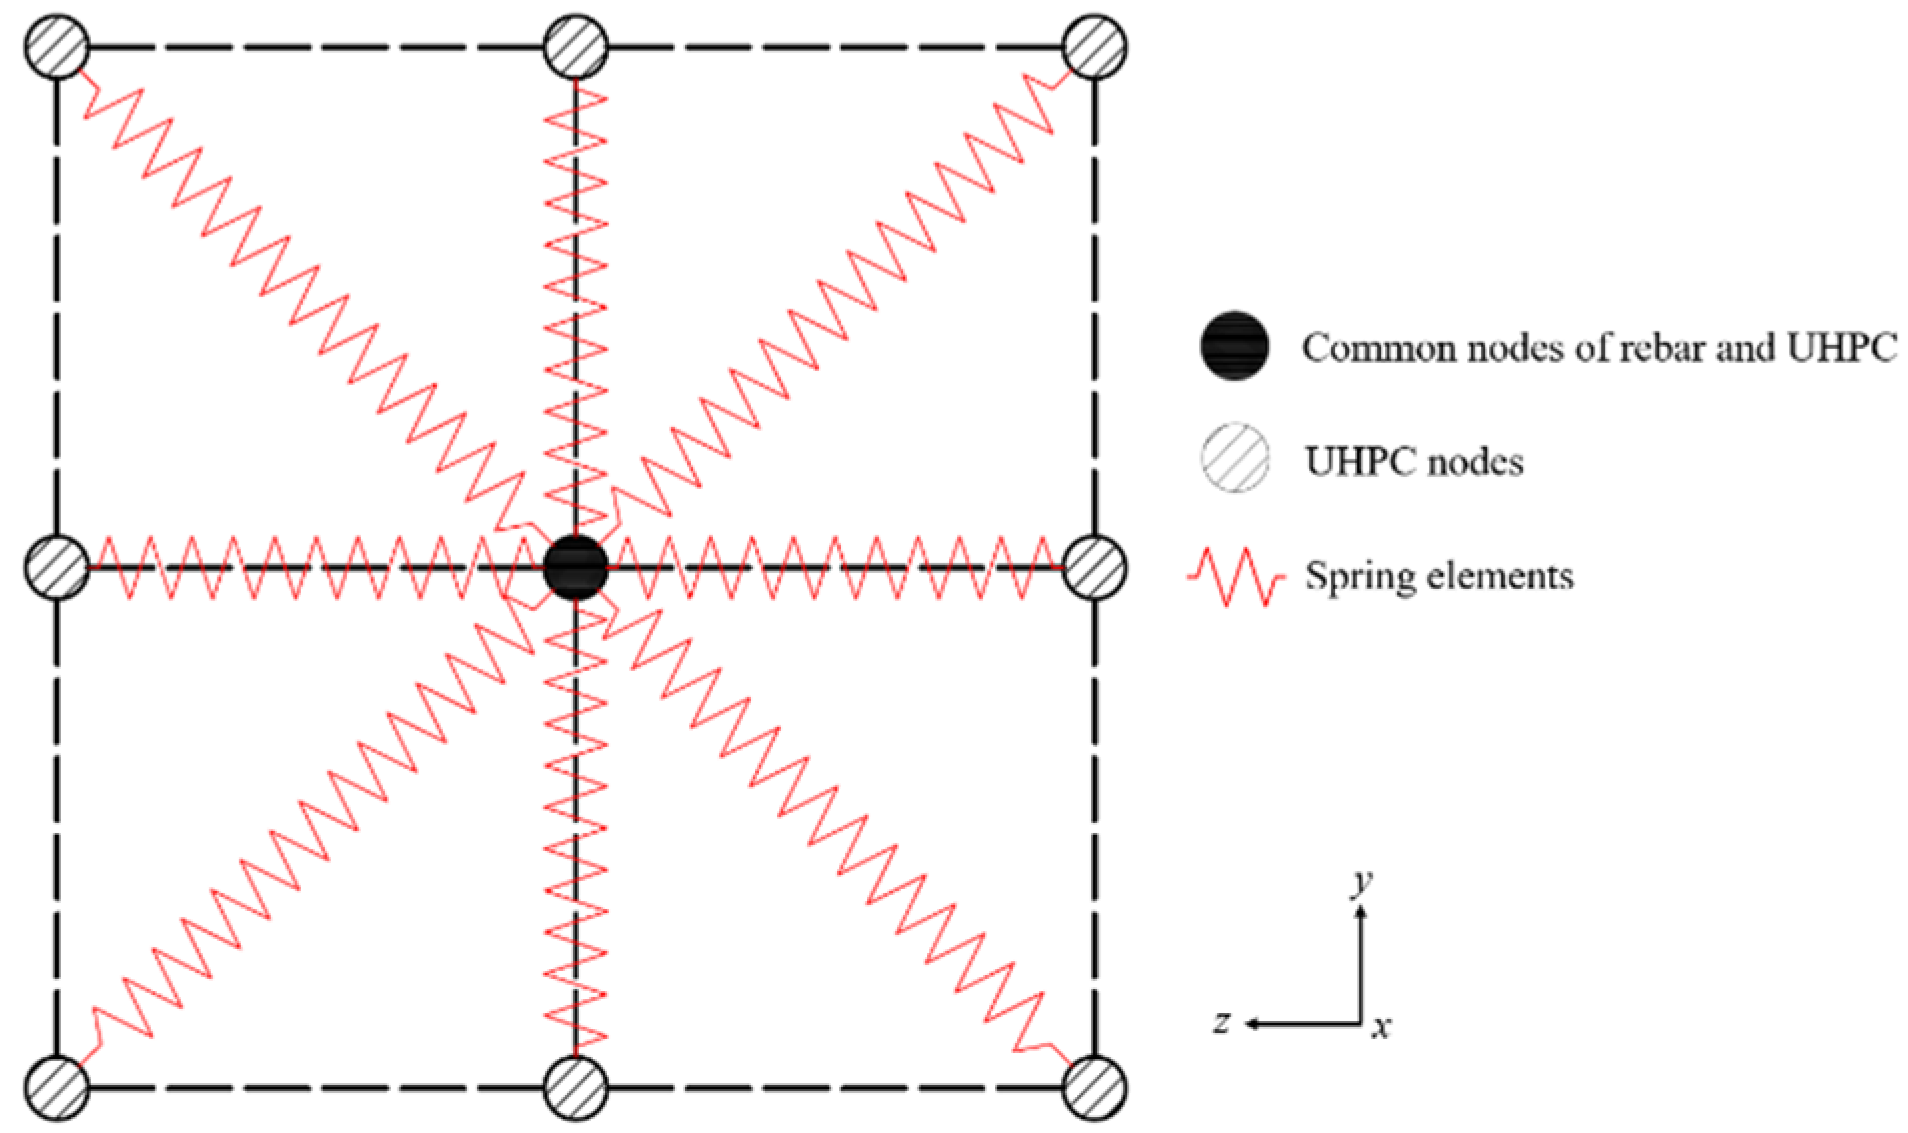
3.2. Bond–Slip Constitutive Model
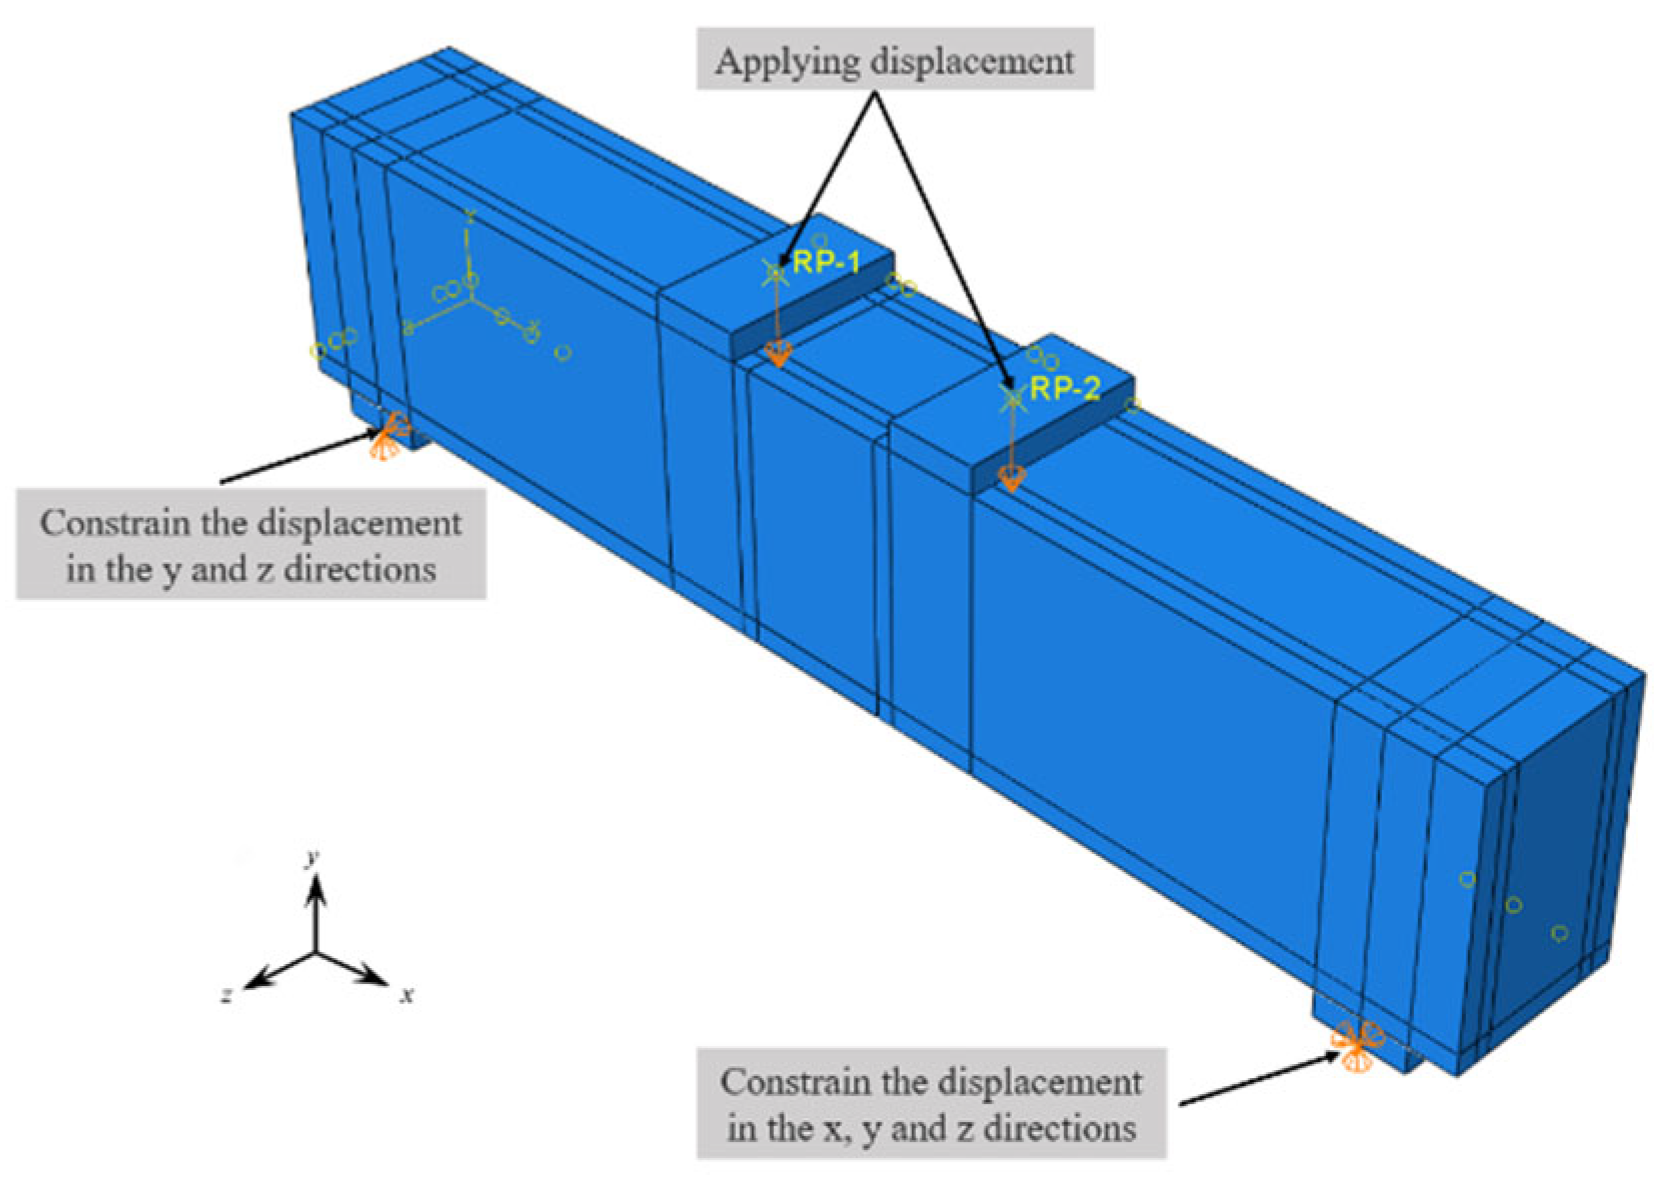
3.3. Boundary Conditions
3.4. Interactions and Constraint Conditions
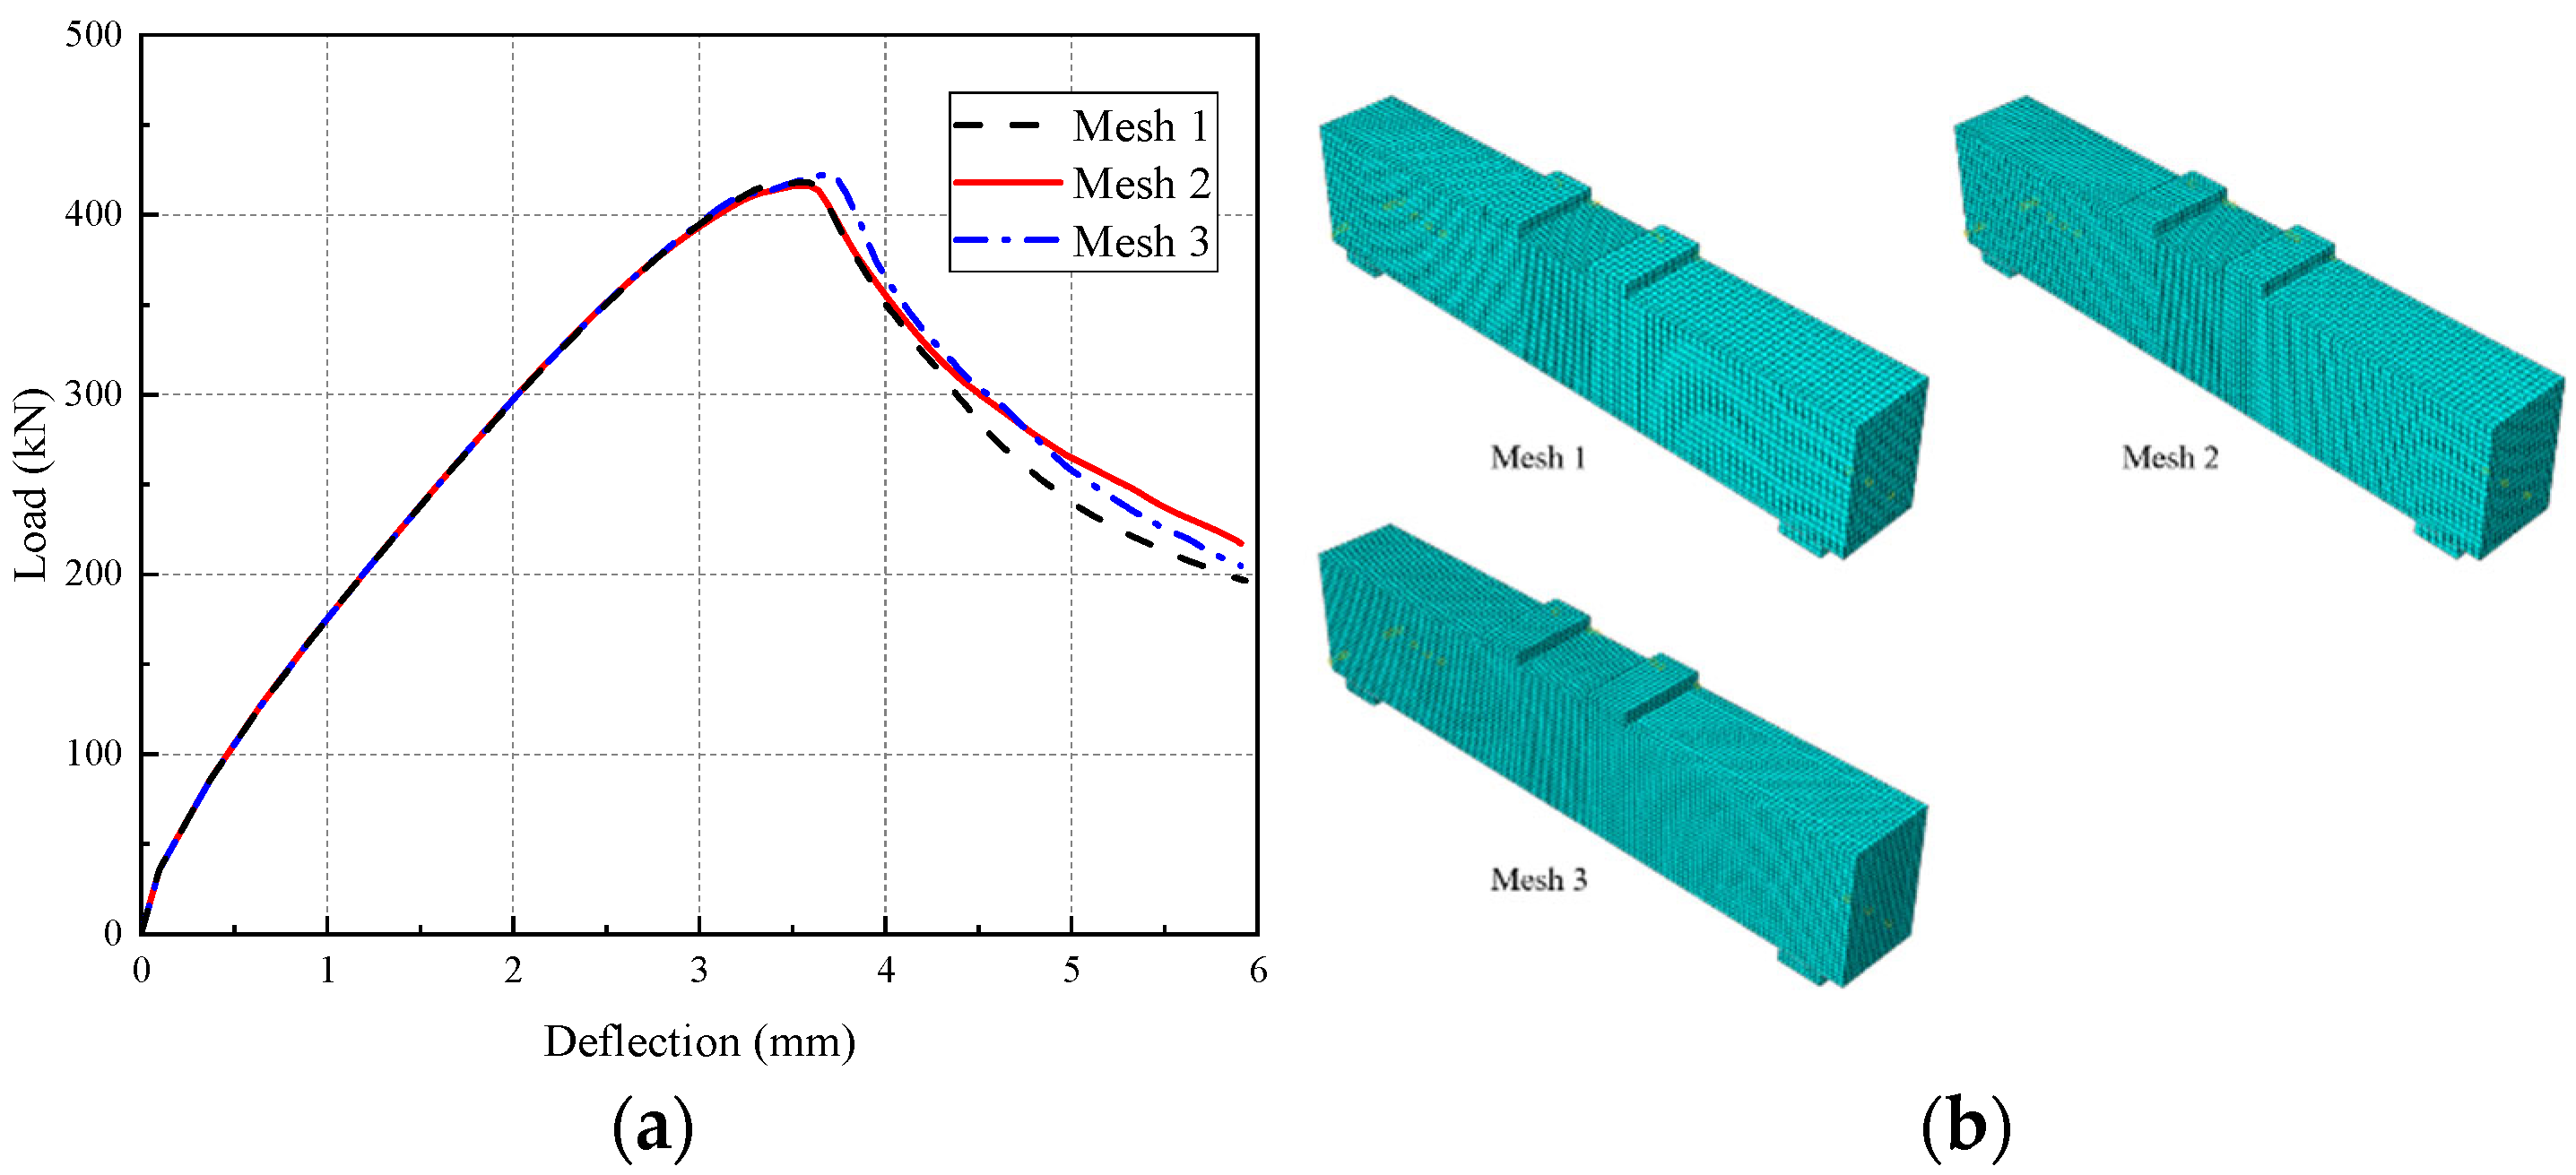
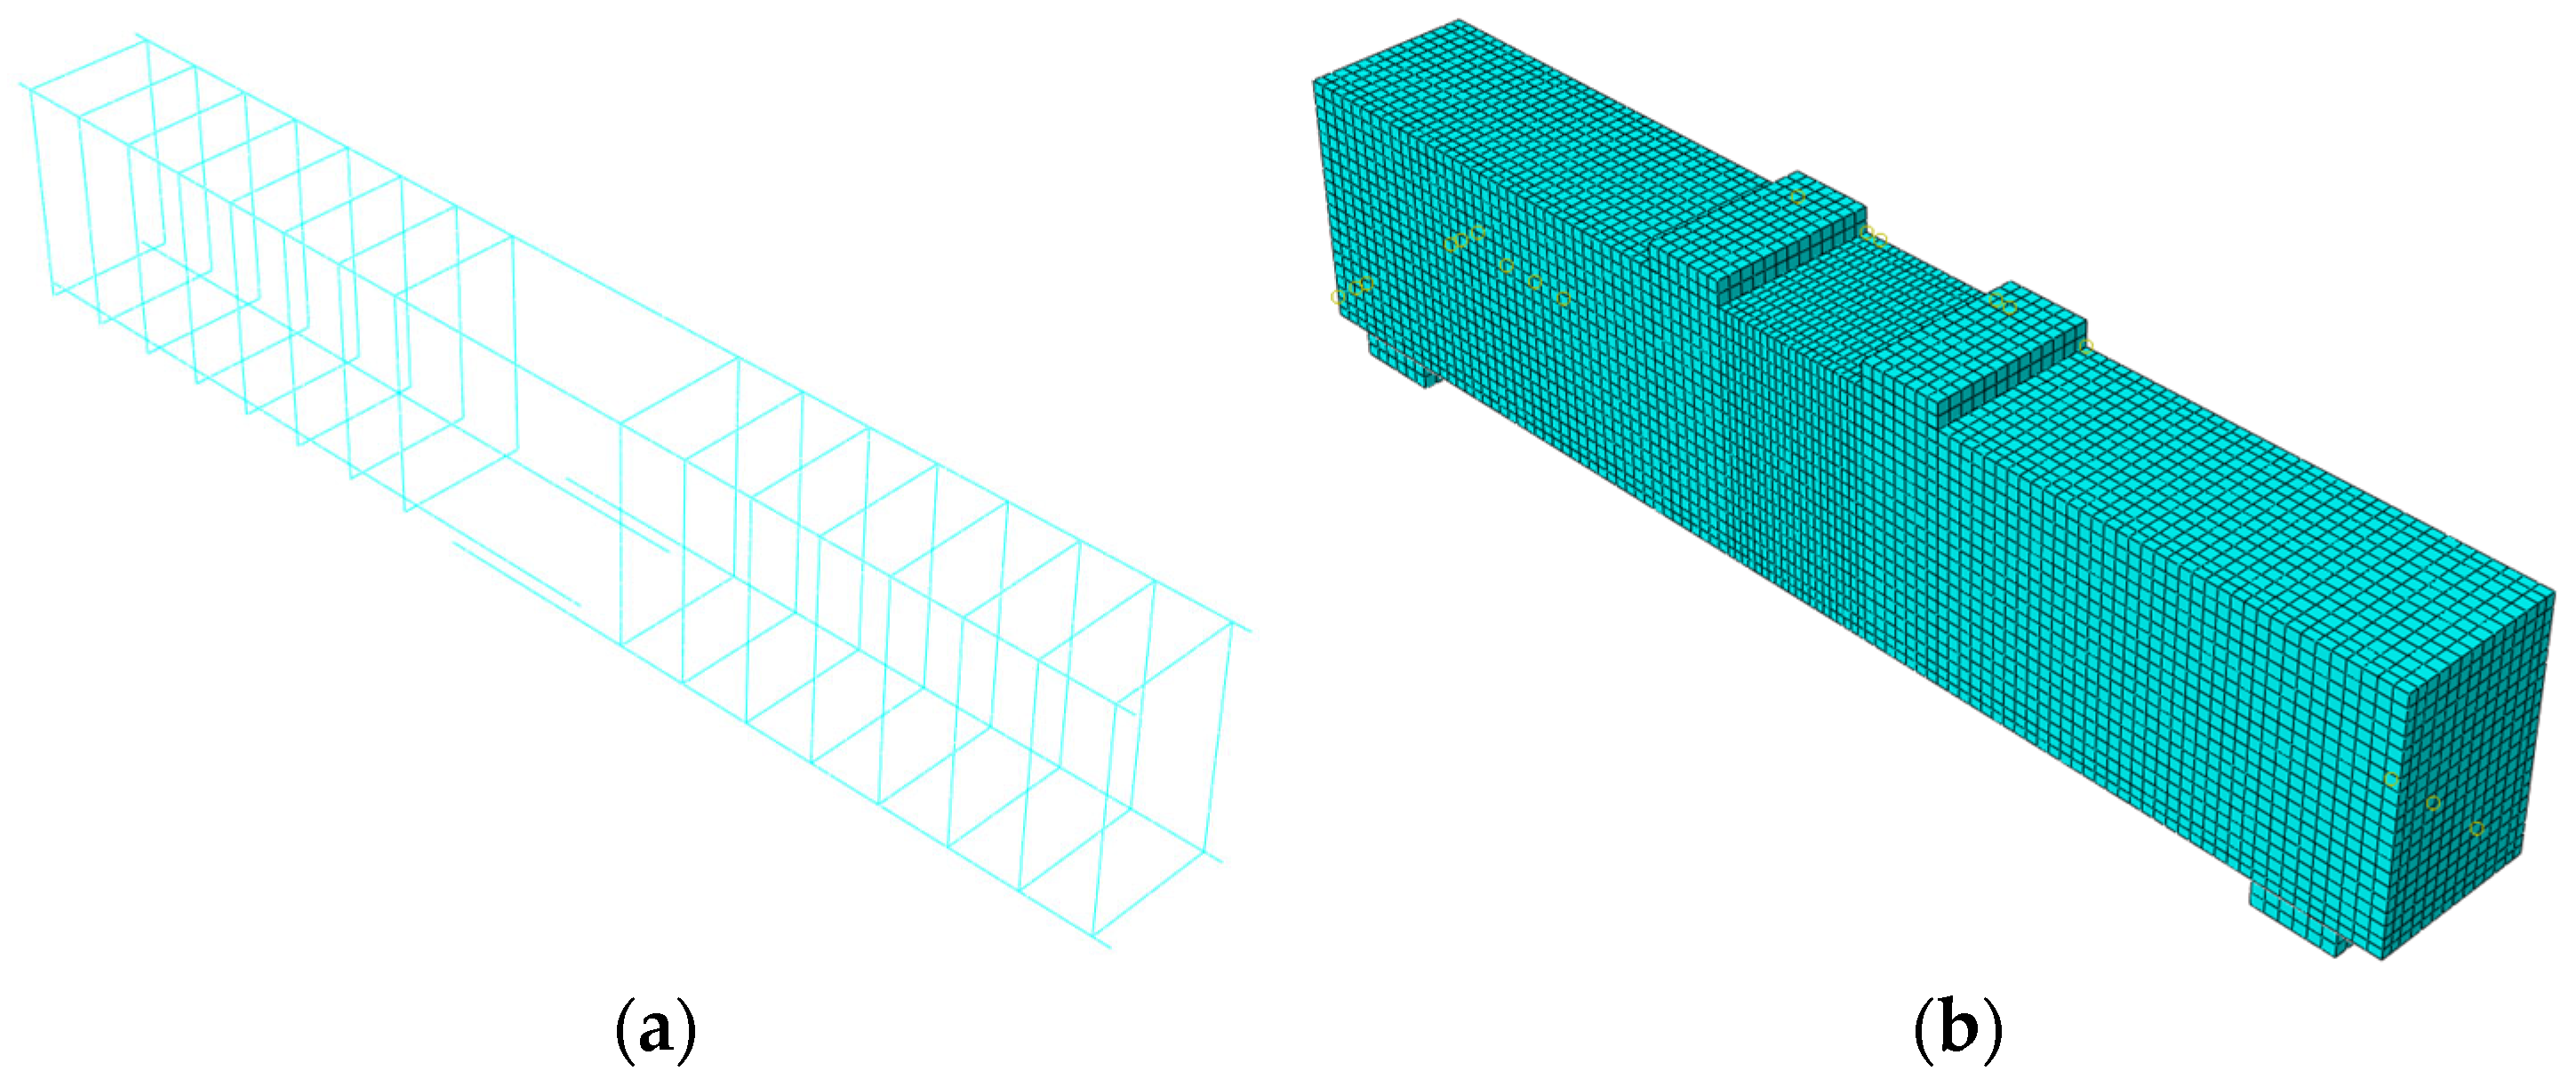
3.5. Mesh Sensitivity Analysis
4. Finite Element Model Validation
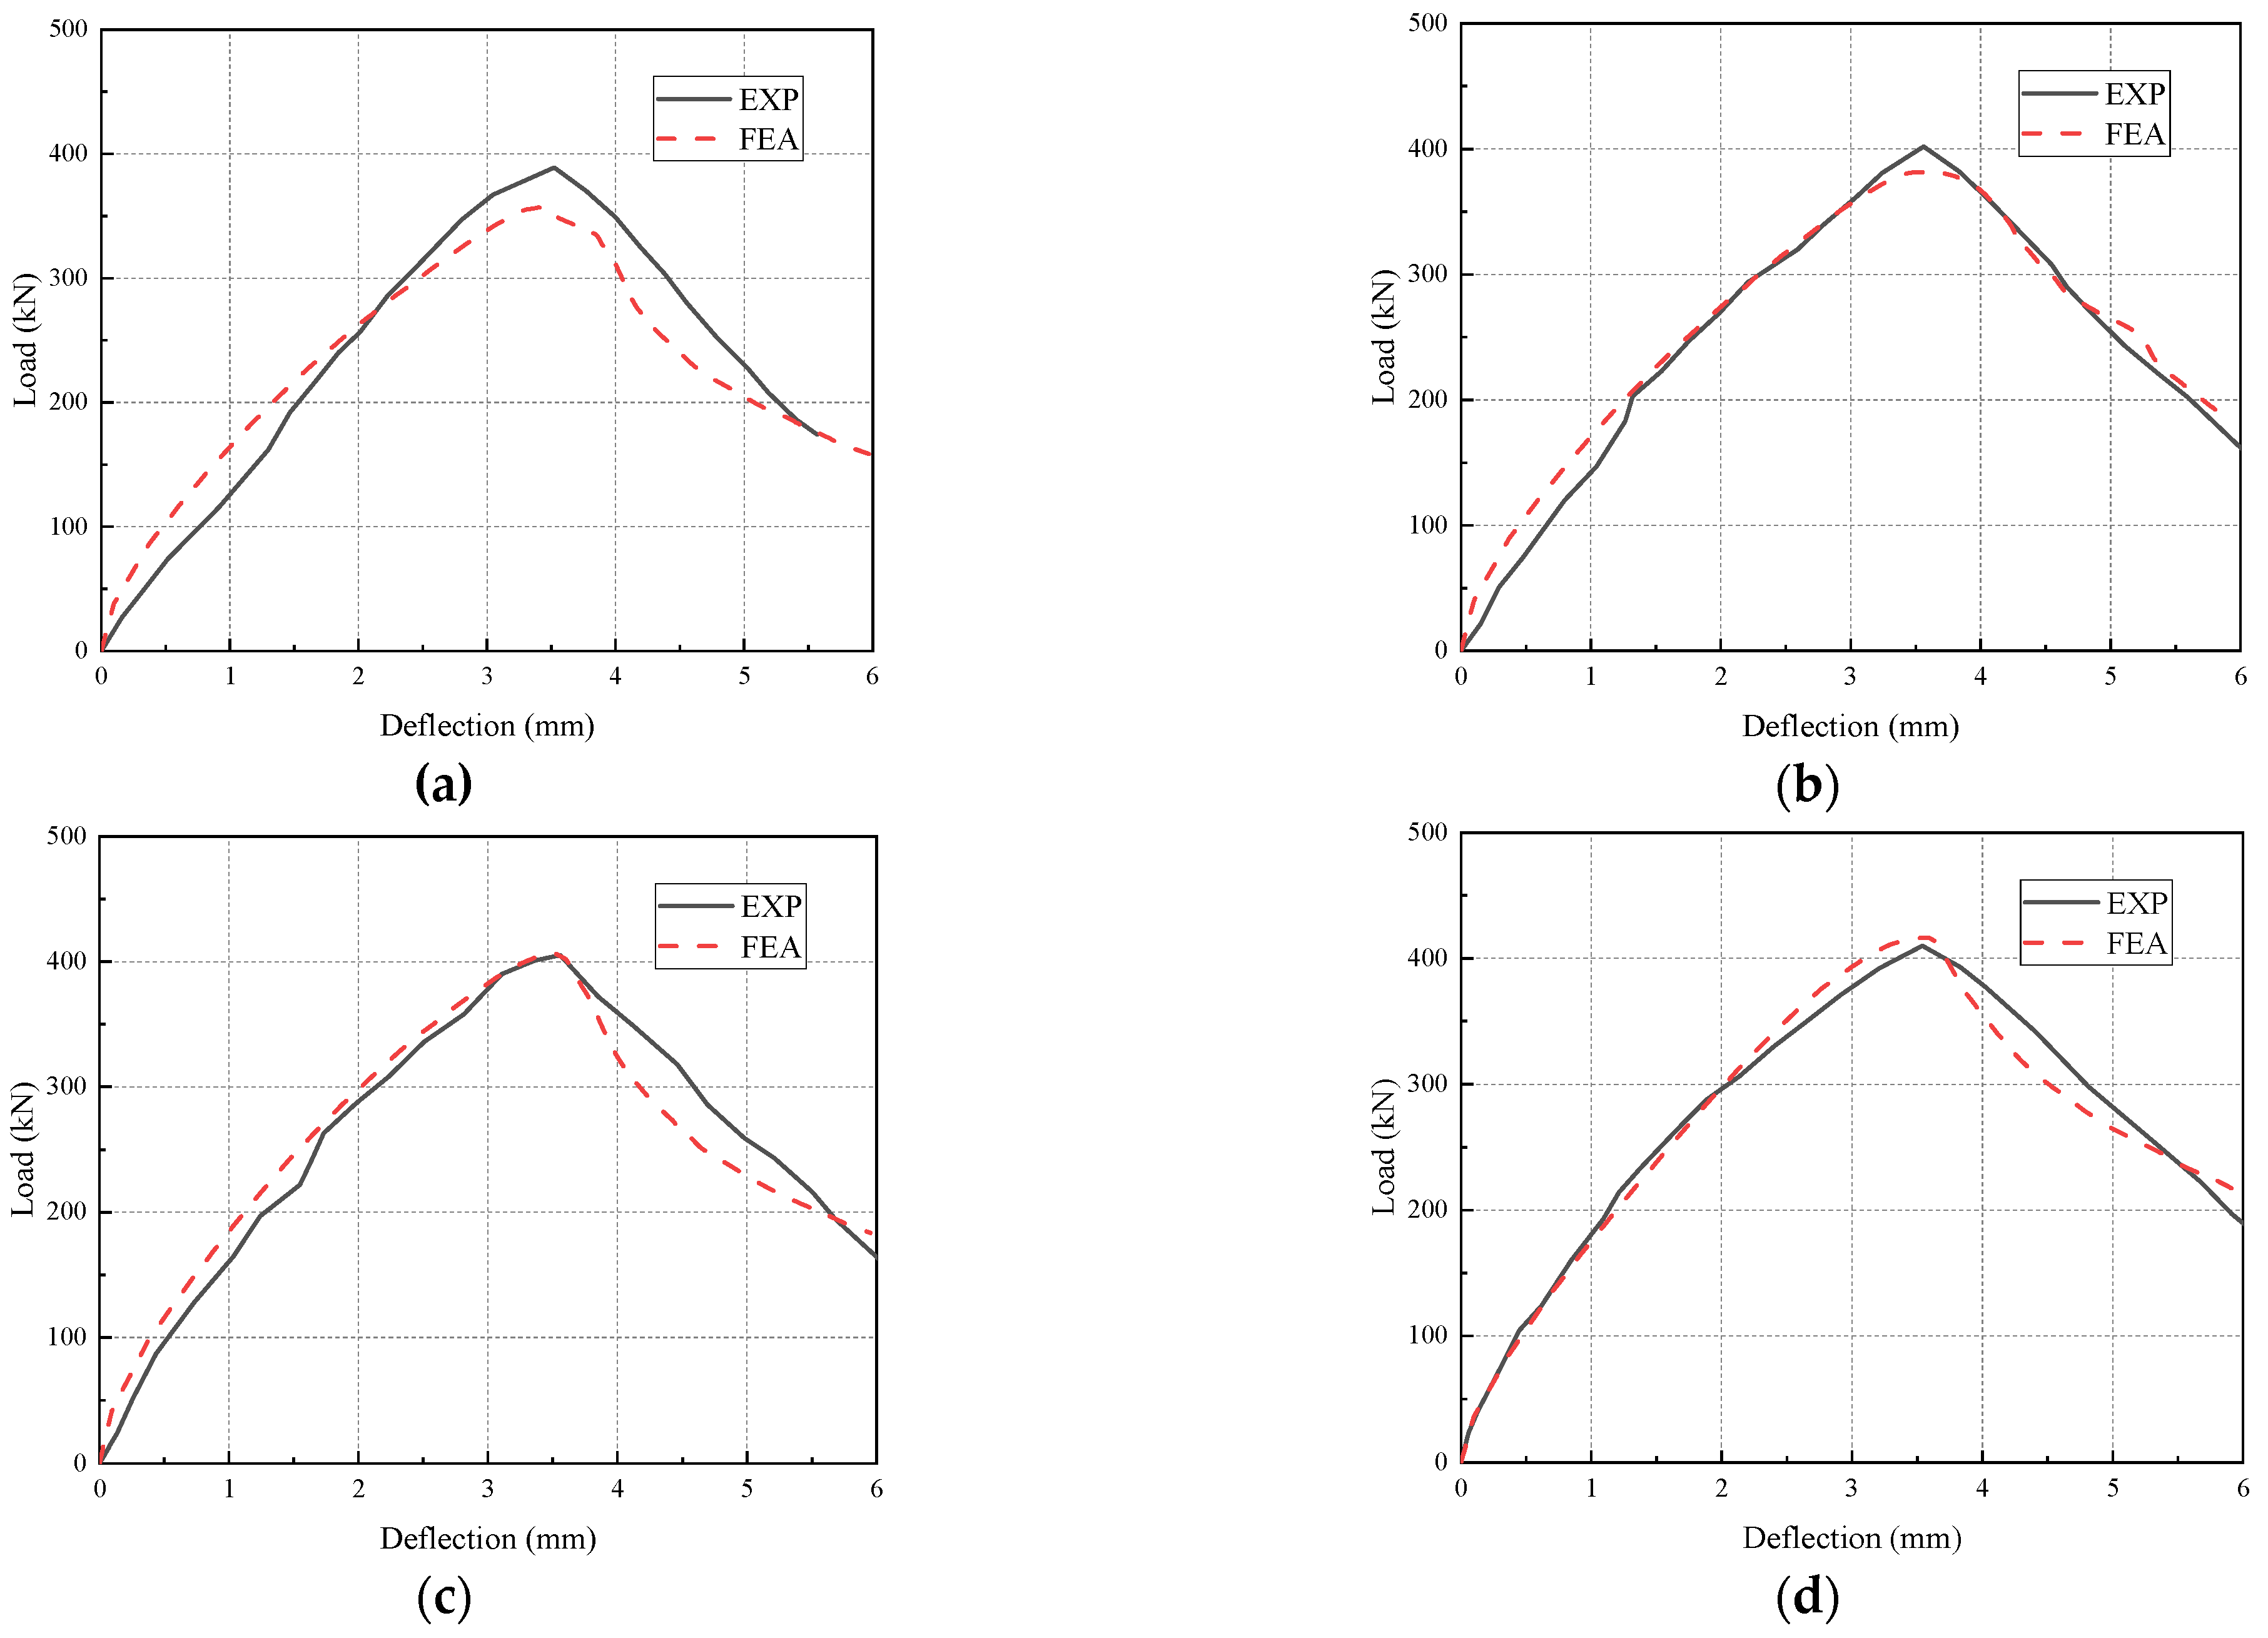
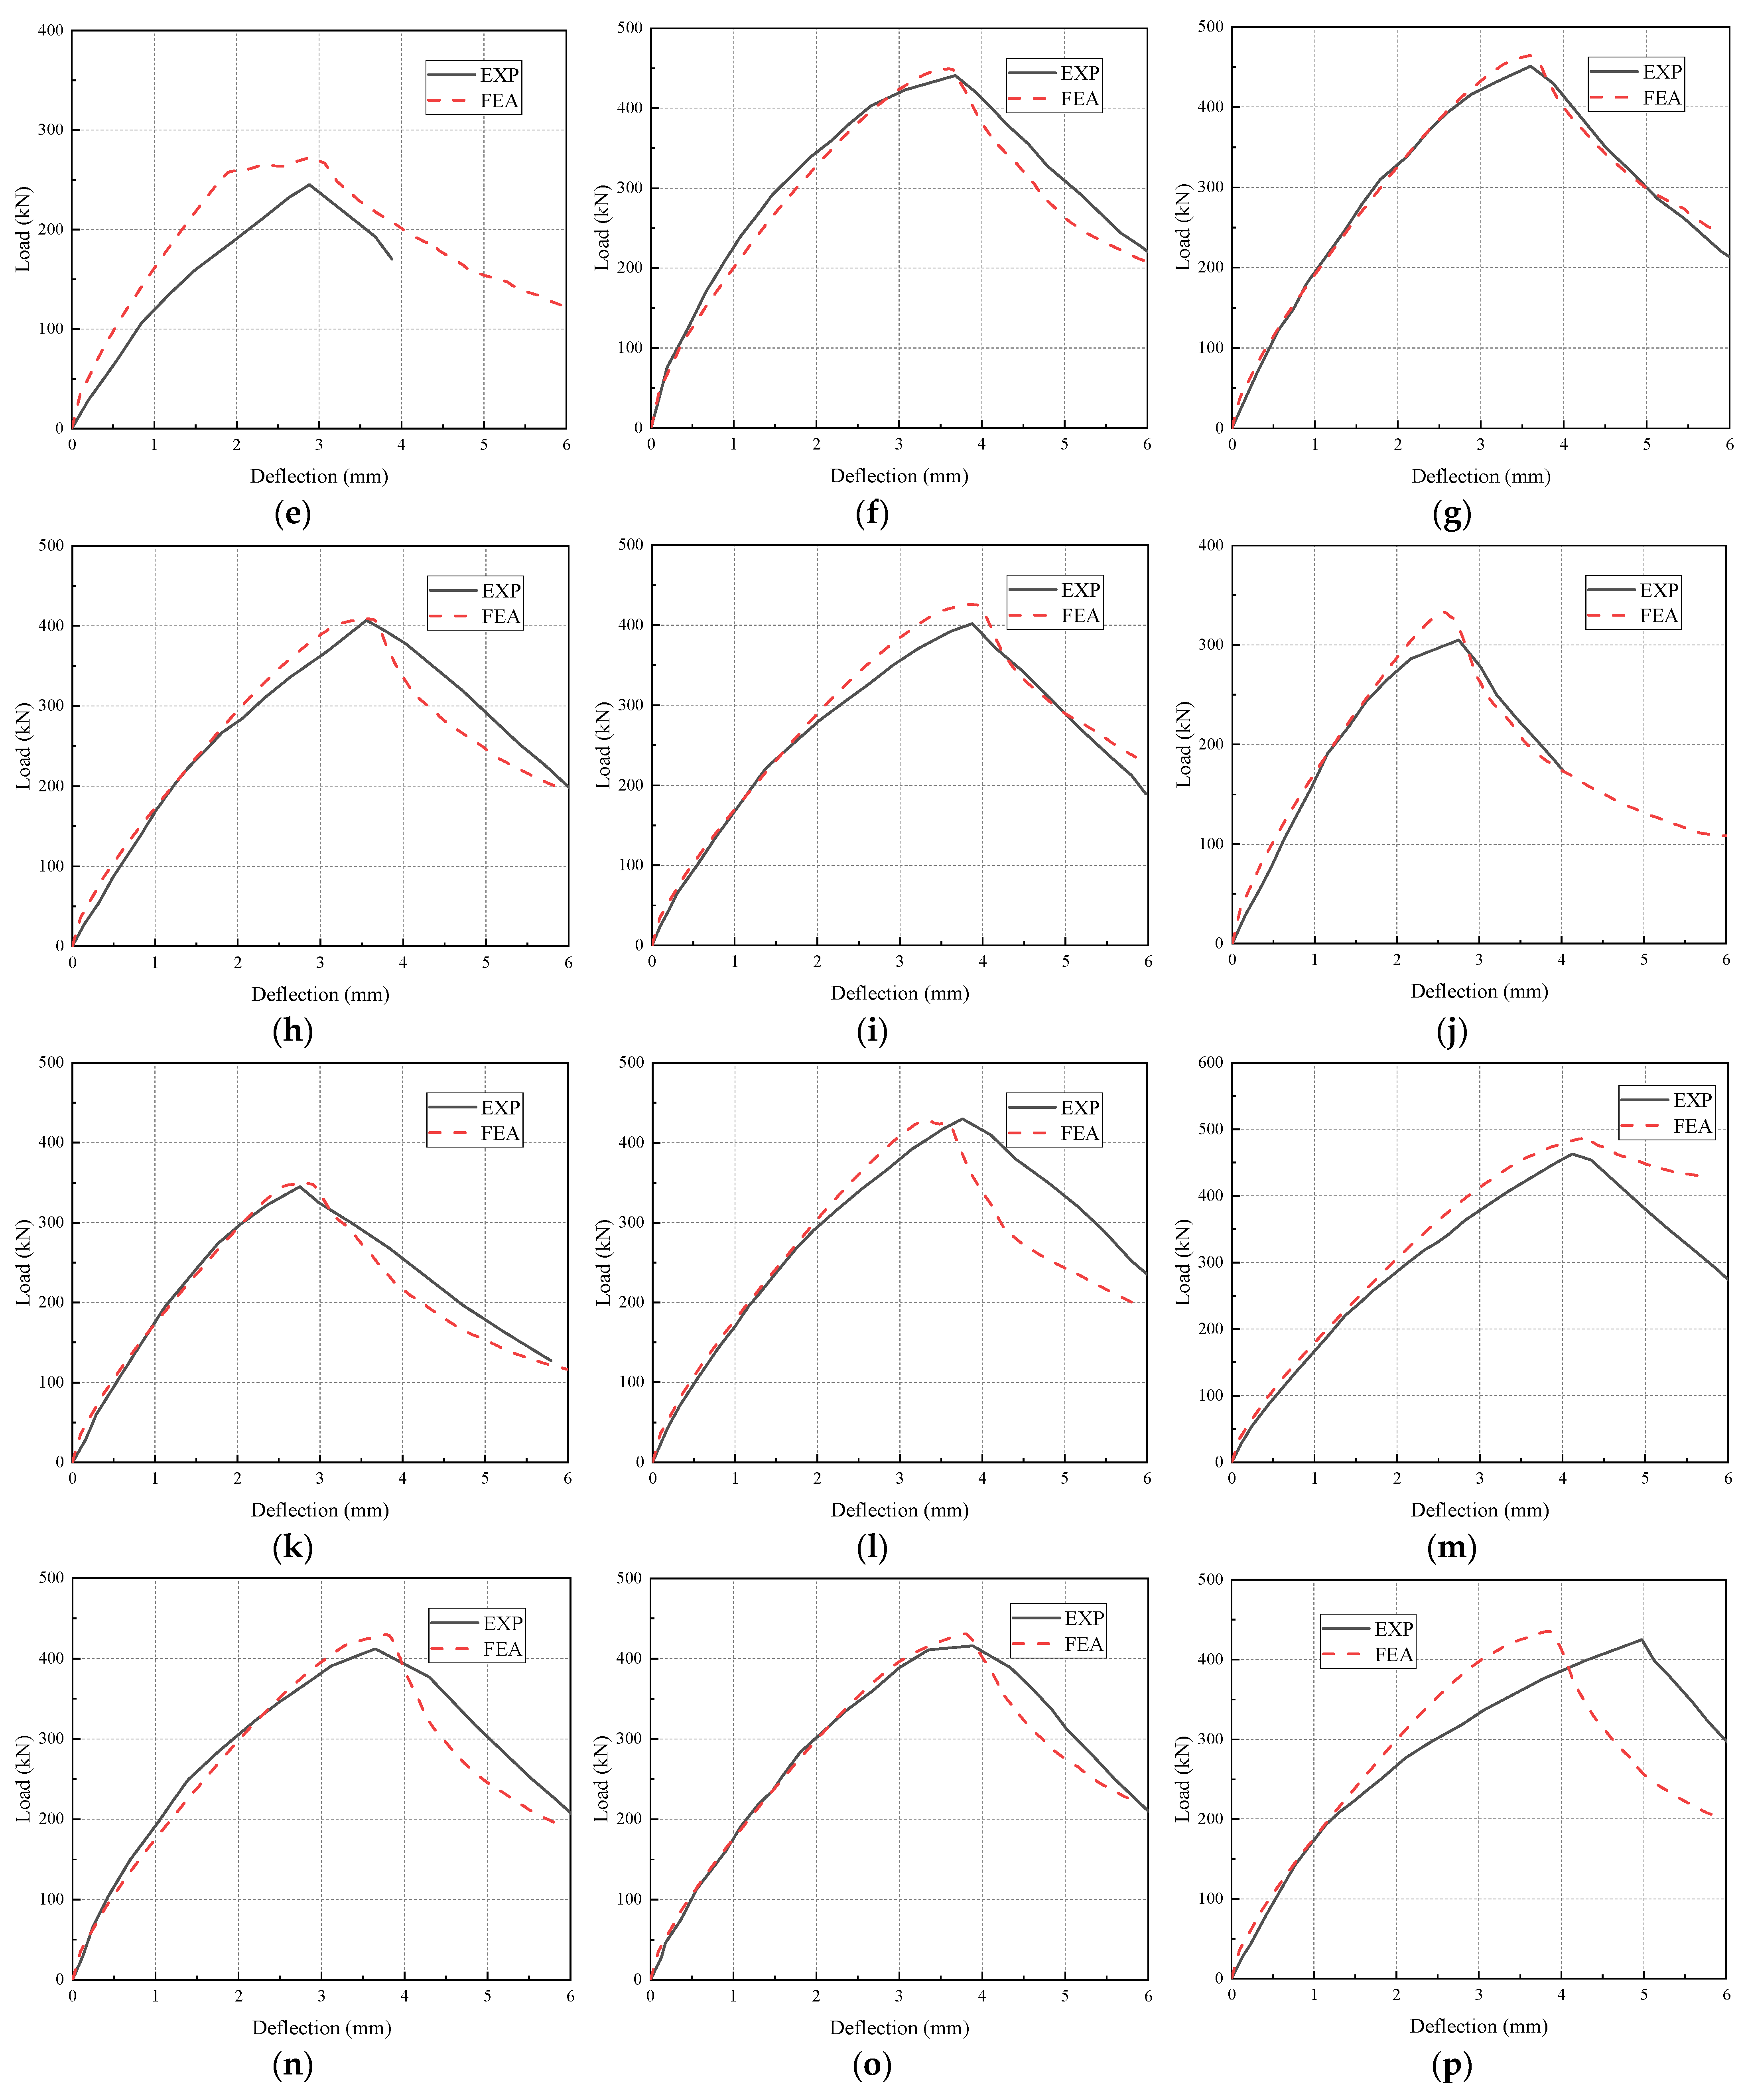
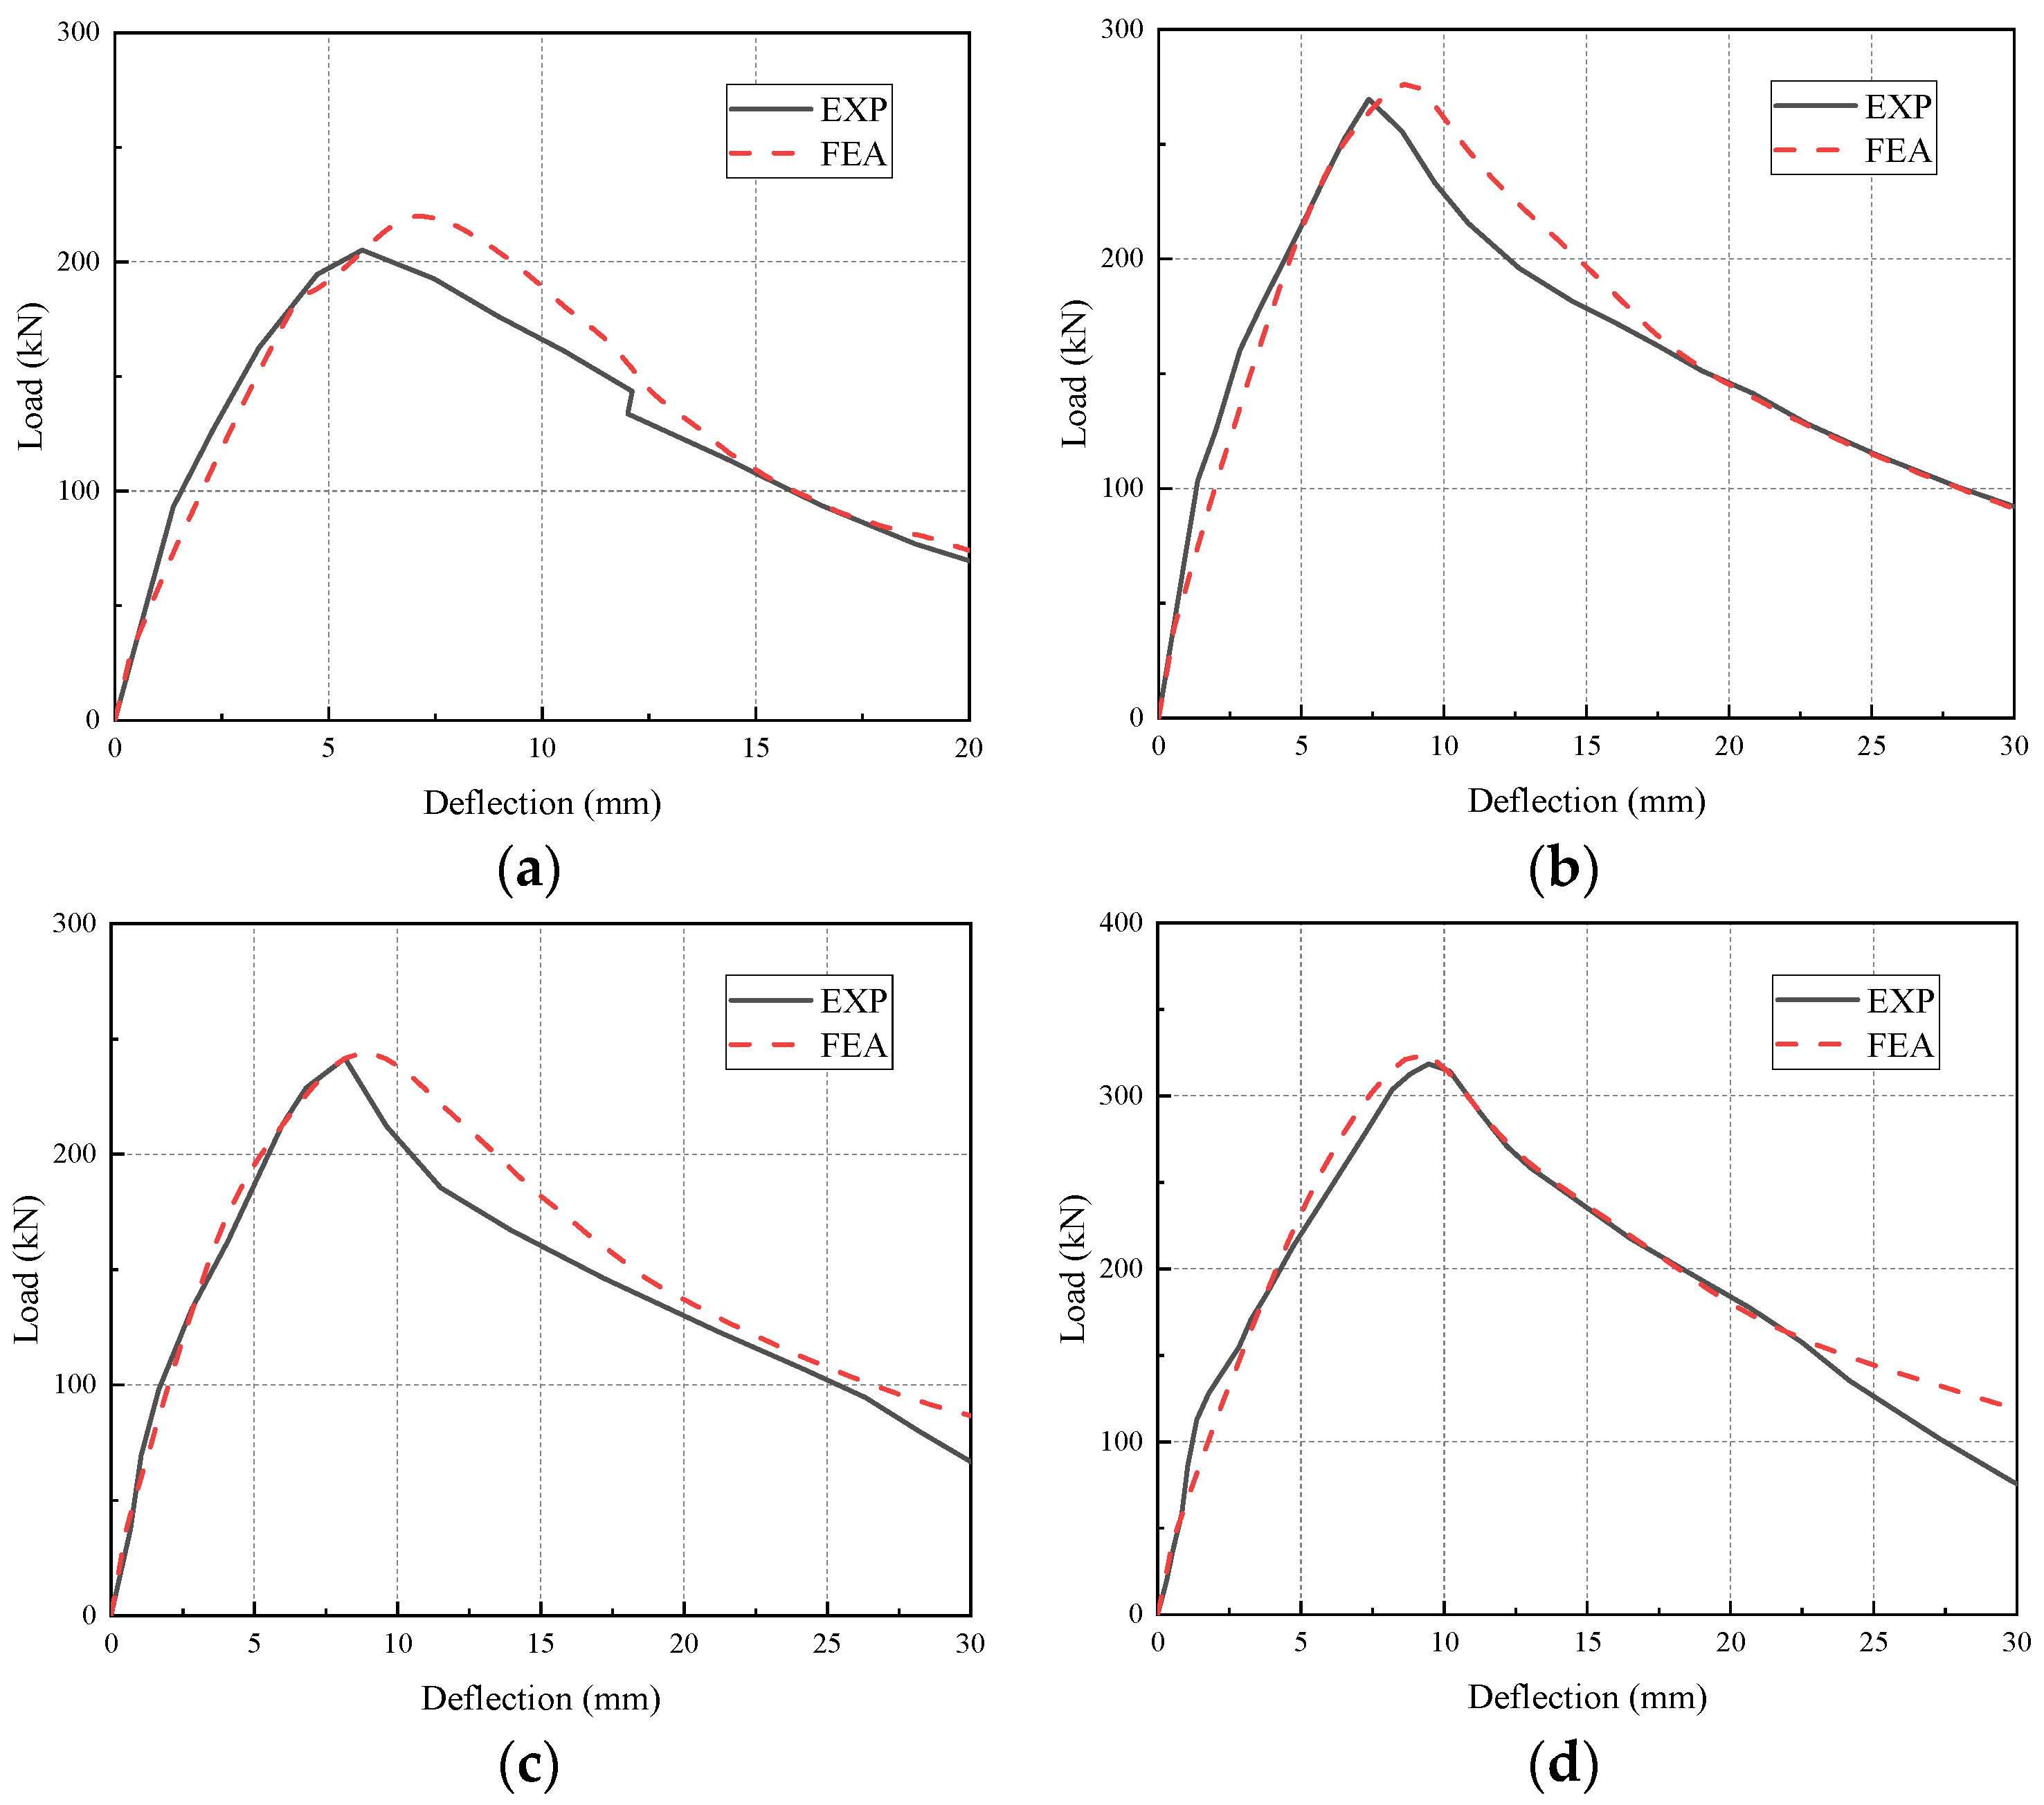
4.1. Load–Deflection Curve
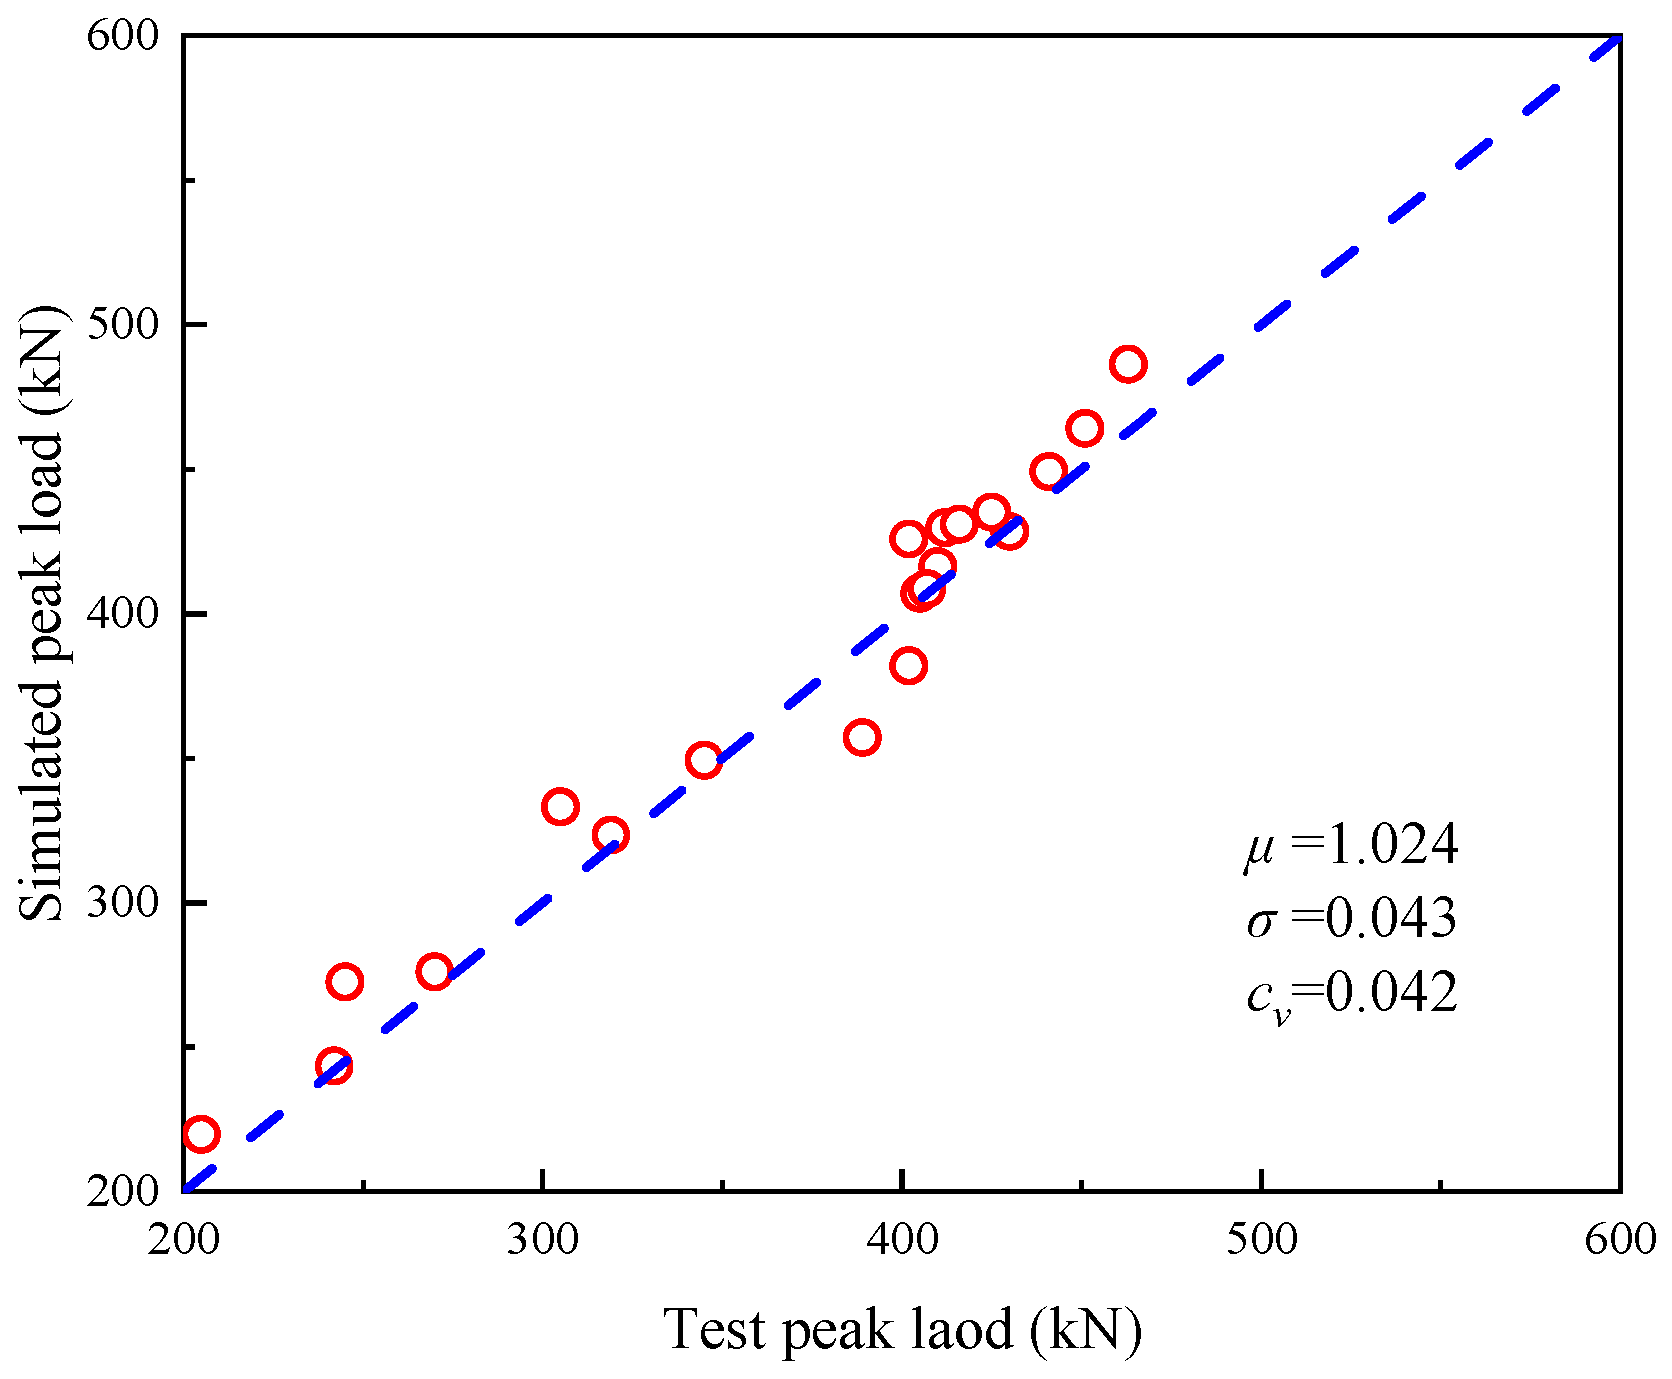
4.2. Peak Load
4.3. Bond Strength
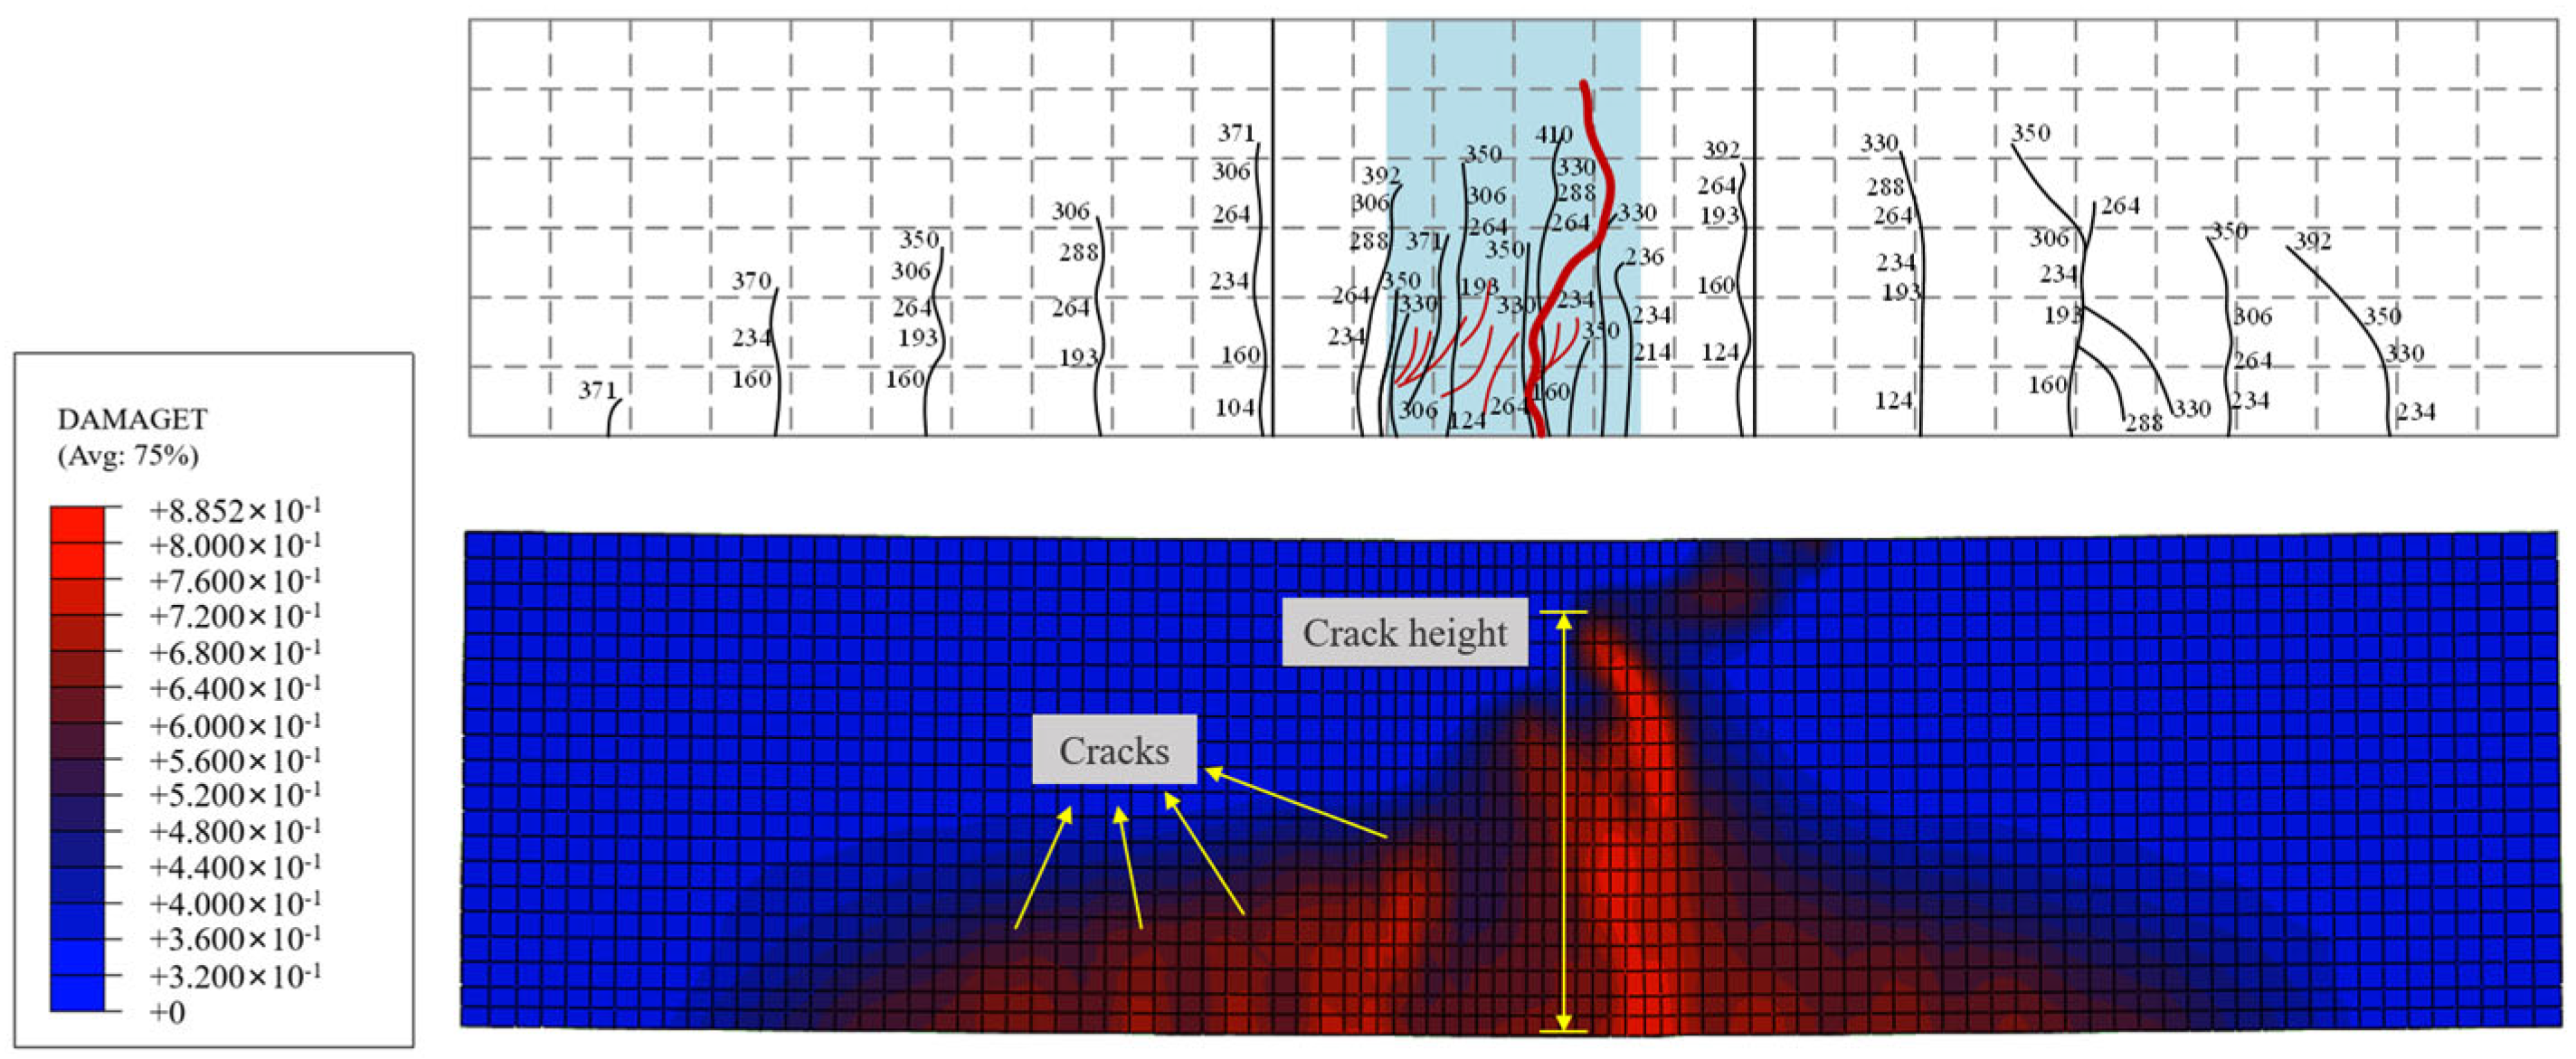
4.4. Failure Mode
5. Parameter Analysis
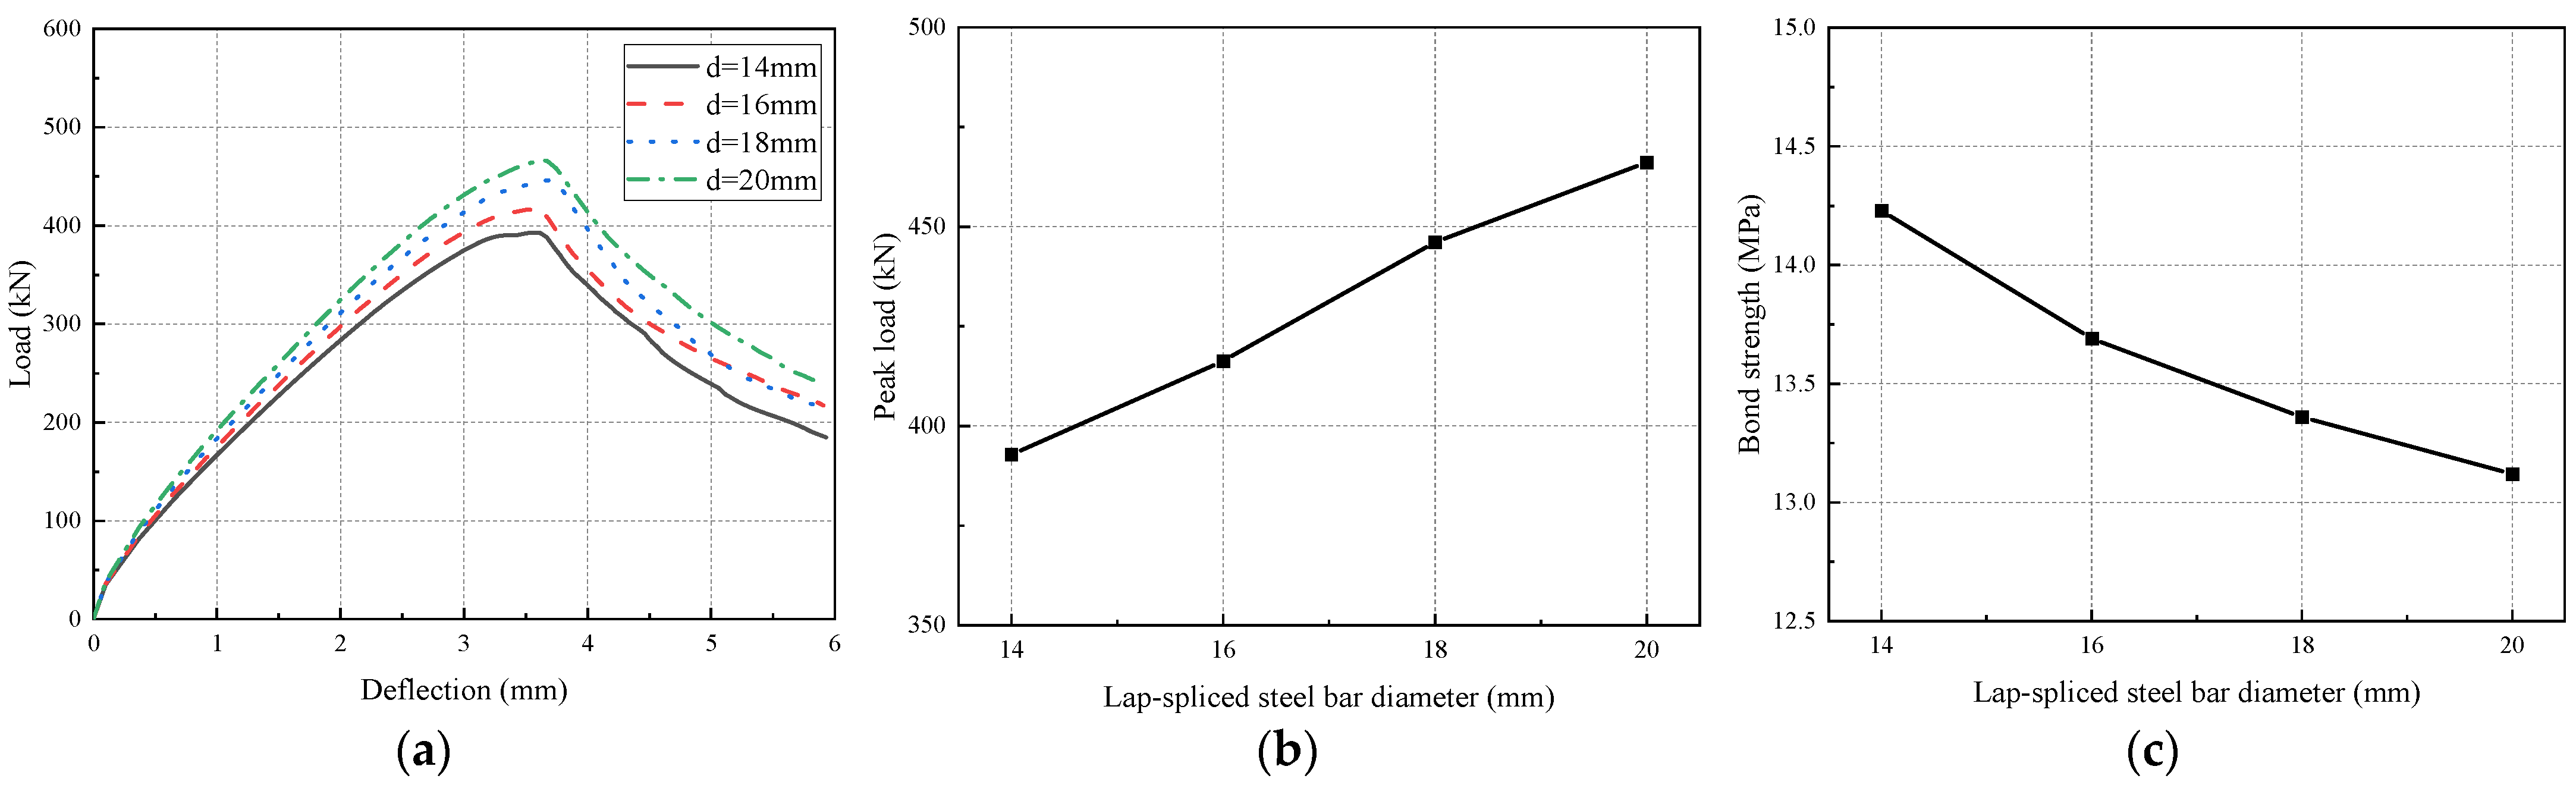
5.1. Lap-Spliced Steel Bar Diameter
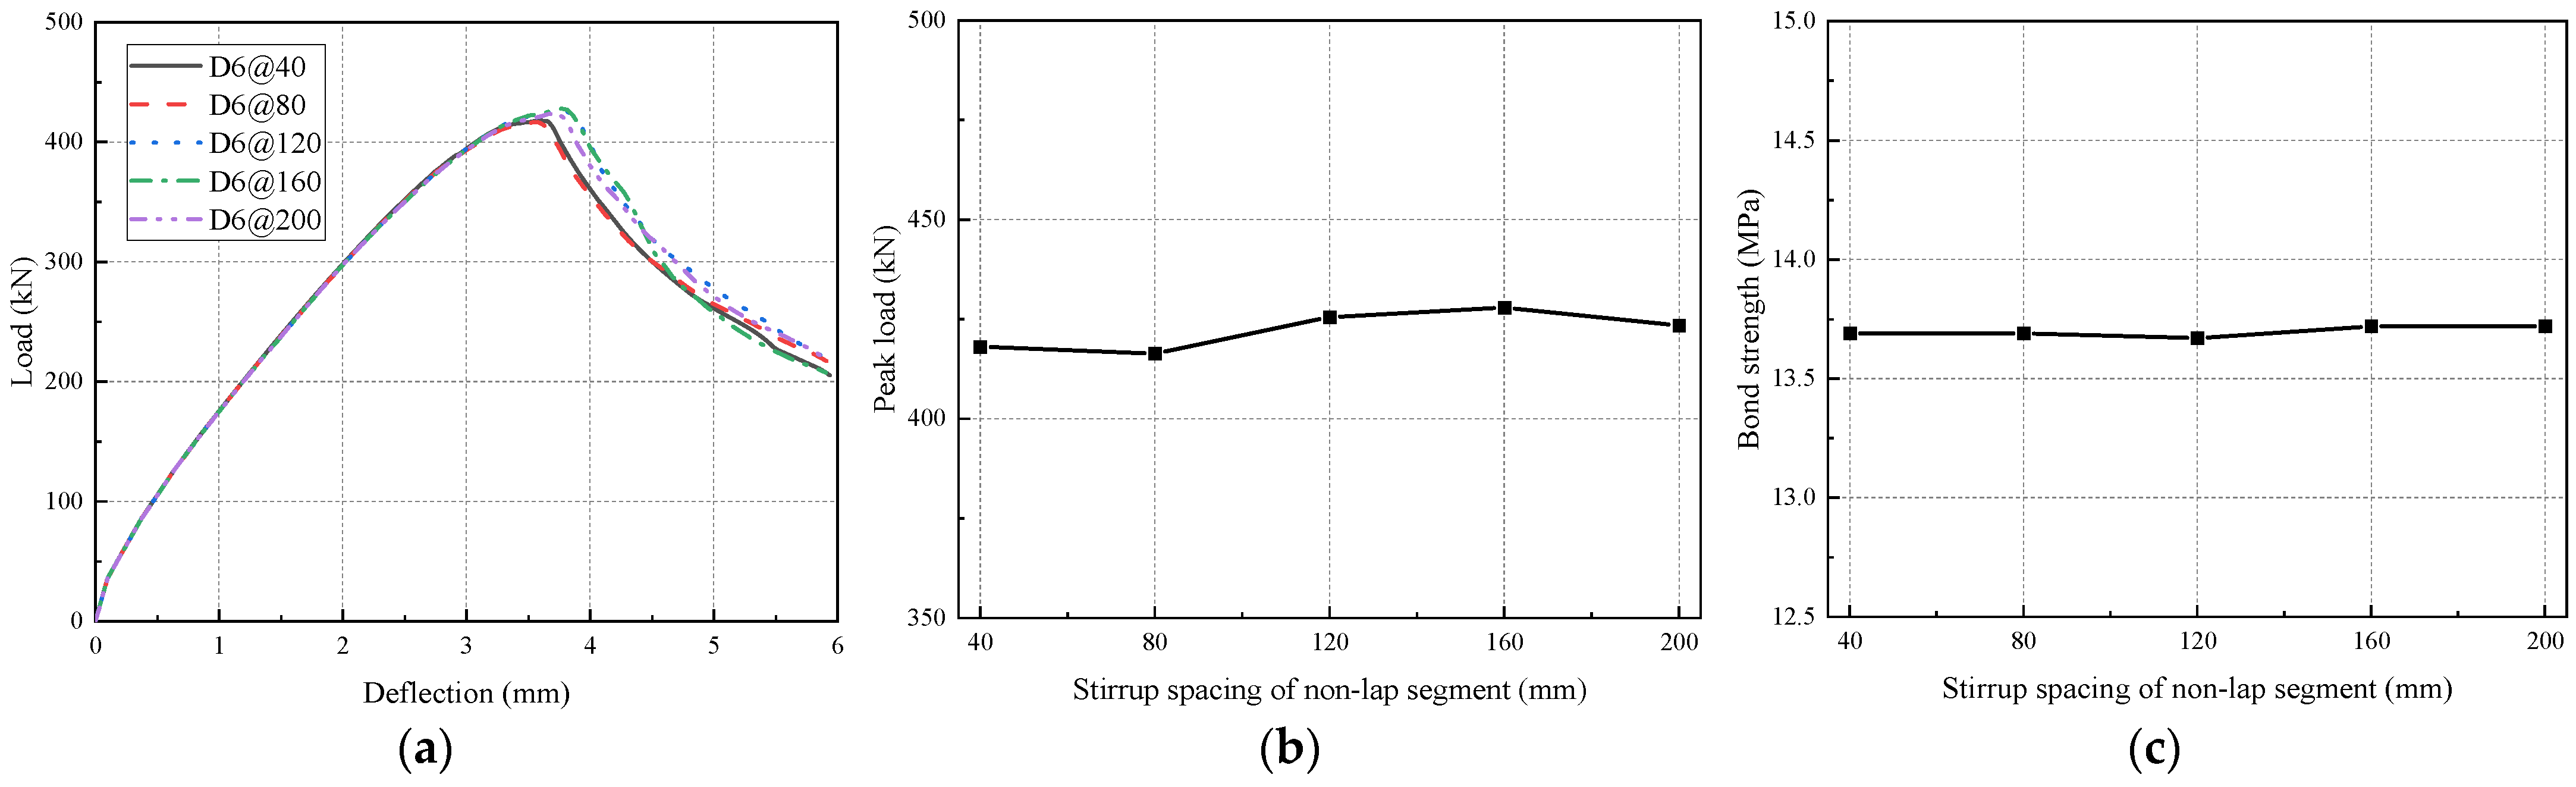
5.2. Stirrup Spacing of Non-Lap Segment
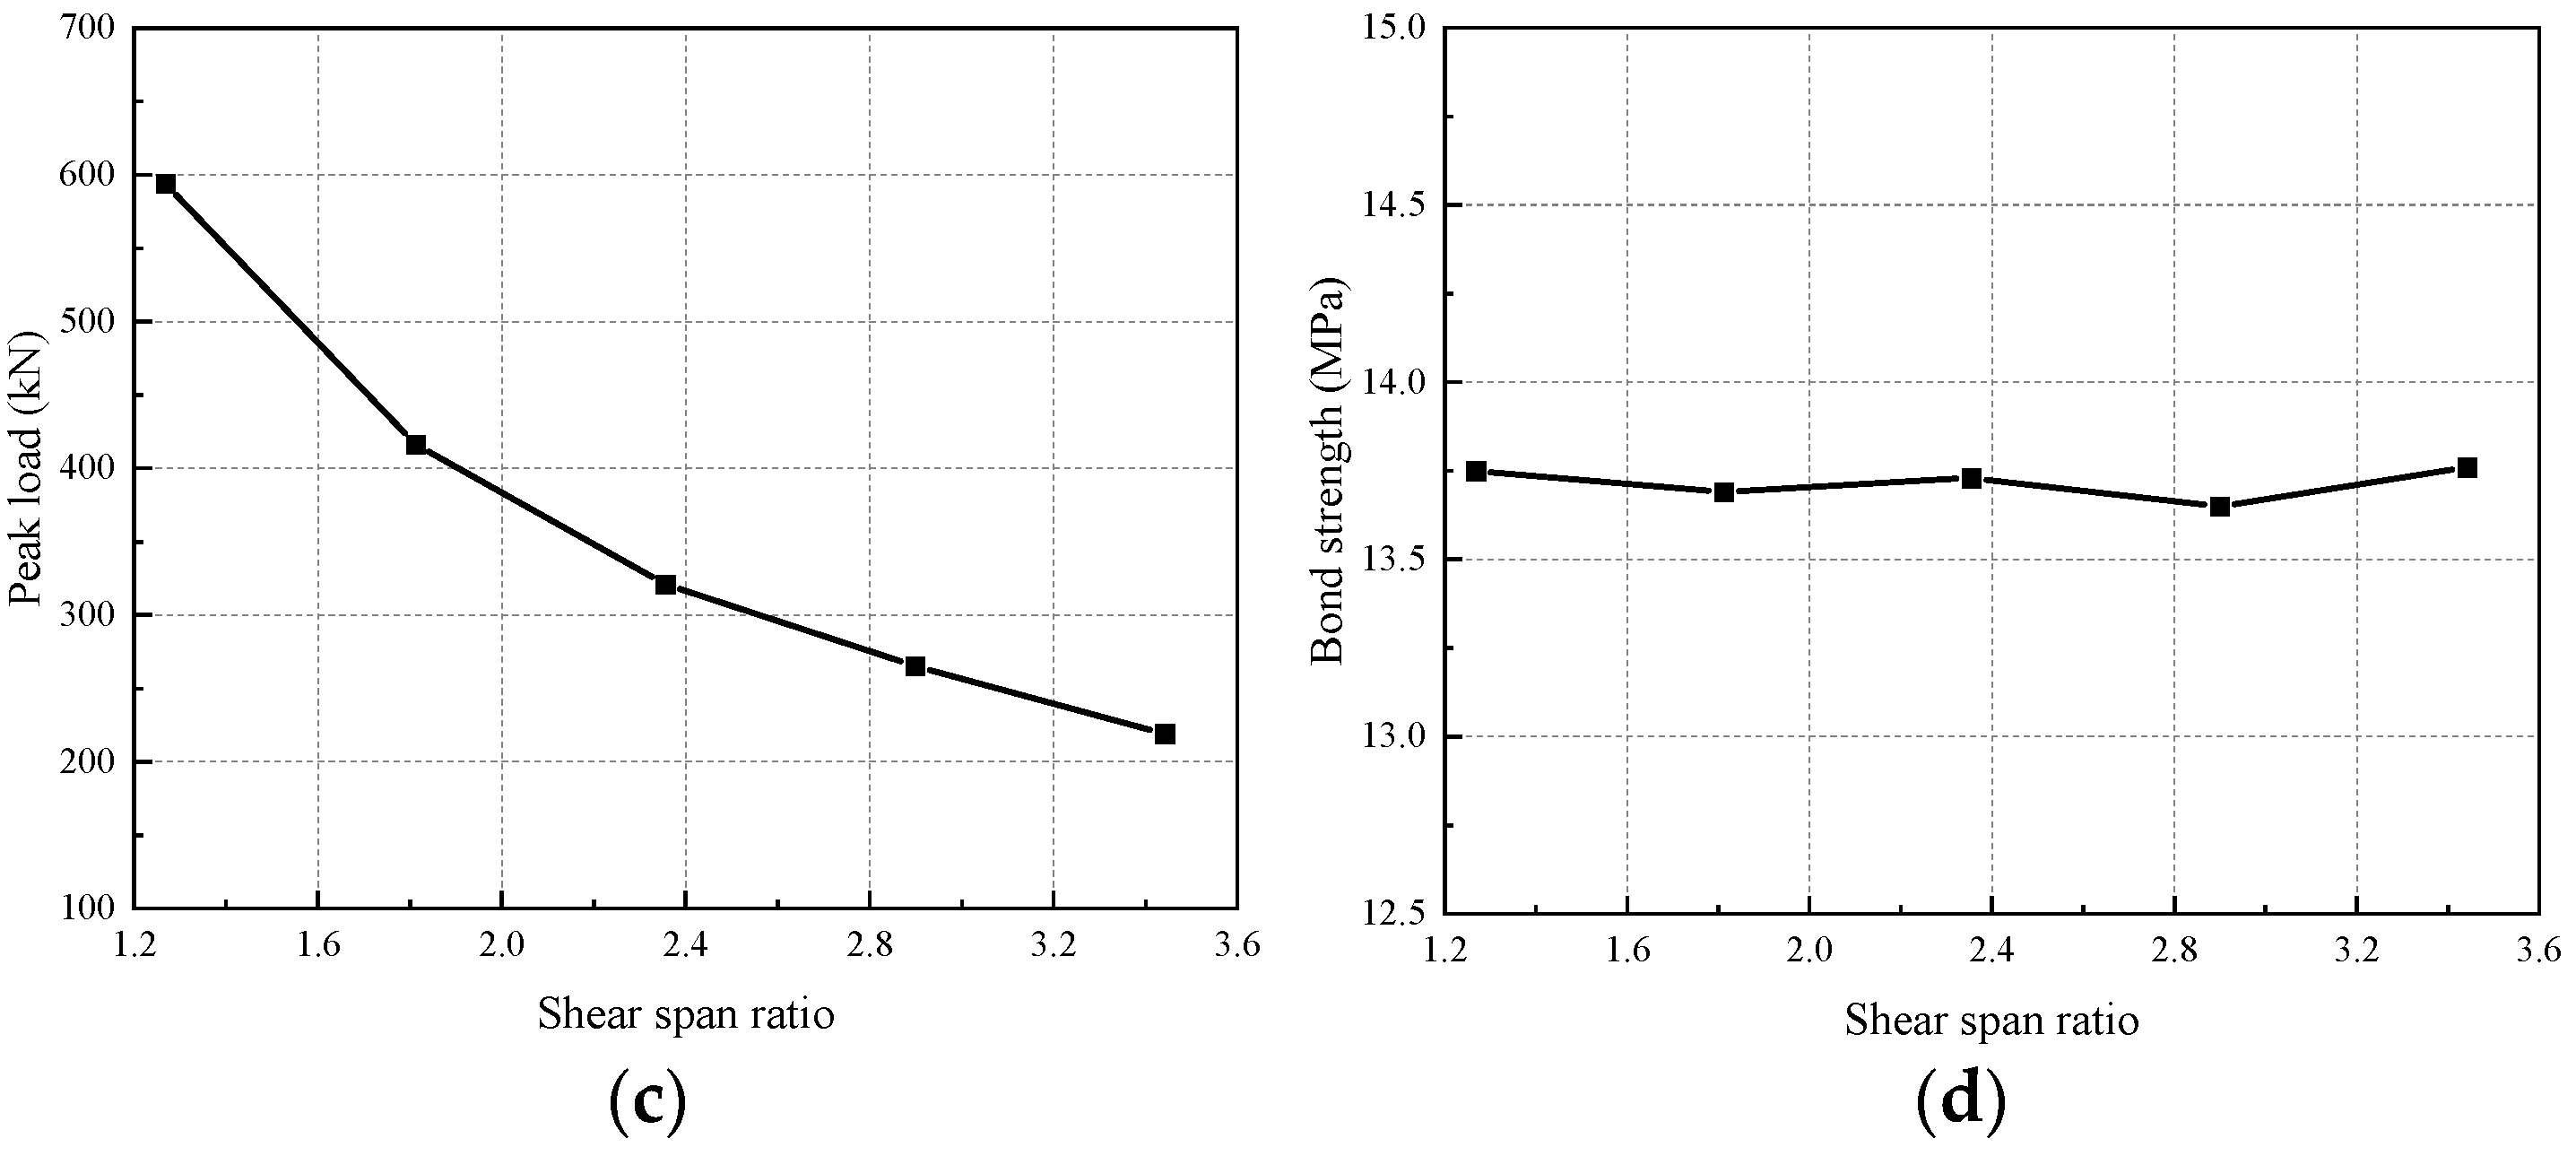
5.3. Shear Span Ratio
6. Conclusions
- (1)
- The load–deflection curve, peak load, bond strength, and failure mode obtained by simulation agree well with the test results. The mean (μ), standard deviation (σ), and coefficient of variation (cv) of the ratio of simulated peak load to test peak load are 1.024, 0.043, and 0.042, respectively. The mean (μ), standard deviation (σ), and coefficient of variation (cv) of the ratio of simulated bond strength to test bond strength are 0.955, 0.060, and 0.063, respectively.
- (2)
- The parametric analysis results show that with the lap-spliced steel bar diameter increase, the bearing capacity of the lap-spliced UHPC beam increases linearly, and the bond strength decreases linearly.
- (3)
- The stirrup spacing of the non-lap segment has no apparent effect on the bearing capacity and bond strength of the lap-spliced UHPC beam. Increasing the stirrup spacing of the non-lap segment will not cause a decline in structural performance.
- (4)
- With the increase of the shear span ratio, the initial stiffness and bearing capacity of the lap-spliced UHPC beam load–deflection curve show a hyperbolic decrease, and the bond strength remains unchanged.
Author Contributions
Funding
Institutional Review Board Statement
Informed Consent Statement
Data Availability Statement
Conflicts of Interest
References
- Hung, C.-C.; El-Tawil, S.; Chao, S.-H. A Review of Developments and Challenges for UHPC in Structural Engineering: Behavior, Analysis, and Design. J. Struct. Eng. 2021, 147, 03121001. [Google Scholar] [CrossRef]
- Sohail Muazzam, G.; Wang, B.; Jain, A.; Kahraman, R.; Ozerkan Nesibe, G.; Gencturk, B.; Dawood, M.; Belarbi, A. Advancements in Concrete Mix Designs: High-Performance and Ultrahigh-Performance Concretes from 1970 to 2016. J. Mater. Civ. Eng. 2018, 30, 04017310. [Google Scholar] [CrossRef]
- Yuan, H.; Weijian, Y.; Naito, C.J.; Rui, Z. Seismic performance of precast concrete frames with debonded reinforcement. Mater. Struct. 2018, 51, 47. [Google Scholar] [CrossRef]
- Yuan, H.; Bing, H. Experimental study on bond behavior between high-strength grout and deformed steel bars. Constr. Build. Mater. 2021, 301, 124059. [Google Scholar] [CrossRef]
- Wang, Y.-Z.; Wang, Y.-B.; Zhao, Y.-Z.; Li, G.-Q.; Lyu, Y.-F.; Li, H. Experimental study on ultra-high performance concrete under triaxial compression. Constr. Build. Mater. 2020, 263, 120225. [Google Scholar] [CrossRef]
- Kang, S.-T.; Lee, Y.; Park, Y.-D.; Kim, J.-K. Tensile fracture properties of an Ultra High Performance Fiber Reinforced Concrete (UHPFRC) with steel fiber. Compos. Struct. 2010, 92, 61–71. [Google Scholar] [CrossRef]
- Wille, K.; El-Tawil, S.; Naaman, A.E. Properties of strain hardening ultra high performance fiber reinforced concrete (UHP-FRC) under direct tensile loading. Cem. Concr. Compos. 2014, 48, 53–66. [Google Scholar] [CrossRef]
- Wu, P.; Wu, C.; Liu, Z.; Hao, H. Investigation of shear performance of UHPC by direct shear tests. Eng. Struct. 2019, 183, 780–790. [Google Scholar] [CrossRef]
- Xu, S.; Wu, C.; Liu, Z.; Han, K.; Su, Y.; Zhao, J.; Li, J. Experimental investigation of seismic behavior of ultra-high performance steel fiber reinforced concrete columns. Eng. Struct. 2017, 152, 129–148. [Google Scholar] [CrossRef]
- Luo, Y.; Zhao, Y.; Chen, Y.; Lin, X.; Yan, J. Experimental Studies on Seismic Performance of UHPSFRC-Filled Square Steel Tubular Columns. Buildings 2022, 12, 798. [Google Scholar] [CrossRef]
- Yu, R.; van Beers, L.; Spiesz, P.; Brouwers, H.J.H. Impact resistance of a sustainable Ultra-High Performance Fibre Reinforced Concrete (UHPFRC) under pendulum impact loadings. Constr. Build. Mater. 2016, 107, 203–215. [Google Scholar] [CrossRef]
- Mina, A.L.; Petrou, M.F.; Trezos, K.G. Resistance of an Optimized Ultra-High Performance Fiber Reinforced Concrete to Projectile Impact. Buildings 2021, 11, 63. [Google Scholar] [CrossRef]
- Wei, J.; Li, J.; Wu, C.; Liu, Z.-x.; Li, J. Hybrid fibre reinforced ultra-high performance concrete beams under static and impact loads. Eng. Struct. 2021, 245, 112921. [Google Scholar] [CrossRef]
- Tamataki, K.; Ito, T.; Fujino, Y.; Yoshitake, I. Development of an Ultra-High-Performance Fibre-Reinforced Concrete (UHPFRC) Manufacturable at Ambient Temperature. Buildings 2022, 12, 740. [Google Scholar] [CrossRef]
- Lampropoulos, A.P.; Paschalis, S.A.; Tsioulou, O.T.; Dritsos, S.E. Strengthening of reinforced concrete beams using ultra high performance fibre reinforced concrete (UHPFRC). Eng. Struct. 2016, 106, 370–384. [Google Scholar] [CrossRef]
- Zhu, Y.; Zhang, Y.; Hussein, H.H.; Chen, G. Flexural strengthening of reinforced concrete beams or slabs using ultra-high performance concrete (UHPC): A state of the art review. Eng. Struct. 2020, 205, 110035. [Google Scholar] [CrossRef]
- Fang, Z.; Fang, S.; Liu, F. Experimental and Numerical Study on the Shear Performance of Short Stud Shear Connectors in Steel-UHPC Composite Beams. Buildings 2022, 12, 418. [Google Scholar] [CrossRef]
- Zhou, M.; Lu, W.; Song, J.; Lee, G.C. Application of Ultra-High Performance Concrete in bridge engineering. Constr. Build. Mater. 2018, 186, 1256–1267. [Google Scholar] [CrossRef]
- Bajaber, M.A.; Hakeem, I.Y. UHPC evolution, development, and utilization in construction: A review. J. Mater. Res. Technol. 2021, 10, 1058–1074. [Google Scholar] [CrossRef]
- Yuan, H.; Zhenggeng, Z.; Naito, C.J.; Weijian, Y. Tensile behavior of half grouted sleeve connections: Experimental study and analytical modeling. Constr. Build. Mater. 2017, 152, 96–104. [Google Scholar] [CrossRef]
- Jiang, D.; Gu, X. The test analysis and comparison of rebar contact lapping and non contact lapping. Shan. Arch. 2014, 40, 26–27. (In Chinese) [Google Scholar] [CrossRef]
- Zhang, Z.-Y.; Ding, R.; Nie, X.; Fan, J.-S. Seismic performance of a novel interior precast concrete beam-column joint using ultra-high performance concrete. Eng. Struct. 2020, 222, 111145. [Google Scholar] [CrossRef]
- Marchand, P.; Baby, F.; Khadour, A.; Battesti, T.; Rivillon, P.; Quiertant, M.; Nguyen, H.-H.; Généreux, G.; Deveaud, J.-P.; Simon, A.; et al. Bond behaviour of reinforcing bars in UHPFRC. Mater. Struct. 2016, 49, 1979–1995. [Google Scholar] [CrossRef]
- Alkaysi, M.; El-Tawil, S. Factors affecting bond development between Ultra High Performance Concrete (UHPC) and steel bar reinforcement. Constr. Build. Mater. 2017, 144, 412–422. [Google Scholar] [CrossRef]
- Yoo, D.-Y.; Shin, H.-O. Bond performance of steel rebar embedded in 80–180 MPa ultra-high-strength concrete. Cem. Concr. Compos. 2018, 93, 206–217. [Google Scholar] [CrossRef]
- Hu, A.; Liang, X.; Shi, Q. Bond Characteristics between High-Strength Bars and Ultrahigh-Performance Concrete. J. Mater. Civ. Eng. 2020, 32, 04019323. [Google Scholar] [CrossRef]
- Khaksefidi, S.; Ghalehnovi, M.; de Brito, J. Bond behaviour of high-strength steel rebars in normal (NSC) and ultra-high performance concrete (UHPC). J. Build. Eng. 2021, 33, 101592. [Google Scholar] [CrossRef]
- Liang, R.; Huang, Y.; Xu, Z. Experimental and Analytical Investigation of Bond Behavior of Deformed Steel Bar and Ultra-High Performance Concrete. Buildings 2022, 12, 460. [Google Scholar] [CrossRef]
- Lagier, F.; Massicotte, B.; Charron, J.-P. Experimental investigation of bond stress distribution and bond strength in unconfined UHPFRC lap splices under direct tension. Cem. Concr. Compos. 2016, 74, 26–38. [Google Scholar] [CrossRef]
- Fang, Z.; Chen, X.; Zhang, M.; Shan, R. Experimental study on performance of lap-spliced ribbed steel bars in reactive powder concrete. China Civ. Eng. J. 2019, 52, 20–28, 49. (In Chinese) [Google Scholar] [CrossRef]
- Ma, F.; Deng, M.; Fan, H.; Yang, Y.; Sun, H. Study on the lap-splice behavior of post-yield deformed steel bars in ultra high performance concrete. Constr. Build. Mater. 2020, 262, 120611. [Google Scholar] [CrossRef]
- Dagenais, M.-A.; Massicotte, B. Tension Lap Splices Strengthened with Ultrahigh-Performance Fiber-Reinforced Concrete. J. Mater. Civ. Eng. 2015, 27, 04014206. [Google Scholar] [CrossRef]
- Dagenais, M.-A.; Massicotte, B. Cyclic Behavior of Lap Splices Strengthened with Ultrahigh Performance Fiber-Reinforced Concrete. J. Struct. Eng. 2017, 143, 04016163. [Google Scholar] [CrossRef]
- Kim, S.; Lee, J.; Joh, C.; Kwahk, I. Flexural Bond Behavior of Rebar in Ultra-High Performance Concrete Beams Considering Lap-Splice Length and Cover Depth. Engineering 2016, 8, 116–129. [Google Scholar] [CrossRef]
- Al-Quraishi, H.; Al-Farttoosi, M.; AbdulKhudhur, R. Tension Lap Splice Length of Reinforcing Bars Embedded in Reactive Powder Concrete (RPC). Structures 2019, 19, 362–368. [Google Scholar] [CrossRef]
- Li, H.; Guo, X.; Duan, J. Numerical Simulation of Steel-Reinforced Reactive Powder Concrete Beam Based on Bond-Slip. Materials 2021, 14, 4176. [Google Scholar] [CrossRef]
- Karimipour, A.; de Brito, J.; Gencel, O. Influence of bond-slip on the flexural performance and ductility of steel fibres-reinforced RC beams with lap-spliced bars: Experimental and finite element analysis. Eng. Struct. 2021, 249, 113362. [Google Scholar] [CrossRef]
- Liang, R. Experimental Study on bond Performance of Lap-Spliced Ultra-High Performance Concrete Beam; College of Civil Engineering, Hunan University: Changsha, China, 2021. (In Chinese) [Google Scholar]
- Nie, J.; Wang, Y. Comparison study of constitutive model of concrete in ABAQUS for static analysis of structures. Eng. Mech. 2013, 30, 59–67+82. (In Chinese) [Google Scholar]
- Shan, B. Test and Study on Basic Mechanical Properties of Reactive Powder Concrete. Master’s Thesis, Hunan University, Changsha, China, 2002. (In Chinese). [Google Scholar]
- CECS 2021; Technical Specification for Ultra-High Performance Concrete Structures. China Engineering Construction Standardization Association: Beijing, China, 2021. (In Chinese)
- Yang, Z. Experimental Study on Bond Proporties between Steel Bar and Reactive Powder Concrete. Master’s Thesis, Beijing Jiaotong University, Beijing, China, 2006. (In Chinese). [Google Scholar]
- Xiao, Y.; Chen, Z.; Zhou, J.; Leng, Y.; Xia, R. Concrete plastic-damage factor for finite element analysis: Concept, simulation, and experiment. Adv. Mech. Eng. 2017, 9, 1687814017719642. [Google Scholar] [CrossRef]
- Lubliner, J.; Oliver, J.; Oller, S.; Oñate, E. A plastic-damage model for concrete. Int. J. Solids Struct. 1989, 25, 299–326. [Google Scholar] [CrossRef]
- Lee, J.; Fenves Gregory, L. Plastic-Damage Model for Cyclic Loading of Concrete Structures. J. Eng. Mech. 1998, 124, 892–900. [Google Scholar] [CrossRef]
- Singh, M.; Sheikh, A.H.; Mohamed Ali, M.S.; Visintin, P.; Griffith, M.C. Experimental and numerical study of the flexural behaviour of ultra-high performance fibre reinforced concrete beams. Constr. Build. Mater. 2017, 138, 12–25. [Google Scholar] [CrossRef]
- Roy, M.; Hollmann, C.; Wille, K. Influence of volume fraction and orientation of fibers on the pullout behavior of reinforcement bar embedded in ultra high performance concrete. Constr. Build. Mater. 2017, 146, 582–593. [Google Scholar] [CrossRef]
- Sturm, A.B.; Visintin, P. Local bond slip behavior of steel reinforcing bars embedded in ultra high performance fibre reinforced concrete. Struct. Concr. 2019, 20, 108–122. [Google Scholar] [CrossRef]
- Ma, F.; Deng, M.; Sun, H.; Ye, W. Bond behavior of deformed steel bars lap-splice in ultra high performance concrete. Acta Mater. Compos. Sin. 2021, 38, 3912–3924. (In Chinese) [Google Scholar] [CrossRef]
- Bae, B.-I.; Choi, H.-K. Experimental Study on the Flexural Behavior of Lap-Spliced Ultra-High-Performance Fiber-Reinforced Concrete Beams. Polymers 2022, 14, 2138. [Google Scholar] [CrossRef]


| Test Variable | Specimen Abbreviation | fcu (MPa) | ft (MPa) | d (mm) | Vf (%) | c (mm) | ls (mm) | ρst (%) |
|---|---|---|---|---|---|---|---|---|
| UA-S2C1-L10-T0 | UA | 98.34 | 6.84 | 16 | 2 | 16 | 160 | 0 |
| UB-S2C1-L10-T0 | UB | 109.64 | 7.31 | 16 | 2 | 16 | 160 | 0 |
| UC-S2C1-L10-T0 | UC | 116.10 | 8.23 | 16 | 2 | 16 | 160 | 0 |
| UD-S2C1-L10-T0 | UD | 139.82 | 9.46 | 16 | 2 | 16 | 160 | 0 |
| UD-S1C1-L10-T0 | S1 | 125.18 | 8.46 | 16 | 1 | 16 | 160 | 0 |
| UD-S3C1-L10-T0 | S3 | 144.97 | 9.76 | 16 | 3 | 16 | 160 | 0 |
| UD-S4C1-L10-T0 | S4 | 147.98 | 10.11 | 16 | 4 | 16 | 160 | 0 |
| UD-S2C1.5-L10-T0 | C1.5 | 140.06 | 9.69 | 16 | 2 | 24 | 160 | 0 |
| UD-S2C2-L10-T0 | C2 | 138.61 | 9.15 | 16 | 2 | 32 | 160 | 0 |
| UD-S2C1-L6-T0 | L6 | 136.12 | 9.42 | 16 | 2 | 16 | 96 | 0 |
| UD-S2C1-L8-T0 | L8 | 140.42 | 9.12 | 16 | 2 | 16 | 128 | 0 |
| UD-S2C1-L12-T0 | L12 | 138.91 | 9.44 | 16 | 2 | 16 | 192 | 0 |
| UD-S2C1-L15-T0 | L15 | 137.54 | 9.07 | 16 | 2 | 16 | 240 | 0 |
| UD-S2C1-L10-T2 | T2 | 137.78 | 9.19 | 16 | 2 | 16 | 160 | 0.011 |
| UD-S2C1-L10-T3 | T3 | 141.15 | 9.52 | 16 | 2 | 16 | 160 | 0.022 |
| UD-S2C1-L10-T4 | T4 | 138.87 | 9.39 | 16 | 2 | 16 | 160 | 0.035 |
| φ | e0 | fb0/fc0 | K | μ |
|---|---|---|---|---|
| 30° | 0.1 | 1.16 | 0.6667 | 0.0001 |
| Steel Bar Grade | Steel Bar Diameter (mm) | Yield Strength (MPa) | Ultimate Strength (MPa) |
|---|---|---|---|
| HRB400 | 6 | 483 | 617 |
| 10 | 478 | 613 | |
| HRB600 | 16 | 680 | 861 |
| Author | Equation |
|---|---|
| Alkaysi [24] | |
| Roy [47] | |
| Sturm [48] | |
| Marchand [23] | |
| Ma [49] | |
| Fang [30] |
| Mesh Type | Mesh 1 | Mesh 2 | Mesh 3 |
|---|---|---|---|
| Mesh size of lap segment (mm) | 10 × 18 × 18 | 10 × 15 × 15 | 10 × 12 × 12 |
| Mesh size of non-lap segment (mm) | 18 × 18 × 18 | 15 × 15 × 15 | 12 × 12 × 12 |
| Total number of solid elements | 21,302 | 30,356 | 52,032 |
| Total number of truss elements | 1074 | 1294 | 1612 |
| Computation time (s) | 3108 | 3624 | 10,403 |
| Peak load (kN) | 418.43 | 416.34 | 422.30 |
| Displacement at the peak load (mm) | 3.56 | 3.58 | 3.68 |
| Bond strength (MPa) | 13.42 | 13.69 | 13.65 |
| Specimen | Fu (kN) | τu (MPa) | ||||
|---|---|---|---|---|---|---|
| FEA | EXP | Δ (%) | FEA | EXP | Δ (%) | |
| UA-S2C1-L10-T0 | 357.14 | 389 | 8.19 | 10.44 | 10.62 | 1.69 |
| UB-S2C1-L10-T0 | 381.90 | 402 | 5.00 | 11.44 | 11.74 | 2.56 |
| UC-S2C1-L10-T0 | 407.11 | 405 | 0.52 | 12.38 | 12.80 | 3.28 |
| UD-S2C1-L10-T0 | 416.34 | 410 | 1.55 | 13.69 | 14.18 | 3.46 |
| UD-S1C1-L10-T0 | 272.60 | 245 | 11.27 | 13.15 | 11.75 | 11.91 |
| UD-S3C1-L10-T0 | 449.24 | 441 | 1.87 | 13.92 | 15.65 | 11.05 |
| UD-S4C1-L10-T0 | 464.13 | 451 | 2.91 | 14.01 | 14.30 | 2.03 |
| UD-S2C1.5-L10-T0 | 408.66 | 407 | 0.41 | 14.72 | 15.78 | 6.72 |
| UD-S2C2-L10-T0 | 425.89 | 402 | 5.94 | 15.60 | 17.00 | 8.24 |
| UD-S2C1-L6-T0 | 333.10 | 305 | 9.21 | 13.76 | 15.36 | 10.42 |
| UD-S2C1-L8-T0 | 349.32 | 345 | 1.25 | 13.25 | 13.28 | 0.23 |
| UD-S2C1-L12-T0 | 428.47 | 430 | 0.36 | 13.21 | 13.62 | 3.01 |
| UD-S2C1-L15-T0 | 486.29 | 463 | 5.03 | 11.81 | 11.33 | 4.24 |
| UD-S2C1-L10-T2 | 429.68 | 412 | 4.29 | 14.02 | 16.62 | 15.64 |
| UD-S2C1-L10-T3 | 431.01 | 416 | 3.61 | 14.50 | 16.85 | 13.95 |
| UD-S2C1-L10-T4 | 435.18 | 425 | 2.40 | 14.97 | 16.50 | 9.27 |
| 120-5db-V1.5 | 219.78 | 205 | 7.21 | 25.38 | 26.50 | 4.23 |
| 120-10db-V1.5 | 276.09 | 270 | 2.26 | 12.65 | 13.25 | 4.53 |
| 180-10db-V1 | 243.51 | 242 | 0.62 | 12.83 | 13.25 | 3.17 |
| 180-10db-V2 | 323.36 | 319 | 1.37 | 12.94 | 13.25 | 2.34 |
Publisher’s Note: MDPI stays neutral with regard to jurisdictional claims in published maps and institutional affiliations. |
© 2022 by the authors. Licensee MDPI, Basel, Switzerland. This article is an open access article distributed under the terms and conditions of the Creative Commons Attribution (CC BY) license (https://creativecommons.org/licenses/by/4.0/).
Share and Cite
Xu, Z.; Huang, Y.; Liang, R. Numerical Simulation of Lap-Spliced Ultra-High-Performance Concrete Beam Based on Bond–Slip. Buildings 2022, 12, 1257. https://doi.org/10.3390/buildings12081257
Xu Z, Huang Y, Liang R. Numerical Simulation of Lap-Spliced Ultra-High-Performance Concrete Beam Based on Bond–Slip. Buildings. 2022; 12(8):1257. https://doi.org/10.3390/buildings12081257
Chicago/Turabian StyleXu, Zhenming, Yuan Huang, and Rui Liang. 2022. "Numerical Simulation of Lap-Spliced Ultra-High-Performance Concrete Beam Based on Bond–Slip" Buildings 12, no. 8: 1257. https://doi.org/10.3390/buildings12081257
APA StyleXu, Z., Huang, Y., & Liang, R. (2022). Numerical Simulation of Lap-Spliced Ultra-High-Performance Concrete Beam Based on Bond–Slip. Buildings, 12(8), 1257. https://doi.org/10.3390/buildings12081257