
Uncertainties of Global Historical Land Use Datasets in Pasture Reconstruction for the Tibetan Plateau


1
Department of Land Resource Management, School of Public Administration, China University of Geosciences, Wuhan 430074, China
2
School of Geography Science and Geomatics Engineering, Suzhou University of Science and Technology, Suzhou 215009, China
*
Author to whom correspondence should be addressed.
Remote Sens. 2022, 14(15), 3777; https://doi.org/10.3390/rs14153777
Submission received: 4 July 2022
/
Revised: 1 August 2022
/
Accepted: 4 August 2022
/
Published: 6 August 2022
(This article belongs to the Special Issue Advances in Remote Sensing for Exploring Ancient History)
Abstract
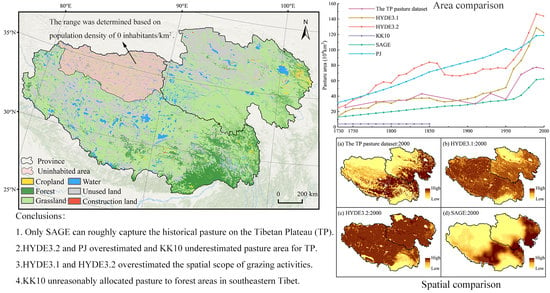
:Global historical land use datasets have been widely used in global or regional environmental change studies. Historical pasture data are essential components of these spatially explicit global datasets, and their uncertainties have not been well evaluated. Using the livestock-based historical pasture dataset for the Tibetan Plateau (TP), we evaluated the uncertainties of these representative global historical land use datasets in pasture reconstruction for the TP over the past 300 years in terms of pasture area estimation and spatial pattern mapping. We found that only the Sustainability and the Global Environment (SAGE) dataset can roughly reflect the temporal and spatial characteristics of historical pasture changes on the TP. The History Database of the Global Environment (HYDE) version 3.2 and the Pongratz Julia (PJ) datasets overestimated pasture area for the TP dramatically, with a maximum area ratio of about 221% and 291%, respectively, and the Kaplan and Krumhardt 2010 (KK10) dataset underestimated pasture area for the TP dramatically, with a minimum area ratio of only 9%. As for the spatial pattern, all these global datasets overestimated the spatial scope of grazing activities obviously. The KK10 dataset unreasonably allocated pasture to forest areas in southeastern Tibet because only climate and soil factors were considered in assessing land suitability for grazing. Using population to estimate pasture area and only using natural factors to allocate pasture area into grids is unsuitable for the TP historical pasture reconstruction. In the future, more information directly related to grazing activities, e.g., the number of livestock and its spatial distribution, and social-cultural factors, including technology and diet, should be used for area estimation and spatial pattern mapping to improve the accuracy of pasture data in these global datasets.
1. Introduction
Over the past thousands of years, extensive human use of land has transformed 75–95% of the Earth’s ice-free land area [1,2], which caused extensive global and regional environmental change, including climatic warming [3], land degradation [4], the reduction of the delivery ability of ecosystem services [5], and the significant loss of biodiversity [6,7]. As a result, many researchers and international organizations, i.e., the Past Global Changes project (https://pastglobalchanges.org/) (accessed on 30 July 2022) and the ArchaeoGLOBE project [8], pay much attention to land use and land cover change (LUCC) over a long period [9,10,11].
With the advent of the remote sensing era, numerous scholars have adopted different approaches to reconstruct historical LUCC datasets in a spatially explicit way for quantitative simulation of environmental consequences of land use. There are several noteworthy datasets, including the History Database of the Global Environment (hereafter HYDE) dataset [12,13,14], the Sustainability and the Global Environment (hereafter SAGE) dataset [15,16], the Pongratz Julia (hereafter PJ) dataset [17], and the Kaplan and Krumhardt (hereafter KK10) dataset [18,19]. They have been widely used to study the environmental consequences of long-term land use change, including climate change simulation and the calculation of carbon emissions due to anthropogenic land cover change at both the global and regional scales [17,20,21,22]. However, the simulation results of climatic and ecological effects based on them have significant differences. For example, the estimated carbon emissions from the KK10 dataset were over 120% higher than the HYDE dataset (version 3.1 [13]) [19,23], which confuses our understanding of the role of land use change in global warming and biodiversity loss. Therefore, it is necessary to evaluate these global datasets, identify their uncertainties in data sources, methods, and results and point out the directions for improvement.
Some studies have evaluated the uncertainties of these global datasets using independent regional reconstructions. For example, Klein Goldewijk and Verburg [24] evaluated the uncertainty of the HYDE dataset from five aspects: context and framing, input data on population and land use, model parameters and assumptions, model structure, and model technical details. Meiyappan and Jain [25] compared global cropland and pasture statistics of the SAGE and HYDE datasets and found large differences in the estimated areas, with the HYDE cropland (pasture) estimates being 8% (26%) higher than SAGE estimates, and the main divergence is in China. Inspired by these evaluations, Zhang et al. [26] used historical evidence of changes in cropland cover in Germany over the past millennium to evaluate the uncertainties of cropland reconstructions in HYDE datasets (versions 3.1 and 3.2). They found that although the cropland area of Germany in HYDE 3.2 was only −13–15% lower than that of the document-based regional reconstruction, the spatial patterns of cropland in HYDE3.2 had significant uncertainties, especially in regions of wetlands and river plains. Moreover, Kaplan et al. [27] used an independent, pollen-based land cover reconstruction over the Holocene to evaluate the reliability of the KK10 and HYDE3.1 datasets in north-western Europe. They found that both KK10 and HYDE3.1 cannot accurately reflect the history of land use in north-western Europe, but KK10 is more in line with pollen-based vegetation reconstructions than HYDE3.1. In addition, based on reconstructions using Chinese unique historical documents, some scholars have evaluated the reliability of these global datasets for the traditional agricultural region [28] and northeast [29] of China. Specifically, Fang et al. [30] constructed a framework to assess the uncertainties of these global datasets, including accuracy assessment based on regional reconstructions, rationality assessment based on historical facts and expertise, and likelihood assessment based on the consistency of multiple datasets. He et al. [28] and Zhao et al. [31] evaluated the uncertainties of China’s cropland reconstructions in these global datasets using the Chinese historical cropland dataset over the past millennium. Their assessments show that the relative difference ratio of cropland area between the regional reconstructions for China and HYDE3.2 (PJ) is −35% (112%). Besides, Li et al. [32] evaluated the accuracy of cropland and pasture reconstruction for the Tibetan Plateau (TP) in these global datasets using available regional cropland reconstruction and livestock density data and found that these global datasets cannot accurately reflect the actual land use situation of the region.
The above studies mainly focused on the assessment of cropland reconstruction. Only Li et al. [32] used modern livestock density data to evaluate the rationality of the spatial distribution of pasture data in these global datasets in the last 20 years, which is a good start for uncertainty assessment of pasture modeling but is insufficient. Over the past thousands of years, grazing has been one of human beings’ leading land use practices, and pasture areas now cover about 22–26% of the Earth’s ice-free land [20,33,34]. Its long-term impact on global and regional climate warming, the degradation of ecosystem services, and the loss of biodiversity cannot be ignored [3]. The World Food and Agriculture Organization (FAO) published a report on the environmental impact of livestock agriculture and suggested that global livestock contributed 18% of the total anthropogenic greenhouse gas emissions [35]. Overgrazing activities have led to severe grassland degradation as well as the loss of soil/water retention services and the reduction of biodiversity in the TP over the past several decades [36,37,38]. However, the authors of HYDE said that pasture reconstruction is more uncertain than cropland reconstruction in their scenarios due to data scarcity [24]. This uncertainty seriously hinders our understanding of the climatic and environmental consequences of long-term grazing activities.
In this study, therefore, based on a livestock-based historical pasture dataset (hereafter the TP pasture dataset) and some qualitative grazing-related historical records, we evaluated the uncertainties of these representative global datasets, including HYDE (versions 3.1 and 3.2), KK10, PJ, and SAGE, in pasture reconstruction for the TP from two aspects, i.e., area estimation and spatial pattern mapping. Then, we discussed the reasons for these uncertainties, and some suggestions for improvement were provided subsequently.
2. Materials and Methods
2.1. Study Area
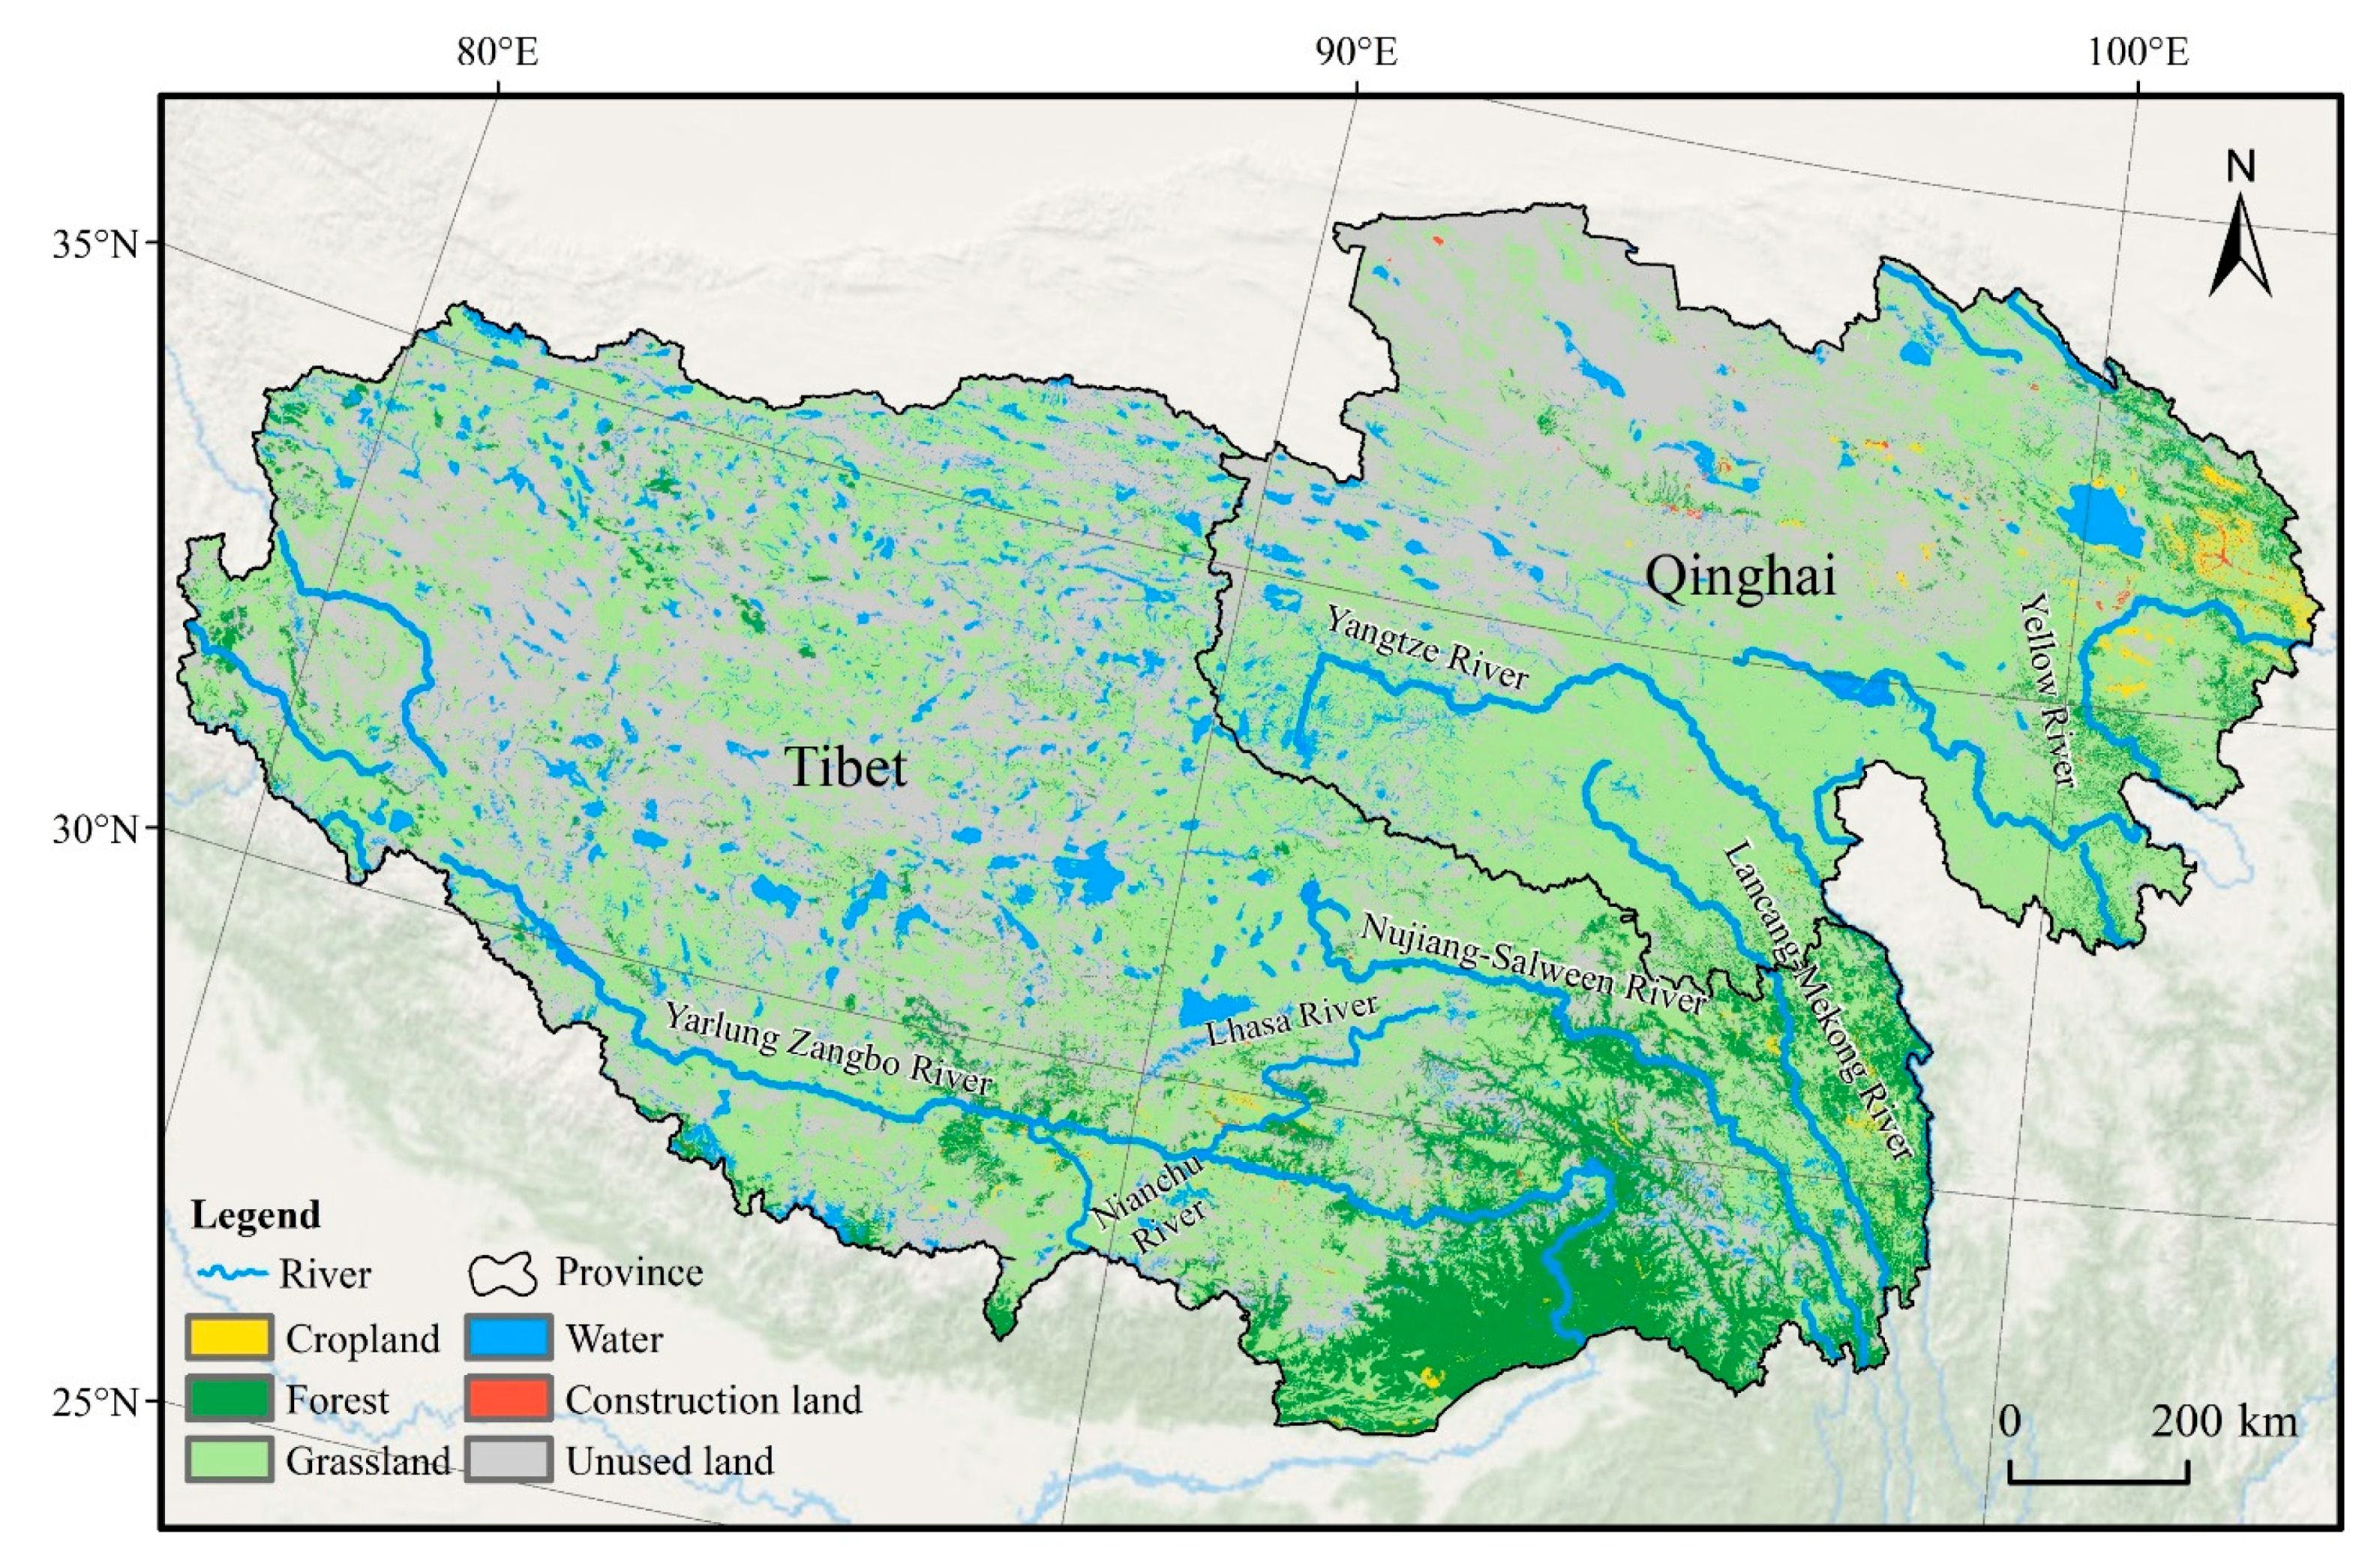
As the “Roof of the World” and “Asia Water Tower” [39], the TP is a vast, high plateau in Central Asia. It lies between the Himalayan range to the south and the Kunlun Range to the north. It covers several countries, including China, Nepal, India, and Pakistan. In China, it includes the Tibet Autonomous Region (hereafter Tibet), Qinghai Province, Sichuan Province, Gansu Province, Yunnan Province, and Xinjiang Autonomous Region, with a total area of approximately 2.5 million km2 [40]. The area of Tibet and Qinghai is 1.23 and 0.72 million km2, respectively. They are the central bodies of the plateau (Figure 1). In this study, the TP just refers to Tibet and Qinghai, considering the spatial coverage of the historical TP pasture dataset.
The natural environment here is characterized by high altitude, low temperature, and low precipitation. It has an average elevation of over 4500 m. It is the highest and largest plateau in the world. Its annual average temperature ranges from −5.1 to 12.1 °C. Its annual average precipitation ranges from 50 to 1000 mm with a southeast-to-northwest gradient. More than half of the plateau is covered with natural grassland ecosystems [41]. The plateau is rich in biodiversity and provides a large number of ecosystem services for the residents of the plateau and its surrounding areas, including water and soil retention, carbon sequestration, and sandstorm prevention. As the source of several major rivers, the plateau supplies water to nearly two billion people.
The number of inhabitants in Qinghai and Tibet was 9.57 million in 2020 with a population density of 5.99 inhabitants/km2 [42]. As a typical pastoral area in China, the region is dominated by grazing activities with centuries of grazing history [43], but the intensity of human activity on the TP is low overall [44,45]. It is facing severe challenges, including glacier melt and land deterioration due to global warming and human activities.
2.2. Global Historical Land Use Datasets
With the development of remote sensing technology and advanced geographical information science, recent years have seen an increasing interest in developing spatially explicit datasets of land use covering at least the entire industrial period. Most noteworthy global scale historical land use datasets include HYDE, KK10, SAGE, and PJ. Historical pasture data are essential components of these global datasets. The general pasture reconstruction framework of them was to estimate the past pasture area first, then create a spatial model incorporating contemporary remote sensing data to allocate the historical statistical inventories of pasture land area into grids with a resolution ranging from 0.5° to 5′. Due to different understandings of the global or regional grazing history, the authors of each dataset have created different models for pasture area estimation and spatial pattern mapping. Before uncertainty evaluation, we briefly introduce these high-resolution global datasets as follows (Table 1).
2.2.1. The HYDE Dataset
Before 1960, pasture area was estimated based on historical population and per capita pasture area data. After 1960, the pasture area was cited from FAO. Using satellite-based spatial patterns of grazing land which were cited from the high-resolution ESA Land Cover consortium maps for 2010 and other spatially explicit data, including population, climate, soil, and biome maps, the authors allocated historical pasture areas into grids with a resolution of 5 arc-minutes. HYDE2.0 only covered the past 300 years [12], while HYDE3.1 [13] extended the period from 10000BC to AD2000. The latest version, HYDE3.2 [14], reclassified grazing land into a more intensively used pasture and less intensively used rangeland.
2.2.2. The KK10 Dataset
The KK10 dataset used population and land use area per capita to estimate the historical land use (cropland + pasture) area. Land use area per capita was assumed to decrease gradually as agricultural technology advances. Then, based on the land suitability for agriculture and pasture, the estimated land use area was allocated to grids [19]. Note that KK10 does not separate cropland and pasture, but the cropland distribution is small in the TP (Figure 1), only accounting for 0.66% [43]. Gazing is the primary land use activity. Therefore, in this study, the land use data in KK10 was considered as the pasture for evaluation.
2.2.3. The SAGE Dataset
The SAGE pasture area was estimated by linear backtracking from historical population and inventory data [46]. For spatial reconstruction, the authors assumed that the spatial pattern of pasture in the past was consistent with the distribution of modern pasture which was derived from two different satellite-derived products (Boston University’s MODIS-derived land cover product and the GLC2000 dataset). Finally, the historical pasture area in each political region was allocated into grids with a spatial resolution of 0.5°, creating a global dataset of pasture from 1700 to 2007 [16].
2.2.4. The PJ Dataset
The PJ dataset for AD800–1992 was created based on the HYDE and SAGE datasets. For AD800–1700, the pasture area in each political region was calculated by multiplying the historical population and per capita pasture area, assuming that the per capita pasture area was steady for this period. After 1700, the pasture area data was cited from HYDE2.0 with regional revisions. The spatial pattern of the pasture was cited from the SAGE dataset, and assuming that there were no changes in spatial pattern over the past millennium. Finally, the pasture area in each political region was allocated into grid cells with a spatial resolution of 0.5° [17]. Taking into account the differences in the above-ground crops of the pasture, the authors divided the pasture into C3 and C4 pastures [47].
2.3. Historical Pasture Dataset for the Tibetan Plateau
To quantitatively evaluate the uncertainty of these global datasets for the TP, we briefly introduce the TP pasture dataset’s reconstruction process (Table 1). The FAO category “permanent pasture” is used for pasture definition. It includes all land used permanently for herbaceous forage crops, either cultivated or growing wild [48]. We first estimated the provincial pasture area of TP for AD1737–2000 based on the number of livestock and the pasture area required to feed one sheep unit. The number of livestock was directly cited from Statistical Yearbooks [49,50] and historical documents [51,52] and estimated based on historical population and the number of livestock per capita for no-record historical periods. The pasture area required to feed one sheep unit was estimated based on multiple historical records [53,54] and the grazing situation of the TP [55,56].
Then the provincial pasture area of TP for AD1737–2000 was allocated into grids with a resolution of 1 km based on the land suitability assessment model for grazing. The model includes natural and human factors, including terrain, grassland net primary productivity, and livestock distribution. The equation is as follows:
where Wsuit(i,t) is the land suitability for grazing of grid i in year t, Wdem(i,t) and Wnpp(i,t) are normalized elevation and net primary productivity of grid i, Wlivestock(i,t) is the number of livestock of grid i in year t, and it was mapped using a stepwise regression model based on previous studies [57,58]. The equation is as follows:
where logpop(i,t) is the logarithm of population density of grid i in year t, Wtemp(i) and Wndvi(i) are normalized temperature and difference vegetation index of grid i, and Wmax(t) is the maximum range of livestock distribution for year t which is determined by the overlay of multiple periods of remote sensing grassland data (https://www.resdc.cn/Default.aspx) (accessed on 22 April 2022). Because grazing activities and pasture on the TP have mainly been on natural grassland until nowadays.
In addition, historical records relating to regional animal husbandry development were also used as evidence for the rationality assessment of these global datasets. Natural disasters (e.g., famine, snowstorm), wars, and population greatly impact grazing activities. Thus, we collected natural disaster and war-related data in the TP for AD 1700–2000, and we evaluated the rationality of the changing trend of pasture areas in the global datasets based on them. The number of natural disasters and wars were sourced from relevant documents, including the Gazetteers for Xining City (西宁府志), the Gazetteers for Tibet (西藏志), and the Gazetteers for famine (灾荒志). The population data were cited from Qinghai Statistical Yearbook [49], Tibet Statistical Yearbook [50], and Chinese Population History [59].
2.4. Evaluation Methods
We evaluated the uncertainties of pasture reconstruction in the five global datasets for the TP from two aspects, including area estimation and spatial pattern mapping.
In terms of pasture area estimation, we first conducted a qualitative evaluation based on qualitative grazing-related historical records, including natural disasters, war, and population. Then, we compared the pasture area in the five global datasets with the TP pasture dataset quantitatively with the help of two indicators, i.e., annual growth rate and area ratio [60]. The equations are as follows:
where G is the annual growth rate of pasture area from years t1 to t2, V(t1) and V(t2) are the pasture area in the global dataset and the TP pasture dataset at years t1 and t2, respectively.
where Vglobe(t) is the TP pasture area in the global dataset, VTP(t) is the pasture area in the TP pasture dataset, and A is the area ratio between Vglobe(t) and VTP(t), ranging from 0 to 1. Values of A closer to 1 indicate better agreement between the pasture area in the global dataset and the TP pasture dataset.
To evaluate the uncertainties of spatial pattern mapping, we first visually compared the five global datasets with the TP pasture dataset. Then, based on the visual comparison results, we determined to carry out a quantitative comparison at the grid scale only for the SAGE dataset with an indicator of relative difference ratio [60]. The equation is as follows:
where relativediff(i,t) is the relative difference of grid i for year t between the global dataset and the TP pasture dataset. Larger relativediff(i,t) values indicate a greater difference between the spatial pattern of the global dataset and the TP pasture dataset at the grid scale. Vglobe(i,t) and VTP(i,t) are pasture fractions of grid i for year t in the global dataset and the TP pasture dataset, respectively.
As the inconsistent spatial resolution of different datasets may impact the comparison of spatial patterns, spatial resolution was unified to facilitate comparison. The spatial resolutions of HYDE (versions 3.1 and 3.2) and KK10 are 5 arc-minute (~10 km at the Equator) as well as SAGE and PJ are 0.5° (~60 km at the Equator). The grid cell size of the TP pasture dataset is 1 km. We unified the resolution of all datasets to 10 km to facilitate spatial comparison.
Considering that the reconstruction period and temporal resolution were inconsistent across datasets, we selected the period AD1700–2000 for area comparison and the years 1740, 1840, 1950, and 2000 for spatial comparison based on spatiotemporal coverage of the TP pasture dataset. Due to the KK10 dataset covering the period 8000BP–AD1850, only the KK10 dataset for AD1700–1850 was evaluated.
3. Results
3.1. The Reliability of the TP Pasture Dataset
The changing trend of pasture area we estimated for the TP over the past 300 years reflects the rise and fall of animal husbandry on the TP well. Specifically, during 1737–1840, 1910–1930, and 1949–1990, there were fewer wars and famines, the social environment of the TP was relatively stable, and animal husbandry developed well. Our estimated pasture area for the TP increased in these three periods, which is consistent with the stable development of animal husbandry. For more than half a century after 1840, Qinghai Province experienced a series of wars and natural disasters, including the Sala and Hui people’s uprising in 1860, the Taiping Rebellion during 1876–1879, and frequent droughts, which led to the decline of animal husbandry. Our estimated pasture area for the TP also declined during this period, which is in line with the actual situation of the decline of animal husbandry. After 1930, Qinghai was affected by plagues and wars, the number of herdsmen and livestock decreased, and the development of animal husbandry suffered a severe setback. This is also well reflected in our estimation. In addition, after 1990, due to the contradiction between grassland and livestock in Qinghai province became prominent, the local government began to put forward policies such as “using the productivity of grassland to determine the number of livestock” to encourage reasonable grazing, which led to the decline of the number of livestock and the area of pasture in Qinghai province during that period. This decline can also be seen in our estimation. The above evidence suggests that our estimates for the past 300 years of pasture area change trends for the Qinghai-Tibet Plateau are reasonable.
The main grassland utilization behavior on the TP is grazing. The spatial distribution of grassland utilization intensity can largely reflect the spatial pattern of pastures, although they are different terms theoretically. Grassland utilization intensity refers to the proportion of the above-ground grassland biomass actually used to the total above-ground grassland biomass in the whole year for a given area of grassland. In this study, to verify the reliability of the spatial pattern of the TP pasture dataset we reconstructed, we compared the spatial pattern of pasture for 2000 in the TP pasture dataset with the spatial distribution of grassland utilization intensity on the TP which was published in the annual report on remote sensing monitoring of the global ecological environment (https://nrscc.most.cn/) (accessed on 20 June 2022). Their spatial patterns show good consistency (Figure 2). Both the grassland utilization intensity in the TP and the spatial pattern of pasture are mainly distributed in the central and eastern parts of the plateau, largely suggesting the reliability of the spatial pattern of the pasture we mapped.
Additionally, based on extensive collecting of historical evidence of human activity, Miehe et al. [56] also revealed that grazing activities on the TP were mainly distributed in the central and eastern parts of the plateau. In addition, the TP pasture dataset shows that the pasture center of gravity has gradually moved from low to high altitude over the past 300 years, which is consistent with the findings of Zhang [55] that for hundreds of years, the grassland in the low-altitude areas of the TP have been overgrazed, and herdsmen have gradually grazed in high-altitude areas. The above comparison shows that the spatial distribution of the pasture we mapped for the TP and its evolution over the past 300 years is generally reasonable.
Therefore, in terms of area estimation and spatial pattern mapping, the TP pasture dataset we reconstructed can well reveal the temporal and spatial variation characteristics of grazing activities in the TP over the past 300 years. Thus, it can be used to assess the uncertainty of these global datasets.
3.2. Uncertainty of Pasture Area in Global Datasets
3.2.1. Qualitative Assessment Based on Historical Records
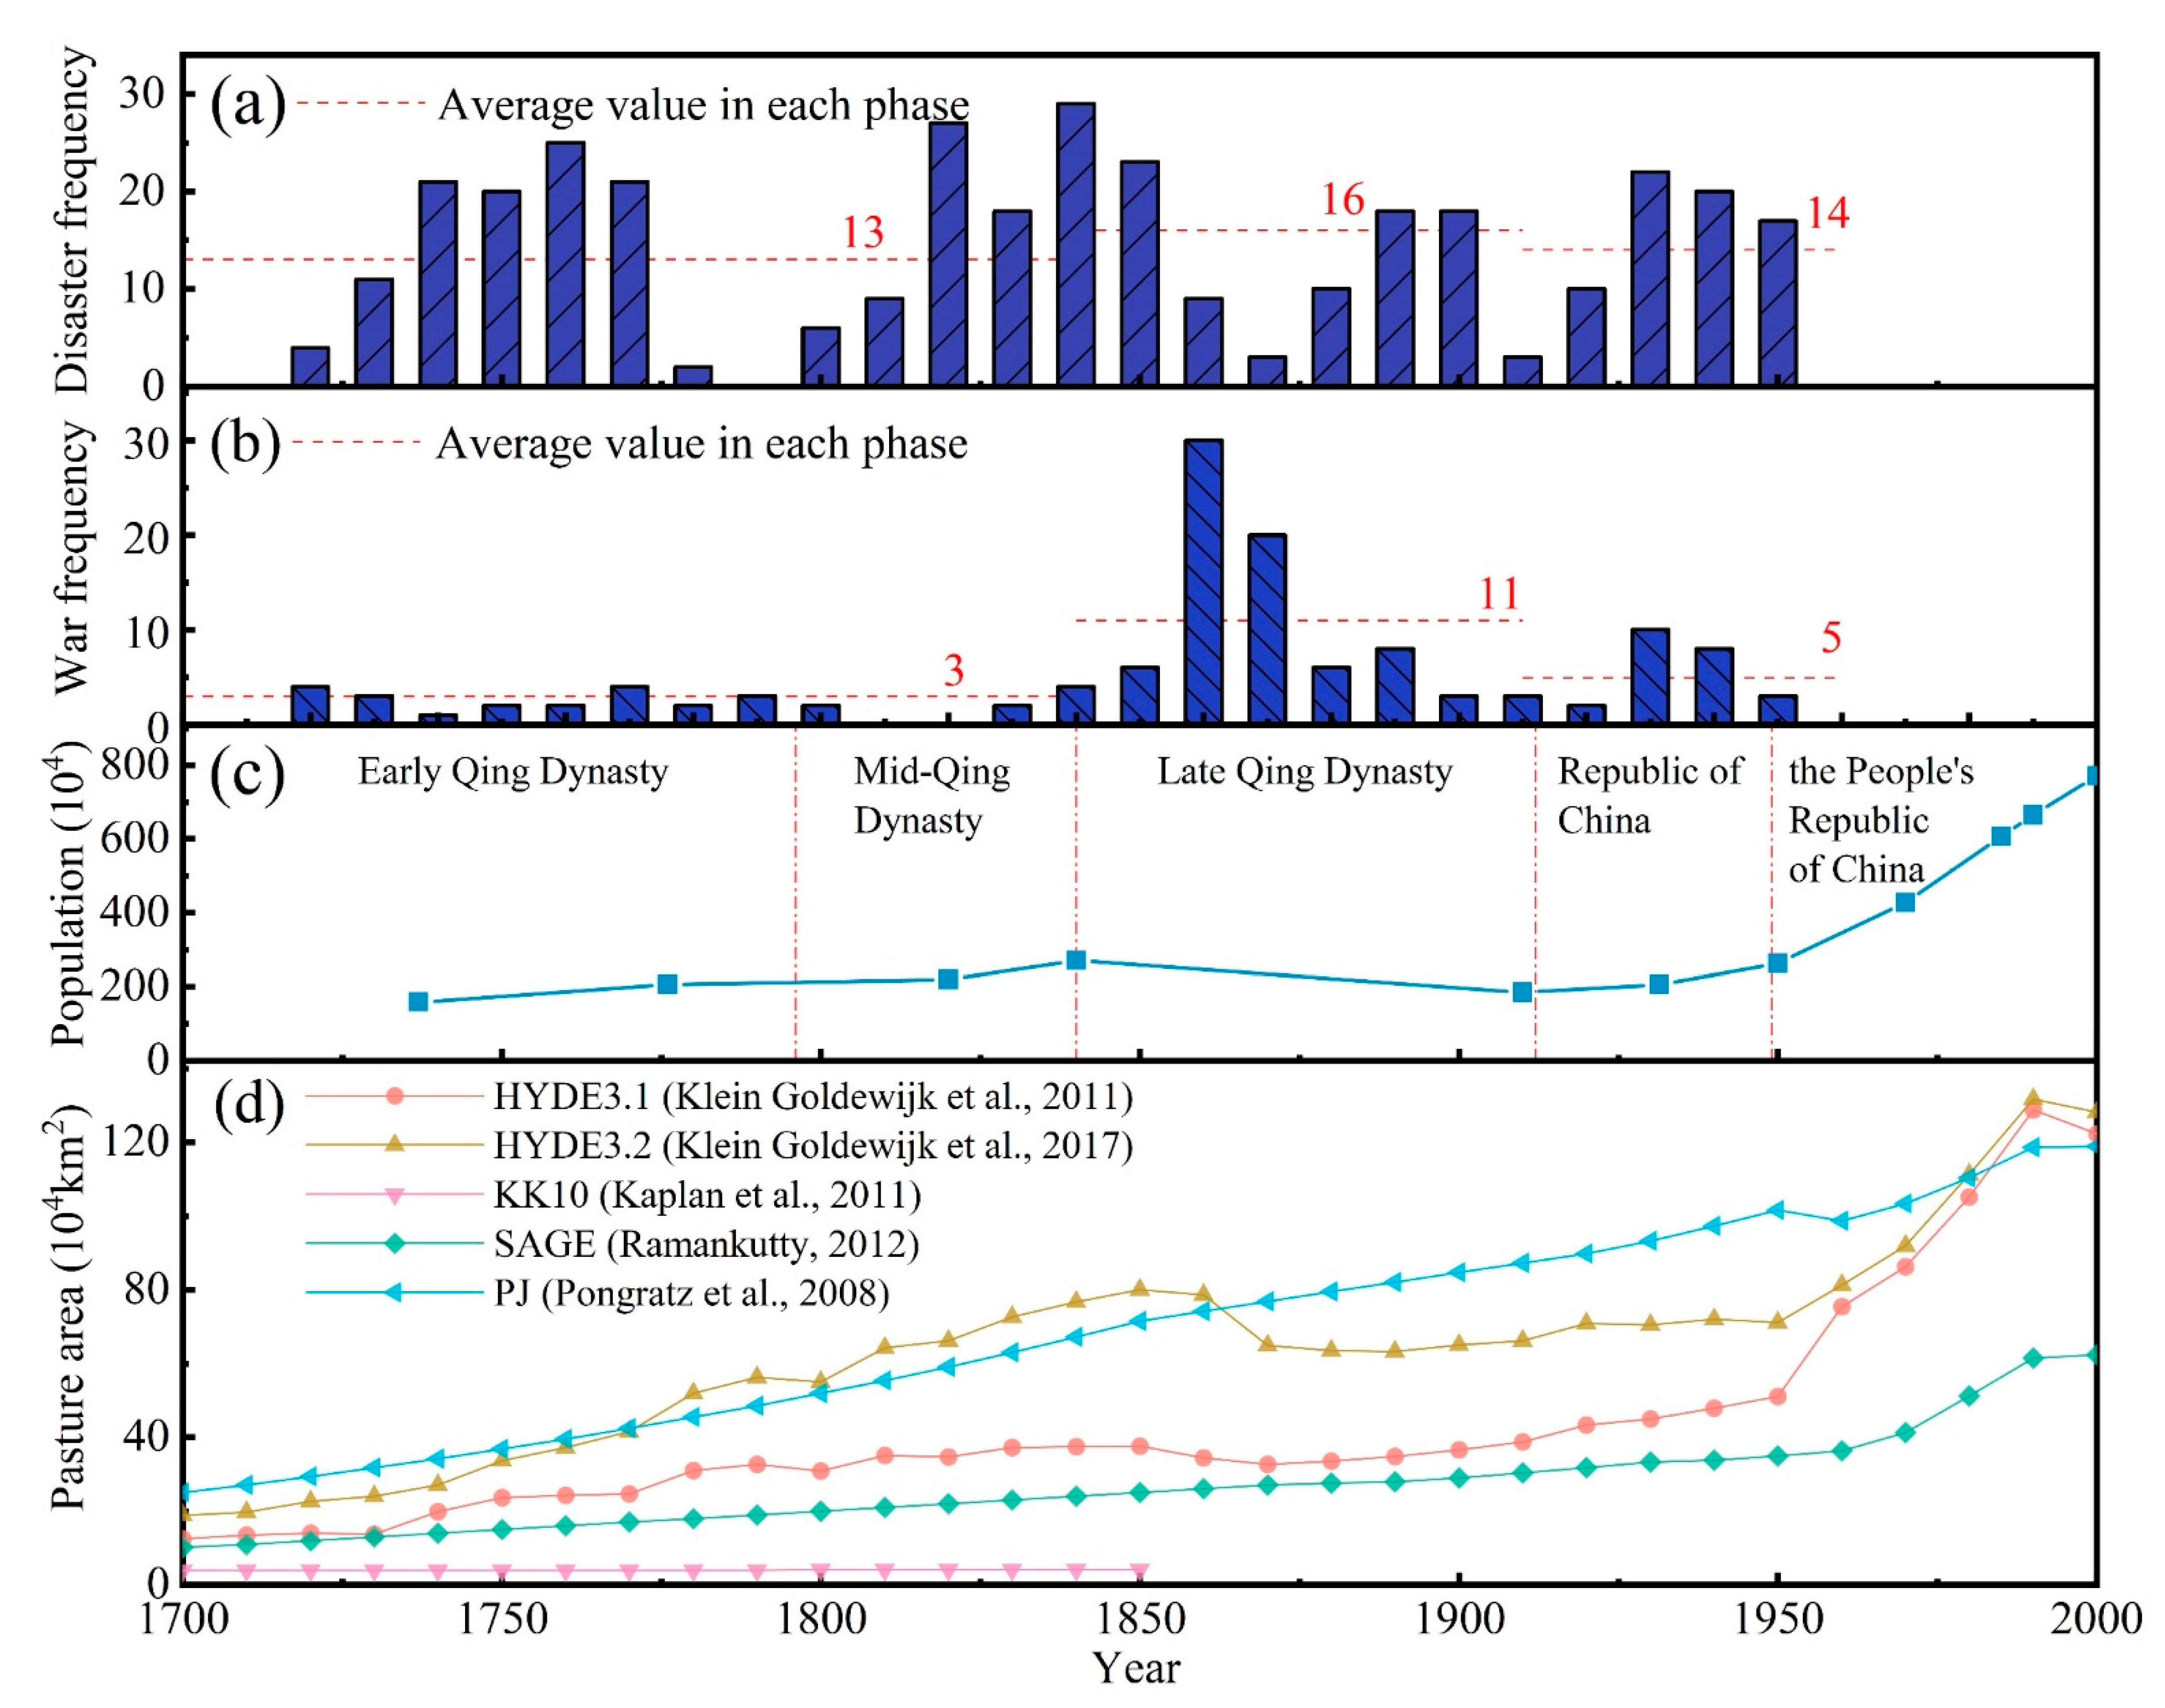
The number of historical natural disasters, wars, and population for the TP during 1700–2000 is shown in Figure 3. The high frequency of natural disasters and slow population growth characterized 1700–1840. Considering the backward animal husbandry technology in the historical period of the TP and natural conditions largely determine the development of animal husbandry. So, we speculate that the changing trend of pasture area and population during this period was close, showing a slow increase trend. Therefore, the rapid increase of TP pasture area in PJ and HYDE3.2 during this period may be inconsistent with the actual situation of grazing activities.
During 1840–1910, the frequency of natural disasters was high (Figure 3a). According to statistics, there were 110 famines in the TP and some snow disasters in Tibet. The number of wars was high, an average of 11 occurrences per year in recorded years (Figure 3b), and the population decreased too (Figure 3c). Therefore, under the influence of natural disasters and wars, the area of pasture in the TP was likely to be reduced during this period. However, the pasture area of the region in PJ, SAGE, and HYDE3.1 still shows an increasing trend during this period (Figure 3d), which is most likely unreasonable. Only the pasture area in HYDE3.2 shows a decreasing trend during this period, consistent with the historical records of natural disasters, wars, and population.
After 1910, the number of natural disasters and wars declined. The population began to increase rapidly. Animal husbandry should have been well developed in this period. Several global datasets reflect this feature well.
3.2.2. Quantitative Comparison Based on the TP Pasture Dataset
As shown in Figure 4, the pasture area in the TP pasture dataset showed a fluctuating increase trend for 1737–2000, which can be divided into three stages: the steady rise stage from 1737 to 1840, growing from 254,500 km2 to 431,100 km2, the decline stage from 1840 to 1910, with a rapid decline to 299,400 km2, and the fluctuating rapid increase stage for 1910–2000, with the fastest growth after 1949. Although the pasture area in these global datasets also showed an overall growth trend, they did not fully reflect the fluctuating trend. For example, KK10, SAGE, and PJ showed a simple linear change trend. The pasture increase trend of the HYDE dataset was close to that of the TP pasture dataset, but there are still considerable differences at various stages. Specifically, between 1840 and 1910, the average annual growth rate of the TP pasture dataset was −0.52%, while that of HYDE3.1 and HYDE3.2 were 0.05% and −0.21%, respectively.
In addition, compared with the TP pasture dataset, HYDE3.2 and PJ overestimated, and KK10 underestimated the pasture area of the plateau dramatically (Figure 4 and Table 2). Relatively speaking, the pasture area in HYDE3.1 and SAGE datasets and the TP pasture dataset were close. Specifically, the pasture area ratios between the PJ and TP pasture dataset range from 1.34 to 2.91. For KK10, it ranges from 0.09 to 0.16 (Table 2). The pasture area of the TP for the years 1990 and 2000 in HYDE3.2 was even more significant than the TP’s satellite-based grassland area, i.e., 1,277,000 km2. Although the pasture area in the HYDE3.1 and SAGE datasets were closer to the results of the TP pasture dataset for 1740–1950, the difference between them gradually increased after 1950. The pasture area ratios between the HYDE3.1 and TP pasture datasets increased from 0.99 in 1820 to 1.66 in 1990 (Table 2).
3.3. Uncertainty of Pasture’s Spatial Pattern in the Global Datasets
Based on the TP pasture dataset, we revealed the uncertainties of the global datasets in spatial reconstruction from two aspects: overall spatial comparison and grid cell comparison.
3.3.1. Comparison of Overall Spatial Pattern
The pasture area of the PJ dataset was dramatically overestimated, and the trend of linear increase over the past 300 years was clearly inconsistent with the actual situation in the TP, so no further evaluation was required. Although HYDE3.2 dramatically overestimated and KK10 underestimated the pasture area for the study area, we evaluated them further, considering that they were widely used in climatic and environmental consequence studies [61,62].
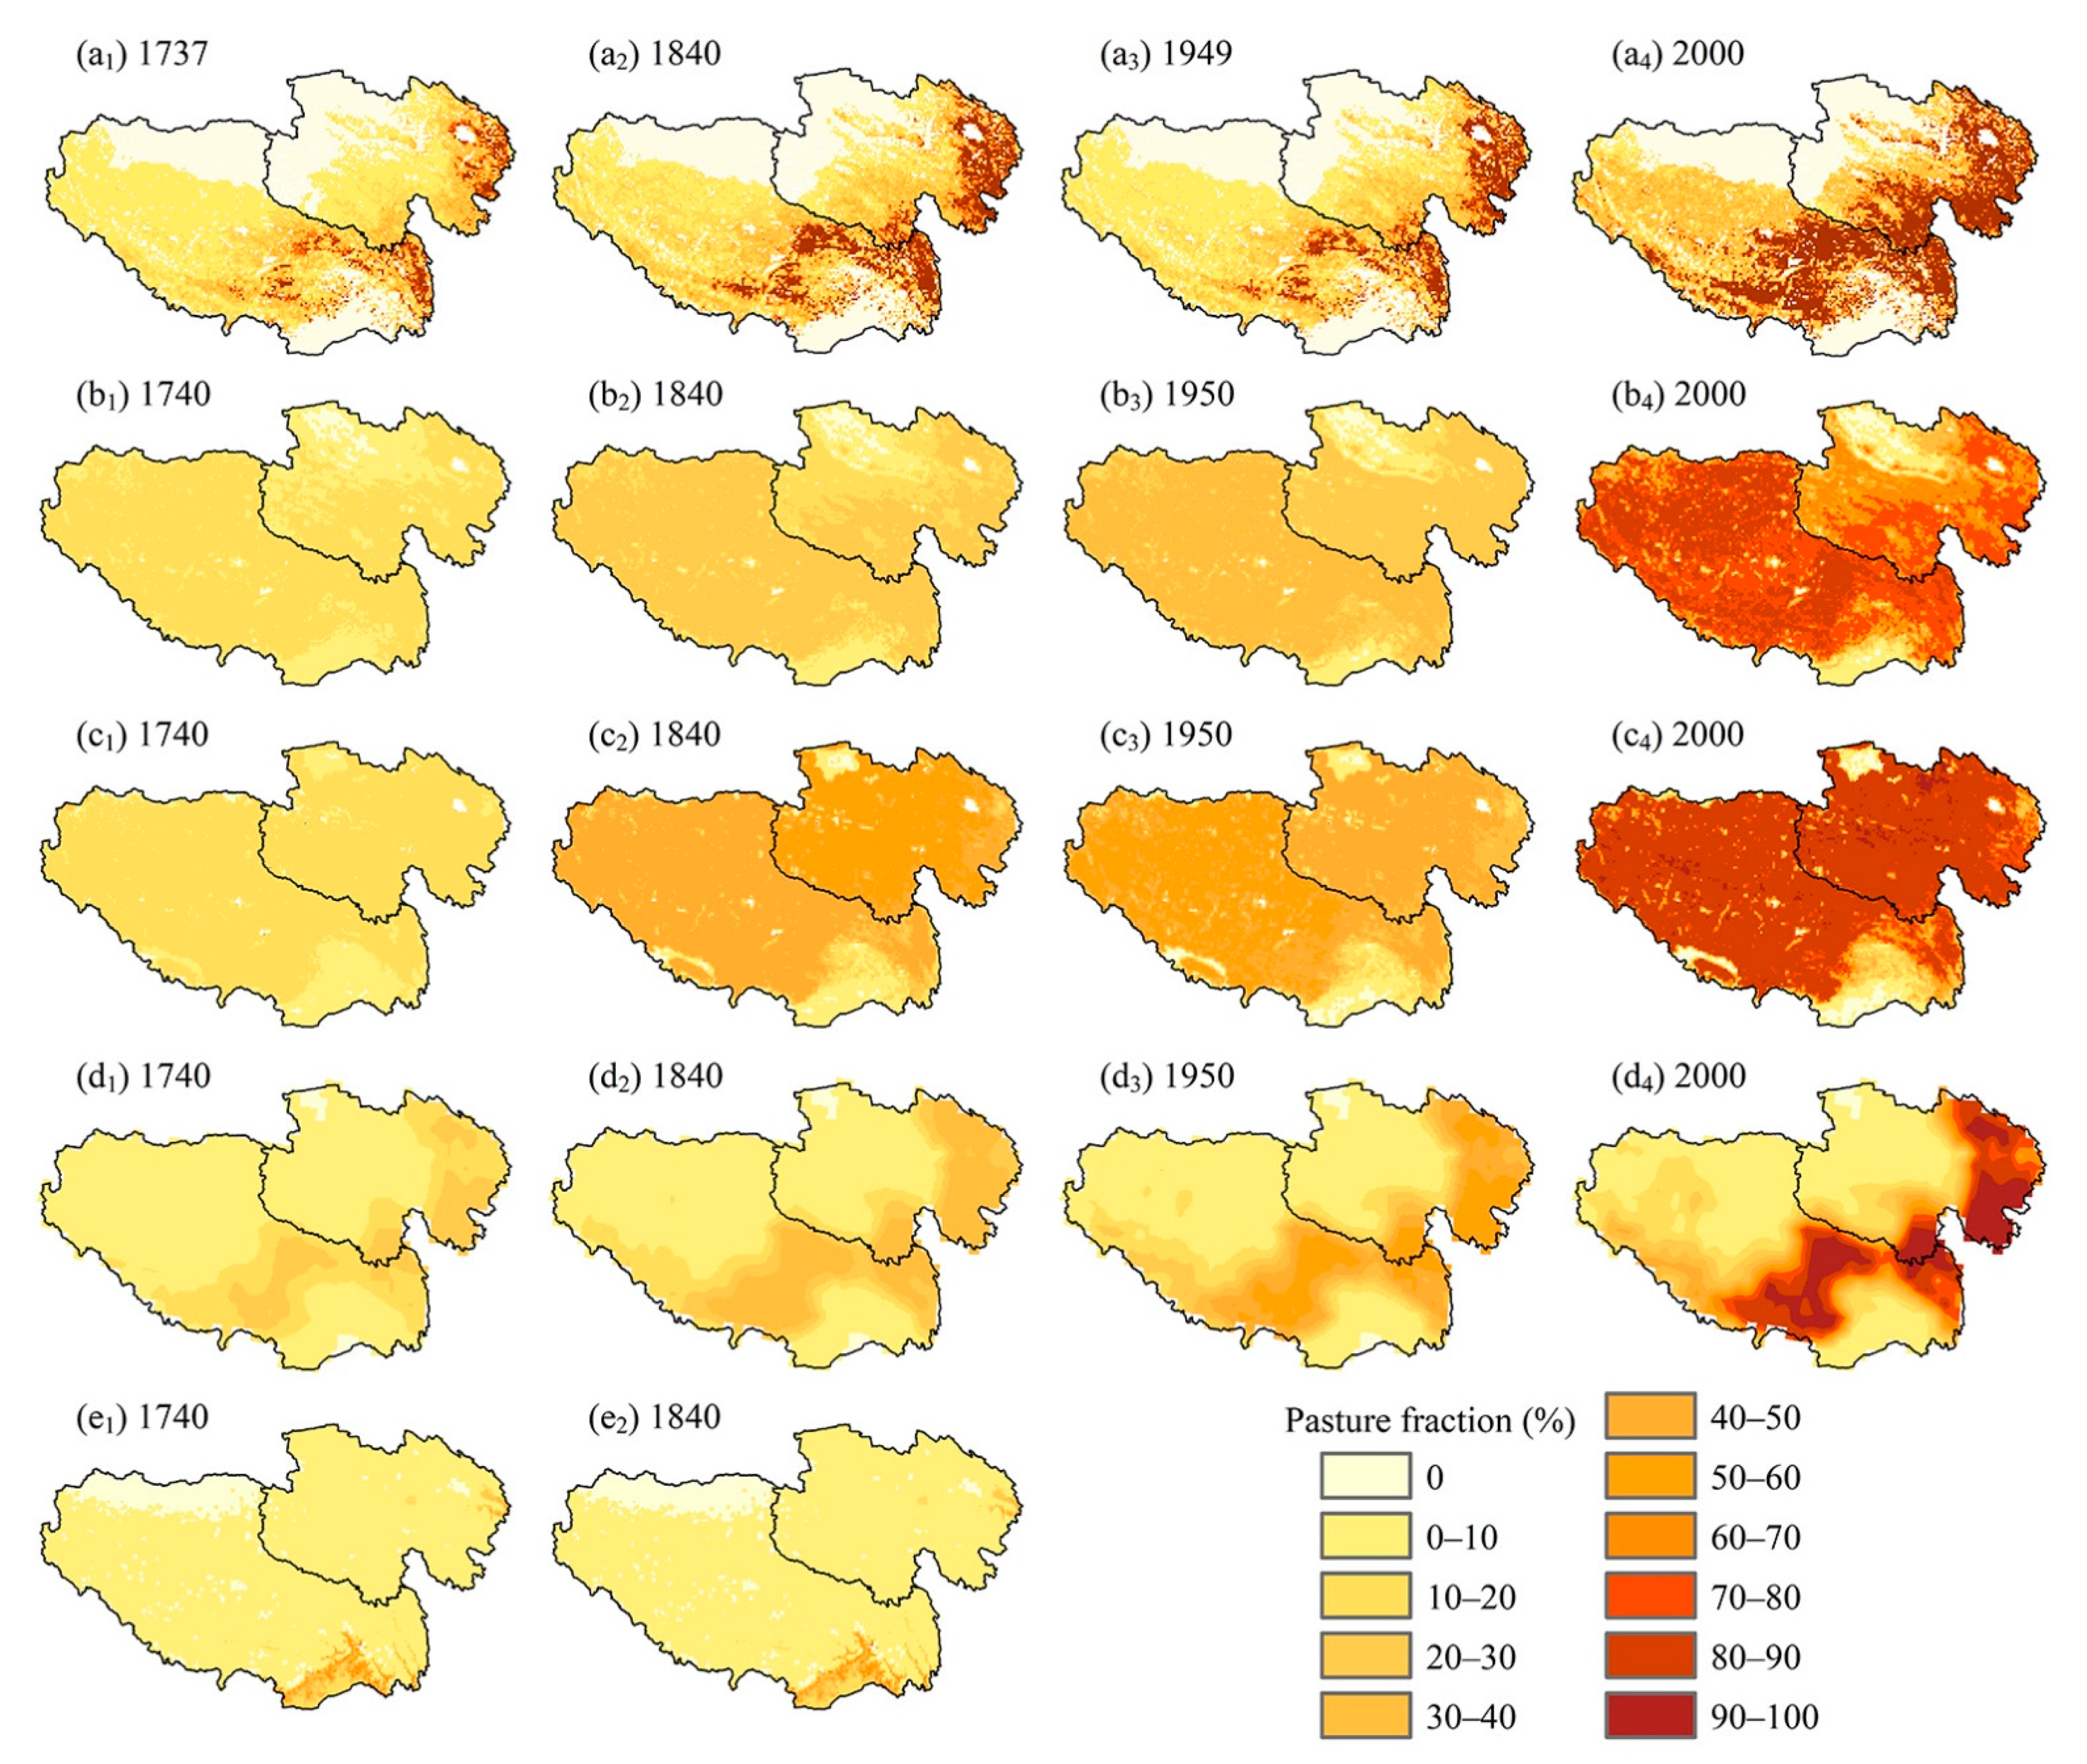
Figure 5 shows the spatial pattern of pasture cover in the TP pasture dataset, HYDE3.1, HYDE3.2, SAGE, and KK10. Significant uncertainties exist in the spatial pattern of pasture cover in HYDE3.1 and HYDE3.2. Specifically, it is unreasonable that large areas of pastures are distributed in the eastern part of Qinghai province and the northern parts of Tibet. The eastern part of Qinghai province is the Qaidam Basin, which is dominated by deserts (Figure 1). The natural environment in northern Tibet is harsh, with sparse grassland and low vegetation coverage (Figure 1). There is very little grazing here, making it one of the world’s wildest ranges.
There is also a huge difference between the KK10 dataset and the actual land use situation of the TP. It is unreasonable that the land use activities of the KK10 dataset are mainly distributed in the southeastern part of Tibet. Because there are still large tracts of forests distributed nowadays (Figure 1), surrounded by tall mountains, and the accessibility is very poor. As a result, over the past 300 years, human grazing and cultivation activities are almost non-existent in this region.
Encouragingly, the spatial patterns of pastures in the SAGE and TP pasture datasets were relatively close overall. Pastures are mainly distributed in the eastern part of Qinghai and the central and eastern parts of Tibet. However, from 1740 to 2000 in SAGE, the spatial pattern of the pasture remained basically unchanged, and the pasture area of each grid just increased linearly, which greatly simplified the actual grazing situation on the TP and only captured the macro pattern of pasture distribution. Grazing activities which gradually expanded to higher altitudes in the plateau over the past 300 years were also not reflected in SAGE. It can also be seen from the TP pasture dataset that there are no grazing activities in the north-western part of the study area as well as in the southeastern part of Tibet. But the SAGE dataset still allocates pastures in these regions, which is also unreasonable.
3.3.2. Comparison at the Grid Scale
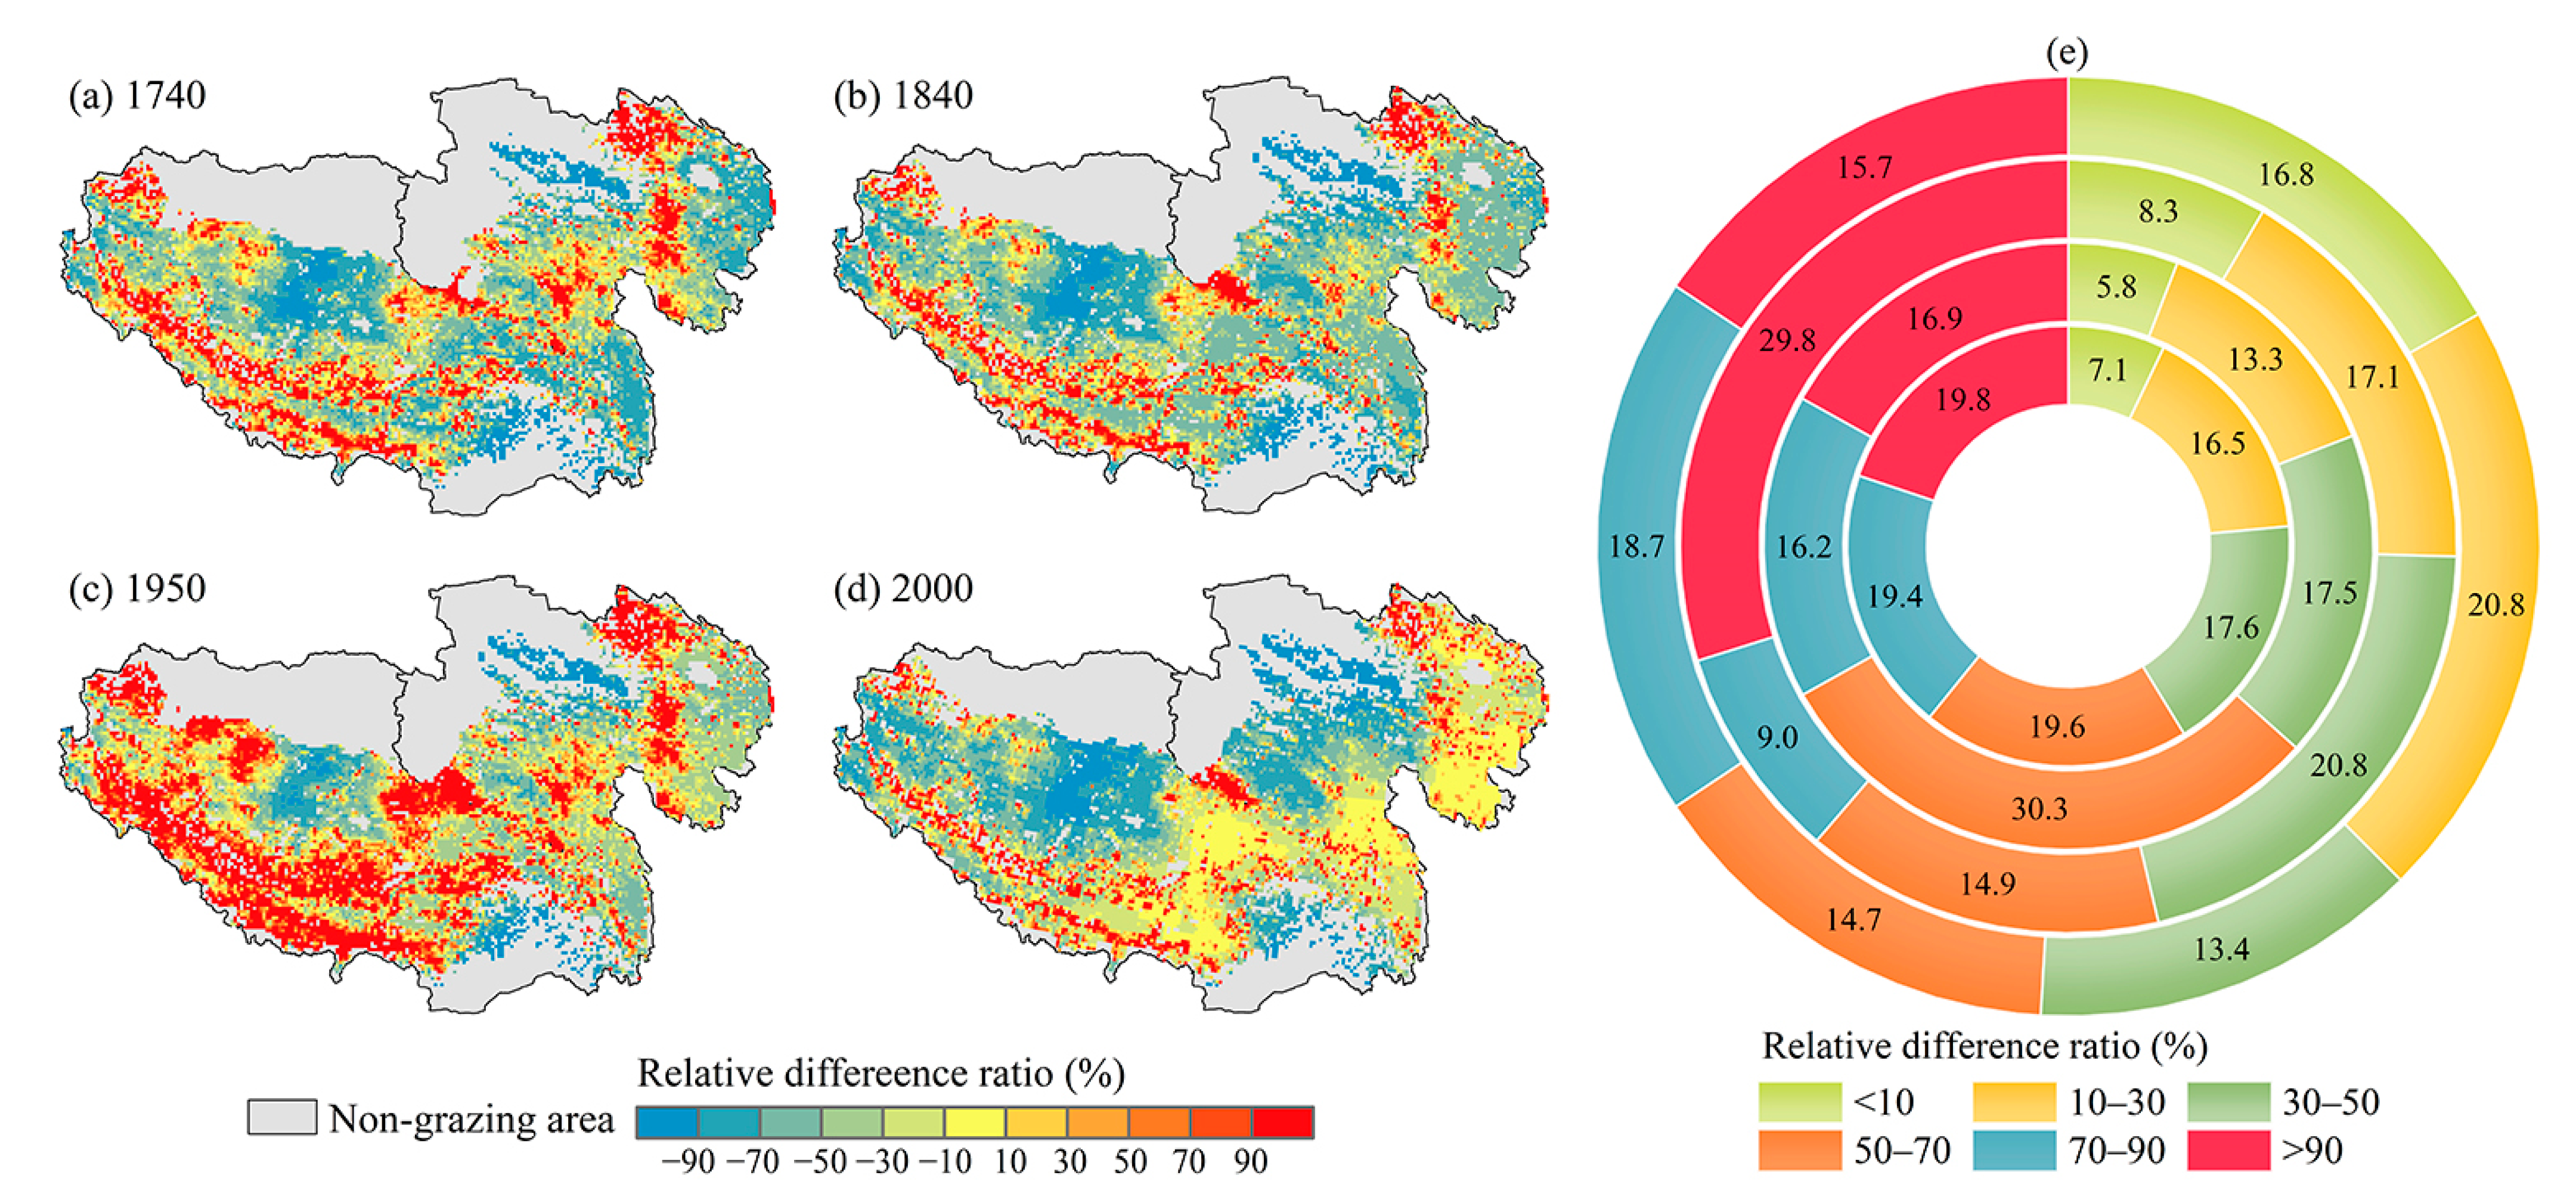
Because of the significant uncertainties of HYDE and KK10, we next only quantitatively evaluate the SAGE dataset at the grid scale. In addition to allocating pastures in non-pastoral areas, SAGE allocated too much pasture in the southwest and central parts of Tibet, as well as in the northern and southern parts of Qinghai (Figure 6a–d). According to statistics, in 1740, 1840, and 1950, the proportion of grids with a relative difference ratio greater than 50% exceeded 50%, while the proportion of grids with a relative difference ratio less than 10% was less than 10% (Figure 6e). In 1950, the pasture areas of the SAGE and TP datasets were very similar (Figure 4 and Table 2), but the proportion of grids with a relative difference ratio greater than 90% reached 29.8%, while the proportion of grids with a relative difference ratio less than 10% was only 8.3% (Figure 6e), indicating that although the SAGE dataset captures the macroscopic pattern of pasture distribution on the TP, it has large uncertainties at the 10 km grid scale. The data of SAGE in 2000 are remote sensing data, and the relative difference is much smaller than that of the historical period.
4. Discussion
In this study, we used the TP pasture dataset to evaluate the uncertainty of several representative global historical land use spatial datasets such as HYDE and KK10 at the regional scale regarding area estimation and spatial reconstruction. We found that only the SAGE dataset can roughly reflect the temporal and spatial characteristics of historical pasture changes on the TP. The HYDE3.2 and PJ datasets overestimated, and the KK10 dataset underestimated, the pasture area for the TP dramatically. As for the spatial pattern, HYDE3.1, HYDE3.2, and PJ overestimate the spatial scope of grazing activities. The KK10 datasets unreasonably allocate pastures to forest areas in southeastern Tibet. Subsequently, we discussed the reasons for these uncertainties and provided suggestions for their improvement.
4.1. Estimation of Pasture Area
In terms of estimation of pasture area, the uncertainty likely comes from estimating pasture area only using the population for the TP. As far as China is concerned, it has a large population and a long farming history. For thousands of years, the growing population has been supported by deforestation and the corresponding cropland expansion. There is a high positive correlation between the population and cropland area. Therefore, the historical population can be used to estimate cropland in historical periods, and the results are generally reliable. However, China’s animal husbandry is underdeveloped compared to Europe and the United States. Grazing activities are mainly carried out on natural grassland, while the area of artificial pasture is very small, so there is significant uncertainty in estimating the pasture area just by population. Klein Goldewijk and Verburg [24] also pointed out that the pasture data in the HYDE dataset has greater uncertainty than the cropland data.
Based on the above analysis, we suggest that when estimating pasture area in global datasets in the future, more proxies related to animal husbandry should be used, such as the number of livestock and the number of livestock products such as meat, milk, and fur. These proxies directly reflect the intensity of grazing activities, so they are universal. For example, based on the number of livestock and grazing rates, Houghton et al. [63] calculated the pasture area for Latin America from 1850 to 1985. Petit and Lambin [64] used the number of livestock and the material consumption required by each livestock and combined the productivity of the pasture to estimate the area of pasture in the Ardennes region of Belgium from 1775 to 1929.
4.2. Spatial Allocation of Pasture Area
The HYDE, PJ, and SAGE datasets overestimated the spatial distribution of pastures because they only considered the distribution of satellite-based grassland coverage (i.e., the ESA Land Cover consortium maps for 2010, the Boston University’s MODIS-derived land cover product, and the GLC2000 data set) when determining the maximum range of pasture and they do not consider human factors such as the distribution of population and livestock. The natural environment in the north-western part of the study area is very harsh. Although there is grassland coverage, it is very sparse, and the productivity is very low. It is not suitable for grazing activities. Therefore, it is still basically a wilderness area even nowadays. In addition, the HYDE3.2 dataset distributed a large amount of pasture in the desert areas of northern Tibet and western Qinghai, which may be because the estimated pasture area was unreasonably large, the grid with good suitability has been all allocated, and the remaining pasture area can only be allocated to these areas with poor suitability. Finally, the HYDE dataset, especially version 3.2, has a very uniform distribution of pasture on the TP, which does not reflect the spatial heterogeneity of grazing activities on the plateau at all, possibly also because the spatial allocation model does not take into account the distribution of population and livestock.
The KK10 dataset only considered climate and soil properties to assess land suitability for grazing and did not use satellite-based grassland coverage to limit the scope of grazing activities, resulting in allocating pastures to southeastern Tibet. The southeastern part of Tibet in China is the region with the lowest altitude and the best hydrothermal conditions in the entire TP. Its forest coverage ratio exceeds 90%. In other areas of the plateau, the average altitude is above 4500 m, precipitation is scarce, the temperature is low, and the soil is some primordial soil. Therefore, if only considering natural factors such as climate and soil, the land suitability for agriculture and pasture is high in southeastern Tibet, and is low in other regions. As a result, KK10 allocated a large amount of land use area to southeastern Tibet. However, that is inconsistent with reality. Southeast Tibetan has rugged terrain, frequent natural disasters, and poor traffic accessibility. So far, it is still dominated by primitive forest cover, and human activities are few. Therefore, it is not appropriate to assess land suitability for grazing only by considering natural factors. Human factors such as livestock, population, and immigration history [65] should also be considered. The TP pasture dataset incorporated the distribution of livestock into the land suitability evaluation model, and the results were reasonable. In addition, the spatial pattern of pasture obtained by the SAGE dataset was consistent with the TP pasture dataset macroscopically [15], indicating that it is a correct method to make full use of remote sensing data for historical reconstruction.
5. Conclusions
The TP pasture dataset can well reveal the temporal and spatial variation characteristics of grazing activities in the TP over the past 300 years. Based on the TP pasture dataset, we evaluated the uncertainty of pasture reconstruction in five representative global datasets, including HYDE3.1, HYDE3.2, KK10, SAGE, and PJ. The evaluation results show that all the global datasets cannot accurately reflect the spatio-temporal characteristics of pasture change in the TP over the past 300 years. Relatively speaking, SAGE can roughly reflect the pasture area and spatial distribution of the study area in the past 300 years. Therefore, we recommend the SAGE dataset to study the impacts of grazing activities on climate and ecosystem services. HYDE3.2 overestimated the area of pasture, and a large amount of pasture was even allocated to wilderness regions. KK10 dramatically underestimated pasture area and only considered climate and soil properties to assess land suitability for grazing resulting in allocating pasture to southeastern Tibet.
In the future, it is recommended to use more data directly related to grazing activities to estimate the pasture area, such as the number of livestock and livestock products. The spatial reconstruction model of the pasture should consider not only natural factors, but also human factors related to grazing activities, including the spatial distribution of pastoral population and livestock.
This evaluation is valuable for improving global and regional historical pasture reconstructions in the future. In addition, the high-resolution TP pasture dataset we reconstructed can also be used to study the climatic and environmental consequences of long-term grazing activities.
Author Contributions
L.H.: Software, Formal analysis, Investigation, Resources, Writing—Original Draft, Visualization, Data curation, Writing—Reviewing and Editing. S.L.: Conceptualization, Methodology, Writing—Original draft, Writing—Reviewing and Editing, Validation, Project administration, Funding acquisition, Supervision. D.G.: Writing—Reviewing and Editing. W.L.: Writing—Reviewing and Editing. All authors have read and agreed to the published version of the manuscript.
Funding
This research was funded by the Second Tibetan Plateau Scientific Expedition and Research Program (STEP) (grant number 2019QZKK0603) and the National Natural Science Foundation of China (41701228, 41671149).
Data Availability Statement
The data presented in this study are available on request from the corresponding author.
Conflicts of Interest
The authors declare that they have no conflict of interest.
References
- Ellis, E.C.; Ramankutty, N. Putting people in the map: Anthropogenic biomes of the world. Front. Ecol. Environ. 2008, 6, 439–447. [Google Scholar] [CrossRef] [Green Version]
- Venter, O.; Sanderson, E.W.; Magrach, A.; Allan, J.R.; Beher, J.; Jones, K.R.; Possingham, H.P.; Laurance, W.F.; Wood, P.; Fekete, B.M.; et al. Sixteen years of change in the global terrestrial human footprint and implications for biodiversity conservation. Nat. Commun. 2016, 7, 12558. [Google Scholar] [CrossRef] [PubMed] [Green Version]
- Du, M.; Kawashima, S.; Yonemura, S.; Zhang, X.; Chen, S. Mutual influence between human activities and climate change in the Tibetan Plateau during recent years. Glob. Planet. Chang. 2004, 41, 241–249. [Google Scholar] [CrossRef]
- Foley, J.A.; DeFries, R.; Asner, G.P.; Barford, C.; Bonan, G.; Carpenter, S.R.; Chapin, F.S.; Coe, M.T.; Daily, G.C.; Gibbs, H.K.; et al. Global consequences of land use. Science 2005, 309, 570–574. [Google Scholar] [CrossRef] [PubMed] [Green Version]
- Díaz, S.; Settele, J.; Brondízio, E.S.; Ngo, H.T.; Agard, J.; Arneth, A.; Balvanera, P.; Brauman, K.A.; Butchart, S.H.M.; Chan, K.M.A.; et al. Pervasive human-driven decline of life on Earth points to the need for transformative change. Science 2019, 366, eaax3100. [Google Scholar] [CrossRef] [Green Version]
- Pereira, H.M.; Navarro, L.M.; Martins, I.S. Global Biodiversity Change: The Bad, the Good, and the Unknown. Annu. Rev. Environ. Resour. 2012, 37, 25–50. [Google Scholar] [CrossRef] [Green Version]
- Johnson, C.N.; Balmford, A.; Brook, B.W.; Buettel, J.C.; Galetti, M.; Guangchun, L.; Wilmshurst, J.M. Biodiversity losses and conservation responses in the Anthropocene. Science 2017, 356, 270–275. [Google Scholar] [CrossRef]
- Stephens, L.; Fuller, D.; Boivin, N.; Rick, T.; Gauthier, N.; Kay, A.; Marwick, B.; Armstrong, C.G.; Barton, C.M.; Denham, T.; et al. Archaeological assessment reveals Earth’s early transformation through land use. Science 2019, 365, 897–902. [Google Scholar] [CrossRef] [Green Version]
- van Asselen, S.; Verburg, P.H. A Land System representation for global assessments and land-use modeling. Glob. Chang. Biol. 2012, 18, 3125–3148. [Google Scholar] [CrossRef] [Green Version]
- Gaillard, M.J.; Morrison, K.D.; Madella, M.; Whitehouse, N. Past land-use and land-cover change: The challenge of quantification at the subcontinental to global scales. Past Glob. Chang. Mag. 2018, 26, 3. [Google Scholar] [CrossRef] [Green Version]
- Brown, A.; Poska, A.; Pluskowski, A. The environmental impact of cultural change: Palynological and quantitative land cover reconstructions for the last two millennia in northern Poland. Quat. Int. 2019, 522, 38–54. [Google Scholar] [CrossRef]
- Klein Goldewijk, K. Estimating global land use change over the past 300 years: The HYDE Database. Glob. Biogeochem. Cycles 2001, 15, 417–433. [Google Scholar] [CrossRef]
- Klein Goldewijk, K.; Beusen, A.; Van Drecht, G.; De Vos, M. The HYDE 3.1 spatially explicit database of human-induced global land-use change over the past 12,000 years. Glob. Ecol. Biogeogr. 2011, 20, 73–86. [Google Scholar] [CrossRef]
- Klein Goldewijk, K.; Beusen, A.; Doelman, J.; Stehfest, E. Anthropogenic land use estimates for the Holocene—HYDE3.2. Earth Syst. Sci. Data 2017, 9, 927–953. [Google Scholar] [CrossRef] [Green Version]
- Ramankutty, N.; Evan, A.T.; Monfreda, C.; Foley, J.A. Farming the planet: 1. Geographic distribution of global agricultural lands in the year 2000. Glob. Biogeochem. Cycles 2008, 22, GB1003. [Google Scholar] [CrossRef]
- Ramankutty, N. Global Cropland and Pasture Data from 1700–2007; The LUGE (Land Use and the Global Environment) Laboratory, McGill University: Montreal, QC, Canada, 2012. [Google Scholar]
- Pongratz, J.; Reick, C.H.; Raddatz, T.; Claussen, M.J. A reconstruction of global agricultural areas and land cover for the last millennium. Glob. Biogeochem. Cycles 2008, 22, GB3018. [Google Scholar] [CrossRef]
- Kaplan, J.O.; Krumhardt, K.M.; Zimmermann, N. The prehistoric and preindustrial deforestation of Europe. Quat. Sci. Rev. 2009, 28, 3016–3034. [Google Scholar] [CrossRef]
- Kaplan, J.O.; Krumhardt, K.M.; Ellis, E.C.; Ruddiman, W.F.; Lemmen, C.; Klein Goldewijk, K. Holocene carbon emissions as a result of anthropogenic land cover change. Holocene 2011, 21, 775–791. [Google Scholar] [CrossRef] [Green Version]
- Ellis, E.C.; Klein Goldewijk, K.; Siebert, S.; Lightman, D.; Ramankutty, N. Anthropogenic transformation of the biomes, 1700 to 2000. Glob. Ecol. Biogeogr. 2010, 19, 589–606. [Google Scholar] [CrossRef]
- Ellis, E.C.; Kaplan, J.O.; Fuller, D.Q.; Vavrus, S.; Klein Goldewijk, K.; Verburg, P.H. Used planet: A global history. Proc. Natl. Acad. Sci. USA 2013, 110, 7978–7985. [Google Scholar] [CrossRef] [Green Version]
- He, F.; Vavrus, S.J.; Kutzbach, J.E.; Ruddiman, W.F.; Kaplan, J.O.; Krumhardt, K.M. Simulating global and local surface temperature changes due to Holocene anthropogenic land cover change. Geophys. Res. Lett. 2014, 41, 623–631. [Google Scholar] [CrossRef]
- Houghton, R.A.; Hackler, J.L. Sources and sinks of carbon from land-use change in China. Glob. Biogeochem. Cycles 2003, 17, 1034. [Google Scholar] [CrossRef]
- Klein Goldewijk, K.; Verburg, P.H. Uncertainties in global-scale reconstructions of historical land use: An illustration using the HYDE data set. Landsc. Ecol. 2013, 28, 861–877. [Google Scholar] [CrossRef]
- Meiyappan, P.; Jain, A.K. Three distinct global estimates of historical land-cover change and land-use conversions for over 200 years. Front. Earth Sci. 2012, 6, 122–139. [Google Scholar] [CrossRef]
- Zhang, D.; Fang, X.; Yang, L.E. Comparison of the HYDE cropland data over the past millennium with regional historical evidence from Germany. Reg. Environ. Chang. 2021, 21, 15. [Google Scholar] [CrossRef]
- Kaplan, J.O.; Krumhardt, K.M.; Gaillard, M.-J.; Sugita, S.; Trondman, A.-K.; Fyfe, R.; Marquer, L.; Mazier, F.; Nielsen, A.B. Constraining the Deforestation History of Europe: Evaluation of Historical Land Use Scenarios with Pollen-Based Land Cover Reconstructions. Land 2017, 6, 91. [Google Scholar] [CrossRef] [Green Version]
- He, F.; Li, S.; Zhang, X.; Ge, Q.; Dai, J. Comparisons of cropland area from multiple datasets over the past 300 years in the traditional cultivated region of China. J. Geogr. Sci. 2013, 23, 978–990. [Google Scholar] [CrossRef]
- Li, B.; Fang, X.; Ye, Y.; Zhang, X. Accuracy assessment of global historical cropland datasets based on regional reconstructed historical data—A case study in Northeast China. Sci. China Earth Sci. 2010, 53, 1689–1699. [Google Scholar] [CrossRef]
- Fang, X.; Zhao, W.; Zhang, C.; Zhang, D.; Wei, X.; Qiu, W.; Ye, Y. Methodology for credibility assessment of historical global LUCC datasets. Sci. China Earth Sci. 2020, 63, 1013–1025. [Google Scholar] [CrossRef]
- Zhao, C.; He, F.; Yang, F.; Li, S. Uncertainties of global historical land use scenarios in past-millennium cropland reconstruction in China. Quat. Int. 2022, in press. [Google Scholar] [CrossRef]
- Li, S.; He, F.; Zhang, X.; Zhou, T. Evaluation of global historical land use scenarios based on regional datasets on the Qinghai–Tibet Area. Sci. Total Environ. 2019, 657, 1615–1628. [Google Scholar] [CrossRef] [PubMed]
- Oliveira, J.; Campbell, E.E.; Lamparelli, R.A.; Figueiredo, G.K.; Soares, J.R.; Jaiswal, D.; Monteiro, L.A.; Vianna, M.S.; Lynd, L.R.; Sheehan, J.J. Choosing pasture maps: An assessment of pasture land classification definitions and a case study of Brazil. Int. J. Appl. Earth Obs. Geoinform. 2020, 93, 102205. [Google Scholar] [CrossRef]
- Phelps, L.N.; Kaplan, J.O. Land use for animal production in global change studies: Defining and characterizing a framework. Glob. Chang. Biol. 2017, 23, 4457–4471. [Google Scholar] [CrossRef] [Green Version]
- Steinfeld, H.; Gerber, P.; Wassenaar, T.; Castel, V.; Rosales, M.; Haan, C.D. Livestock’s Long Shadow: Environmental Issues and Options; FAO: Rome, Italy, 2006; Volume 16, p. 7. [Google Scholar]
- Niu, L.; Guo, Y.; Li, Y.; Wang, C.; Hu, Q.; Fan, L.; Wang, L.; Yang, N. Degradation of river ecological quality in Tibet plateau with overgrazing: A quantitative assessment using biotic integrity index improved by random forest. Ecol. Indic. 2021, 120, 106948. [Google Scholar] [CrossRef]
- Upadhyay, R.K. Markers for Global Climate Change and Its Impact on Social, Biological and Ecological Systems: A Review. Am. J. Clim. Chang. 2020, 9, 159–203. [Google Scholar] [CrossRef]
- Chen, H.; Zhu, Q.; Peng, C.; Wu, N.; Wang, Y.; Fang, X.; Gao, Y.; Zhu, D.; Yang, G.; Tian, J.; et al. The Impacts of Climate Change and Human Activities on Biogeochemical Cycles on the Qinghai-Tibetan Plateau. Glob. Chang. Biol. 2013, 19, 2940–2955. [Google Scholar] [CrossRef]
- Yao, T.; Thompson, L.G.; Mosbrugger, V.; Zhang, F.; Ma, Y.; Luo, T.; Xu, B.; Yang, X.; Joswiak, D.R.; Wang, W.; et al. Third Pole Environment (TPE). Environ. Dev. 2012, 3, 52–64. [Google Scholar] [CrossRef]
- Sun, Y.; Liu, S.; Shi, F.; An, Y.; Li, M.; Liu, Y. Spatio-temporal variations and coupling of human activity intensity and ecosystem services based on the four-quadrant model on the Qinghai-Tibet Plateau. Sci. Total Environ. 2020, 743, 140721. [Google Scholar] [CrossRef]
- Shen, H.; Zhu, Y.; Zhao, X.; Geng, X.; Gao, S.; Fang, J. Analysis of current grassland resources in China. Chin. Sci. Bull. 2016, 61, 139–154. [Google Scholar] [CrossRef]
- Center for International Earth Science Information Network, Columbia University. Gridded Population of the World, Version 4 (GPWv4): Population Density Adjusted to Match 2015 Revision UN WPP Country Totals, Revision 11; NASA Socioeconomic Data and Applications Center (SEDAC): Palisades, NY, USA, 2018. [Google Scholar]
- Li, S.; Wang, Z.; Zhang, Y. Crop cover reconstruction and its effects on sediment retention in the Tibetan Plateau for 1900–2000. J. Geogr. Sci. 2017, 27, 786–800. [Google Scholar] [CrossRef]
- Venter, O.; Sanderson, E.W.; Magrach, A.; Allan, J.R.; Beher, J.; Jones, K.R.; Possingham, H.P.; Laurance, W.F.; Wood, P.; Fekete, B.M.; et al. Global terrestrial Human Footprint maps for 1993 and 2009. Sci. Data 2016, 3, 160067. [Google Scholar] [CrossRef] [PubMed] [Green Version]
- Li, S.; Zhang, Y.; Wang, Z.; Li, L. Mapping human influence intensity in the Tibetan Plateau for conservation of ecological service functions. Ecosyst. Serv. 2018, 30, 276–286. [Google Scholar] [CrossRef]
- Verburg, P.H.; Chen, Y. Multiscale Characterization of Land-Use Patterns in China. Ecosystems 2000, 3, 369–385. [Google Scholar] [CrossRef]
- Pongratz, J.; Reick, C.; Raddatz, T.; Claussen, M. Reconstruction of Global Land Use and Land Cover AD 800 to 1992; World Data Center Climate (WDCC) DKRZ: Hamburg, Germany, 2007. [Google Scholar] [CrossRef]
- FAO. FAOSTAT; Food and Agriculture Organization of the United Nations: Rome, Italy, 2015. [Google Scholar]
- Qinghai Provincial Bureau of Statistics; National Bureau of Statistics Survey Office in Qinghai. Qinghai Statistical Yearbook 2001; Qinghai Provincial Bureau of Statistics and National Bureau of Statistics Survey Office in Qinghai: Beijing, China, 2001.
- Tibet Autonomous Region Bureau of Statistics; National Bureau of Statistics Survey Office in Tibet. Tibet Statistics Yearbook 2001; Tibet Autonomous Region Bureau of Statistics and National Bureau of Statistics Survey Office in Tibet: Beijing, China, 2001.
- Kang, F. Qinghai Chronicle; Qinghai People’s Publishing House: Xining, China, 1968. [Google Scholar]
- Liu, R. Population of China. Tibet Branch; Chinese Financial & Economic Publishing House: Beijing, China, 1988. [Google Scholar]
- Zhai, S. Population of China. Qinghai Branch; Chinese Financial & Economic Publishing House: Beijing, China, 1989. [Google Scholar]
- Du, J. Rational exploitation of Tibetan grassland resources. Resour. Exploit. Prot. 1990, 6, 46–48. [Google Scholar]
- Zhang, B. On the Livestock Development of Qinghai Province during the time of Republic of China (1912—1949). Anc. Mod. Agric. 2011, 3, 91–100. [Google Scholar]
- Miehe, G.; Schleuss, P.-M.; Seeber, E.; Babel, W.; Biermann, T.; Braendle, M.; Chen, F.; Coners, H.; Foken, T.; Gerken, T.; et al. The Kobresia pygmaea ecosystem of the Tibetan highlands—Origin, functioning and degradation of the world’s largest pastoral alpine ecosystem. Sci. Total Environ. 2018, 648, 754–771. [Google Scholar] [CrossRef]
- Stevens, F.R.; Gaughan, A.E.; Linard, C.; Tatem, A.J. Disaggregating Census Data for Population Mapping Using Random Forests with Remotely-Sensed and Ancillary Data. PLoS ONE 2015, 10, e0107042. [Google Scholar] [CrossRef] [Green Version]
- Li, L.; Zhang, Y.; Liu, L.; Wang, Z.; Zhang, H.; Li, S.; Ding, M. Mapping Changing Population Distribution on the Qinghai–Tibet Plateau since 2000 with Multi-Temporal Remote Sensing and Point-of-Interest Data. Remote Sens. 2020, 12, 4059. [Google Scholar] [CrossRef]
- Cao, S. China Population History (Qing Dynasty); Fudan University Press: Shanghai, China, 2001; Volume 5. [Google Scholar]
- He, F.; Li, S.; Yang, F.; Li, M. Evaluating the accuracy of Chinese pasture data in global historical land use datasets. Sci. China Earth Sci. 2018, 61, 1685–1696. [Google Scholar] [CrossRef]
- Chini, L.; Hurtt, G.; Sahajpal, R.; Frolking, S.; Klein Goldewijk, K.; Sitch, S.; Ganzenmüller, R.; Ma, L.; Ott, L.; Pongratz, J.; et al. Land-use harmonization datasets for annual global carbon budgets. Earth Syst. Sci. Data 2021, 13, 4175–4189. [Google Scholar] [CrossRef]
- Yan, M.; Liu, J.; Wang, Z.; Ning, L. Biogeophysical impacts of land use/land cover change on 20th century anthropogenic climate compared to the impacts of greenhouse gas change. Int. J. Clim. 2020, 40, 6560–6573. [Google Scholar] [CrossRef] [Green Version]
- Houghton, R.A.; Lefkowitz, D.S.; Skole, D.L. Changes in the landscape of Latin America between 1850 and 1985 I. Progressive loss of forests. For. Ecol. Manag. 1991, 38, 143–172. [Google Scholar] [CrossRef]
- Petit, C.C.; Lambin, E.F. Long-term land-cover changes in the Belgian Ardennes (1775-1929): Model-based reconstruction vs. historical maps. Glob. Chang. Biol. 2002, 8, 616–630. [Google Scholar] [CrossRef]
- Li, M.; He, F.; Zhao, C.; Yang, F. Credibility assessment of cropland data in xinjiang area in global historical LUCC datasets. Ecol. Environ. Sci. 2022, 31, 1215–1224. [Google Scholar] [CrossRef]
Figure 1.
Location of Tibetan Plateau and its land use map for 2020. The land use data was cited from Resource and Environment Science and Data Center, Chinese Academy of Sciences (https://www.resdc.cn/Default.aspx) (accessed on 22 April 2022).
Figure 1.
Location of Tibetan Plateau and its land use map for 2020. The land use data was cited from Resource and Environment Science and Data Center, Chinese Academy of Sciences (https://www.resdc.cn/Default.aspx) (accessed on 22 April 2022).

Figure 2.
Comparison of (a) the TP pasture dataset we reconstructed and (b) the remotely sensed grassland utilization intensity for the Tibetan Plateau. The grassland utilization intensity data was cited from https://nrscc.most.cn/ (accessed on 20 June 2022).
Figure 2.
Comparison of (a) the TP pasture dataset we reconstructed and (b) the remotely sensed grassland utilization intensity for the Tibetan Plateau. The grassland utilization intensity data was cited from https://nrscc.most.cn/ (accessed on 20 June 2022).
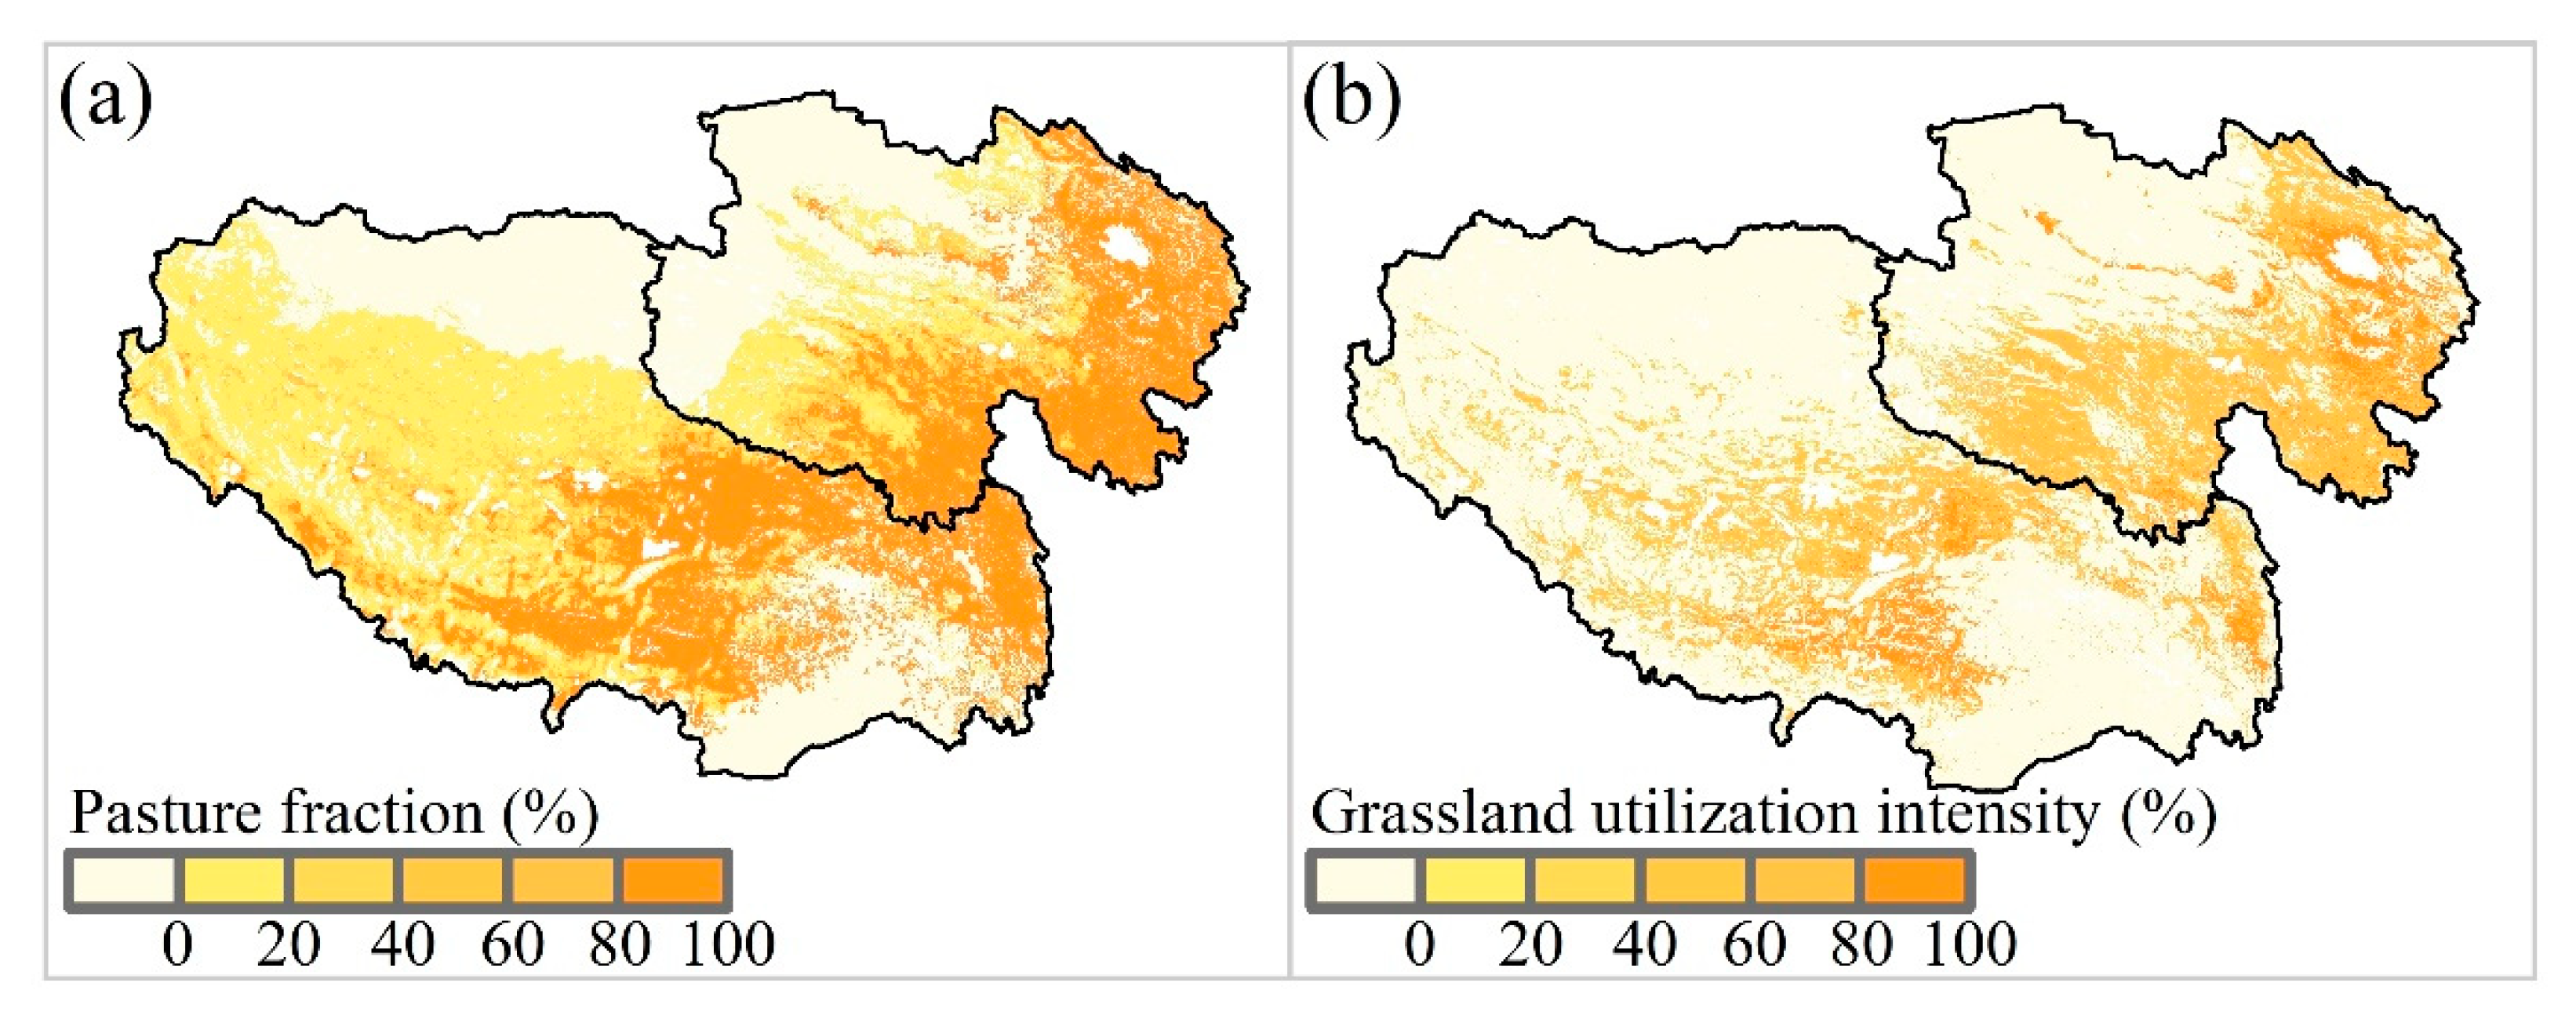
Figure 3.
The number of (a) natural disasters, (b) wars, (c) population, and (d) pasture areas in global datasets [13,14,16,17,19] in the Tibetan Plateau during 1700–2000.

Figure 4.
Comparison of pasture areas in the Tibetan Plateau over the past 300 years between HYDE (versions 3.1 and 3.2) [13,14], KK10 [19], SAGE [16], PJ [17], and the TP pasture dataset.
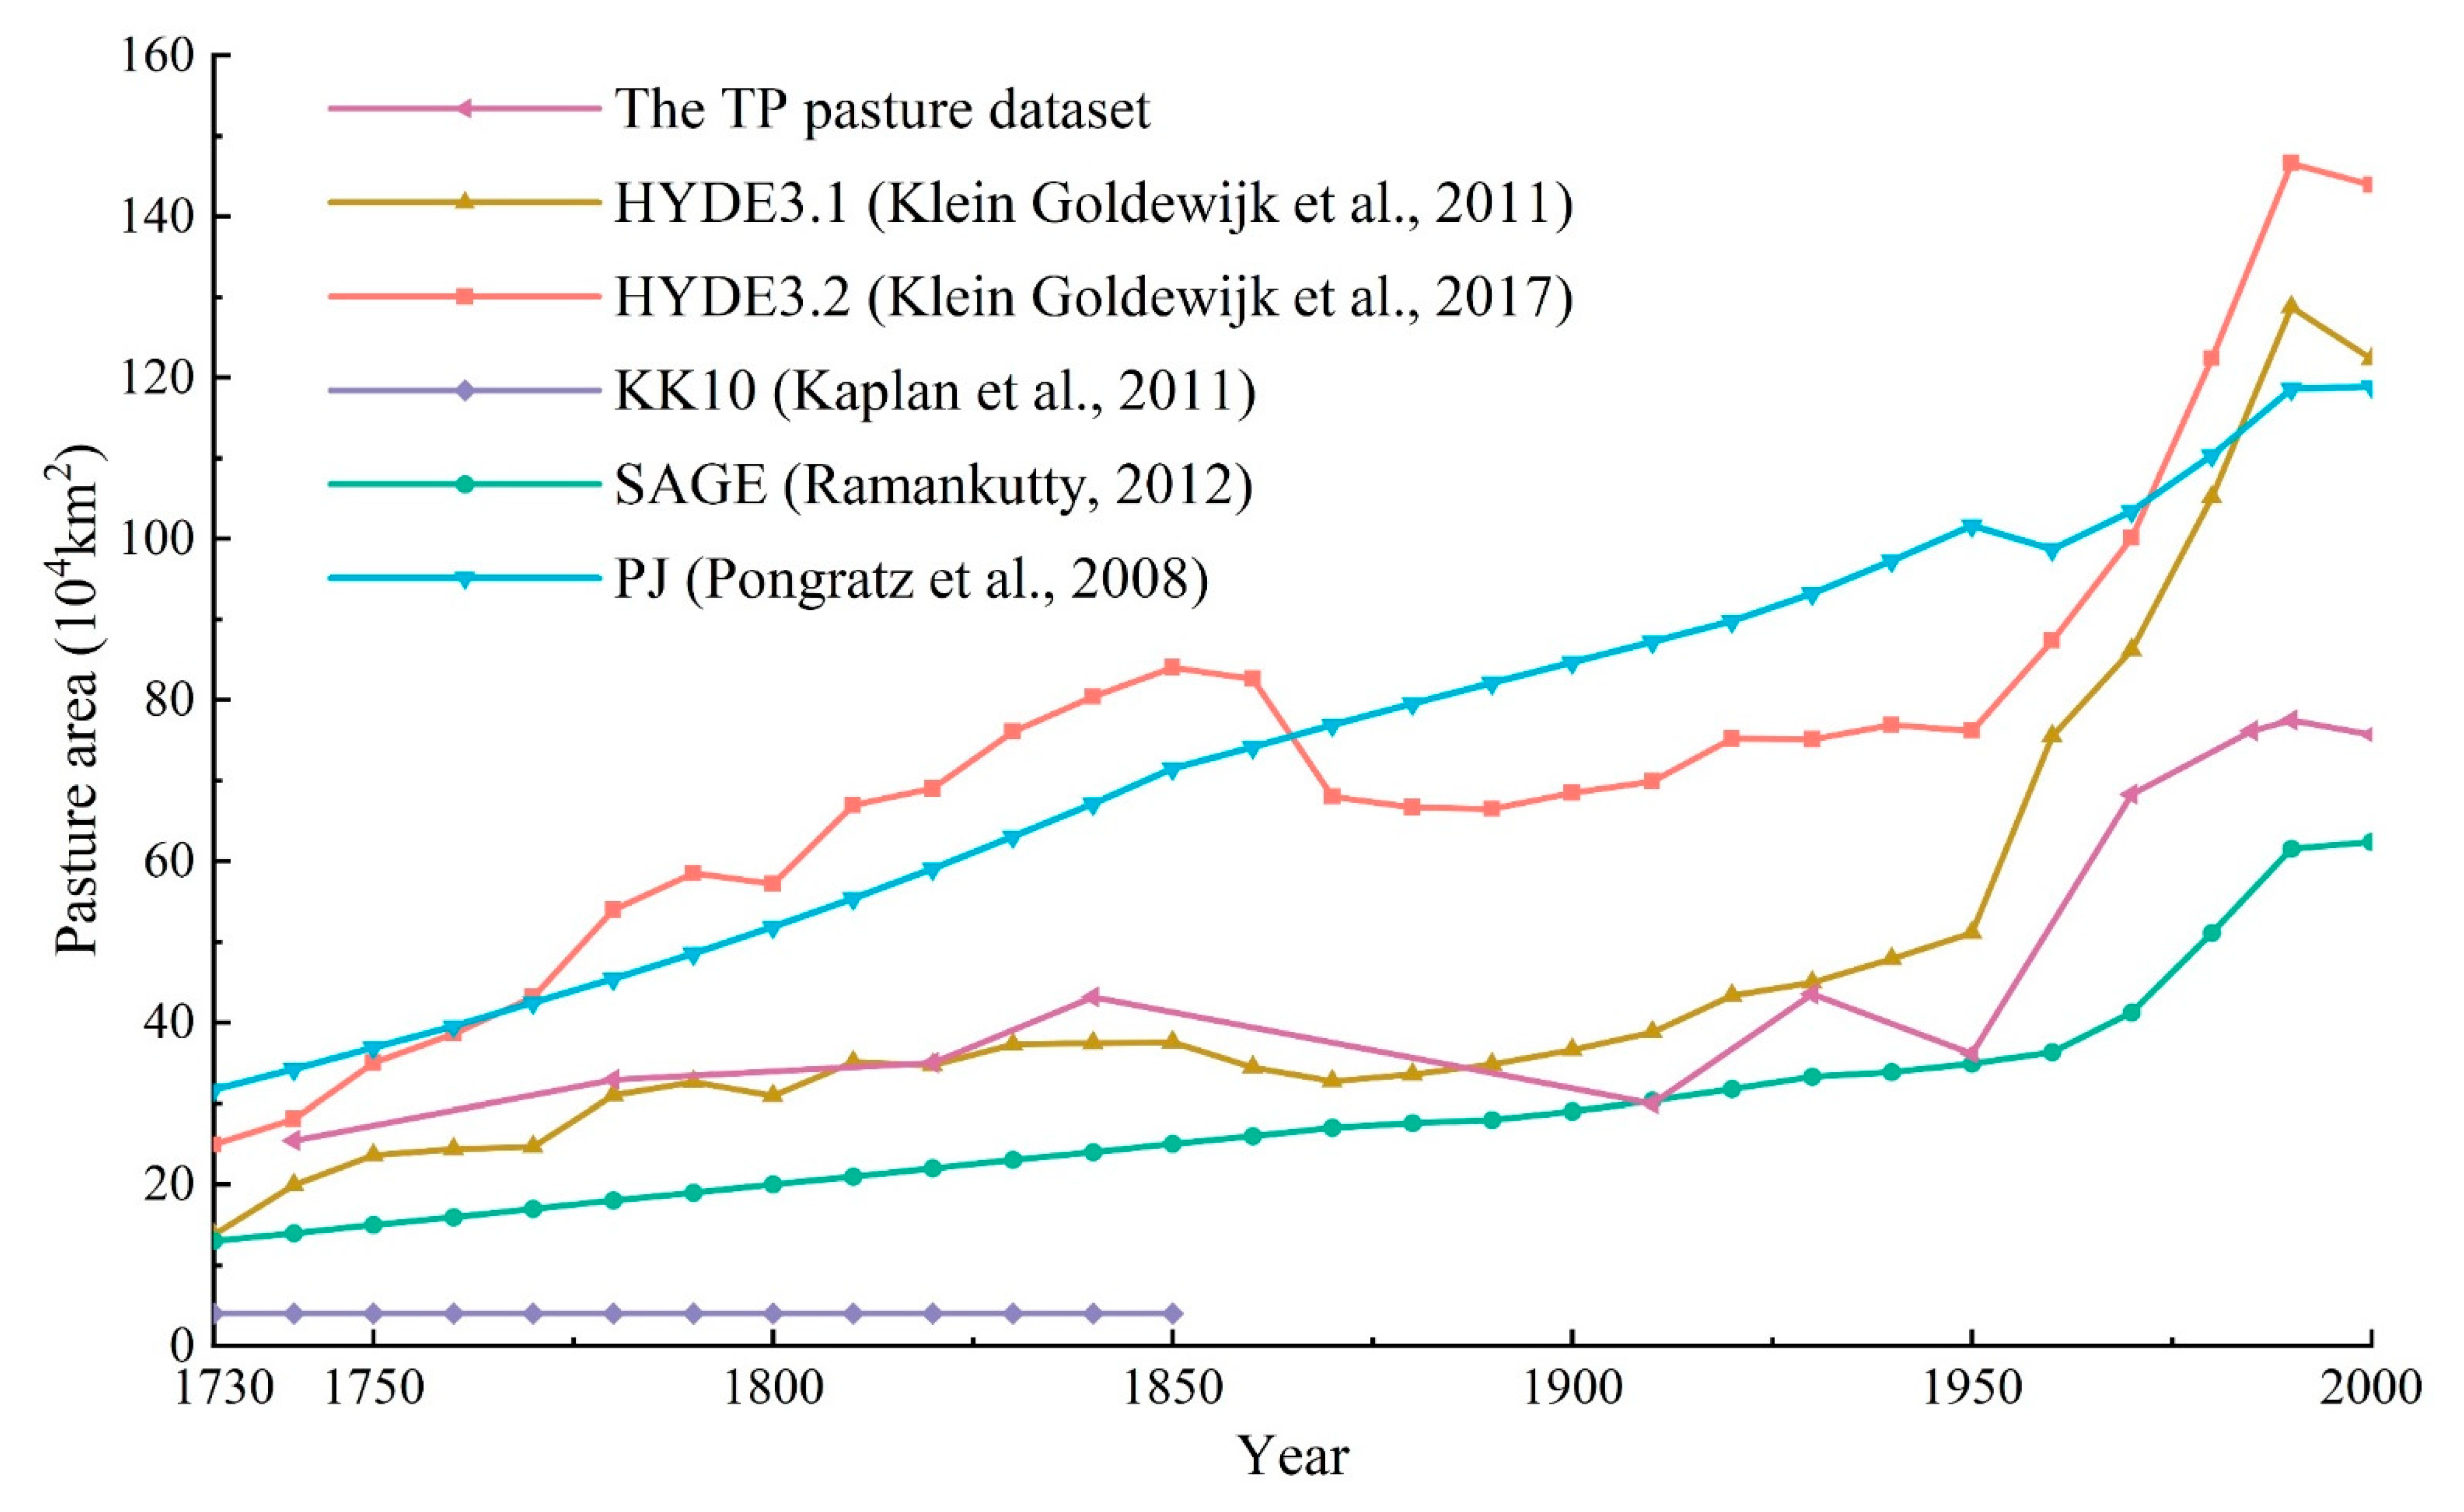
Figure 5.
Comparison of the spatial pattern of pastures for the Tibetan Plateau for 1740, 1840, 1950, and 2000. (a1–a4): the TP pasture dataset, (b1–b4): HYDE3.1, (c1–c4): HYDE3.2, (d1–d4): SAGE, and (e1,e2): KK10.
Figure 5.
Comparison of the spatial pattern of pastures for the Tibetan Plateau for 1740, 1840, 1950, and 2000. (a1–a4): the TP pasture dataset, (b1–b4): HYDE3.1, (c1–c4): HYDE3.2, (d1–d4): SAGE, and (e1,e2): KK10.

Figure 6.
Spatial distributions of (a–d) the relative difference of pasture for the Tibetan Plateau between SAGE and the TP pasture dataset, and (e) the percentages of grids in each relative difference ratio (from the inside to the outside in order of 1740, 1840, 1950, and 2000).
Figure 6.
Spatial distributions of (a–d) the relative difference of pasture for the Tibetan Plateau between SAGE and the TP pasture dataset, and (e) the percentages of grids in each relative difference ratio (from the inside to the outside in order of 1740, 1840, 1950, and 2000).

Table 1.
Basic information of representative global historical land use datasets and the regional pasture dataset for the Tibetan Plateau (TP).
Table 1.
Basic information of representative global historical land use datasets and the regional pasture dataset for the Tibetan Plateau (TP).
| Datasets | Temporal Coverage | Area Estimation Methods | |
|---|---|---|---|
| Global Datasets | HYDE3.1 [13] | 10000BC–AD2000 | Pasture area per capita, which is assumed stable, is multiplied by population to estimate past pasture area. |
| HYDE3.2 [14] | 10000BC–AD2017 | The historical per capita pasture area was fitted using curves; then, it was multiplied by population to estimate pasture area. | |
| KK10 [19] | 8000BP–AD1850 | Land use area per capita, which is assumed to decrease gradually with the advance of agricultural technology, is multiplied by population to estimate past land use area. | |
| PJ [17] | AD800–1992 | Pasture area per capita, assumed stable for AD800–1700, is multiplied by population to estimate pasture area, and link SAGE and HYDE with the period AD1700–1992. | |
| SAGE [16] | AD1700–2007 | Linear backtracking of pasture area over the historical period, based on the existing inventory data of pasture area. | |
| Regional Dataset | Historical pasture dataset for the TP | AD1737–2000 | Based on the number of livestock and the historical records about the pasture area, we estimated the pasture area for the TP. |
Table 2.
Pasture area (unit: 104 km2) of the Tibetan Plateau in the TP pasture dataset and the global reconstructions (HYDE3.1, HYDE3.2, SAGE, PJ, and KK10) as well as the ratios between the latter and the former.
Table 2.
Pasture area (unit: 104 km2) of the Tibetan Plateau in the TP pasture dataset and the global reconstructions (HYDE3.1, HYDE3.2, SAGE, PJ, and KK10) as well as the ratios between the latter and the former.
| Year | The TP Pasture Dataset | HYDE3.2 | HYDE3.1 | SAGE | PJ | KK10 | |||||
|---|---|---|---|---|---|---|---|---|---|---|---|
| Area | Area | Ratio | Area | Ratio | Area | Ratio | Area | Ratio | Area | Ratio | |
| 1740 | 25.45 | 27.01 | 1.06 | 19.87 | 0.78 | 13.96 | 0.55 | 34.21 | 1.34 | 3.98 | 0.16 |
| 1780 | 32.86 | 51.94 | 1.58 | 31.03 | 0.94 | 17.97 | 0.55 | 45.42 | 1.38 | 3.99 | 0.12 |
| 1820 | 34.94 | 66.18 | 1.89 | 34.71 | 0.99 | 21.98 | 0.63 | 59.09 | 1.69 | 4.01 | 0.11 |
| 1840 | 43.11 | 76.70 | 1.78 | 37.42 | 0.87 | 23.99 | 0.56 | 67.13 | 1.56 | 4.02 | 0.09 |
| 1910 | 29.94 | 66.16 | 2.21 | 38.75 | 1.29 | 30.35 | 1.01 | 87.21 | 2.91 | ||
| 1930 | 43.50 | 70.52 | 1.62 | 44.92 | 1.03 | 33.27 | 0.76 | 93.18 | 2.14 | ||
| 1950 | 36.08 | 71.15 | 1.97 | 51.06 | 1.42 | 34.89 | 0.97 | 101.63 | 2.82 | ||
| 1970 | 68.23 | 92.00 | 1.35 | 86.19 | 1.26 | 41.28 | 0.61 | 103.40 | 1.52 | ||
| 1990 | 77.45 | 131.67 | 1.70 | 128.74 | 1.66 | 61.47 | 0.79 | 118.62 | 1.53 | ||
| 2000 | 75.62 | 128.12 | 1.69 | 122.29 | 1.62 | 62.36 | 0.82 | 118.83 | 1.57 | ||
Publisher’s Note: MDPI stays neutral with regard to jurisdictional claims in published maps and institutional affiliations. |
© 2022 by the authors. Licensee MDPI, Basel, Switzerland. This article is an open access article distributed under the terms and conditions of the Creative Commons Attribution (CC BY) license (https://creativecommons.org/licenses/by/4.0/).
Share and Cite
MDPI and ACS Style
Hua, L.; Li, S.; Gao, D.; Li, W. Uncertainties of Global Historical Land Use Datasets in Pasture Reconstruction for the Tibetan Plateau. Remote Sens. 2022, 14, 3777. https://doi.org/10.3390/rs14153777
AMA Style
Hua L, Li S, Gao D, Li W. Uncertainties of Global Historical Land Use Datasets in Pasture Reconstruction for the Tibetan Plateau. Remote Sensing. 2022; 14(15):3777. https://doi.org/10.3390/rs14153777
Chicago/Turabian StyleHua, Lei, Shicheng Li, Deng Gao, and Wangjun Li. 2022. "Uncertainties of Global Historical Land Use Datasets in Pasture Reconstruction for the Tibetan Plateau" Remote Sensing 14, no. 15: 3777. https://doi.org/10.3390/rs14153777
Note that from the first issue of 2016, this journal uses article numbers instead of page numbers. See further details here.