Article

Research on the Evolutionary Path of Eco-Conservation and High-Quality Development in the Yellow River Basin Based on an Agent-Based Model

1
School of Management Science and Engineering, Shandong University of Finance and Economics, Jinan 250014, China
2
Institute of Marine Economy and Management, Shandong University of Finance and Economics, Jinan 250014, China
*
Author to whom correspondence should be addressed.
Systems 2022, 10(4), 105; https://doi.org/10.3390/systems10040105
Submission received: 16 June 2022 / Revised: 23 July 2022 / Accepted: 23 July 2022 / Published: 27 July 2022

Abstract

:
The high-quality economic and social development of the Yellow River Basin is a combined system comprising the coordinated development of “economy–resources–environment–society”, with resources and the ecological environment bearing capacity as the constraints, and green innovative development as the driving force. Based on the systematic analysis of the structural dimensions of the composite system, this paper uses the balanced indicators and their coordinated development effectiveness to describe the development quality of the macro-composite system. In order to reveal the mechanism of the evolutionary path of the macro system, the resource- and environment-bearing capacity, regional high-quality development potential, regional innovation capacity, and high-quality development guarantee capacity are adopted as the main attributes and decision-making basis of the autonomous agents. The simulation results show that, under the existing development model, the economic development of all of the provinces in the Yellow River Basin will be constrained by resources and the environment. However, different policy scenarios significantly affect the evolutionary trends of economic development, resource consumption, and the environmental pollution situation. The mechanisms to overcome the bottleneck of the resource and ecological constraints are different for these policies, and the effects of the same policy in different provinces are also not the same.

1. Introduction

With the increasing concern of humans regarding the issue of sustainable development, an increasing number of studies are exploring the path of sustainable economic development from the perspective of a complex eco-economic system (Sun et al., 2018) [1]. As economic development leads to a large concentration of the regional population, materials, and energy, and a high level of the consumption of resources, the ecological relationship becomes imbalanced; this reduces the ecological function of the natural system. Meanwhile, strict ecological constraints and the maintenance of ecological functions necessarily require constraints on economic growth, thus weakening the economic function of the system, which indicates a conflict between the two. At the same time, the improvement of the ecological function can improve the livelihoods and physical and mental health of watershed residents, which is conducive to the attraction of capital, talent, and other economic development factors, and has an important role in promoting the full exploitation of the economic function. Therefore, the two are unified, and there is a complex non-linear relationship between economic development and ecological and environmental protection that is antagonistic.
The Yellow River Basin is an important core area in China for food production, energy-rich areas, and raw chemical materials; it is an important industrial base, and serves multiple ecological functions as an important ecological resource protection area. In terms of economic and social development and ecological security, it occupies an important position. However, due to various factors, such as its history and natural conditions, the economic and social development of the Yellow River Basin is relatively lagging, and the ecological environment of the basin shows strong vulnerability. With increasing human economic activities, the shortage of water resources, water environment pollution, and the over-utilization of water resources in the Yellow River Basin are becoming more serious. The unbalanced development of the provinces and regions in the Yellow River Basin and the inadequate development of the nine provinces in the upper and middle reaches are becoming increasingly prominent. Based on multi-agent modeling technology, this paper constructs a computational, experimental model for high-quality economic and social development in each province and region of the Yellow River Basin, combines multi-dimensional equilibrium indicators of the composite system with the attributes and behaviors of the agents, contrasts and analyzes the evolutionary paths of eco-conservation and high-quality development in each province and city of the Yellow River Basin through evolutionary simulation analysis under multiple scenarios, and explores the systematic optimization schemes of policy strategies such as green innovation, regulatory constraints, ecological compensation, and upstream and downstream linkages.
The remainder of this paper is organized as follows: Section 2 reviews the relevant literature, Section 3 presents an analysis of the subsystem components from a complex system perspective and the basis for measuring the effectiveness of the coordinated development of complex systems, Section 4 describes the construction and rules of the agent-based model (ABM), Section 5 analyzes the simulation results in terms of different scenarios, and Section 6 presents the discussion and conclusions of this paper.

2. Literature Review

Since General Secretary Xi Jinping’s speech at the symposium on the eco-conservation and high-quality development of the Yellow River Basin in 2019, there has been an increasing amount of academic research on this topic (Ma et al.; Shi; Ren and Zhang) [2,3,4]. It is believed that synergistic development is the optimal solution to achieve ecological and social sustainability in the Yellow River Basin (Wang and Li) [5], and the “ecological priority” policy should be used as a guide to promote eco-conservation and high-quality development in the Yellow River Basin (Geng et al.) [6].
Research on the coordination relationship between two or more subsystems from the perspective of a composite system of the economy, society, resources, ecology, and the environment has become the basic framework for sustainable development issues (Fang et al.) [7]. Because of the complex non-linear coupling relationships among the subsystems, the process of coordinated development in composite systems is also the process of system coupling evolution (Sun et al.) [8]. The theory of the coordinated development of complex systems has been widely applied to the human environment (Srinivasan et al.) [9], the economic resource environment (Ma et al.) [10], the economic and social environment (Bastianoni et al.) [11], social ecology (Estoque and Murayama) [12], the urban environment (Li et al.) [13], and the climate economic environment (Aldieri and Vinci) [14]. Conceptual analysis and relationship analysis in the framework of the coordinated development of complex systems enrich the theoretical connotations of sustainable economic and social development. On the methodological side, environmental Kuznets curves (Zhao et al.) [15], coupled coordination models (Xing et al.) [16], gray models (GM) (Shi et al.) [17], autoregressive moving averages (ARMA) (Han et al.) [18], and machine learning algorithms (Li et al.) [19], etc., have been used for the analysis, evaluation, and prediction of composite systems.
In multi-objective complex systems, subsystems cooperate synergistically to transition from a disordered non-equilibrium state to a dynamic equilibrium state with certain functional and self-organizing structural mechanisms, which is a basic requirement for the coordinated development of complex systems (Turner) [20]. Based on complex system theory, synergy theory, and the idea of ecological civilization and green development in the “new normal” period, Zhao and Zhang divided the three regional unit subsystems in the spatial dimension into five subsystems: economic growth, social development, environmental quality, ecological health, and governance regulation [21]. They constructed a coordinated ecological development system composed of multiple interacting subsystems based on the state indicators and sequential parameters of each subsystem. Deng et al. used the gray water footprint and bearing capacity coefficients to predict the coupled evolution of the water environment and socioeconomic system under different scenarios in the Yangtze River Economic Zone based on physical and statistical models, and they accordingly proposed policy recommendations for the coordinated and sustainable development of the regional ecological environment and socio-economy [22]. In order to further clarify the mechanisms by which to achieve the performance goals, Kaplan and Norton proposed and enriched the balanced scorecard theory, and viewed it as a comprehensive strategic management and implementation tool for the translation of strategic goals into action [23,24,25]. However, the balanced scorecard neither establishes a causal relationship between indicators nor takes into account the time delay in the causal relationship; it is a diagnostic control system rather than an interactive control system (Ahn) [26].
As a bottom-up modeling approach, the multi-agent modeling technique offers the possibility to reveal the non-linear relationship between the global state of a complex system and the interaction of local constituent elements. Compared with modeling approaches based on system effects (such as System Dynamics (SD)) or process-oriented modeling approaches (such as Discrete-Event Simulation (DES)), ABM has unique research paradigm advantages, from individual behavior to macro “emergence”. It can better reflect the evolution mechanism and process of the complex system of the Yellow River Basin under resource and environmental constraints. Specifically, SD simulates the evolution of system development through the causal relationship between system elements. It is difficult to reflect the impact mechanism of environmental changes on the micro-individuals constituting the system, nor can it reflect the individual heterogeneity and the “emergence” of individual behavior response and individual interaction changes at the system level. Although DES has a high efficiency, reflecting the response of specific environment change, it is not suitable for a composite system because of its poor scalability and low coupling between modules. On the other hand, ABM reflects the differences of resource endowments in different regions through individual attributes such as environmental carrying capacity and innovation ability. It also reflects the heterogeneity of policy responses through individual behavior rules, and reflects the relationship between the upstream and downstream of the Yellow River Basin through individual interaction rules. When micro-adjustments of local agents accumulate to a certain extent, it will in turn restrict and affect the macro system environment, causing the agent to be in a dynamically changing environment and generate new evolution and learning momentum [27,28,29]. This will eventually lead to the appearance of deeper complex structural characteristics in the system. Therefore, ABM is suitable to simulate the evolutionary process deeply, and to reveal the micro-mechanism of the development of the Yellow River Basin. Multi-agent modeling technology is widely used in the study of the complex system evolution path. For example, Zhang et al. integrates the macro-factors (investment volatility) and micro-factors (individual behaviours) into a single analytical model, and simulates the evolutionary path of residential photovoltaic industry from the perspective of consumer behaviors [30]. Macal and North describe the following three elements as the basis of an agent-based model [31]:
(1)
a set of agents, including their attributes and behaviors;
(2)
a set of agent relationships, i.e., an underlying topology of connections that determines which agents interact with each other;
(3)
the agents’ environment, with which they can also interact.
In this paper, the Yellow River Basin’s eco-conservation and high-quality development system is regarded as a composite system of economy–resources–environment–society. Potential, regional innovation ability, and high-quality development guarantee ability, etc., are the attributes and decision-making basis of the basin’s constituent units. Based on multi-agent modeling technology, the economic development, resource consumption, and ecological environment development of the Yellow River Basin provinces under different policy scenarios are simulated, including their trends and evolution. Compared with existing studies, this study combines empirical data with simulation methods to reproduce the microscopic dynamics of the macro-level state changes of composite systems through virtual–real linkage, and visualizes the policy design by comparing and analyzing the intrinsic mechanisms and laws of the system’s evolution under different scenarios.

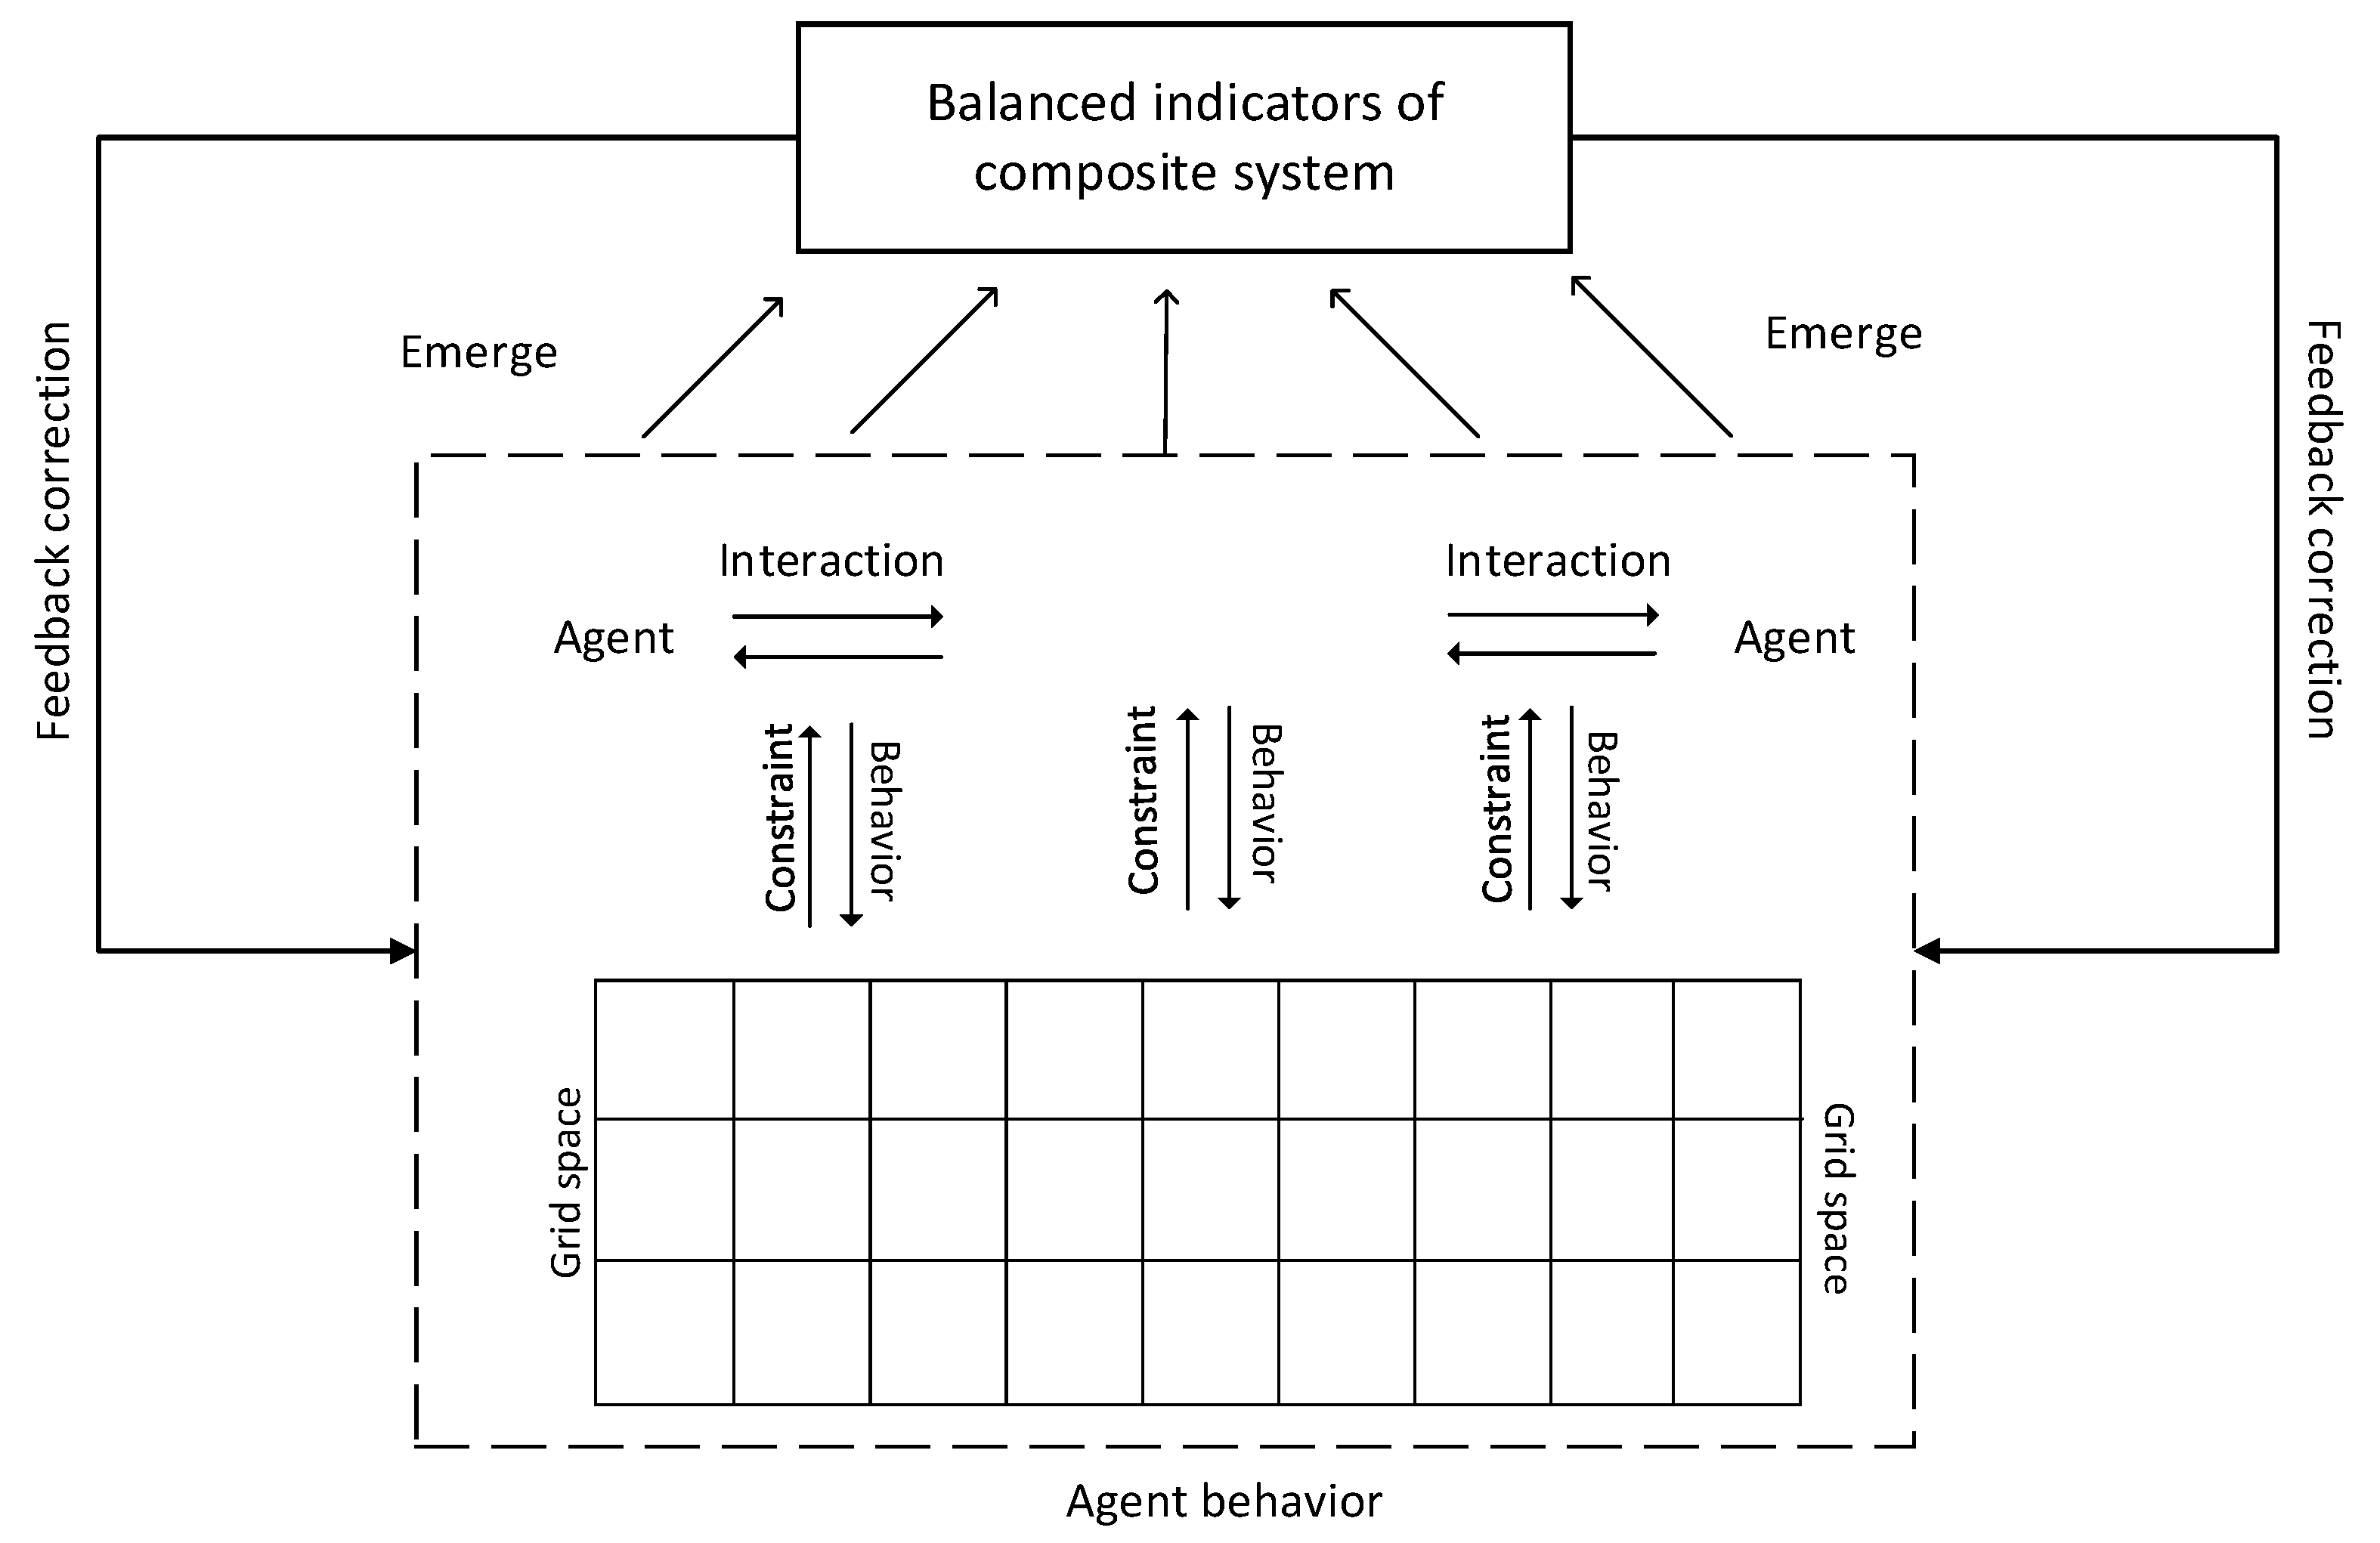
3. Analysis of the Composite System

This study focuses on the measurement of the state of high-quality development in the Yellow River Basin by constructing a balanced framework and tracking the evolutionary characteristics of key indicators across regions within the basin under different policy scenarios. To this end, based on complex systems theory and from the perspective of the complex multi-factors affecting the level of industrial water resource utilization, this paper builds a conceptual model of the economy–resource–environment–society complex system, incorporating economic development and natural resource development and utilization, including water resources, into the research scope. Due to the materiality of human life and the diversity of activities, it is difficult to objectively distinguish between resources, the environment, the economy, and society, which have formed a coupled and complex relationship of interaction, interconnection, and mutual influence among themselves and their subsystems and elements. In this context, the indicators are screened and theoretically analyzed using the theory of the human–earth relationship, based on relevant domestic and international literature on the design of economic, social, natural resource, and environmental indicators.
The relationship between subsystems in the composite system of eco-conservation and high-quality development in the Yellow River Basin is formed by the development of three levels of systematic coupling: (1) the coupling within a single subsystem develops in a coordinated manner, (2) the coupling between the two subsystems develops in a coordinated manner, and (3) the coupling between the systems develops in a coordinated manner. The three levels of the system constitute a complex system with their characteristics, structure, and function through various types of influence mechanisms, such as mutual influence, interdependence, and interaction, and this complex system—along with its characteristics, structure, and function—can be expressed using the following equation:
M C S S 1 ,   S 2 , S 3 , S 4 , R e l   ,   R s t ,   O b ,   S i E i , C i , F i ,   i = 1 , 2 , 3 , 4
Here, S I represents the ith subsystem, and E i , C i ,   and   F i refer to the characteristics, structure, and function of the subsystems.   R e l denotes the coupling relation of mutual influence, interdependence, and interaction in the system coupling, which is called the system coupling set. It includes not only the internal coupling relation of the four subsystems but also the coupling relations between subsystems. Rst is a set of constraints faced by the subsystems, and Ob refers to the goals to be achieved by each subsystem. The coupling structure of the resources–environment–economy–society system in the Yellow River Basin is shown in Figure 1.
The concepts of the four subsystems of the economy, society, resources, and the environment are separately extrapolated and defined, and the concepts of the economy (gross regional product, economic structure, etc.), society (employed population, education expenditure, science, and technology investment; the share of cultural and recreational expenditure in consumption expenditure; per capita disposable income, etc.), resources (water resources, land resources, forest coverage, ecological adaptability, etc.), and the environment (industrial waste gas in relative emissions of pollutants, wastewater emissions, energy consumption per unit of gross regional product, etc.) are clarified. The specific index system of each subsystem is selected to reflect both the basic characteristics and comprehensive effects of each subsystem, and to include the key variables that affect the change in the state of each decision unit. This paper evaluates the relative effectiveness of decision-making units (DMUs) with multiple inputs and outputs using Data Envelopment Analysis (DEA) measures. Because the C2R model is an ideal and effective method to study “production sectors” with multiple inputs, especially “production sectors” with multiple outputs that are “scale-efficient” and “technically efficient” at the same time, the C2R model cannot simply evaluate the technical validity between sectors; the C2GS2 model compensates for the shortcomings of the C2R model, and is an ideal method to study the relative technical validity between production sectors. Therefore, in this paper, the C2R model is used to analyze the comprehensive effect of the decision unit, and the C2GS2 model is used to analyze its specific technical effect. Taking the coupling relationship between subsystem A and subsystem B as an example, the coordinated development effectiveness function of both, based on the C2R model, is
Z e A / B = min θ e A / B     s . t . j = 1 n x A j γ A / B j + s = x A 0 θ e A / B                         j = 1 n y B j γ A / B j s + = y B 0                                                             γ A / B j 0 ,   j = 1 , 2 , , n ; s + 0 ; s 0                        
where Z e A / B denotes the coordination development effectiveness of subsystem A on subsystem B; the denominator is the input of subsystem A; the numerator is the output of subsystem B; n is the number of decision units; x and y are the input and output quantities of the subsystem, respectively; and s and s + are slack variables.
Similarly, the coordination validity function of subsystem A and subsystem B based on the C2GS2 model is
X e A / B = min σ e A / B     s . t . j = 1 n x A j γ A / B j + s = x A 0 σ e A / B                         j = 1 n y B j γ A / B j s + = y B 0                                                                 j = 1 n γ A / B j = 1                                                                                                   γ A / B j 0 ,   j = 1 , 2 , , n ; s + 0 ; s 0                        
The developmental validity of subsystem A for subsystem B is calculated by the following equation:
F e A / B = Z e A / B /   X e A / B
As a result, the coordination validity, development validity, and coordinated development validity of the four subsystems of resources, ecology, the environment, and the economy, as well as society, are expressed as follows:
X e 1 , 2 , , k = i = 1 4 X e i / i ¯ k 1 × X e k 1 i / i ¯ k 1 i = 1 4 X e k 1 i ¯ k 1
Z e 1 , 2 , , k = i = 1 4 Z e i / i ¯ k 1 × Z e k 1 i / i ¯ k 1 i = 1 4 Z e k 1 i ¯ k 1
F e 1 , 2 , , k = Z e 1 , 2 , , k /   X e 1 , 2 , , k
Here, X e , Z e , and   F e refer, respectively, to the coordination validity, coordinated development validity, and development validity of the four subsystems; k = 4, i ¯ k 1 refers to the set of different forms of any other k − 1 subsystems except a single subsystem i. The formula Z e k 1 i ¯ k 1 refers to the coordinated development among k − 1 subsystems, and the formula Z e k 1 i / i ¯ k 1 refers to the coordinated development validity of any other k − 1 subsystems.

4. Construction of the Agent-Based Model

In order to further study the dynamic process and evolutionary law of the synergistic evolution of the subsystems in the Yellow River Basin at different scales, and to reveal the influence mechanisms of policy scenarios such as innovation policy, environmental regulation, and ecological compensation on the high-quality economic and social development of the provinces and regions in the Yellow River Basin and the evolutionary law of the synergistic development of the composite system, this section summarizes the factors affecting the effectiveness of the coordinated development of the Yellow River Basin into four dimensions, namely the resource and environmental bearing capacity of the basin, the guaranteed capacity of high-quality development, the potential for the high-quality development of the region, and the innovation development capacity of the region. The interaction mechanism between the behavioral results of the agents and the coordinated development states of the system is shown in Figure 2.
In this work, we used the sample data of each province, region, and prefecture-level city in the Yellow River Basin from 2010 to 2018 as training data to construct an experimental model and compute a multi-agent framework for high-quality development in the Yellow River Basin. The data were mainly derived from the China Statistical Yearbook, China Environmental Statistical Yearbook, China Industrial Enterprise Database, China Industrial Enterprise Pollution Emission Database, China Ecological and Environmental Status Bulletin, China Water Resources Statistical Yearbook, China Water Resources Bulletin, and China City Statistical Yearbook, etc. The model is mainly composed of two parts: the agent and the spatial grid. The agent is mainly a virtual individual reflecting the economic and social characteristics and behaviors of each region. In addition to the spatial grid’s need for the representation of its own assigned spatial environmental characteristics, it also stores a wide range of policy and statistical information which is needed for computation. In the process of a specific operation, the agent will make subjective decisions based on spatial attribute information provided by the grid, and the results of the agent’s behavior will be reflected in the changes in various indicators and affect the overall coordinated development status and environmental layout of the watershed.

4.1. Agent Properties and Evolutionary Rules

Agent resource and environment bearing capacity includes natural resource variables (water resources, land resources, forest cover, ecological adaptability, etc.), the population bearing capacity, and environmental resource variables (including the relative emissions of pollutants in industrial waste gas, wastewater emissions, etc.). The resource and environmental bearing capacity is a key constraint for the high-quality development of the Yellow River Basin. Because the system model estimates the future environmental bearing capacity, the traditional method of calculating the regional resource and environmental bearing capacity is not applicable. Here, we use the resource and environmental capacity to measure the size of the regional resource environmental bearing capacity. The functional relationship is
B t = f b S o u t i , P e p t , E n v t j  
where B t is the resource bearing capacity of the region in year t, S o u t i is the stock of natural resources of category i in year t, P e p t is the total population in year t, and E n v t j is the stock of environmental resources of category j in year t. The values of the above variables are all relative values, with 2018 as the base period.
Agent development potential is the way in which the factor capacity of a region’s high-quality development is quantified, including the regional GDP, energy consumption per unit of output value, and pollutant emissions per unit of output value, etc. The function relationship is
G t = f g G d p t i , E n g t i , P o l t i
Here,   G t is the comprehensive evaluation result of the region’s high-quality development potential in year t.   G d p t i , E n g t i , and   P o l t i are the gross regional product, energy consumption per unit of output value, and pollutant emission per unit of output value of the industry category i in year t, respectively, and the values are taken as relative values with 2018 as the base period.
Agent innovation capability is a characterization of the level of science and technology development and innovation capacity of a region, including the level of science and technology (scientific and technological talent, R&D institutions, number of patents, etc.), labor force, and investable R&D funds, etc. The functional relationship is
N t = f n T e c t , L a b t , F i n t
where N t is the innovation development capacity of the region in year t; T e c t , L a b t , and   F i n t are the science and technology level, labor force, and investable R&D funds of the region in year t, respectively, and the values are taken as relative values, with 2018 as the base period. The investable R&D capital is related to the total regional GDP and R&D investment strength.
F i n t = G d p t i × σ t
where σ t is the share of R&D investment in GDP in year t; due to the uncertainty of research development and innovation activities, the following conditions need to be satisfied in order for R&D investment to drive the progress of science and technology:
1 e θ w × F i n t u   0 , 1
θ w is the speed control parameter of scientific and technological progress, and u is randomly distributed within (0, 1), reflecting the uncertainty of innovation activities. If the above conditions are satisfied, this indicates that the innovation activity of R&D investment has achieved specific results and the level of science and technology has been improved:
T e c t = T e c t 1 + θ e 1 × u 0 , 1 × T e c m a x T e c t 1
G d p t i = G d p t 1 i + θ e 2 × u 0 , 1 × ( 1 ρ t ) × G d p m a x G d p t 1
E n g t i = E n g t 1 i θ e 3 × u 0 , 1 × ρ t × E n g t 1 E n g m i n  
P o l t i = P o l t 1 i θ e 4 × u 0 , 1 × ρ t × P o l t 1 P o l m i n  
θ e 1 ,   θ e 2 , θ e 3 , and θ e 4 are the control parameters of the change rate of the technology level, regional GDP, energy consumption per unit of output value, and pollutant emission per unit of output value, respectively. T e c m a x and G d p m a x are the limit values of the maximum growth rate of the technology level and regional GDP, respectively (only the contribution of technological progress is considered for regional GDP in the forecast year). E n g m i n and P o l m i n are the limit values of the reduction rate of energy consumption per unit of output value and the pollutant emission per unit of output value. ρ t denotes the importance of R&D activities for environmental performance, respectively, and is related to the industrial policy of the region.
Energy consumption per unit of output value and pollutant emissions per unit of output value change the environmental resource variables, and the functional relationship is expressed as
E n v t j = f e ( G d p t i × E n g t i ) , ( G d p t i × P o l t i )  
The labor force variable is related to regional economic development and livability (a function of resource and environmental bearing capacity). It causes regional population changes, and the changes in the population variables and environmental resource variables change the regional resource and environmental bearing capacity. It is assumed that when the regional resource and environmental bearing capacity reach a threshold value that can be sustained, the regional environment deteriorates, the labor force is lost, and the rate of scientific and technological progress, θ w , decreases.
Agent development security capacity is used to consider the degree of government, society, and public support for the region’s high-quality development, including infrastructure construction, the service guarantee, information sharing, and environmental protection and governance, etc.; it has a functional relationship with parameter ρ t , which improves environmental performance:
ρ t = f v V g , V s , V p , V c  
V g , V s , V p , and V c represent the degree of government, society, public participation, and support for the development and the degree of improvement in related policies.
Regarding the rules of agent evolution, based on the empirical data analysis, a probabilistic language set is used to express the empirical rules of the historical dataset. Specifically, the language set S = s 0 :   low ,   s 1 :   lower ,   s 2 :   average ,   s 3 :   higher ,   s 4 :   high is used to describe the data of various indicators affecting total factor productivity and regional policy information data, etc., for each year from 2010 to 2018, and is categorized into the regional resource and environmental bearing capacity, high-quality development guarantee capacity, regional high-quality development potential, and regional innovation development capacity in four dimensions. The comprehensive evaluation results of each dimension are expressed in a probabilistic language set, as follows:
X t , i = s α p α | s α S , 0 p α 1 , α = 0 , 1 , 2 , τ , α = 0 τ p α = 1  
where X t , i represents the comprehensive evaluation results of each dimension index in year t, respectively, and s α p α is the probability language variable, which is the probability p α related to the language term s α .
The evolution rules of each year in the historical data are expressed as X t 1 , i X t , i ; in other words, based on the comprehensive evaluation results of the historical data, the equilibrium relationship between the development of the four dimensions of the year (such as the expected development level based on the current situation of high-quality development supportability) is predicted. Based on the evaluation results of each factor in the above period, the possibility of approaching the previous evaluation results is found from the historical dataset. The distance measurement method of the rule reference was adopted from Yu et al. (2018):
Suppose that h s p = s α p α | α = 0 , 1 , , τ and h s p = s β p β | = 0 , 1 , , τ are two probabilistic linguistic sets; then, the distance between them is defined as
d   h s p , h s p = 1 2 1 τ s α p α m i n s α p α h s p f s α p α f s β p β r + 1 τ s β p β m i n s β p β h s p f s β p β f s α p α r 1 r  
where f is a semantic scale function that can be defined as
f s α = α τ α = 0 , 1 , , τ  
When r = 1, Formula (18) can be simplified as the Hamming–Hausdorff distance.
Regarding the quantitative methods for interaction of spatial lattices, according to Tobler’s (1970) first law of geography, similar areas in space have a higher interaction intensity. Distance is an important factor in the interaction of the ecological environment in the upper and lower reaches of the Yellow River Basin. The ecological environment in the upper reaches of the Yellow River Basin has distance decay characteristics. Referring to the distance decay estimation method in geography, the influence of distance on spatial interaction is represented by the Wilson maximum entropy model, as follows:
G i j = A i P i B j P j f d i j
Here, G i j is the degree of ecological impact between region i and region j, P i and P j reflect the sizes of the two regions, A i and B j are the normalized factors of regional scale, and the distance decay function f d i j represents the function with distance d as the independent variable to describe the influence of distance factors. This model adopts the following exponential distance decay function:
f d = e γ d ( γ > 0 )
where γ is the distance decay function factor.

4.2. Parameter Setting

In this study, the public parameters required for the system simulation and the attribute parameters of each region are set based on the training of sample data, and the values of each parameter are first standardized in the specific application. For the change speed parameters, such as the speed of technological progress, the level of science and technology, GDP, the energy consumption per unit of output value, and the pollutant emission per unit of output value, the system adopts the method of multiple simulation training and comparison with adjustment.
The system’s main variables and their initial assignment rules are shown in Table 1.
The specific attribute parameter settings affect the simulation results of the system, such that the correspondence with the empirical results is considered in the parameter settings as much as possible, and the universality and representativeness are considered. Because the detailed design and parameter setting affect the research results, research based on a multi-agent model should pay attention to the “virtual-reality linkage”. That is, through the comparison of simulation results and real data, the rationality of the model should be tested. This method is good at comparing and analyzing the results of system evolution under different scenarios. As the change of parameters means the change of the environment, it is convenient to visually analyze the impact differences of different policies for the same object under the same rules. Because of the complexity and uncertainty of the evolutionary path of the actual system, the multi-agent model in this paper may not accurately predict the future. It is simplified to the above attributes and behavior rules. The results of the simulation experiments are only used for the comparison of different scenarios.

5. Simulation of High-Quality Development Evolution under Different Scenarios

In order to compare the evolution paths of eco-conservation and high-quality development in the Yellow River Basin under different scenarios, the following scenarios were designed for comparative experiments:
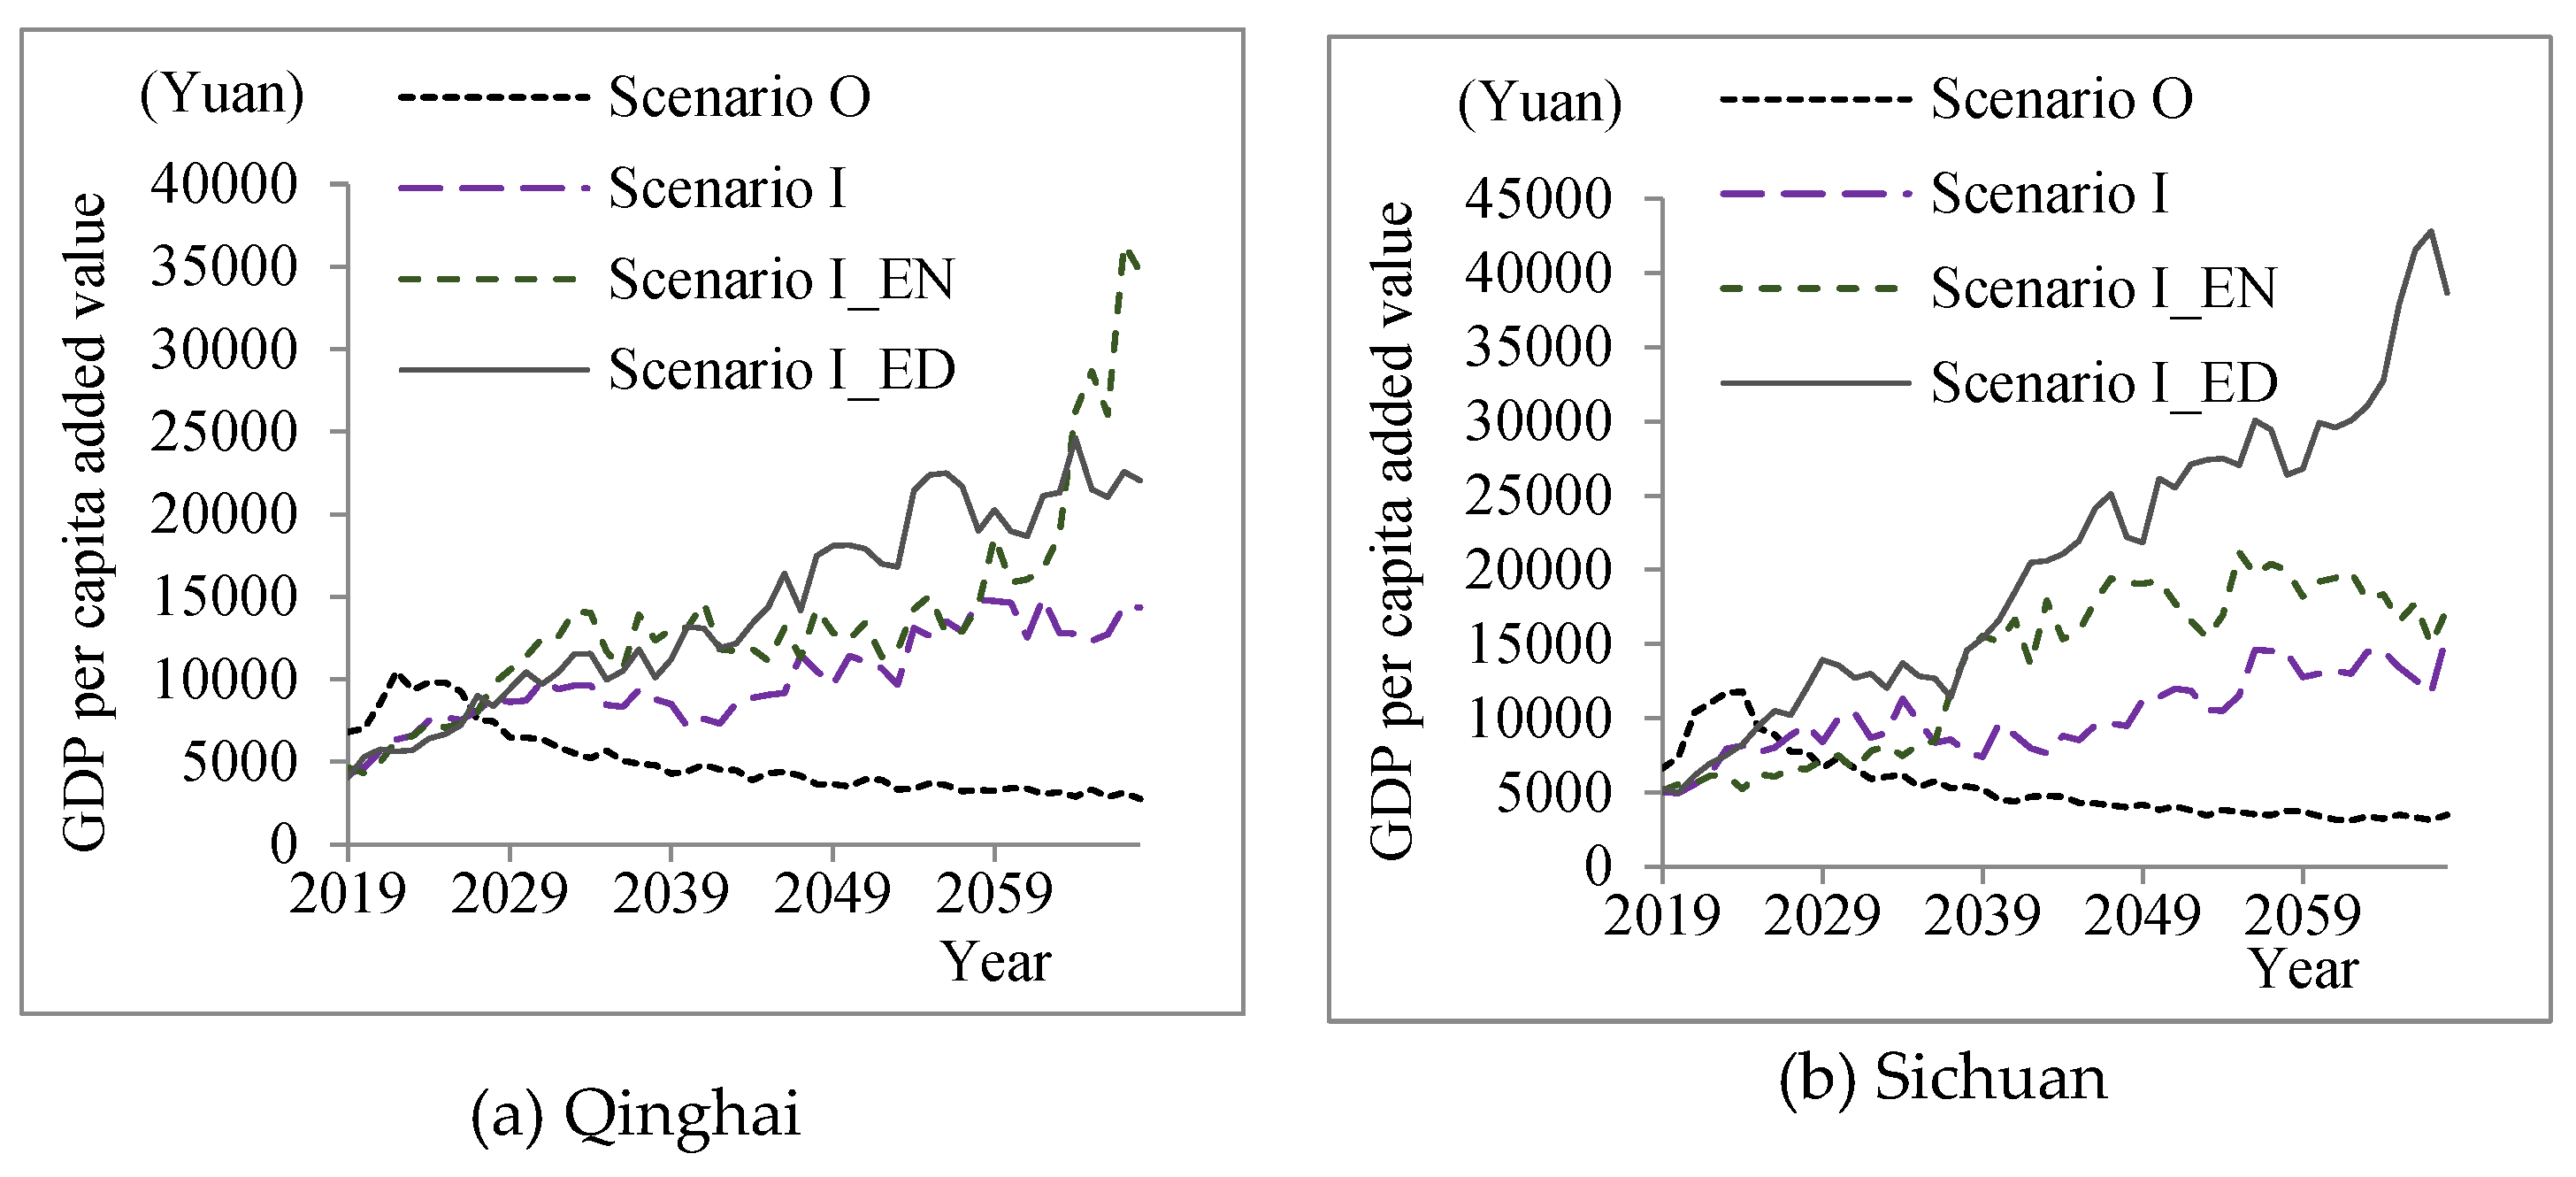
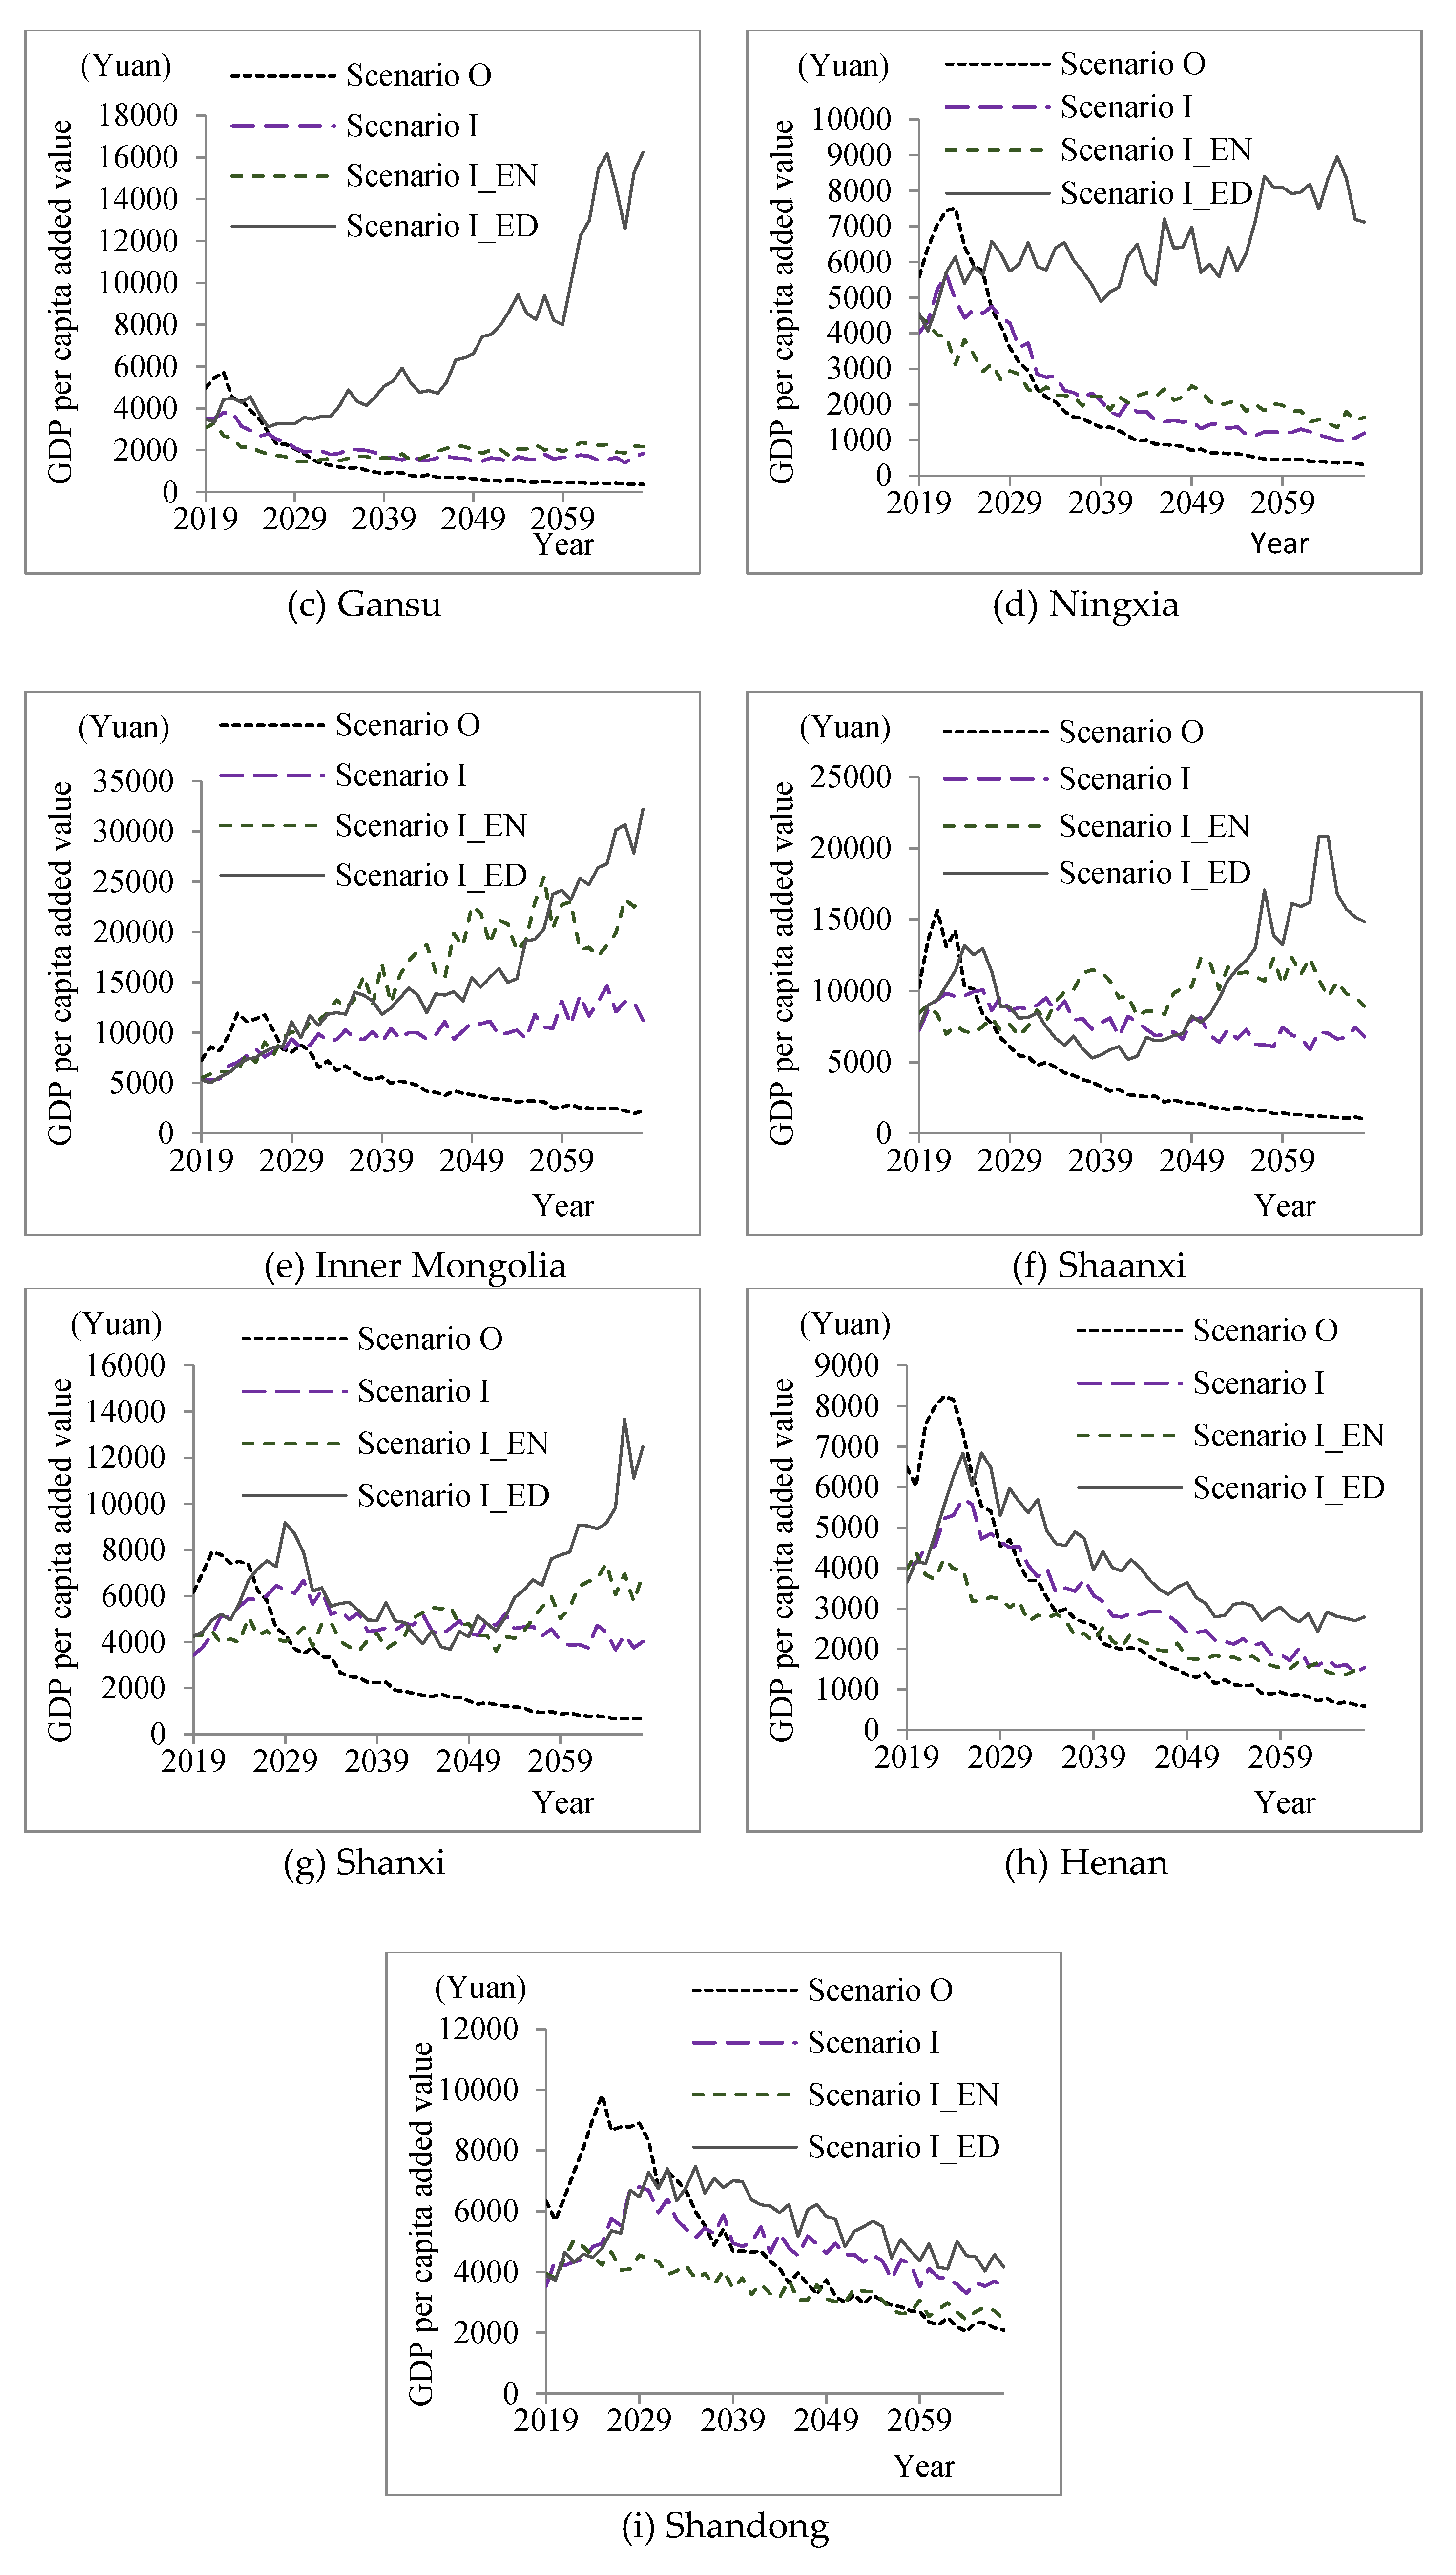
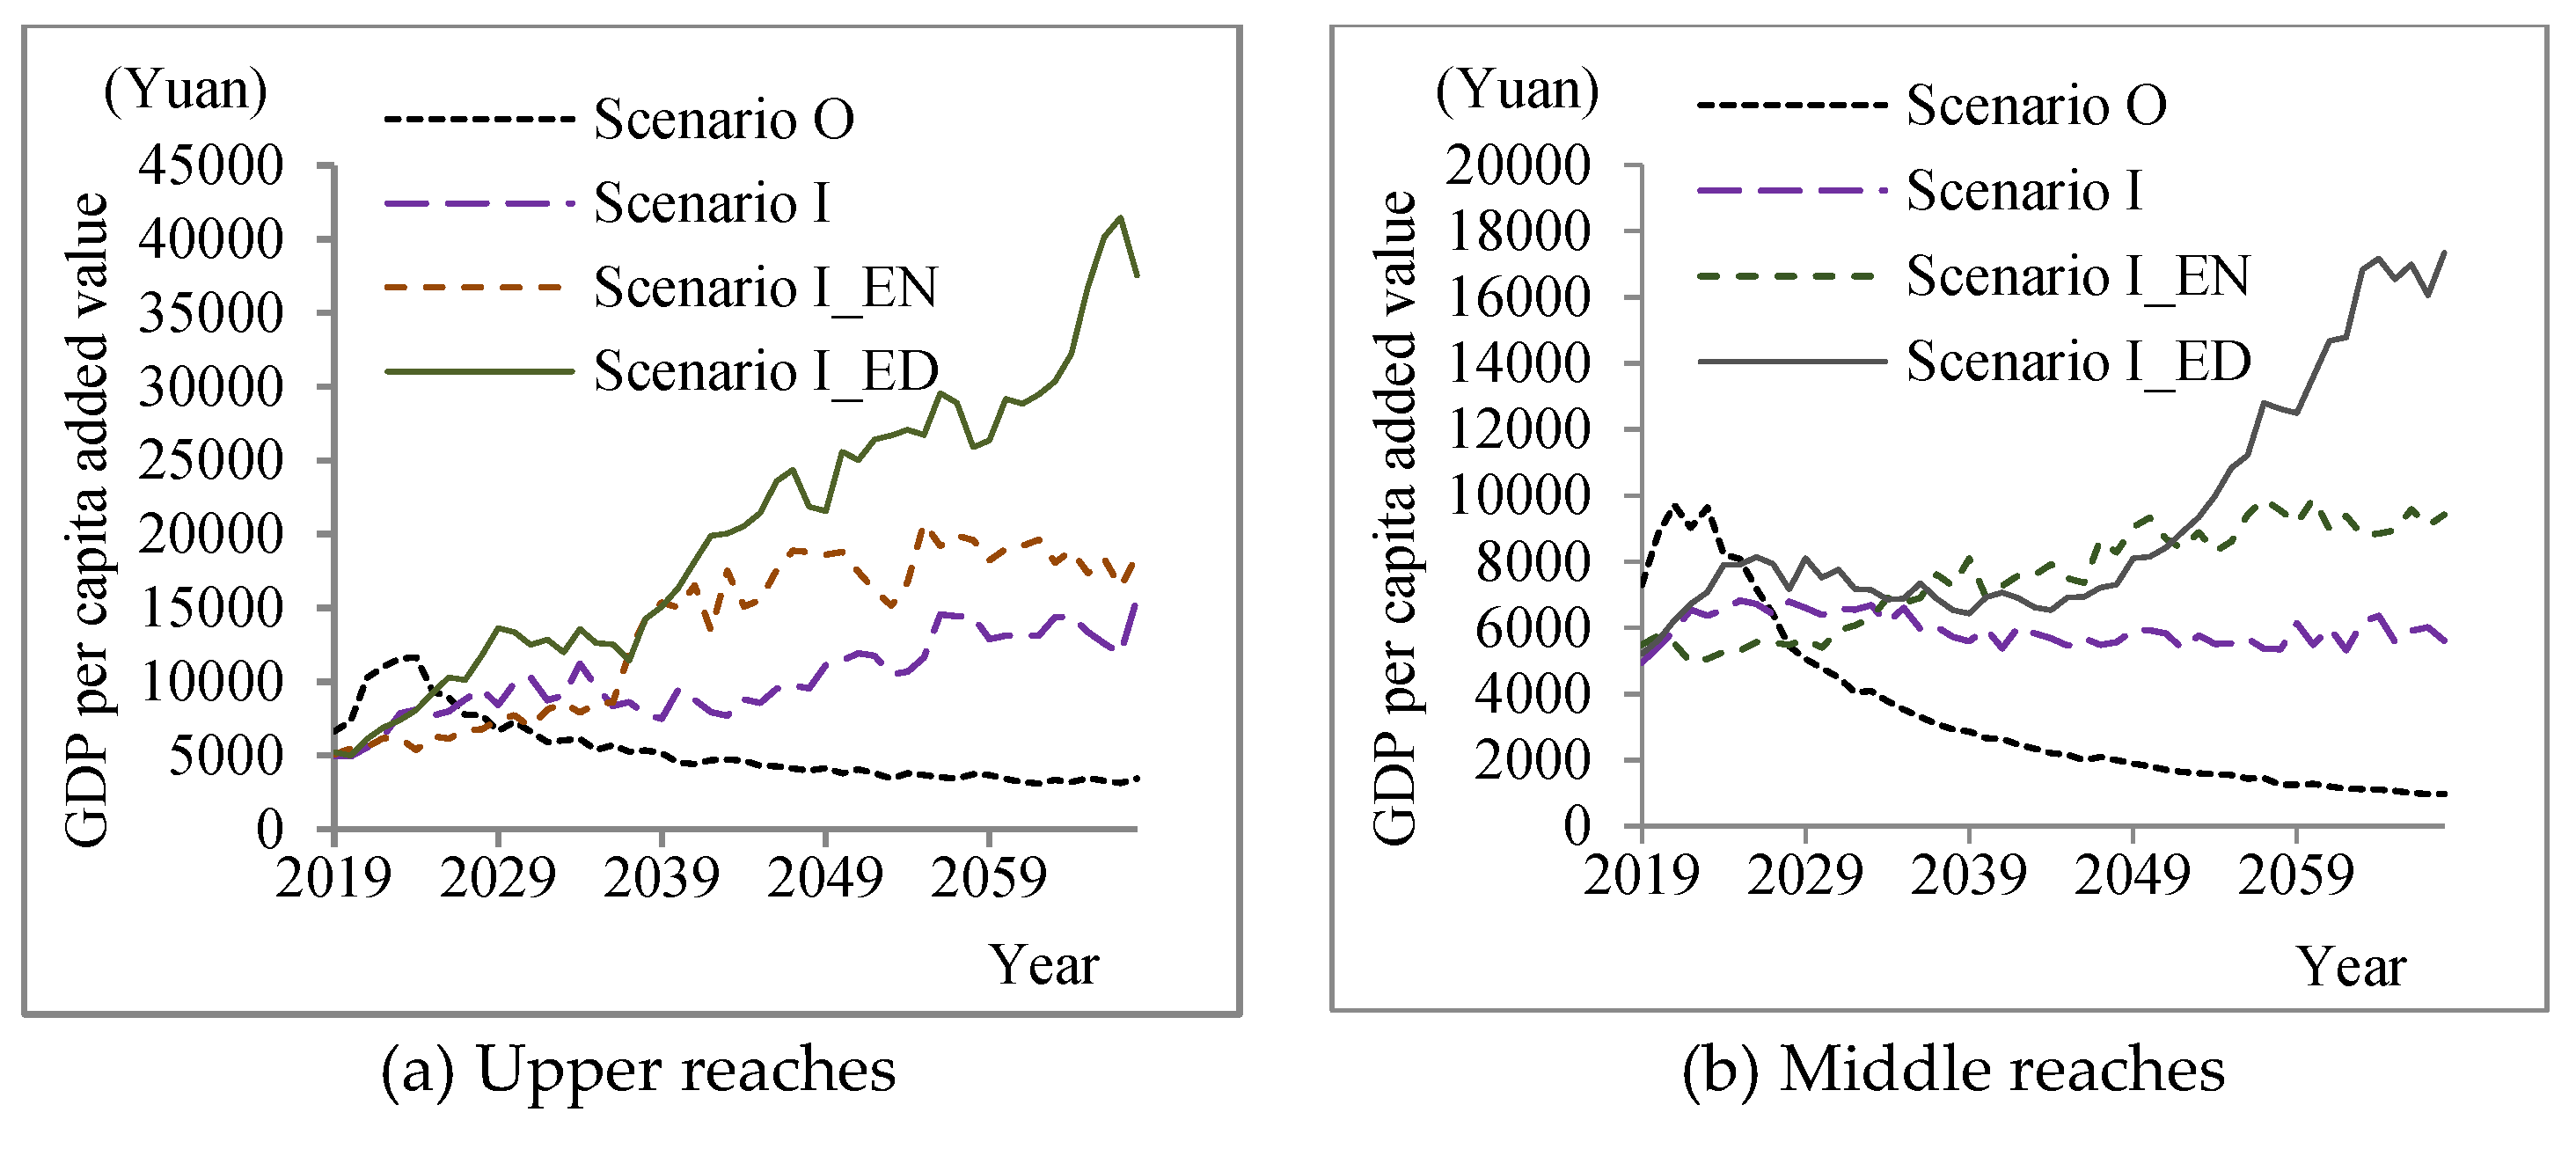
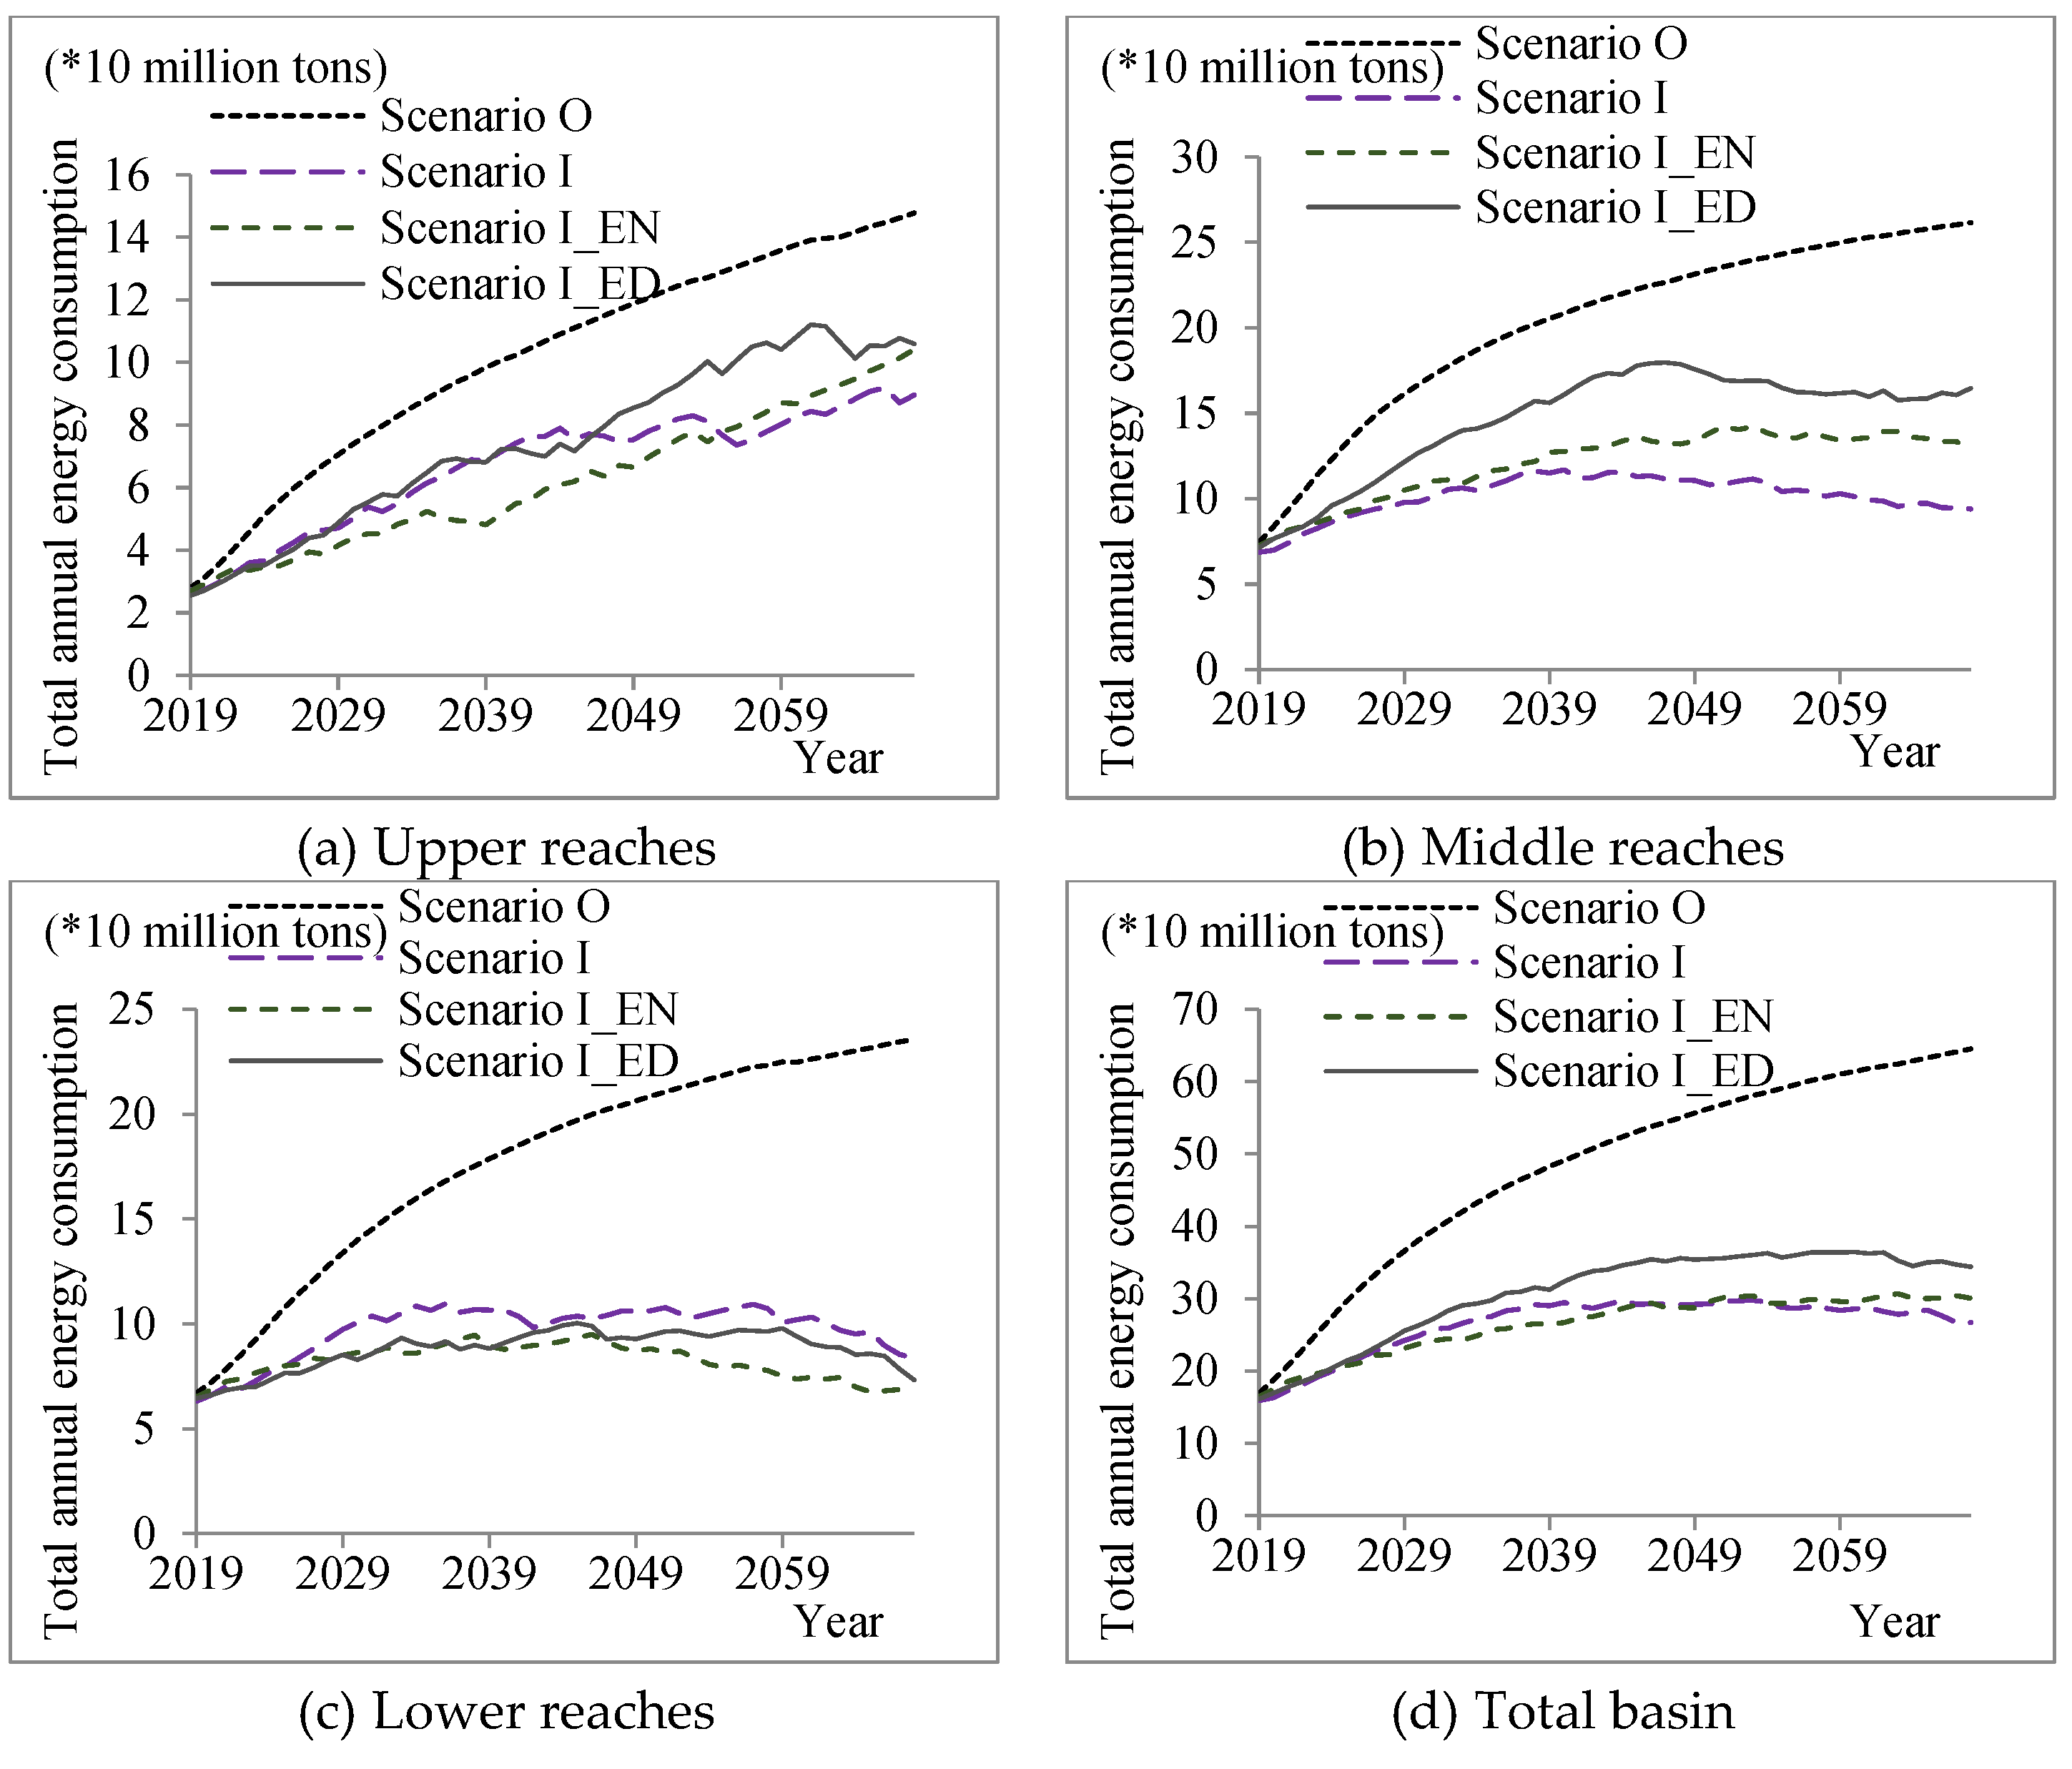
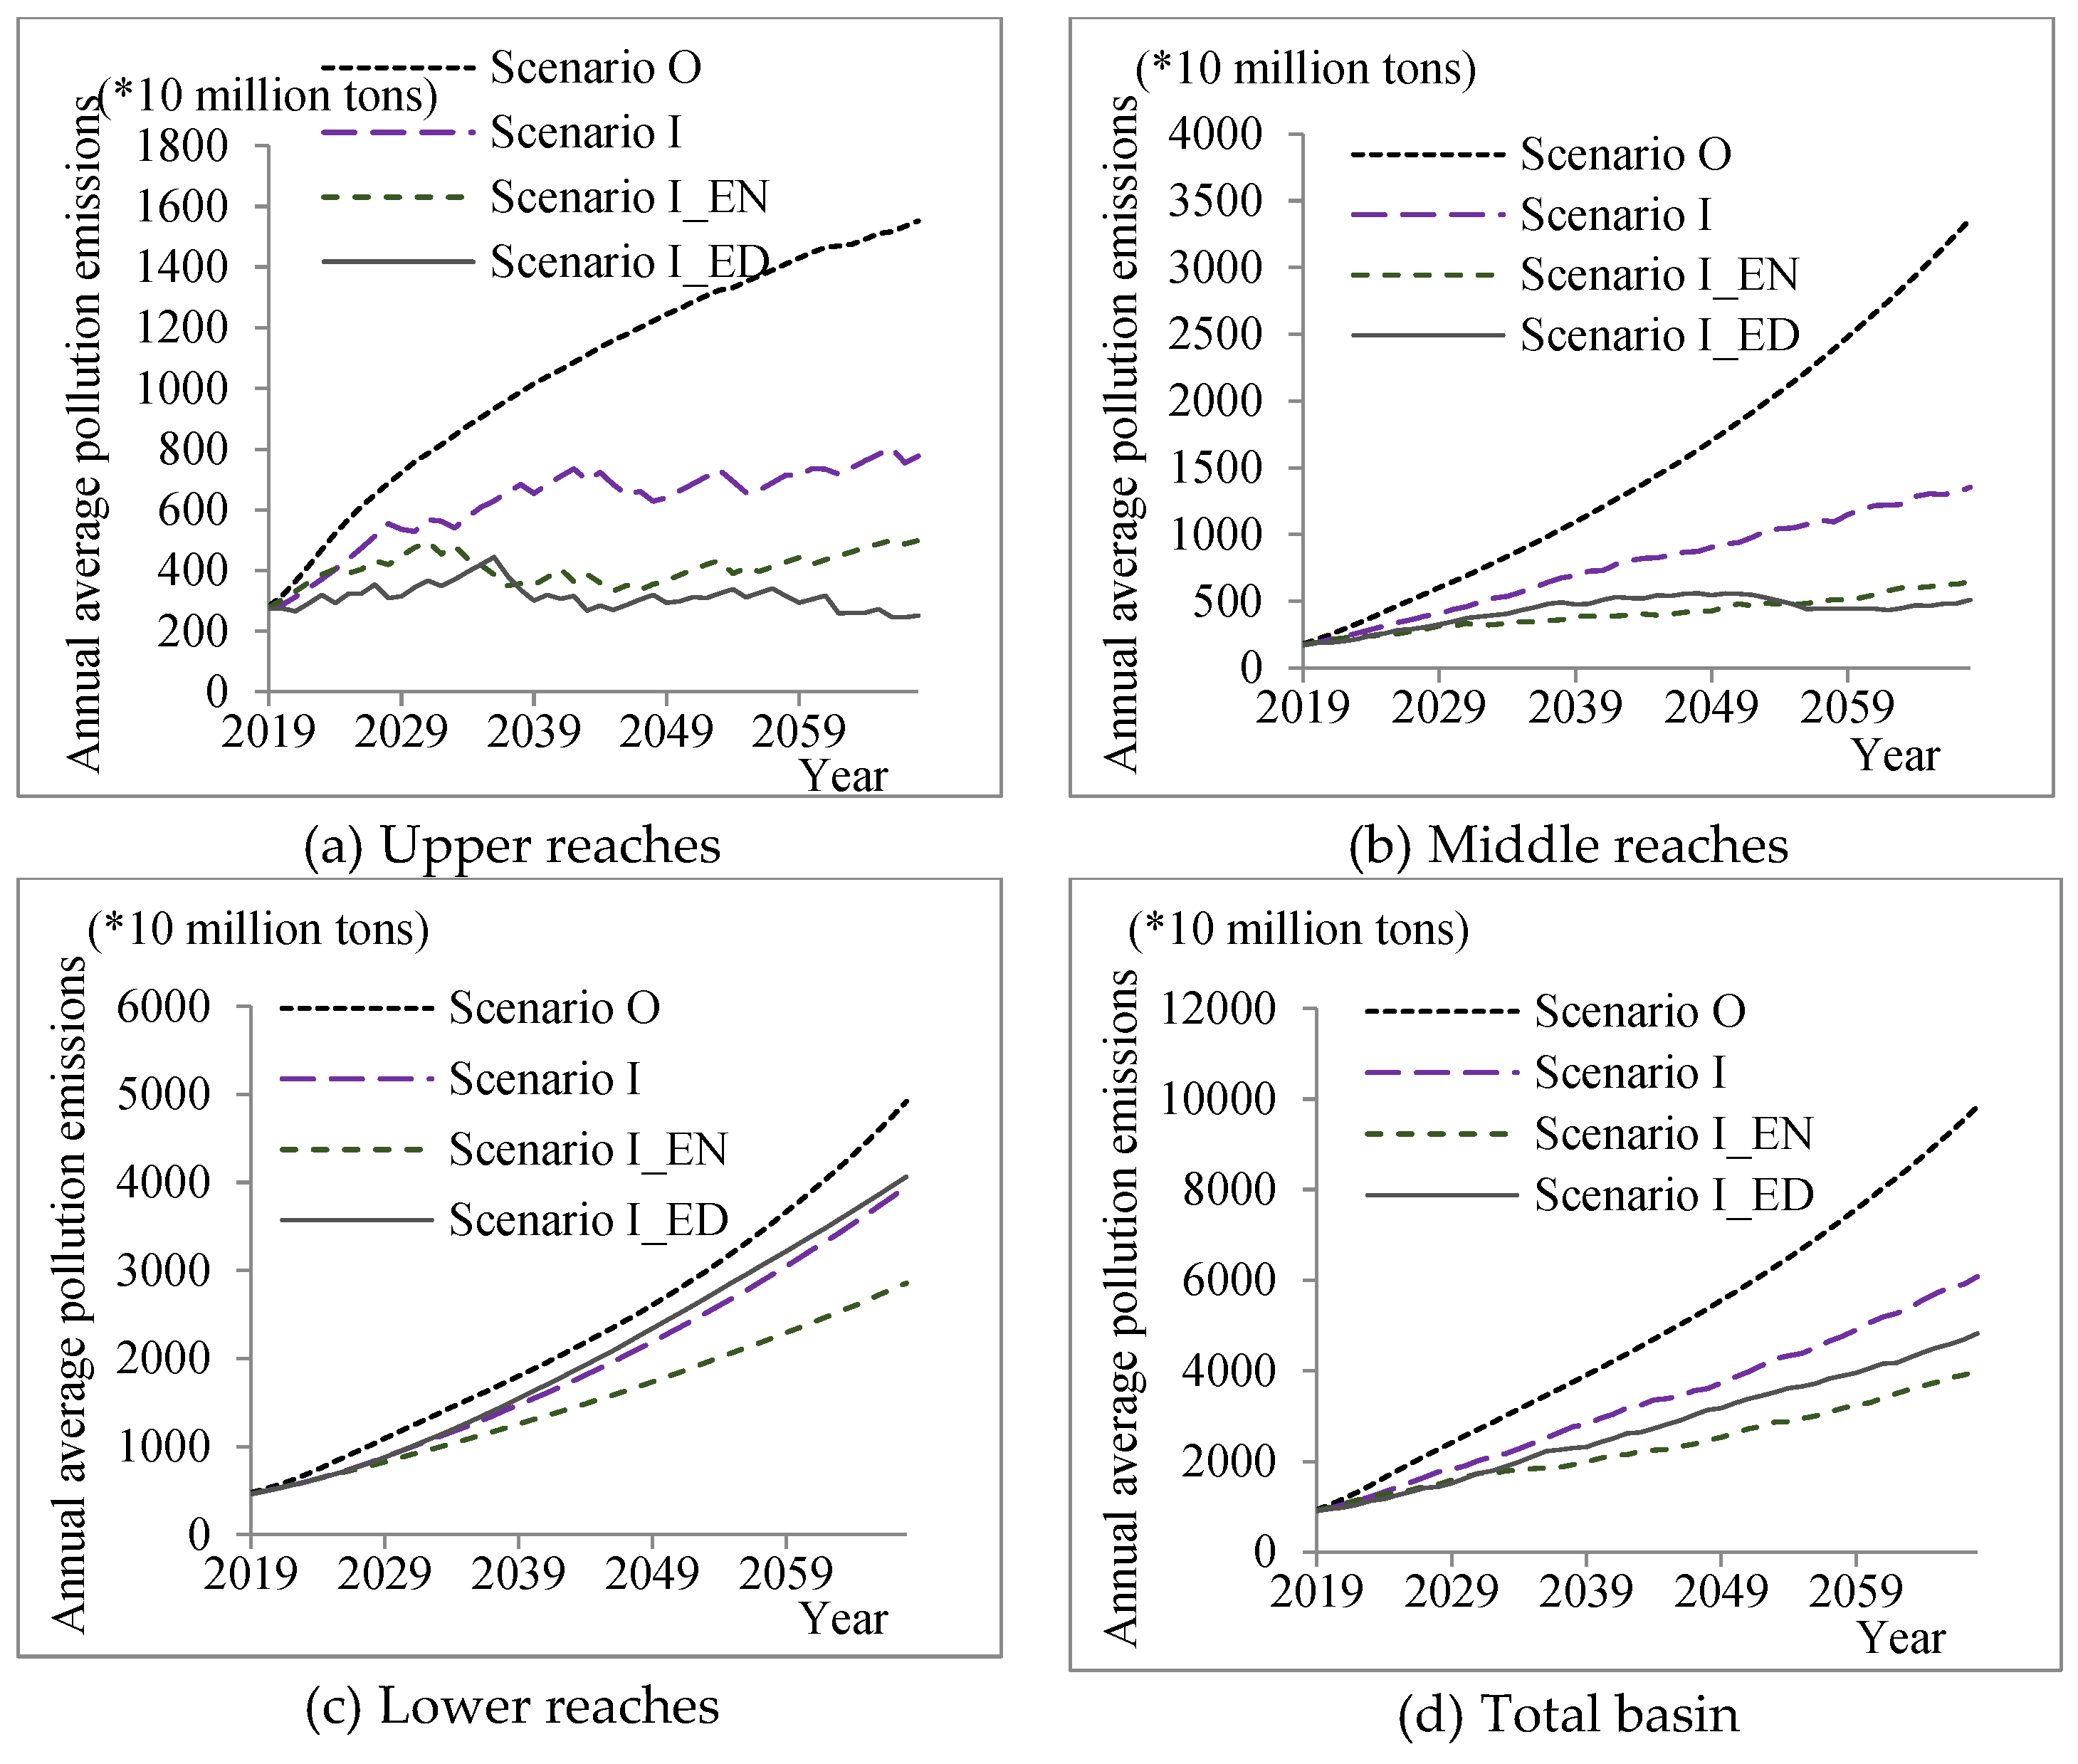
  • O: The economic development model without policy instrument intervention. According to the profit-maximization principle, industries conduct their economic activities, and R&D investments are focused on improving production efficiency and reducing production costs.
  • I: Economic policy development model related to green innovation. This promotes the high-quality development of green innovation through economic incentives.
  • I_EN: The combined development model of green innovation with no different ecological environment constraints throughout the whole basin. On the one hand, it promotes green innovation through economic incentives and other means, and on the other hand, it adopts indiscriminate ecological and environmental protection constraints in all provinces in the Yellow River Basin.
  • I_ED: A combined development model of green innovation and differentiated ecological and environmental constraints in the upper, middle, and lower reaches. On the one hand, green innovation is promoted through economic incentives and other means. On the other hand, differentiated ecological and environmental protection constraints are applied to the provinces in the upper, middle, and lower reaches of the Yellow River Basin, with the lower reaches being compensated according to the ecological and environmental level of the upper reaches.
The computational experiment platform of the proposed model was developed with Delphi Xe 11.1, and Oracle 11g was adopted as the database tool. Based on the powerful PASCAL language, Delphi has a good database interface and a friendly visual programming environment. Its convenient modular design is flexible for function expansion and policy scenario setting. The initial values of the system evolution simulation are based on 2018 data, and the evolution statistics of each region’s economy, society, resources, and environment under different scenarios are obtained after calculation experiments. The year is taken as the simulation evolution cycle, and the evolution cycle is set to 50 years. In order to eliminate the influence of random factors on the evolution results, each scenario is simulated 100 times, and the average value of multiple simulations is taken as the final evolution result.

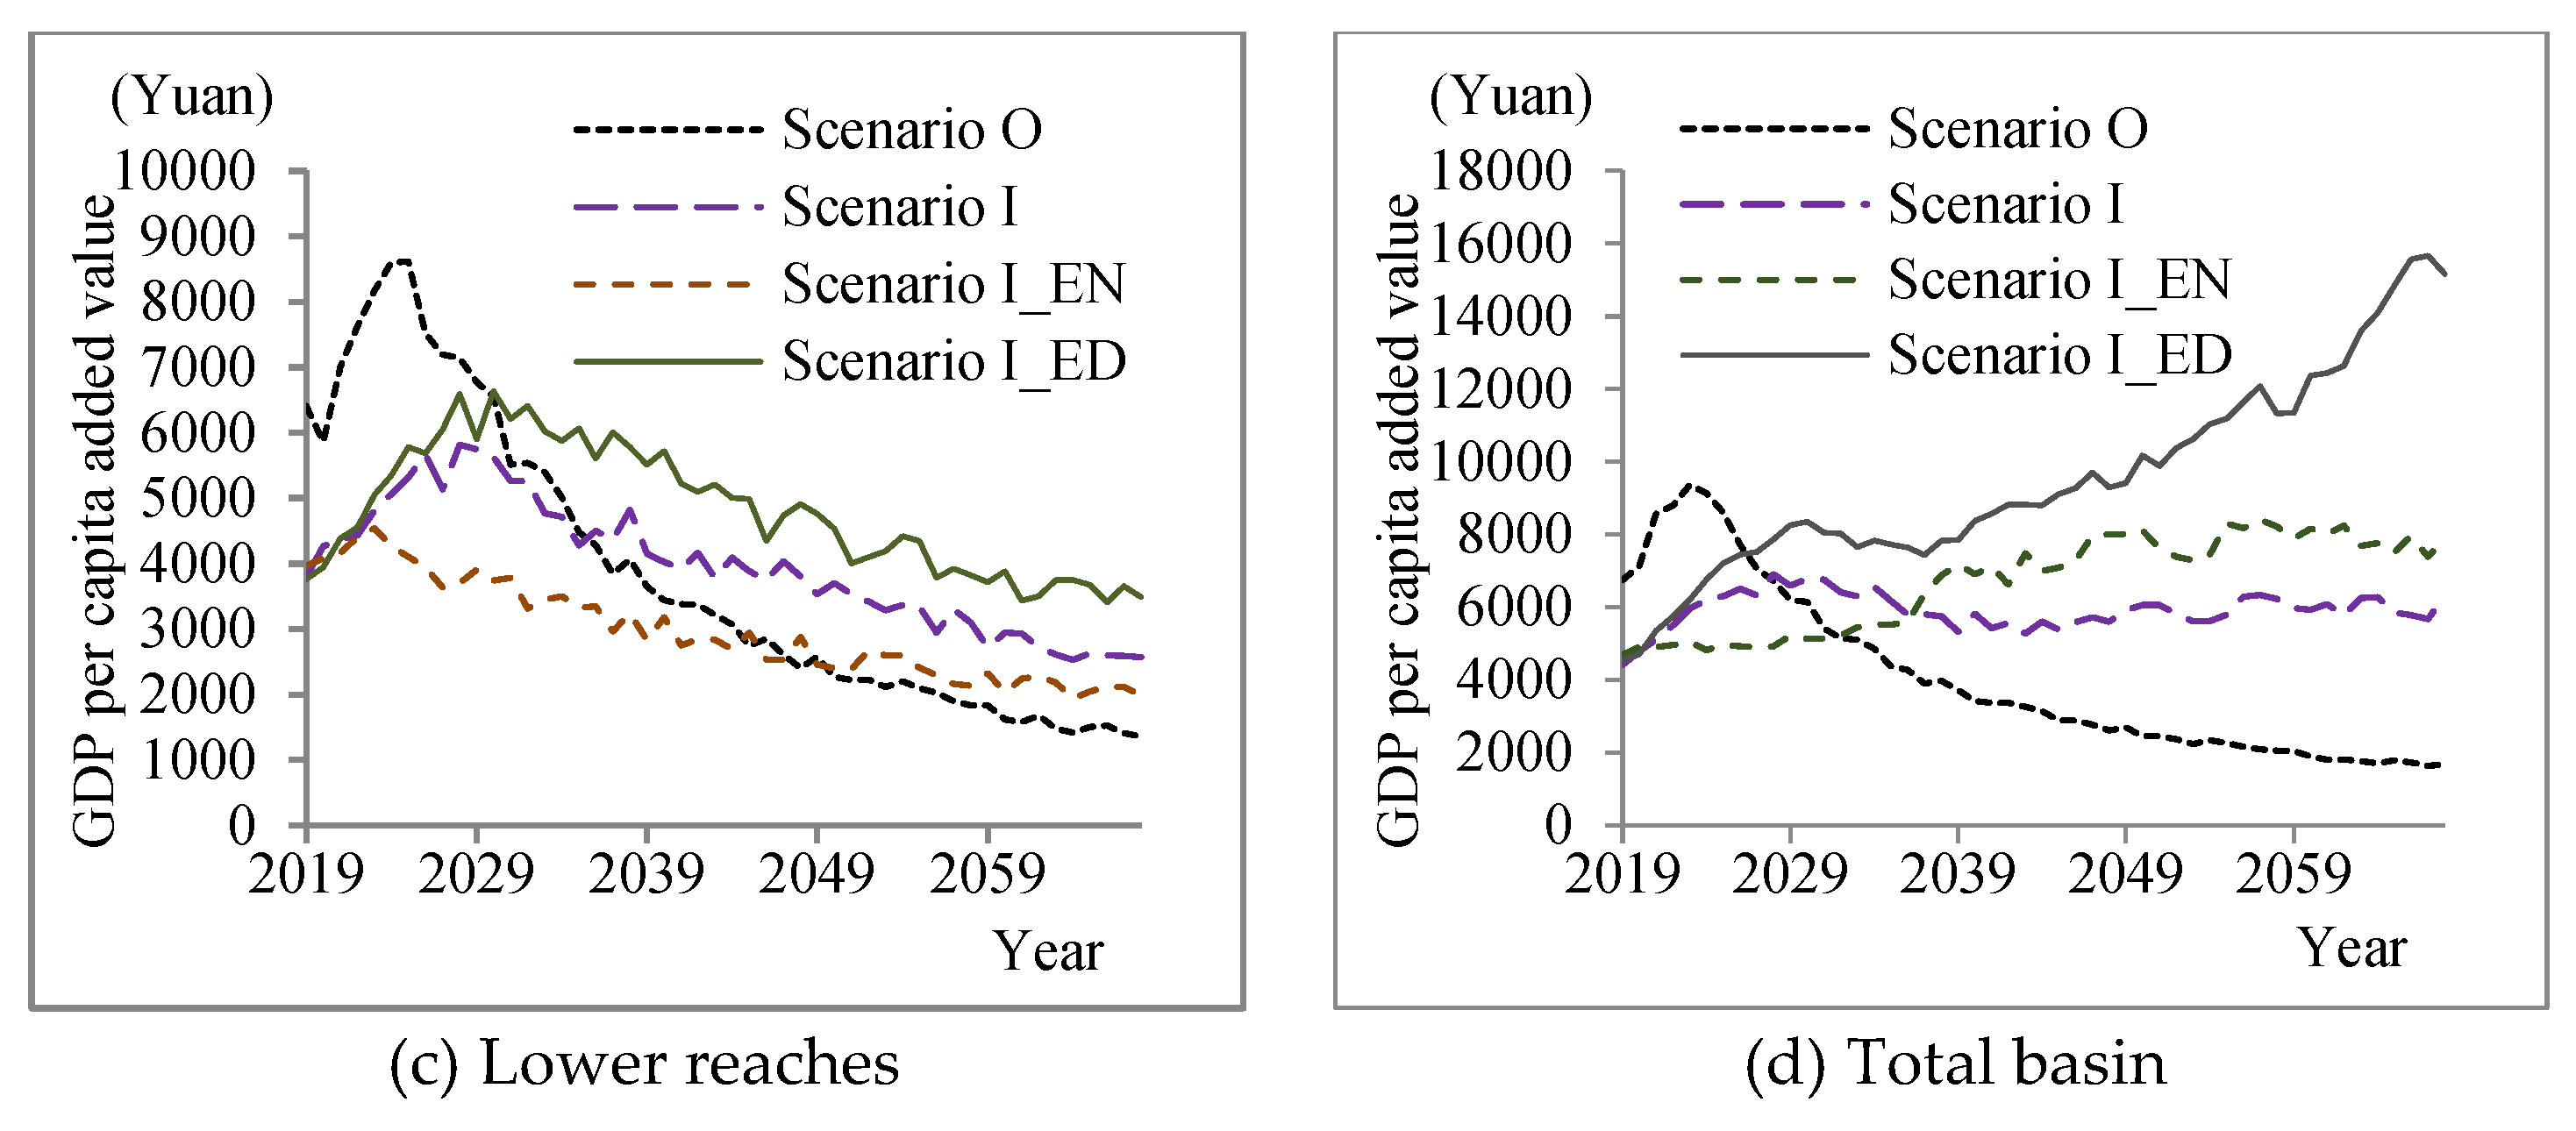
5.1. Analysis of the Evolution Path of the Economic Development Trend in the Yellow River Basin under Different Scenarios

Taking 2018 as the base period, the evolution paths of each province in the Yellow River Basin under different development modes are simulated individually. The evolution trends of economic development in each province under different scenarios in 50 cycles are shown in Figure 3.
As seen in Figure 3, the economic development trend of each province in the Yellow River basin varies over 50 years under different scenarios. However, in general, scenario I_ED (the green innovation and differentiated ecological and environmental constraints model for the upper, middle, and lower reaches) has a more significant advantage for GDP per capita growth in the middle and late stages of the simulated evolution, except for Qinghai Province in the upper reaches.
In particular, scenario O (the crude development model without ecological constraints) prevails in the early stage of simulation evolution, but the overall economic growth under this development model shows an apparently inverted “U” shape, which is unsustainable in the long term.
Scenario I (the green innovation development model with economic incentives) has different evolutionary paths in different provinces, among which Qinghai, Sichuan, and Inner Mongolia show a slow upward trend; Shanxi and Shaanxi have no apparent fluctuation, and Ningxia, Gansu, Henan, and Shandong show an inverted “U”-type trend. Although the long-term trend is better than the extensive development model, it still shows a downward trend in the middle and late stages; it also highlights the importance of increasing the support for science and technology innovation in Qinghai, Sichuan, and Inner Mongolia to promote local economic development.
Scenario I_EN (the green innovation with basin-wide undifferentiated ecological and environmental constraint model) evolves similarly to green innovation scenario I in most provinces. However, in the Qinghai, Sichuan, Shaanxi, and Shanxi provinces, their GDP per capita growth is significantly better than in scenario I in the middle and late stages of the simulated evolution, reflecting the effect of ecological and environmental protection in the promotion of economic growth in the region.
Under scenario I_ED, although all of the provinces achieve higher GDP per capita growth than other scenarios in the late stage of simulation evolution, the evolutionary paths of all of the provinces are not consistent, among which Qinghai, Sichuan, and Inner Mongolia show an overall upward trend. However, Qinghai is the only province with better GDP per capita growth than I_ED under scenario I_EN. Gansu, Shaanxi, and Shanxi show a “U” shape, while Henan and Shandong show a moderately inverted “U” shape. It can be seen that in order to achieve high-quality development in the Yellow River Basin, economic policies should be formulated not only by distinguishing among the geographical characteristics of the upper, middle, and lower reaches but also by taking into account the resource endowment and ecological environment characteristics of different regions, and by formulating differentiated policy strategies.

5.2. Scenario-Based Comparative Analysis of the Development of the Yellow River Basin by Province

The simulation of the 50-year evolution of each province in the Yellow River Basin under different scenarios shows that the combination of the scenarios of innovation policies and eco-conservation policies has long-term effects on economic development, resource consumption, and the environment in each province, and the results of the scenarios vary greatly among provinces. The economic growth, resource consumption, ecological environment, and impact on the lower reaches’ ecological environment in each province under scenario O (the crude development model without ecological constraints) are shown in Table 2, and the “mean ranking” refers to the comparison of the annual mean values of the corresponding dimensions under scenario O, scenario I, scenario I_EN, and scenario I_ED. The results are shown in Table 2, where economic growth refers to the average annual increase in GDP per capita, which is a positive indicator, and “1” indicates the best; resource consumption, ecological environment, and the lower reaches’ impact are negative indicators, and “1” again indicates the best.
As can be seen from Table 2, except for the four data on economic growth, the provinces in the Yellow River Basin ranked first in the bottom in terms of resource consumption, ecological environment, and impact on the lower reaches under scenario O. This indicates that although the crude development model is beneficial to the economic growth of the region in individual provinces, at the expense of the ecological environment, this development model will also have a significant impact on the ecological environment of the lower reaches.
As shown in Table 3, green innovation has significant effects on the reduction of resource consumption, optimizing the ecological environment and reducing the impact of environmental pollution in the region on the lower reaches, especially in terms of the reduction of resource consumption. The Gansu, Inner Mongolia, Shaanxi, and Shanxi provinces reach the optimal resource consumption under this scenario; in terms of the ecological environment and impact on the lower reaches, this scenario is significantly better than scenario O of the crude development model. In terms of economic growth, the Shandong, Henan, and Ningxia provinces lag behind the crude development scenario O.
As seen in Table 4, the inclusion of strict ecological and environmental constraints does not always have a negative impact on the economy. In terms of the average annual growth value of the economy over 50 years, Inner Mongolia and Shaanxi achieve optimal economic growth under the scenario with the inclusion of strict environmental constraints; the resource consumption under this scenario is much better than that of the crude development scenario O. Compared with green innovation scenario I, scenario I_EN, with the dual combination of green innovation and ecological and environmental protection, is slightly better; moreover, this scenario is significantly better than both scenario O and scenario I in terms of the ecological environment and the impact on the lower reaches.
As shown in Table 5, the implementation of the segmented control ecological and environmental protection strategy in the Yellow River Basin is much better than other scenarios in terms of economic growth, but it is significantly inferior to scenario I and scenario I_EN in terms of reducing resource consumption; in terms of the ecological environment and impact on the lower reaches, this scenario is significantly better than scenario O and scenario I, but not significantly different from scenario I_EN. It can be seen that the implementation of the segmented control of the Yellow River basin-wide ecological and environmental protection strategy can better guarantee long-term economic growth, but under the existing technical level and green innovation conditions, most of the provinces will be limited by the resource bearing capacity. Therefore, it is necessary to vigorously develop green industries and new industries while protecting the ecological environment throughout the region in order to achieve the comprehensive, high-quality development of industry, technology, ecology, the environment, and society by changing the existing industrial structure.

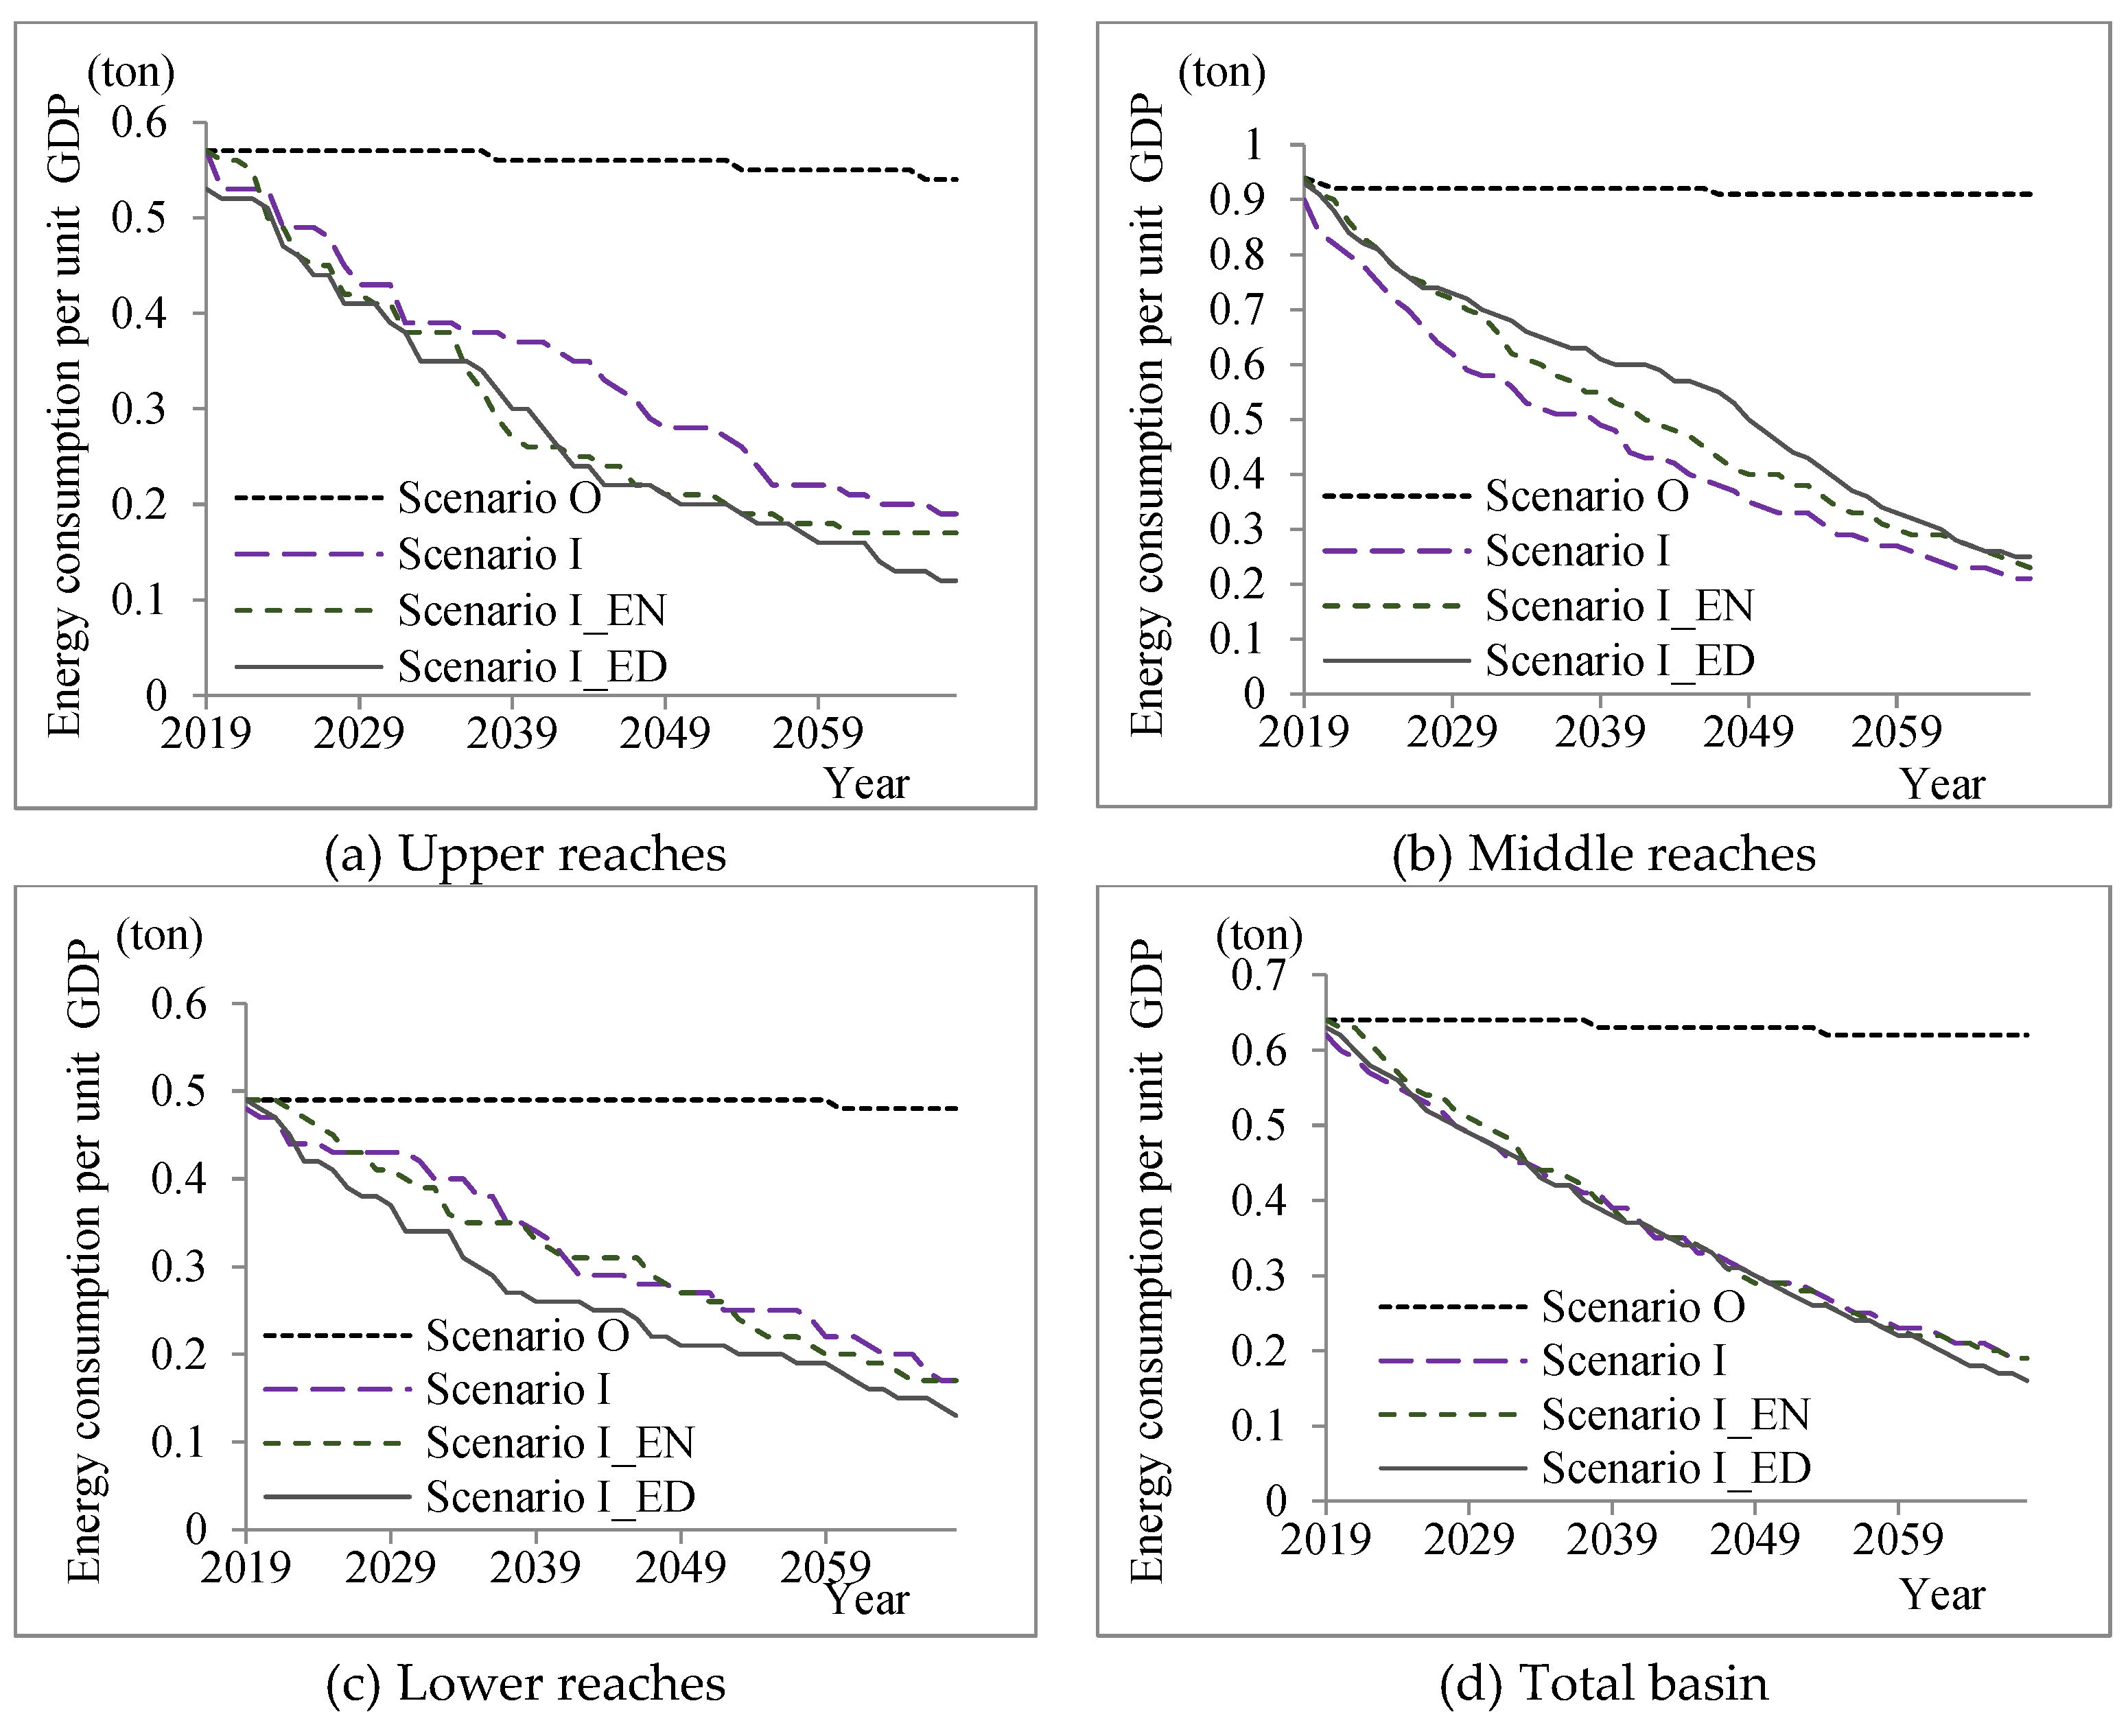
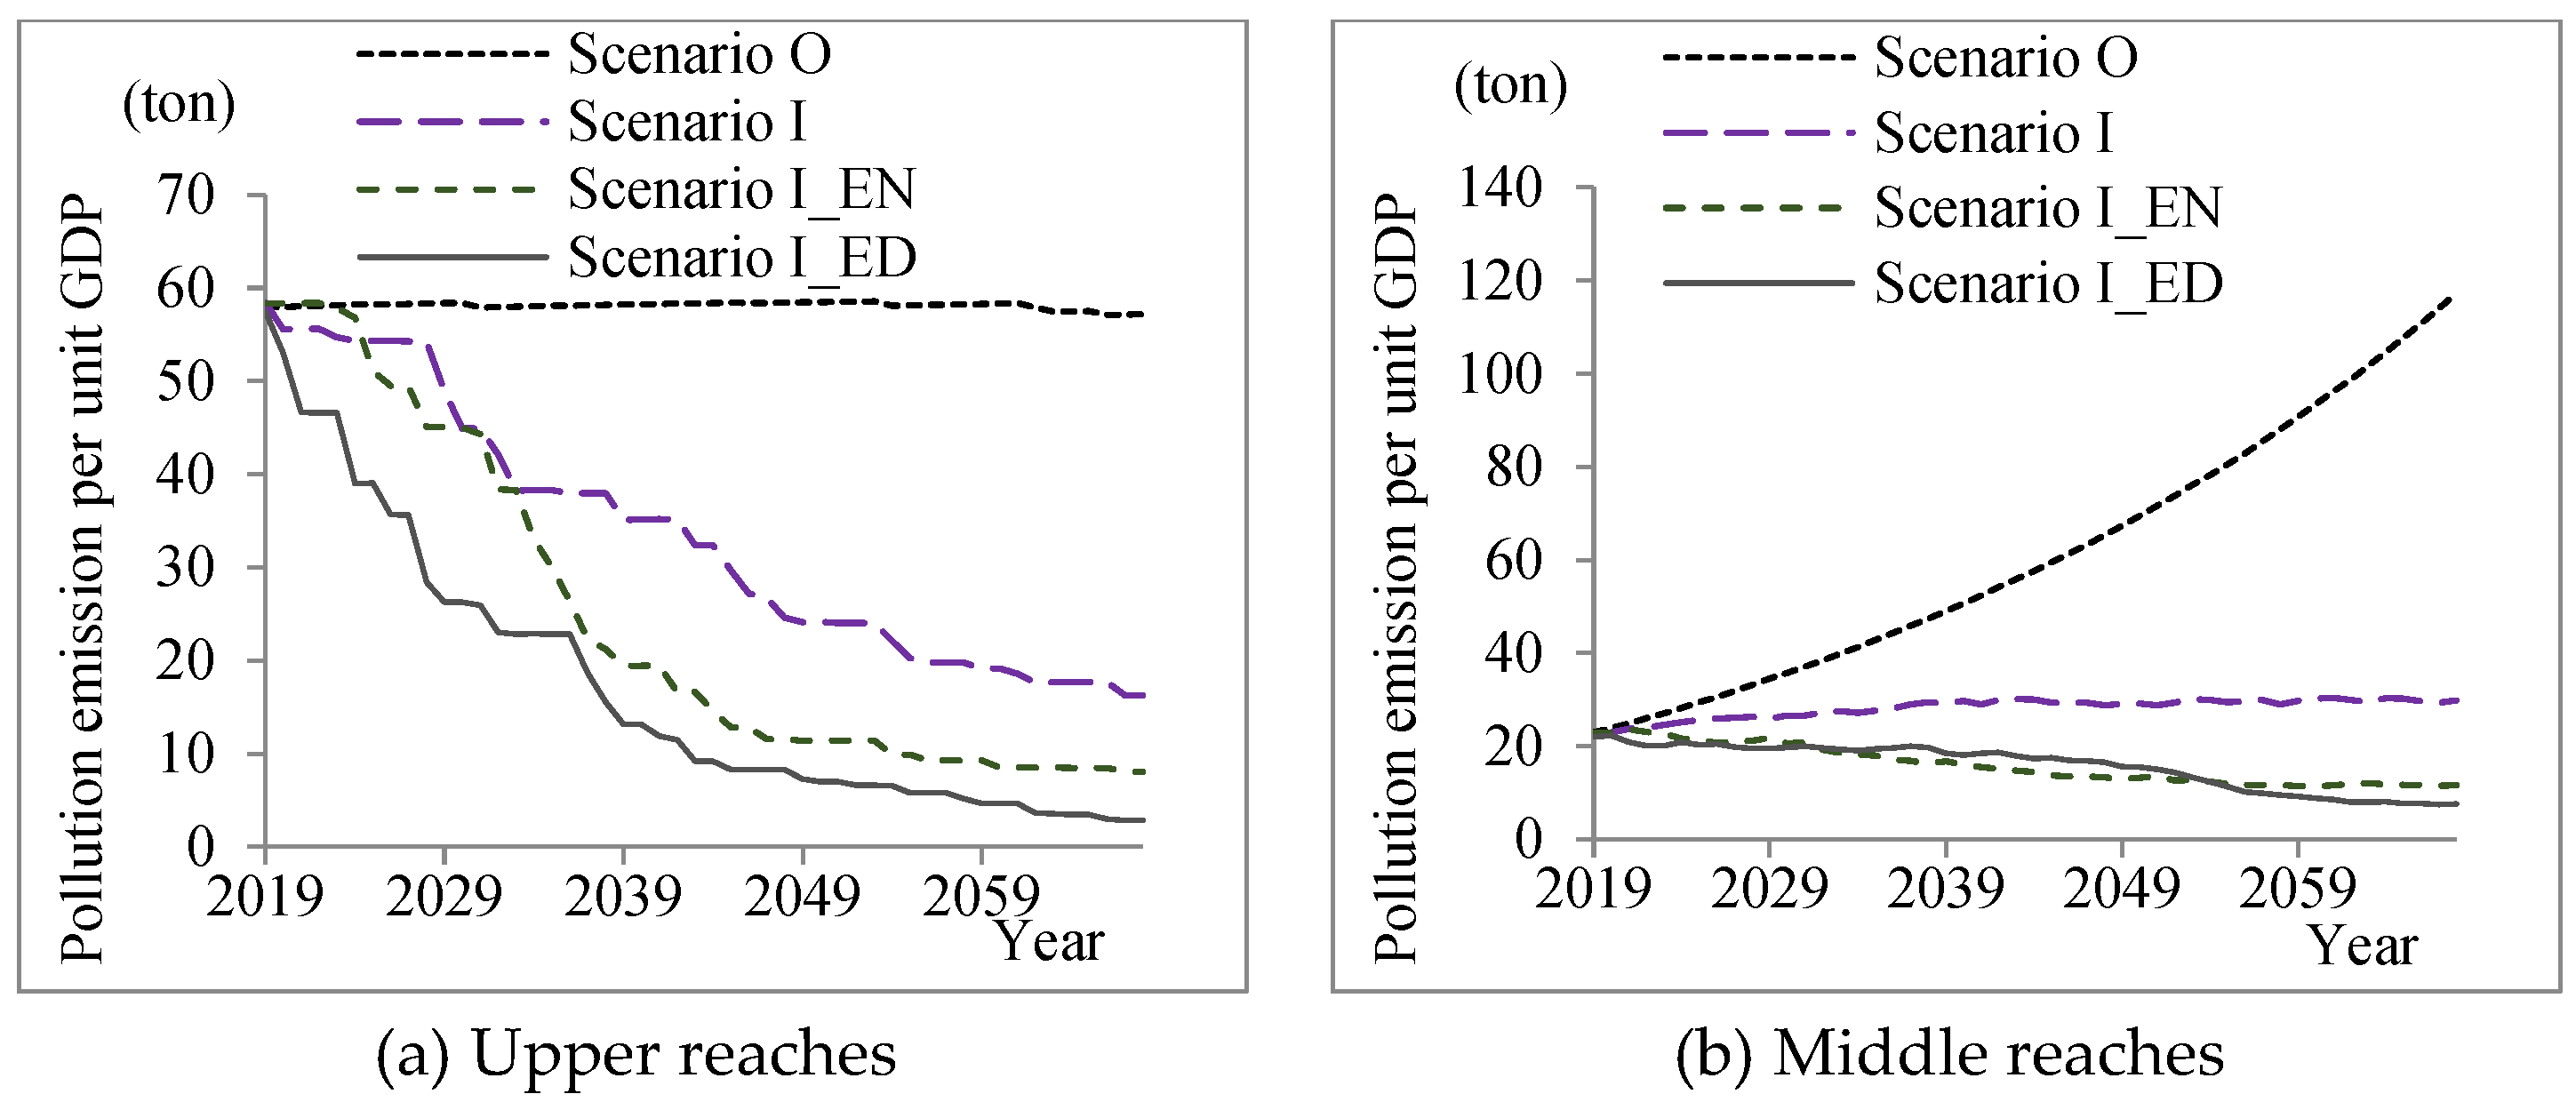
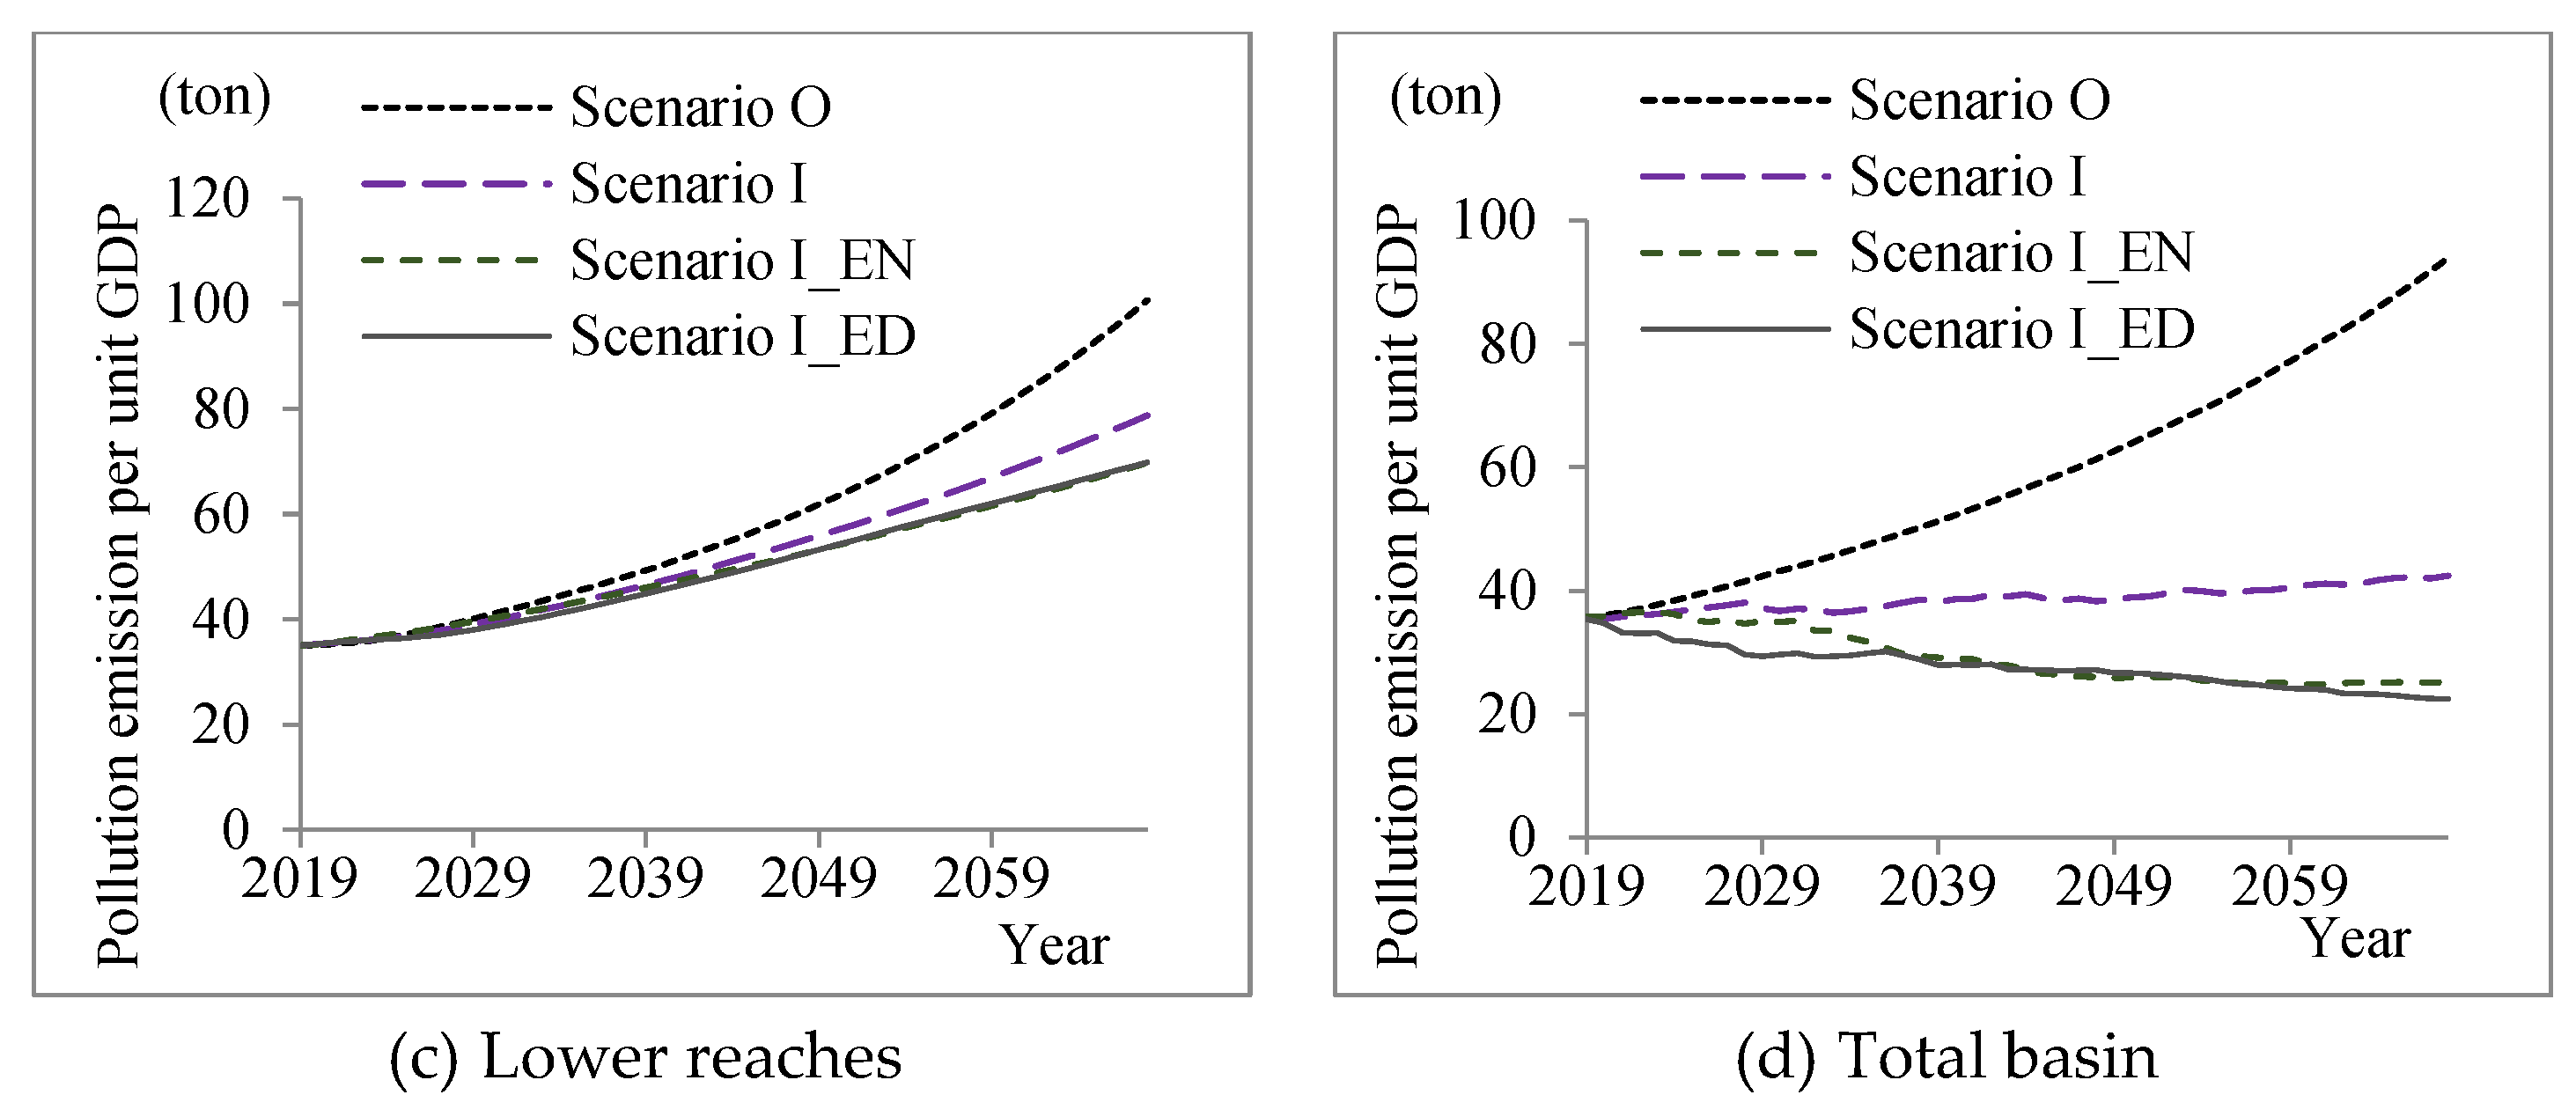
5.3. Comparative Analysis of the Overall Evolutionary Trends in the Yellow River Basin under Different Scenarios

The key to the global governance of the Yellow River Basin is to change the traditional situation of “governing the Yellow River in nine provinces and managing each section”. According to the analysis of the above provinces’ development status and evolution process, each province’s development stages and work priorities are different. The evolution trends of economic development in the upper, middle, and lower reaches, and the whole Yellow River Basin under different scenarios are shown in Figure 4.
As seen in Figure 4, from the long-term evolutionary trend, scenario I_ED (green innovation with differentiated ecological and environmental constraint patterns in the upper, middle, and lower reaches) is optimal in terms of the overall economic development of the Yellow River Basin, with the exception of the lower reaches, for which scenario I_EN (green innovation with basin-wide undifferentiated ecological and environmental constraint model) is significantly better than scenario I (green innovation development model with economic incentives). In the context of green innovation, the strict ecological and environmental protection has a positive effect on the economic development of the Yellow River Basin, especially from a basin-wide perspective. The phased-control ecological and environmental protection strategy is far superior to other scenarios in terms of economic development. As the high-quality development of the middle and upper reaches of the Yellow River Basin is constrained by the business environment, human living environment, salary and benefits, and development space, it faces enormous competitive pressure regarding green innovation. Further analysis of the overall resource consumption in the Yellow River Basin under different scenarios is shown in Figure 5.
As shown in Figure 5, green innovation can better reduce resource consumption in the Yellow River Basin, and, overall, the effect of resource consumption reduction under the scenario without adding strict ecological and environmental constraints is generally better than that of scenario I_ED with the segmented control of region-wide ecological and environmental constraints; specifically, under scenario I_ED (the green innovation and differentiated ecological and environmental constraints model for upper, middle, and lower reaches), because the regions in the middle and upper reaches of the Yellow River Basin enforce stricter ecological and environmental constraints than the lower reaches, which reduces the regional green innovation capacity to a certain extent, in the long run, the middle and upper reaches can better reduce their resource consumption under scenario I (the green innovation development model with economic incentives) regarding green innovation. Meanwhile, for the lower reaches of the Yellow River Basin, under scenario I_EN (the green innovation with basin-wide undifferentiated ecological and environmental constraints model), and according to Figure 5c, it can be seen that the unified strict ecological and environmental constraints in the upper and lower reaches constrain economic growth; therefore, the resource consumption under this scenario is optimal. Further analysis of the resource consumption per unit of GDP under different scenarios is shown in Figure 6.
As seen in Figure 6, overall, the three scenarios with the inclusion of green innovation have similar effects on the reduction of the resource consumption per unit of GDP in the Yellow River Basin. However, scenario I_ED (green innovation and differentiated ecological and environmental constraints model for upper, middle, and lower reaches) is optimal in the upper and lower reaches, while scenario I (the green innovation development model with economic incentives) is optimal in the middle reaches. Further analysis of the overall ecological environment in the Yellow River basin under different scenarios is shown in Figure 7.
As seen in Figure 7, overall, scenario I_EN (the green innovation with basin-wide undifferentiated ecological constraint model) and scenario I_ED (the green innovation and differentiated ecological and environmental constraints model for upper, middle, and lower reaches) are optimal in terms of ecological and environmental protection in the Yellow River basin; specifically, under scenario I_ED, the upper reaches adopt more stringent ecological environment constraints than the middle and lower reaches, such that the ecological environment of the upper reaches is the best under this scenario. Further analysis of the pollution emissions per unit of GDP under different scenarios is shown in Figure 8.
As shown in Figure 8, overall, scenario I_ED (the green innovation and differential ecological and environmental constraint model for upper, middle, and lower reaches) has the best effect on the reduction of pollution emissions per unit of GDP, especially in the upper reaches of the Yellow River Basin, where the pollution emissions per unit of GDP under scenario I_ED are significantly better than those in other scenarios. Combining economic development, resource consumption, and the ecological environment, the implementation of segmented-control ecological and environmental constraint strategies for the upper, middle, and lower reaches of the Yellow River basin, and the appropriate strengthening of ecological and environmental protection in the middle and upper reaches, are important in order to promote the overall high-quality development of the Yellow River Basin.

5.4. Policy Implications of the Research Results

The simulation results show that under the existing development model, the economic development of all of the provinces in the Yellow River Basin will be subject to different degrees of resource and ecological constraints, and different policy scenarios significantly affect the evolutionary trends of the economic development, resource consumption, and environmental pollution in each province in the Yellow River Basin, showing different mechanisms to approach the bottleneck of resource and ecological constraints. The effects of the same policy scenario in different provinces also vary. The following policy implications are based on the research results.
(i) Green innovation economic incentive policies have significant effects on the reduction of resource consumption, the optimization of the ecological environment, and the reduction of the lower reaches’ impact of environmental pollution in the region, especially reducing resource consumption and the ecological environment. However, from the perspective of promoting economic growth, the Shandong, Henan, and Ningxia provinces are generally seen to lag behind the crude development model under a single green innovation incentive model (see Table 3).
(ii) Strict ecological constraints do not always harm the economy. From the economic growth trends simulated over 50 years of evolution, Inner Mongolia and Shaanxi instead achieve optimal economic growth under the scenario that imposes strict environmental constraints; at the same time, resource consumption under this scenario is much better than under the crude development model, and a comparison with the green innovation economic incentive scenario reveals that the scenario with a dual combination of green innovation and ecological and environmental protection yields better results in terms of the promotion of economic development and the reduction of resource consumption. This scenario is also significantly better than the crude development model and the green innovation incentive model in terms of the ecological environment and the impact on the lower reaches (see Table 4).
(iii) The implementation of the segmented-control ecological and environmental protection strategy has a much better impact on economic growth than other scenarios, but in terms of the reduction of resource consumption, this scenario is significantly inferior to the green innovation incentive scenario and the combined innovation and environmental constraint scenario; in terms of ecological environment and the impact on the lower reaches, this scenario is significantly better than the crude development model and the green innovation incentive scenario, but is not significantly different from the combined innovation and environmental constraint scenario. The difference between this scenario and the combined innovation and environmental constraint scenario is not significant (see Table 5). It can be seen that the implementation of a segmented-control strategy for ecological and environmental protection across the Yellow River Basin can better guarantee long-term economic growth. Because the high-quality development of the middle and upper reaches of the Yellow River Basin is constrained by the business environment, human living environment, salary and welfare, development space, and other conditions, and faces huge competitive pressure regarding green innovation, implementing a synergistic development model with upper and lower reach linkages, complementary advantages, and a reasonable division of labor can not only achieve sustainable economic growth but also reduce resource consumption and environmental pollution more efficiently. In the long term, this could better promote the high-quality development of the whole Yellow River Basin.

6. Conclusions and Discussion

Based on an agent-based model, this study took the empirical data of 115 prefecture-level cities in nine provinces and regions of the Yellow River Basin from 2010 to 2018 as a sample, and took the coordinated development of economy–resources–environment–society as the goal, constructing 115 agent models with different attributes, constraints, behavior rules, interaction rules, and autonomous response capabilities. It used computational experiment methods derived from the social sciences to simulate the evolutionary path of eco-protection and high-quality development under different policy scenarios, such as green innovation, ecological environment constraints, ecological compensation, and so on. The simulation results show that under the existing development model, the economic development of all of the provinces in the Yellow River Basin will be subject to different degrees of resource and ecological constraints, and different policy scenarios significantly affect the evolutionary trends of economic development, resource consumption, and environmental pollution in each province in the Yellow River Basin, showing different mechanisms to approach the bottleneck of resource and ecological constraints.
Existing research on the high-quality development of the Yellow River Basin is mostly based on the evaluation of multiple indicators. These studies mostly use empirical data to carry out the comparative analysis of different temporal and spatial dimensions, and rarely involve the prediction of future evolution trends under different scenarios. With the combination of empirical research with the SD method, Jiang et al. (2021) [32] simulated the dynamic process of system development. Jiang’s model was based on the indicators of the evaluation system and the causal relationship between the indicators. The advantages of such a method come from the intuitive modeling method; the easy-to-understand, clear causal relationship between the variables; and the ease of reflection of the error of simulation by comparing the simulation results of each index with empirical data. However, the research objects and conclusions of such methods remain at the macro level, which is difficult to reveal the microdrivers of variant changes, and it is also difficult to reflect the impact of individual heterogeneity, individual decision-making uncertainty and individual interaction on the macro level of the system.
On the other hand, from the perspective of scenario analysis, Jiang’s model simulated the evolution results under three different scenarios, including economic growth priority, environmental protection, and equal emphasis on economic development and environmental protection. The above scenarios are essentially one or more dimensions that constitute the evaluation system, and the simulation results only reflect the linkage and coupling relationship between the dimensions. Our model benefits from the flexibility of multi-agent attributes and behavior rules. It focuses on the possible policy scenarios of high-quality development in the Yellow River Basin, and explores the optimization space of policy design, which can more deeply reveal the action mechanism and macro-level effect of a specific policy. Compared with existing research, the proposed model reveals the microdrivers of the macro changes. Its outstanding advantage is that it is convenient for researchers to analyze the motivation at the micro level and observe the overall emergence at the macro level. In this way, it is possible to visually simulate the development and evolution of a complex system under different scenarios, based on empirical data and with computers as tools. The virtual–real linkage provides a guarantee for the reliability of research. Researchers can verify and adjust the attributes or rules of agents at any time by comparing the simulation results with empirical data. This helps the constructed artificial system to map the real system well, on the one hand, and provides more abundant scenarios than the real system, on the other hand.
Scenario modeling and evolutionary simulation based on multiple agents are very effective tools in bottom-up research; however, there may be limitations in the modeling process, which should be continuously improved and expanded in future research. In this paper, 115 prefecture-level cities were used as agents for simulation. The study did not consider the behavioral characteristics and interactions of more micro-level individuals, such as different industries, specific enterprises, residents, and so on. In the future, the interaction research of agents at different levels should be strengthened. In addition, this study took language probability as the basis of agent decision-making. It did not consider the mutation problem of the agent itself. In the future, it will be necessary to enrich the agent rule-learning algorithms, such as the genetic algorithm, particle swarm optimization, and ant colony algorithm, etc. In addition, it is also important to strengthen the integration of different models, consider the complexity of interaction between agents, and expand the scope of application of the model.

Author Contributions

Conceptualization and methodology, A.Z.; original draft preparation, J.W.; data curation Z.S.; review and editing, H.G. All authors have read and agreed to the published version of the manuscript.

Funding

This research was funded by “the Major Projects of National Social Science Fund”, China (Grant No. 19ZDA080).

Institutional Review Board Statement

Not applicable.

Informed Consent Statement

Not applicable.

Data Availability Statement

Not applicable.

Conflicts of Interest

The authors declare no conflict of interest.

References

  1. Sun, Q.; Zhang, X.; Zhang, H.; Niu, H. Coordinated development of a coupled social economy and resource environment system: A case study in Henan Province, China. Environ. Dev. Sustain. 2018, 20, 1385–1404. [Google Scholar] [CrossRef]
  2. Ma, H.M.; Ding, Y.; Yang, Q. Regional Ecology-Economy-Society Coordinated Development Evaluation Model and Application. Stat. Decis. 2019, 35, 75–79. [Google Scholar] [CrossRef]
  3. Shi, B. Study on the development path of central cities in the Yellow River Basin. J. Humanit. 2020, 1, 5–9. [Google Scholar] [CrossRef]
  4. Ren, B.P.; Zhang, Q. The Strategic Design and Supporting System Construction of High-quality Development in the Yellow River Basin. Reform 2019, 10, 26–34. [Google Scholar]
  5. Wang, Y.Q.; Li, G.P. Sustainable simulation of ecological environment and socio-economic development in the Yellow River Basin based on the SD model. Arid Land Geogr. 2022, 45, 901–911. [Google Scholar]
  6. Geng, Y.W.; Chen, W.Q.; Zhang, J.X.; Wang, K.; Zhang, F.; Ma, Y.H. Evolution Characteristics and Scenario Simulation of Social-Ecological-Productional Landscape Resilience in Areas Along Mainstream of Yellow River in He’nan Province. Bull. Soil Water Conserv. 2021, 41, 181–190. [Google Scholar] [CrossRef]
  7. Fang, C.; Liu, H.; Li, G. International progress and evaluation on interactive coupling effects between urbanization and the eco-environment. J. Geogr. Sci. 2016, 26, 1081–1116. [Google Scholar] [CrossRef]
  8. Sun, Z.; Zhu, X.; Pan, Y.; Zhang, J.; Liu, X. Drought evaluation using the GRACE terrestrial water storage deficit over the Yangtze River Basin, China. Sci. Total Environ. 2018, 634, 727–738. [Google Scholar] [CrossRef]
  9. Srinivasan, V.; Seto, K.C.; Emerson, R.; Gorelick, S.M. The impact of urbanization on water vulnerability: A coupled human-environment system approach for Chennai, India. Glob. Environ. Chang. 2013, 23, 229–239. [Google Scholar] [CrossRef]
  10. Ma, T.; Chen, M.; Wang, C.; Mao, Z.; Jiang, M. Study on the environment-resource-economy comprehensive efficiency evaluation of the biohydrogen production technology. Int. J. Hydrog. Energy 2013, 38, 13062–13068. [Google Scholar] [CrossRef]
  11. Bastianoni, S.; Coscieme, L.; Pulselli, F.M. The input-state-output model and related indicators to investigate the relationships among environment, society and economy. Ecol. Model. 2016, 325, 84–88. [Google Scholar] [CrossRef]
  12. Estoque, R.C.; Murayama, Y. Social-ecological status index: A preliminary study of its structural composition and application. Ecol. Indic. 2014, 43, 183–194. [Google Scholar] [CrossRef]
  13. Li, Y.; Li, Y.; Zhou, Y.; Shi, Y.; Zhu, X. Investigation of a coupling model of coordination between urbanization and the environment. J. Environ. Manag. 2012, 98, 127–133. [Google Scholar] [CrossRef] [PubMed]
  14. Aldieri, L.; Vinci, C.P. Climate change and knowledge spillovers for cleaner production: New insights. J. Clean. Prod. 2020, 271, 122729. [Google Scholar] [CrossRef]
  15. Zhao, Y.; Wang, S.; Zhou, C. Understanding the relation between urbanization and the eco-environment in China’s Yangtze River Delta using an improved EKC model and coupling analysis. Sci. Total Environ. 2016, 571, 862–875. [Google Scholar] [CrossRef]
  16. Xing, L.; Xue, M.; Hu, M. Dynamic simulation and assessment of the coupling coordination degree of the economy–resource–environment system: Case of Wuhan City in China. J. Environ. Manag. 2019, 230, 474–487. [Google Scholar] [CrossRef]
  17. Shi, Y.; Zhu, X.; Sun, X.; Li, Y.; Wei, T. A dynamic assessment for the coordination between economic development and the environment: A case study of Lianyungang, China. Acta Ecol. Sin. 2010, 30, 4119–4128. [Google Scholar] [CrossRef]
  18. Han, R.; Tong, L.; Zhu, S.; Lu, Z. The Coordinated Development of Economy and Environment Based on ARMA Model in Shenyang Economic Zone. Sci. Geogr. Sin. 2014, 34, 32–39. [Google Scholar] [CrossRef]
  19. Li, Y.; Wu, Y.X.; Zeng, Z.X.; Guo, L. Research on Forecast Model for Sustainable Development of Economy-Environment System Based on PCA and SVM. In Proceedings of the 2006 International Conference on Machine Learning and Cybernetics, Dalian, China, 13–16 August 2006; pp. 3590–3593. [Google Scholar] [CrossRef]
  20. Turner, K. Economics and wetland management. Ambio 1991, 20, 59–63. [Google Scholar]
  21. Zhao, L.; Zhang, G. Evaluation and welfare effect of coordinated ecological development of the Beijing–Tianjin–Hebei region. Chin. J. Popul. Resour. 2021, 19, 283–290. [Google Scholar] [CrossRef]
  22. Deng, C.; Li, H.; Peng, D.; Liu, L.; Zhu, Q.; Li, C. Modelling the coupling evolution of the water environment and social economic system using PSO-SVM in the Yangtze River Economic Belt, China. Ecol. Indic. 2021, 129, 108012. [Google Scholar] [CrossRef]
  23. Kaplan, R.S.; Norton, D.P. The Balanced Scorecard—Measures that Drive Performance. Harv. Bus. Rev. 1992, 70, 71–79. [Google Scholar] [PubMed]
  24. Kaplan, R.S.; Norton, D.P. The Execution Premium: Linking Strategy to Operations for Competitive Advantage; Harvard Business School Press: Boston, MA, USA, 2008; ISBN 9781422121160. [Google Scholar]
  25. Kaplan, R.S.; Norton, D.P. Using the balanced scorecard as a strategic management system. Harv. Bus. Rev. 1996, 74, 75–85. [Google Scholar]
  26. Ahn, H. Applying the balanced scorecard concept and experiential report. Long Range Plan. 2001, 34, 441–461. [Google Scholar] [CrossRef]
  27. Acosta, L.A.; Rounsevell, M.; Bakker, M. An Agent-Based Assessment of Land Use and Ecosystem Changes in Traditional Agricultural Landscape of Portugal. Int. J. Inf. Manag. 2015, 6, 55–80. [Google Scholar] [CrossRef] [Green Version]
  28. Xu, Q.; Yang, K.; Wang, G.; Yang, Y. Agent-based modeling and simulations of land-use and land-cover change according to ant colony optimization: A case study of the Erhai Lake Basin, China. Nat. Hazards 2015, 75, 95–118. [Google Scholar]
  29. Liu, R.; Jiang, D.; Shi, L. Agent-based simulation of alternative classroom evacuation scenarios. Front. Archit. Res. 2016, 5, 111–125. [Google Scholar] [CrossRef] [Green Version]
  30. Zhang, N.; Lu, Y.; Chen, J.; Hwang, B. An agent-based diffusion model for residential photovoltaic deployment in Singapore: Perspective of consumers’ behavior. J. Clean. Prod. 2022, 367, 132793. [Google Scholar] [CrossRef]
  31. Macal, C.M.; North, M.J. Tutorial on agent-based modelling and simulation. J. Simul. 2010, 4, 151–162. [Google Scholar] [CrossRef]
  32. Jiang, L.; Zuo, Q.; Ma, J.; Zhang, Z. Evaluation and prediction of the level of high-quality development: A case study of the Yellow River Basin, China. Ecol Indic. 2021, 129, 107994. [Google Scholar] [CrossRef]
Figure 1. Coupled structure of the resource–environment–economy–society system in the Yellow River Basin.
Systems 10 00105 g001
Figure 2. Interaction mechanism between balanced indicators and agents.
Systems 10 00105 g002
Figure 3. Evolutionary trends of the economic development in the provinces of the Yellow River Basin under different scenarios.
Systems 10 00105 g003aSystems 10 00105 g003b
Figure 4. Simulation of the evolution of the overall economic development of the Yellow River Basin under different scenarios.
Systems 10 00105 g004aSystems 10 00105 g004b
Figure 5. Simulation of the evolution of the overall resource consumption in the Yellow River Basin under different scenarios.
Systems 10 00105 g005
Figure 6. Simulation of the evolution of the resource consumption per unit of GDP in the Yellow River Basin under different scenarios.
Systems 10 00105 g006
Figure 7. Simulation of the evolution of the overall ecological situation in the Yellow River basin under different scenarios.
Systems 10 00105 g007
Figure 8. Simulation of the evolution of the pollution emissions per unit of GDP in the Yellow River Basin under different scenarios.
Systems 10 00105 g008aSystems 10 00105 g008b
Table 1. Main variables and initial assignment rules for computational experiments.
Variable/ParameterAssignment IntervalMeaningAssignment Rule
T50Simulation cycleFixed value
θ w 0.01Speed control parameter of scientific and technological progressTraining value
θ e 1 0.01Speed control parameter of technical improvementTraining value
θ e 2 0.01Control parameter of GDP growth rateTraining value
θ e 3 0.01Speed control parameter for energy consumption reduction per unit output valueTraining value
θ e 4 0.01Control parameter of pollutant reduction rate per unit output valueTraining value
γ 5Distance decay function factorTraining value
σ t 0.05The proportion of R&D investment in GDPEmpirical value
G d p m a x 0.2The maximum growth rate of GDPEmpirical value
E n g m i n 0.2Maximum reduction rate of energy consumption per unit output valueEmpirical value
P o l m i n 0.2Maximum reduction rate of pollutant discharge per unit output valueEmpirical value
T e c m a x 0.2Maximum speed of technical improvementEmpirical value
Table 2. Comparative ranking of the development of each dimension under scenario O in the Yellow River Basin provinces.
ProvinceEconomic
Growth
Resources
Consumption
Ecology
Environment
Impact
Lower Reaches
Periodic MeanMean
Sort
Periodic MeanMean
Sort
Periodic MeanMean
Sort
Periodic MeanMean
Sort
Qinghai11,650.25416,460.934140,490.1147356.874
Sichuan170,335.71485,103.21410,430,415466,880.014
Gansu21,328.36319,184.2442,128,716.6449,712.454
Ningxia8929.3215,311.9541,009,006.5452,867.584
Inner-Mongolia59,270.51466,669.7942,942,370.44153,081.694
Shaanxi80,319.17441,108.5744,578,867.44157,932.484
Shanxi51,381.14460,608.0144,287,611.24224,095.524
Henan141,309.92266,852.9345,981,967.54297,824.634
Shandong223,396.871111,192.29417,217,1654--
Note: The color block, from light to dark, indicates the sorting results from the best to the worst.
Table 3. Comparative ranking of the development of each dimension under Scenario I in the Yellow River Basin provinces.
ProvinceEconomic
Growth
Resources
Consumption
Ecology
Environment
Impact
Lower Reaches
Periodic MeanMean
Sort
Periodic MeanMean
Sort
Periodic MeanMean
Sort
Periodic MeanMean
Sort
Qinghai15,450.36311,799.64275,008.7933926.873
Sichuan219,439.4354,970.6526,135,319.7336,179.373
Gansu22,694.1528846.1711,013,780.4322,271.673
Ningxia8869.36310,245.052469,406.02324,594.853
Inner-Mongolia71,990.12335,578.5211,709,489.1389,057.093
Shaanxi102,047.13317,895.2812,537,886384,071.453
Shanxi62,569.09228,929.1512,030,434.53106,122.333
Henan136,472.67336,077.9224,254,877.63211,837.883
Shandong201,533.46361,046.84314,936,7842--
Note: The color block, from light to dark, indicates the sorting results from the best to the worst.
Table 4. Comparative ranking of the development of each dimension under Scenario I_EN in the Yellow River Basin provinces.
ProvinceEconomic
Growth
Resources
Consumption
Ecology
Environment
Impact
Lower Reaches
Periodic MeanMean
Sort
Periodic MeanMean
Sort
Periodic MeanMean
Sort
Periodic MeanMean
Sort
Qinghai18,451.9629064.92156,192.1622937.882
Sichuan258,358.59253,122.814,010,785.9221,964.452
Gansu20,989.1492712593,202.26213,340.782
Ningxia8324.3547876.641243,600.44212,763.612
Inner-Mongolia94,928.05144,085.162787,153.95140,579.81
Shaanxi108,755.5120,922.5921,349,889.5139,129.281
Shanxi57,418.3338,773.2321,095,447.9157,254.481
Henan115,455.25435,022.7713,056,135.41152,156.021
Shandong172,713.63446,903.43112,232,4501--
Note: The color block, from light to dark, indicates the sorting results from the best to the worst.
Table 5. Comparative ranking of the development of each dimension under scenario I_ED in the Yellow River Basin provinces.
ProvinceEconomic
Growth
Resources
Consumption
Ecology
Environment
Impact
Lower Reaches
Periodic MeanMean
Sort
Periodic MeanMean
Sort
Periodic MeanMean
Sort
Periodic MeanMean
Sort
Qinghai19,018.51112,941.77332,695.1711712.491
Sichuan342,864161,524.933,088,360.3121,516.521
Gansu40,393.65112,357.853436,312.0219024.541
Ningxia13,645.62111,461.193176,289.7619236.821
Inner-Mongolia88,228.44252,568.743817,342.66242,530.062
Shaanxi108,517.61229,579.631,430,490.5249,998.642
Shanxi69,682.36140,420.0531,412,879.9273,845.332
Henan156,672.64138,999.8334,162,523.92207,239.862
Shandong217,203.87248,659.22215,923,1503--
Note: The color block, from light to dark, indicates the sorting results from the best to the worst.
Publisher’s Note: MDPI stays neutral with regard to jurisdictional claims in published maps and institutional affiliations.

