Abstract
The amount of anodically dissolved charge of silver by linear sweep stripping voltammetry has been observed to be smaller than that of the potentiostatically deposited charge. The imbalance in the charge is opposite to the participation in the double-layer capacitance. This can be explained in terms of the negative capacitive current, which is caused by dipoles of generated redox charge (Ag+) with counterions (NO3−). Lower concentrations of counterions may suppress the capacitance to retain the equality of the charge. This prediction is examined in this work by the oxidation of silver film at various concentrations of NO3− by anodic stripping voltammetry. The capacitance decreased with a decrease in the salt concentrations less than 0.05 mol dm−3. Low concentrations of salts prevent loss of the anodic charge in electroanalysis. This dependence was related with the lifespan of generated silver nitrate dipoles and is described theoretically.
1. Introduction
Supporting electrolyte is often added to a voltammetric solution [1] (143–145) in order to (i) provide ionic conduction between an anode and a cathode, (ii) to suppress the electric migration of redox species in solution, and (iii) to facilitate the charge transfer reactions with the help of charge neutrality. Item (i) can be represented quantitatively as the Poisson equation for microscopic localization of charge [2,3,4,5] and the Laplace equation for Ohm’s law macroscopically [6,7,8,9,10]. Parameters determining item (ii) are molar conductivity proper to each ion and its concentration [11]. In contrast, item (iii) is observed as chemical complications with electrolytes to generate unpredictable species [12,13,14,15,16]. It also causes a potential shift through the locally electrostatic interaction [17], which is distinguished from a long-ranged electric field in a cell by microelectrode voltammetry [18,19].
The above behavior has been discussed for voltammograms under a quasi-steady state. There are some dynamic effects of electrolytes on electrode reactions of which the classical one is the Frumkin’s effect [20]. This effect involves the dependence of the rates of the redox reactions on the potential in the double layer by electrolytes [21]. The evaluated rates depend on the concentrations of electrolytes as well as the adsorbed species [1] (pp. 571–575), [22]. However, the concentrations of electrolytes vary only slightly the experimental values of the double-layer capacitances [23,24,25,26], which are different from the prediction by the Gouy-Chapman’s theory. As a result, the Frumkin’s effect is not suitable for explaining the experimental results. Moreover, no typical redox couple has been found which proceeds through heterogeneous kinetics such as the Butler–Volmer type [27]. In spite of these problems, the Frumkin’s model has been used for an explanation of the concentration effects of the electrolyte [28,29].
A recently developed double-layer effect on redox reactions was revealed in a dynamically observed current, which is less than the diffusion-controlled one [30,31]. This effect was demonstrated specifically in ac impedance, for example, with the non-negligible values of the remainders of the real components of the Warburg admittance subtracted from the imaginary one [1] (pp. 377–380), [27]. It has been considered through the following: A redox species just after the charge transfer reaction is coupled with a counterion for electric neutrality to yield an electric dipole. Since the dipole is oriented in such a direction that the external field is enhanced, it yields a capacitance with a sign opposite to a conventional double-layer capacitance [30], called a negative capacitance. A double-layer capacitance relaxes the applied electric field, while a charge transfer reaction enhances it. Voltage dynamic techniques make it necessary to decrease diffusion-controlled currents by the amount of the charging currents of the negative capacitance. Since this effect occurs entropically toward an energy minimum, it should always be involved in every dynamic measurement by voltage change.
In order to evaluate the negative capacitance associated with redox reactions, it is necessary to extract the current proper to the redox reaction from the observed current. The remainder of the extraction should be the capacitive component. For example, diffusion-controlled currents by linear sweep voltammetry at the scan rate, v, are proportional to v1/2, whereas those by capacitance are to v. The observed current is represented as a sum of the two components. The graphical analysis enabled us to evaluate the capacitive current [32,33,34]. If adsorption occurs potentiostatically for a long time, the observed charge is purely the faradaic component without capacitive one. When the subsequent desorption is made by linear sweep voltammetry, the charge includes both the faradaic and the capacitive one. Then, the observed charge is imbalanced. The imbalance is caused by the difference in techniques of time-dependent potential control. The imbalance has been found in the stripping voltammetry of silver ion [35] and silver chloride [36] to demonstrate the participation in the negative capacitance.
When concentrations of electrolytes are so low that negative capacitance may be negligible, the reaction potential subtracting ohmic voltage may be shifted from the thermodynamic potential in order to satisfy the energy minimum on the reaction path. This prediction is close to the apparent behavior of the Frumkin’s effect [29]. In order to demonstrate the difference of the negative capacitance from the Frumkin’s effect, we will pay attention to the charge balance between the deposition and dissolution rather than the curve fitting [29]. Here, we explored concentration dependence on the exhibition of the negative capacitance, including the potential shift, by carrying out stripping voltammetry of silver ion. The imbalance of the charge had direct effects on the stripping voltammetry.
2. Experimental Section
Most experimental apparatuses, chemicals, procedures, and conditions were the same as in a previous report [35]. A noteworthy tool was a working electrode of an oil-penetrated carbon rod, 0.5 mm in diameter, used for a mechanical pencil, which was inserted into 10 mm of solution. The inserted electrode without insulator was helpful for avoiding floating capacitance at crevices between an electrode and an insulator. The depth and the meniscus at the boundary were observed through a microscope. There was no rise or recess of the meniscus. The rod was renewed at each voltammetric run by cutting off a used part.
The reference electrodes were a Ag|AgCl (sat. KCl) and a Ag|AgxO electrode. The former was employed for cyclic voltammetry, whereas the latter was used for avoiding leakage of chloride in low concentrations of electrolyte (NaNO3) at a series of long experimental runs of stripping voltammetry. Potentials by the Ag|AgxO electrode was corrected to those by the Ag|AgCl electrode. The counter electrode was a platinum wire. The values of pH in the AgNO3 + NaNO3 solutions were adjusted to 3.0 by titration of the HNO3 solution. The solutions were deaerated with nitrogen gas for 20 min before each voltammetric run.
3. Results
The deposited silver metal was dissolved anodically to Ag+ with the help of electric neutralization by NO3− to temporally form a dipole Ag+-NO3−, which is dissociated into Ag+ and NO3− to be dispersed by diffusion toward the solution. The former step yielded the capacitive flux, Jc, through the formation of the dipole, whereas the latter step may be controlled by the diffusion of Ag+ or the flux controlled by the Nernst equation. Cyclic voltammograms of the AgNO3 solution, including low (a) and high (b) concentrations of NaNO3, are shown in the inset of Figure 1. The Ag+-free solution showed only a flat voltammogram, as was demonstrated previously [35]. There was no remarkable difference in the voltammograms, except for the potential shift, which may be caused by the IR drop of the solution. We confirmed through the voltammogram, shown in the inset of Figure 1 and in Figure 2 in [35], that the reduction in H+ and NO3− had no effect on the stripping voltammograms. The scan rate (v) dependence of the cathodic peak currents at −0.17 V vs. AgxO showed proportionality to v1/2 for 0.01 V s−1 < v < 0.12 V s−1. Therefore, the current should be controlled by the diffusion of Ag+. The proportional constant provided the diffusion coefficient of Ag+ to be 2.9 × 10⁻⁵ cm2 s−1. Figure 1 also shows the current–time curves responding to the application of the reduction potential for 60 s and then of the anodic potential scan in a solution of 0.05 mM AgNO3 including two concentrations of NaNO3. Few differences were noticed at the peak potential and peak currents, which can be neglected mostly for the conventional stripping analysis.
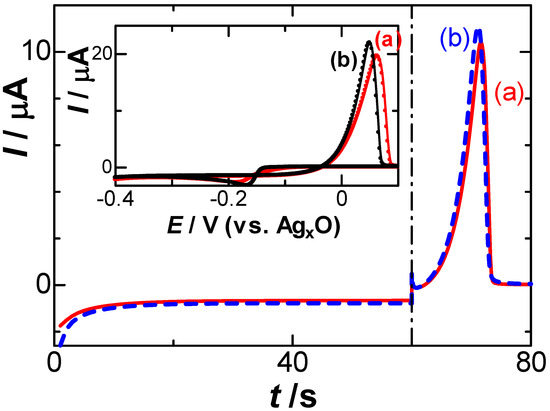
Figure 1.
Current–time curves by a constant potential of −0.25 V vs. Ag|AgxO for the reduction and then by the anodic scan at v = 10 mV s−1 in a solution of 0.05 mM AgNO3 including (a) 1 and (b) 500 mM NaNO3. The inset shows cyclic voltammograms.
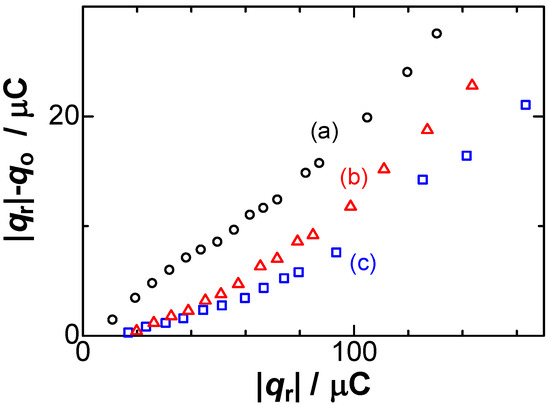
Figure 2.
Dependence of the difference in the charges, qo and |qr|, on the reduction charge in the solutions of (a) 200; (b) 50; (c) 1 mM NaNO3 at v = 10 mV s−1.
Our aim was to compare the deposited reduction charge, qr, and the dissolved oxidation charge, qo, rather than the curve fitting of the voltammetric shapes [29]. The currents were integrated with respect to time over the effective reacting periods to yield the charge numbers of qr and qo. The experimental results were |qr| < qo at high concentration of NaNO3 [35]. The inequality was inconsistent with Faraday’s law for electrolysis, qo = |qr|. Figure 2 shows variations of qo/|qr| with |qr| for some values of concentrations of electrolyte, NaNO3, exhibiting 0.8 < qo/|qr| < 1.0. This ratio of the charge loss has always been neglected in electroanalytical chemistry as a contribution of double-layer charge and/or impurity. Especially, lower values of qo/|qr| were found at higher concentrations as well as higher values of |qr|. We discuss, here, some possibilities of the unequal charge at the cathodic and the anodic process. The unequal amount, |qr| > q0, means whether the |qr| is overestimated from the diffusion-controlled charge or q0 is underestimated from the net charge of the deposition. The deposited charge, qr, was provided quantitatively by diffusion-controlled current of Ag+ in the controlled concentration without any side reaction through the analysis of scan-rate-dependent voltammograms. It did not include the charging current because of a constant voltage control. Therefore, qr represents the amount of deposited charge. The unequal charge should be attributed to underestimation of the anodic charge. The anodic current obtained by the anodic scan necessarily includes a capacitive component. Nevertheless, Figure 2 shows that the anodic charge was smaller than the deposited one. Another possibility is the dispersion of silver metal as small particles in solution such as the automatic dispersion of mercury metal [37]. The silver deposited from the Ag+ solution at concentrations over 1 mM was found to be lost by 10% when the deposition was left in an open circuit for periods over 60 s. No loss was found for the silver deposited in the present solutions of 0.05 mM AgNO3.
The imbalance of the charge was caused by the capacitive current responsible for the formation of the dipoles of electrochemically generated Ag+ coupled with the counterion (NO3−). The dipoles were oriented from the electrode to the solution such that the externally applied field may be enhanced rather than be relaxed. The direction of the orientation was opposite to that of the solvent dipoles, which take part in double-layer capacitances. Therefore, a part of the oxidation charge was suppressed by the capacitive currents for Ag+-NO3 dipoles during the anodic scan to yield qo < |qr| [26]. In other words, a decrease in [NO3−] prevents the formation of the dipoles to make qo approach |qr|. This was one of the aims of the present work.
The contribution of NO3− to qo < |qr| can be justified with forced supply of NO3− to the electrode. We stirred the solution with a magnetic stirrer during the stripping voltammetry. Figure 3 shows the variations of qo/|qr| with log|qr| at several rotation rates of the magnetic stirrer. With the rotation rates, the ratios decreased or the consumption ratios increased. Therefore, the convective supply of NO3− should be responsible for the imbalance of the charges.
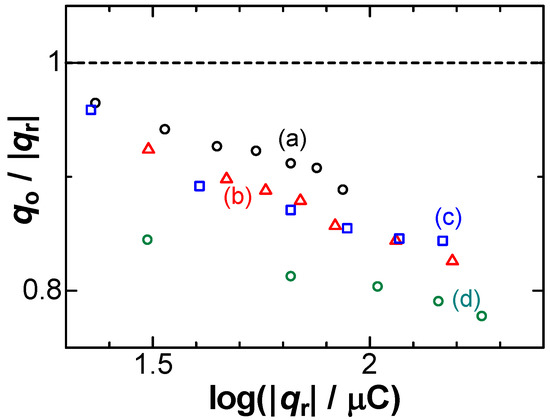
Figure 3.
Plots of qo/|qr| vs. log|qr| at rotation rates of (a) 0; (b) 0.25; (c) 0.67; (d) 1.50 rps in 0.05 mM AgNO3 + 50 mM NaNO3 for v = 10 mV s−1.
We conducted stripping voltammetry of CuSO4 and Pb(NO3)2. Dissolution of Cu into two forms, Cu+ and Cu2+, made the analysis complicated. Lead ion generated insoluble lead hydroxide in the pH domain avoiding the reduction of H+. At present, the simplest system is the present one, AgNO3.
4. Theory for Anodic Charge
The present theory describes the contribution of salt concentration to the negative capacitance associated with the oxidation of silver. The deposited silver metal is dissolved anodically in the form of Ag+ together with electric neutralization by NO3− to generate temporally a dipole Ag+-NO3−, which is followed by dissociation into Ag+ and NO3− to be dispersed by diffusion toward the solution. The former step yields the capacitive current density, jc, through the formation of the dipole, whereas the latter step may be controlled by the flux, jN, from the deposited charge amount, qr. If the two steps occur in a series, the total impedance is the sum of two impedances, or the inverse of the total current density j is the sum of 1/jc and 1/jN:
j = jcjN/(jc + jN)
When the capacitive impedance is inferior to the impedance of the Nernstian dispersion, jc > jN, the observed current can be approximated as j ≈ jN(1 − jN/jc) by the Taylor expansion. The time integral of j is qo, whereas that of jN is −qr. Then, we have:
where qc = ∫(jN2/jc)dt is the capacitive charge by the dipole.
qo = −qr − ∫(jN2/jc)dt ≡ |qr| − qc
Under the assumption of the reversible oxidation of Ag, the surface concentration of Ag+ at potential E, denoted by Γ(E), is obeyed with the Nernst equation [1] (pp. 591–592):
where Γ o is the standard amount at the standard potential, Eo. The time derivative of FΓ(E) yields jN:
for the linearly potential scan rate, v. In contrast, jc is caused by the dipole Ag+-NO3−, which is generated at the electrode as an intermediate through the anodic dissolution of Ag. The dipole is soon dissociated to Ag+ and NO3− to be dispersed to the solution by diffusion after a lifespan, τ [38]. Since it can work as a capacitance during τ, jc should be proportional to τ. The surface concentration of dipole is equivalent to Γ(E). As a result, we have jc = k′vτ Γ oexp(F(E−Eo)/RT) for a proportional constant, k′. Since the lifespan is a stagnation period for the dipole at a given location, it is inversely proportional to the transferring velocity, utr, for a random walk through τ = k″/utr. The effect of τ on the current has been justified by the convection of the solution in Figure 3. The transferring velocity can be represented as the square root of the kinetic (motional) energy or a part of free energy, U = U0 + RT ln(c-/co) of the dipole through utr = k‴U1/2, where c- is the concentration of NO3−. The series of τ, vtr, U and c- provides:
where τo is the lifespan at the standard concentration, co. The Gibbs free energy of solvation for anions is of the order of Uo = −300 kJ mol−1 [39], whereas RT= 2.5 kJ mol−1. The Taylor expansion of the power −1/2 yields:
Γ(E)/Γ o = exp[(E−Eo)F/RT]
jN = d{FΓ(E)}/dt = (Γ oF2v/RT) exp[(E−Eo)F/RT]
τ = (k″/k‴)U−1/2 = τo{1 + (RT/U0) ln(c-/co)}−1/2
jc = k′vτo{1 − (RT/2U0) ln(c-/co)}Γ oexp(F(E-Eo)/RT)
This implies that the capacitive current by the dipole should increase exponentially with the voltage and that it decrease with concentration of NO3− in the logarithmic form.
Insertion of Equations (4) and (6) into the integrand of Equation (2), we obtain:
where k1 = (Γ o/k’τo)(F2/RT)2. The time integration yields:
jN2/jc = k1v exp(F(E−Eo)/RT) {1 + (RT/U0) ln(c-/co)}1/2
qc = (k1RT/F) exp(F(E−Eo)/RT) {1 − (RT/2U0) ln(c-/co)}
It varies with the salt concentration logarithmically with the independence of the scan rates. There is a limitation of the theory in Equation (5), because the free energy of salt may take part in the lifespan in a complicated form.
5. Discussion
Experimentally available variables for the negative capacitance were (A) the amount of the deposit, (B) scan rates, and (C) concentrations of salt. Item (A) can be represented by the dependence of qc on qr, exhibiting an approximately linear relationship in Figure 2. Deviation came into prominence for large values of |qr|, probably because thicker Ag films at large values of |qr| make the flow stagnant near the dipoles to extend the lifespan, which can be predicted from Equation (8). On the other hand, the scan rate dependence of qc, item (B), is shown in Figure 4, keeping almost constant, as supported by Equation (8). The constant implies that qc should be independent of any operation of the dissolution.
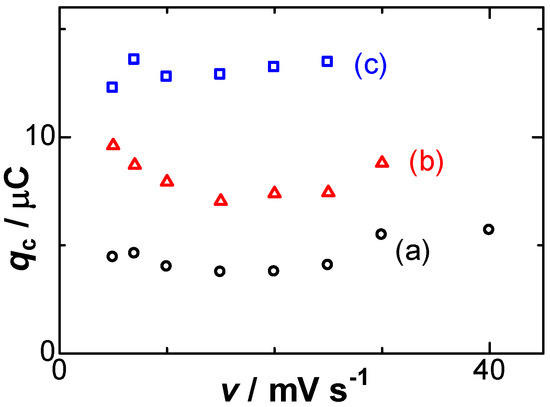
Figure 4.
Variations of qc with the scan rates for the deposition times of (a) 40; (b) 70; (c) 100 s.
Item (C) is roughly shown in Figure 2 as the increase in the slopes with an increase in the concentrations of NaNO3. The imbalance in the charge becomes conspicuous at high concentrations of salt. The values of the slope were plotted against logarithmic concentrations of NaNO3 in Figure 5. They increased linearly with the logarithmic concentration, as expected from Equation (8). The increase in qc with an increase in [NO3−] points to our aim that the negative capacitance was caused by the formation of dipoles of Ag+ with NO3−.
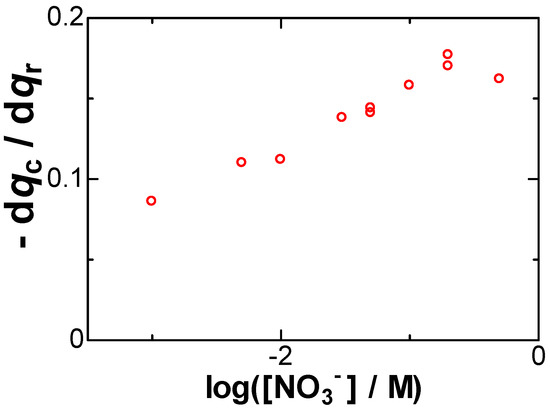
Figure 5.
Dependence of the slope of the plot of qc vs. qr on log([NO3−]/M) obtained in 0.05 mM AgNO3.
The logarithmic variation with [NO3−] can be understood to be due to the entropic effect of the concentration as follows: When concentrations are high, a newborn Ag+ on the electrode can catch specifically a neighboring NO3− ion to form a dipole as illustrated in Figure 6a. In contrast, a dope in low concentrations does not consist of one NO3− but statistically of several or many NO3− as shown in Figure 6b. As a result, the entropic effect is exhibited in the logarithmic form.
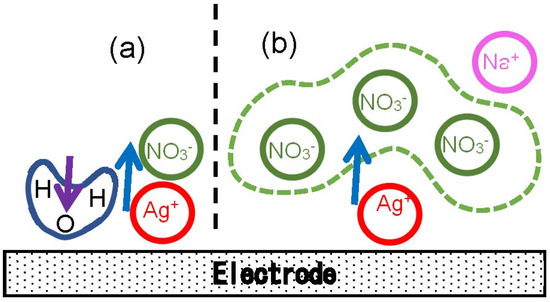
Figure 6.
Illustration of the arrangement of NO3− ions near a newborn Ag+ at (a) high and (b) low concentrations. A H2O dipole in (a) is oriented in the direction opposite to that of AgNO3 to cause the double-layer capacitance.
The decrease in the anodic current with an increase in [NO3−], demonstrated in Figure 2 and Figure 5, implies that lower concentrations of supporting electrolytes would be desirable for the analytical sensitivity of stripped species. We examined the salt effect on the stripping analysis for practical electrochemical detection. Figure 7 shows the dependence of the peak currents of stripped anodic voltammograms on |qr| at two concentrations of NaNO3. The current values were almost independent of the salt concentrations. This fact seems to be inconsistent with the concentration dependence of the charge in Figure 2. Low concentrations of salts often caused the peak potential to shift, associated with a decrease in peak currents due to the IR drop. Therefore, the decrease in the peak current was compensated with the loss of the charge at low concentrations of the salt.
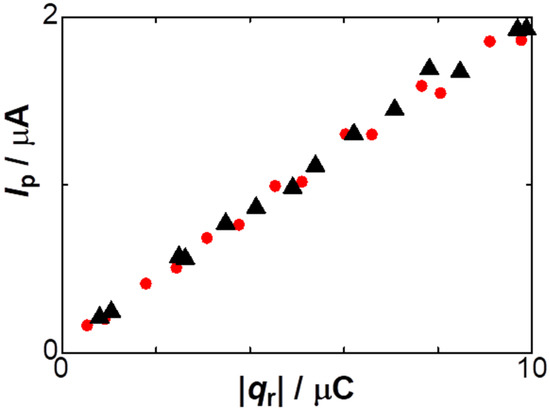
Figure 7.
Dependence of the anodic peak currents on |qr| in the solutions including 2 mM NaNO3 (triangles) and 50 mM NaNO3 (circles) with 5 mM AgNO3 at v = 0.01 V s−1.
6. Conclusions
Charges measured using time variations were observed to be smaller than the latent redox charge by the amount of the current generating dipoles of the redox species. The direction of the current was opposite to that of the double-layer capacitance because of the difference in the directions of the oriented dipoles. As a result, the dissolution charge by linear sweep voltammetry was smaller than that of the potentiostatically deposited one in magnitude, exhibiting a charge imbalance. This phenomenon can be generalized to induce that time-dependent electrolysis should necessarily cause capacitive currents such that the faradaic charge may be underestimated. This is the result of an energetic phenomenon of nature.
Although the imbalanced charge can be minimized at low concentrations of counterions, this effect is not conspicuous at concentrations less than 50 mM. Therefore, it is desirable to maintain concentrations of electrolyte to be low. The imbalance of the charge was not reflected to the peak currents of stripped voltammograms, because the peak currents were observed to be smaller owing to the IR drop of the solution.
Author Contributions
Conceptualization, J.C.; Data curation, R.W.; Formal analysis, K.J.A.; Methodology, R.W. and K.J.A.; Supervision, J.C.; Writing—original draft, K.J.A.; Writing—review & editing, J.C. All authors have read and agreed to the published version of the manuscript.
Funding
This research received no external funding.
Institutional Review Board Statement
Not applicable.
Informed Consent Statement
Not applicable.
Data Availability Statement
Not applicable.
Conflicts of Interest
The authors declare no conflict of interest.
List of Variables
| c- | concentration of NO3−, mol m−3 |
| F | Faraday’s constant, C mol−1 |
| j | total current density, A m−2 |
| jc | capacitive current density, A m−2 |
| jN | current density for Nernstian dispersion, A m−2 |
| qo | charge of dissolved Ag, C |
| qr | deposited charge, C |
| qc | capacitive charge by the dipole, given by ∫(jN2/jc)dt, C |
| R | gas constant, J mol−1 K−1 |
| T | temperature, K |
| t | time, s |
| U | kinetic (motional) energy of a dipole, J |
| utr | transferring velocity of a dipole for random walk, m s−1 |
| v | potential scan rate, V s−1 |
| Γ | surface concentration of Ag+, mol m−2 |
| Γ ο | standard amount at the standard potential, Eo, mol m−2 |
| τ | lifespan, of a dipole before dispersion by diffusion, s |
| τo | lifespan at the standard concentration, co, s |
References
- Bard, A.J.; Faulkner, L.R. Electrochemical Methods: Fundamentals and Applications; John Willey & Sons: New York, NY, USA, 2001; pp. 143–592. [Google Scholar]
- Dickinson, E.J.F.; Compton, R.G. Influence of the diffuse double layer on steady-state voltammetry. J. Electroanal. Chem. 2011, 661, 198–212. [Google Scholar] [CrossRef]
- Yan, D.; Bazant, M.Z.; Biesheuvel, P.M.; Pugh, M.C.; Dawson, F.P. Theory of linear sweep voltammetry with diffuse charge: Unsupported electrolytes, thin films, and leaky membranes. Phys. Rev. E 2017, 95, 033303. [Google Scholar] [CrossRef] [PubMed]
- Moya, A.A.; Sistat, P. Reaching the limiting current regime by linear sweep voltammetry in ion-exchange membrane systems. J. Membr. Sci. 2018, 555, 134–145. [Google Scholar] [CrossRef]
- Tan, S.-Y.; Perry, D.; Unwin, P.R. Double layer effects in voltammetric measurements with scanning electrochemical microscopy (SECM). J. Electroanal. Chem. 2018, 819, 240–250. [Google Scholar] [CrossRef]
- Newman, J.S. Electrochemical Systems; Prentice-Hall: Upper Saddle River, NJ, USA, 1973; p. 344. [Google Scholar]
- Britz, D. The Laplace Equation and other Steady-State Systems. In Digital Simulation in Electrochemistry; Lecture Notes in Chemistry; Springer: Berlin/Heidelberg, Germany, 1981; Volume 23. [Google Scholar] [CrossRef]
- Guo, Z.; Jiang, X. An Integrated Dual Ultramicroelectrode with Lower Solution Resistance Applied in Ultrafast Cyclic Voltammetry. Anal. Sci. 2005, 21, 101–105. [Google Scholar] [CrossRef]
- Batchelor-McAuley, C.; Ngamchuea, K.; Compton, R.G. Simulated low-support voltammetry: Deviations from Ohm’s Law. J. Electroanal. Chem. 2018, 830–831, 88–94. [Google Scholar] [CrossRef]
- Henley, I.E.; Fisher, A.C. Computational Electrochemistry: The Simulation of Voltammetry in Microchannels with Low Conductivity Solutions. J. Phys. Chem. B 2003, 107, 6579–6585. [Google Scholar] [CrossRef]
- Atkins, P.; Paula, J.D. Atkin’s Physical Chemistry, 8th ed.; W. H. Freeman and Company: New York, NY, USA, 2006; p. 762. [Google Scholar]
- Ciszkowska, M.; Osteryoung, J.G. Voltammetry of Metals at Mercury Film Microelectrodes in the Absence and the Presence of Varying Concentrations of Supporting Electrolyte. Anal. Chem. 1995, 67, 1125–1131. [Google Scholar] [CrossRef]
- Bond, A.M.; Lay, P.A. Cyclic voltammetry at microelectrodes in the absence of added electrolyte using a platinum quasi-reference electrode. J. Electroanal. Chem. 1986, 199, 285–295. [Google Scholar] [CrossRef]
- Cassidy, J.; Khoo, S.B.; Pons, S.; Fleischmann, M. Electrochemistry at very high potentials: The use of ultramicroelectrodes in the anodic oxidation of short-chain alkanes. J. Phys. Chem. 1985, 89, 3933–3935. [Google Scholar] [CrossRef]
- Daniele, S.; Bragato, C.; Baldo, M.A. Microelectrode voltammetry for the simultaneous reduction of labile complexes of two divalent cations in aqueous solutions with and without supporting electrolyte. J. Electroanal. Chem. 1998, 456, 105–112. [Google Scholar] [CrossRef]
- Belding, S.R.; Limon-Petersen, J.G.; Dickinson, E.J.; Compton, R.G. Cyclic voltammetry in the absence of excess supporting electrolyte offers extra kinetic and mechanistic insights: Comproportionation of anthraquinone and the anthraquinone dianion in acetonitrile. Angew. Chem. 2010, 49, 9242–9245. [Google Scholar] [CrossRef]
- Zhang, C.; Aoki, K.J.; Chen, J.; Nishiumi, T. Blocking of two-electron reduction of non-charged species in the absence of supporting electrolyte at nanoelectrodes. J. Electroanal. Chem. 2013, 708, 101–107. [Google Scholar] [CrossRef]
- Ciszkowska, M.; Stojek, Z. Voltammetry in solutions of low ionic strength. Electrochemical and analytical aspects. J. Electroanal. Chem. 1999, 466, 129–143. [Google Scholar] [CrossRef]
- Aoki, K.J.; Chen, J. Insight of electrolyte-free voltammetry at microelectrodes. Opin. Electrochem. 2018, 10, 67–71. [Google Scholar] [CrossRef]
- Frumkin, A.N. Wasserstoffüberspannung und Struktur der Doppelschicht. Z. Phys. Chem. 1933, 164A, 121–133. [Google Scholar] [CrossRef]
- Van Soestbergen, M. Frumkin-Butler-Volmer Theory and Mass Transfer in Electrochemical Cells. Russ. J. Electrochem. 2012, 48, 570–579. [Google Scholar] [CrossRef]
- White, R.E.; Bockris, J.O.; Conway, B.E.; Yeager, E. Comprehensive Treatise of Electrochemistry; Plenum Press: New York, NY, USA, 1984; Volume 8, pp. 277–282. [Google Scholar]
- Hou, Y.; Aoki, K.J.; Chen, J.; Nishiumi, T. Invariance of double layer capacitance to polarized potential in halide solutions. Univ. J. Chem. 2013, 1, 162–169. [Google Scholar] [CrossRef]
- Hou, Y.; Aoki, K.J.; Chen, J.; Nishiumi, T. Solvent Variables Controlling Electric Double Layer Capacitance at Metal|Solution Interface. J. Phys. Chem. C 2014, 118, 10153–10158. [Google Scholar] [CrossRef]
- Zhao, X.; Aoki, K.J.; Chen, J.; Nishiumi, T. Examination of the Gouy–Chapman theory for double layer capacitance in deionized latex suspensions. RSC Adv. 2014, 4, 63171–63181. [Google Scholar] [CrossRef]
- Aoki, K.J. Frequency-dependence of electric double layer capacitance without Faradaic reactions. J. Electroanal. Chem. Spec. Issue Aoki 2016, 779, 117–125. [Google Scholar] [CrossRef]
- Aoki, K.J.; Zhang, C.; Chen, J.; Nishiumi, T. Heterogeneous reaction rate constants by steady-state microelectrode techniques and fast scan voltammetry. J. Electroanal. Chem. 2013, 706, 40–47. [Google Scholar] [CrossRef]
- Dickinson, E.J.F.; Limon-Petersen, J.G.; Rees, N.V.; Compton, R.G. How much supporting electrolyte is required to make a cyclic voltammetry experiment quantitatively “diffusional”? A theoretical and experimental investigation. J. Phys. Chem. C 2009, 113, 11157–11171. [Google Scholar] [CrossRef]
- Ngamchuea, K.; Batchelor-McAuley, C.; Compton, R.G. Anodic stripping voltammetry of silver in the absence of electrolytes: Theory and experiment. J. Electroanal. Chem. 2018, 830–831, 122–130. [Google Scholar] [CrossRef]
- Aoki, K.J.; Chen, J.; Zeng, X.; Wang, Z. Decrease in double layer capacitance by Faradaic current. RSC Adv. 2017, 7, 22501–22509. [Google Scholar] [CrossRef]
- Aoki, K.J.; Chen, J.; Tang, P. Capacitive currents flowing in the direction opposite to redox currents. J. Phys. Chem. C 2018, 122, 16727–16732. [Google Scholar] [CrossRef]
- Aoki, K.J.; Chen, J.; Liu, Y.; Jia, B. Peak potential shift for fast cyclic voltammograms owing to capacitance of redox reactions. J. Electroanal. Chem. 2020, 856, 113609. [Google Scholar] [CrossRef]
- Aoki, K.J.; Taniguchi, S.; Chen, J. Participation in negative capacitance of diffusion-controlled voltammograms of hemin. Omega ACS 2020, 45, 29447–29452. [Google Scholar] [CrossRef]
- Liu, Y.; Aoki, K.J.; Chen, J. A loss of charge at reduction of hydrogen ion by fast scan voltammetry. J. Electrochem. Soc. 2022, 169, 036510. [Google Scholar] [CrossRef]
- Aoki, K.J.; Chen, J.; Wang, R. Stripped Charge of Ag less than Deposited one Owing to Negative Capacitance Caused by Redox Reactions. Electroanalysis 2019, 31, 1–9. [Google Scholar] [CrossRef]
- Tang, P.; Aoki, K.J.; Chen, J. Reduction Charge Smaller than the Deposited One in Cathodic Stripping Voltammograms of AgCl. Am. J. Anal. Chem. 2019, 10, 286–295. [Google Scholar] [CrossRef]
- Aoki, K.; Li, C.; Nishiumi, T.; Chen, J. Self-dispersion of mercury metal into aqueous solutions. J. Electroanal. Chem. 2012, 682, 66–71. [Google Scholar] [CrossRef][Green Version]
- Castellani, M.E.; Anstoter, C.S.; Verlet, J.R.R. On the stability of a dipole-bound state in the presence of a molecule. Phys. Chem. Chem. Phys. 2019, 21, 24286–24290. [Google Scholar] [CrossRef] [PubMed]
- Marcus, Y. Thermodynamics of Solvation of Ions. Part 5.—Gibbs Free Energy of Hydration at 298.15 K. J. Chem. Soc. Faraday Trans. 1991, 87, 2995–2999. [Google Scholar] [CrossRef]


Publisher’s Note: MDPI stays neutral with regard to jurisdictional claims in published maps and institutional affiliations. |
© 2022 by the authors. Licensee MDPI, Basel, Switzerland. This article is an open access article distributed under the terms and conditions of the Creative Commons Attribution (CC BY) license (https://creativecommons.org/licenses/by/4.0/).