Article

Phosphorus Sorption in Soils and Clay Fractions Developed from Different Parent Rocks in Limpopo Province, South Africa

1
Faculty of Science, Engineering and Agriculture, University of Venda, Thohoyandou 0950, South Africa
2
Directorate of Research and Innovation, University of Venda, Thohoyandou 0950, South Africa
*
Author to whom correspondence should be addressed.
Sustainability 2022, 14(14), 8528; https://doi.org/10.3390/su14148528
Submission received: 5 April 2022 / Revised: 3 July 2022 / Accepted: 4 July 2022 / Published: 12 July 2022
(This article belongs to the Special Issue Soil Management Practices to Promote Soil Health)

Abstract

:
Phosphorus (P) sorption dynamics in soils have implications for the environment and soil fertility. Soils and clay fractions that were developed from basalt, granite, arkosic sandstone, and gneiss in Limpopo Province, South Africa were analysed for their P adsorption characteristics and external phosphorus requirements (EPR). The relationship between the P adsorption parameters and EPR of the soils and clay fractions were also assessed. The Langmuir adsorption isotherms for the soils and clay fractions gave a better fit with slightly higher R-square values relative to the Freundlich adsorption isotherms. The Langmuir P sorption maxima were between 285.71 and 833.33 mg/kg and 238.09 and 625.0 mg/kg for the soils and clay fractions, respectively, and the EPR values ranged from 7.78 to 92.91 mgP/kg and 5.13 to 65.85 mgP/kg for the soils and clay fractions, respectively. The variations in the EPR suggest a single, uniform P fertiliser application to the soils could cause under-fertilisation and over-fertilisation problems. The soils that were developed from basalt, relative to the others, showed no risk to the water quality in the region at the current rate of P fertiliser application. The P sorption parameters of the soils and clay fractions showed no statistically significant differences. Hence, the P sorption parameters of the clay fractions could be reliable predictors of the P sorption and buffering in their respective soils.

1. Introduction

Two factors that are responsible for impeding enhanced agricultural production in Sub-Saharan Africa are poor soil fertility and the unavailability of water during plant growth [1]. Statistical data on climate and soil characteristics have indicated that 12% of the soils in South Africa (SA) are fit to grow rain-fed crops with only 3% considered to be readily fertile. With the population of SA projected to reach 82 million by 2035, food production must increase using the same amount of or fewer natural resources [2]. From a report by FAO and ITPS [3], most South African soils are deficient in phosphorus (P) which is an essential plant nutrient [4].
The insufficiency of P in soils has been attributed to P deficiency in the parent rocks, the excessive sorption property of aluminium (Al) and iron (Fe) oxides, and the clay minerals (such as kaolins) that are present in the soil clay fractions of tropical and subtropical environments which render applied P unavailable to plants even in soils with high P levels [5]. Kaolin P sorption in soils occurs in areas with more Al–OH sites on the faces and exposures at the edges. However, the surplus H+ ions that are present in low-pH soils due to the exposed Si–OH and Al–OH cause P ions to be easily attracted. The adsorption of P in soils is pH-dependent. The reaction of P on the reactive surfaces of Fe and Al oxides is very important due to their predominance in acidic soils. Fe and Al can easily fix precipitated organically bound P in the soils. Conversely, the mechanism of P sorption is dominated by its reaction with CaCO3 by forming Ca–P minerals in alkaline soils. Phosphorus is most available in the pH range of 6.5 to 7.0 and the charge of the P species in a solution and on the surface of the adsorbing components in the soils are altered outside this range [6]. In order to conserve soil fertility and improve crop production globally, fertilisers are applied; though a lot do not reach the targeted site, further resulting in a greater amount of input cost, environmental degradation, and soil degradation. In recent times, nanofertilisers have been advocated for as an alternative in sustainable agriculture; however, they are yet to attain global application relative to that of conventional fertilisers’ applications [7]. Freshwater surface water resources in SA are limited and are currently most severely impacted by eutrophication that is attributed to agricultural P losses [8]. The recommended limits of most P fertilisers are blanket and without any reference to site characteristics, particularly soil types which largely depend on the parent rocks’ characteristics, weathering intensities, and soil evolution conditions [9].
Studies on the P sorption dynamics of soils in relation to their parent rocks are very rare. In addition, the sorption capacities of soils have been linked to the sorption capacity of the clay fractions within them using the Freundlich and Langmuir adsorption isotherm models [10]. The Limpopo Province in SA accounts for over 60% of the agricultural crops and vegetables that are produced in the entire country; these are grown over soils that are developed from different parent rocks. Increasing the precision of the application of fertilisers in SA in order to reduce the problems of over-fertilisation/under-fertilisation, improve soil and water quality, and optimise economic returns is crucial [11].
This study aimed to assess the P adsorption parameters, the P requirement variations, and the relationship between the P sorption capacities of soils and clay fractions that were developed from different parent rocks in Limpopo Province, SA. The study will provide more insight on the geogenic influence of the parent rocks on P adsorption dynamics in soils, an influence which has been neglected in soil fertility management policies. This understanding is important as it can guide policy makers in setting baselines for future conventional P fertiliser applications.

2. Materials and Methods

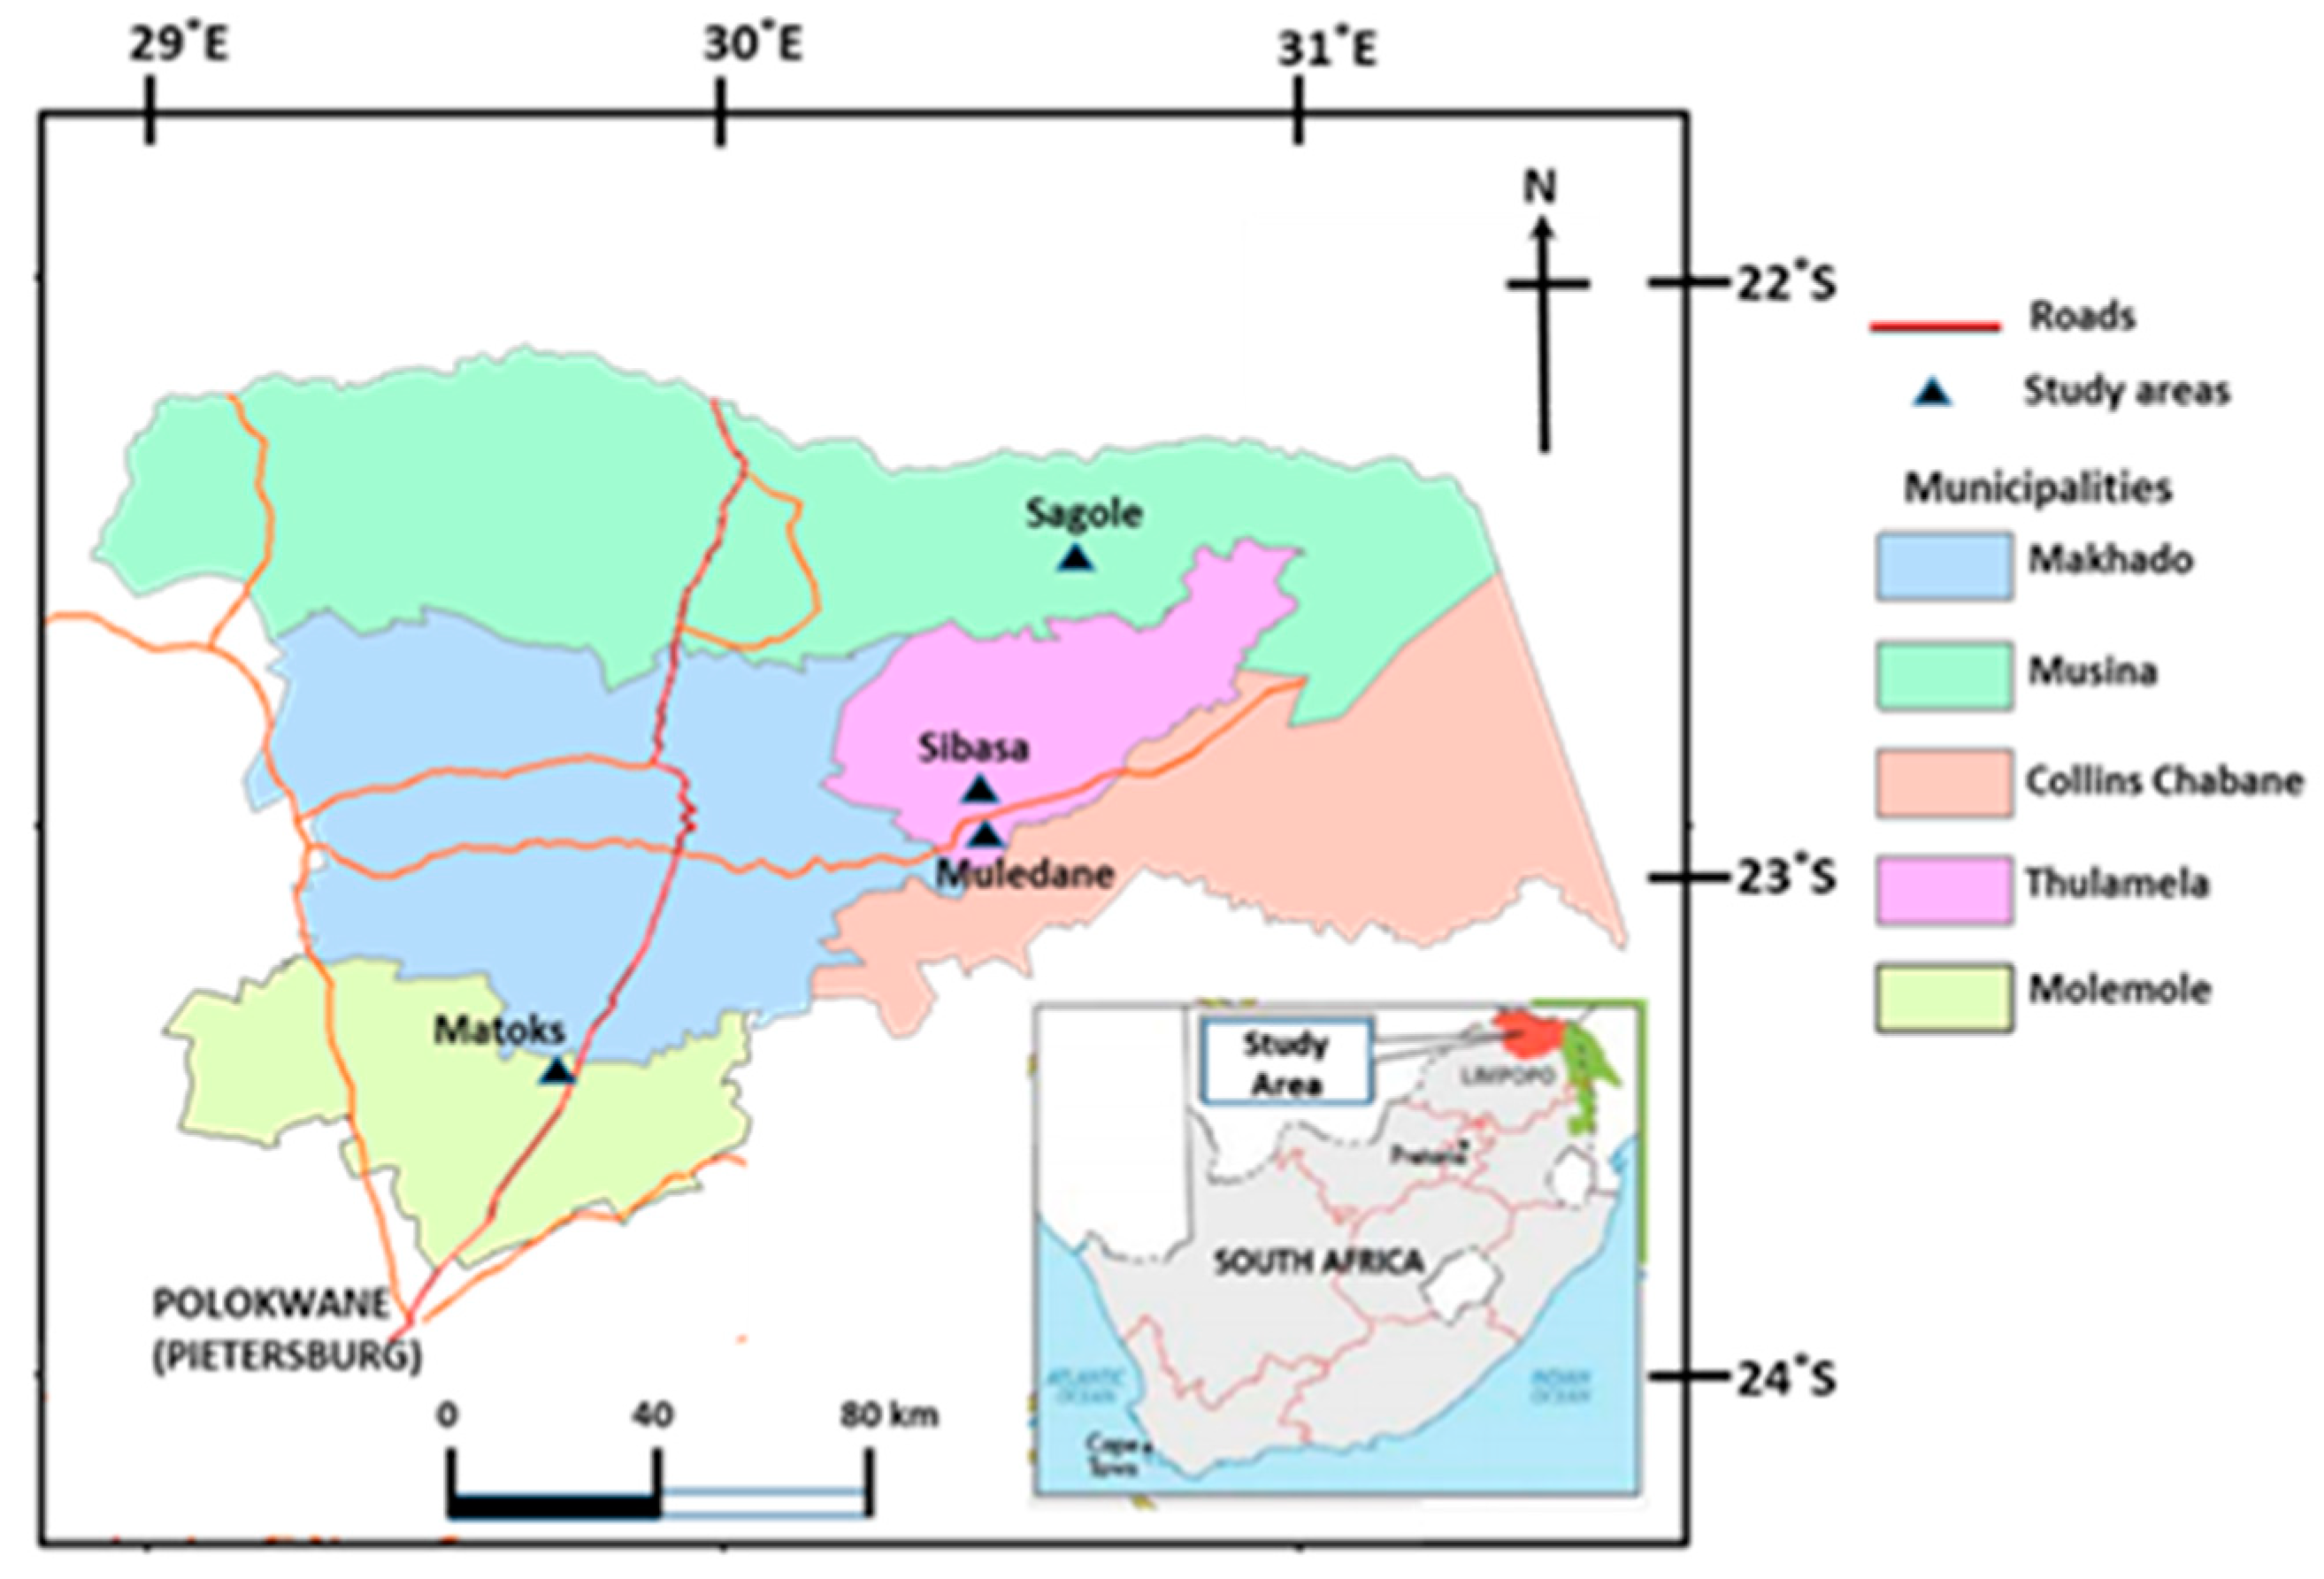
2.1. Description of the Study Areas

The study areas are located within the Vhembe (Thulamela and Musina Municipalities) and Capricorn (Molemole Municipality) districts in Limpopo Province, SA (Figure 1, Table 1). The Vhembe District is the hub of commercial farming in the Limpopo Province; whereas the Capricorn District, which is named after the Tropic of Capricorn which passes through it, is the economic hub of the Limpopo Province.

2.2. Soil Sampling and Preparation

Surface soil samples (0–20 cm) were collected from soil profiles that were developed from basalt, granite, arkosic sandstone, and gneiss (Table 1). The air-dried and disaggregated soils were oxidic in nature with Hutton form and Portsmouth 35 series [12].
Figure 1. Map of Limpopo Province showing the locations of the study areas (modified after Hall et al. [13]).
Sustainability 14 08528 g001
Table 1. Summary details on the study areas (modified after Oyebanjo et al. [14]).
S/NParent RockMunicipality/LocationCoordinatesClimate 1
1.BasaltThulamela/SibasaS1—22°57′09″ S
30°27′10″ E
S2—22°57′27″ S
30°27′51″ E
S3—22°56′17″ S
30°28′13″ E
Semi-arid, dry hot (BSh)
2.GneissThulamela/Muledane MU1—23°01′06″ S
30°27′08″ E
MU2—23°01′36″ S
30°27′41″ E
MU3—23°02′16″ S
30°27′28″ E
Semi-arid, dry hot (BSh)
3.GraniteMolemole/Matoks MAT1—23° 27′ 46″ S
29°44′03″ E
MAT2—23°27′16″ S
29°44′48″ E
MAT3—23°26′03″ S
29°44′49″ E
Warm temperate, winter dry, hot summer (CWa)
4.Arkosic SandstoneMusina/Sagole SA1—22°31′39″ S
30°36′16″ E
SA2—22°31′01″ S
30°36′54″ E
SA3—22°30′20″ S
30°36′44″ E
Semi-arid, dry hot (BSh)
1 Kὄppen–Geiger climate classification for South Africa [15].
A <2 mm fraction was taken as the bulk [16]. The clay (<2 μm) fractions were separated from the <63 μm fraction (silt + clay) by dispersion and centrifuging [17,18]. The <2 μm fractions were obtained by ultrasonication with an energy input of 300 J m/L (1 min) using a probe type ultrasonic disintegrator UP400S that was equipped with 7 mm diameter sonotrode S7. The samples were then centrifuged at 1000 rotations per minute (rpm) for 3 min. The floating phases (<2 μm) were transferred into petri dishes and oven dried at 105 °C. The oven dried clay fractions were gently crushed and used for the analyses.

2.3. P Sorption Measurements
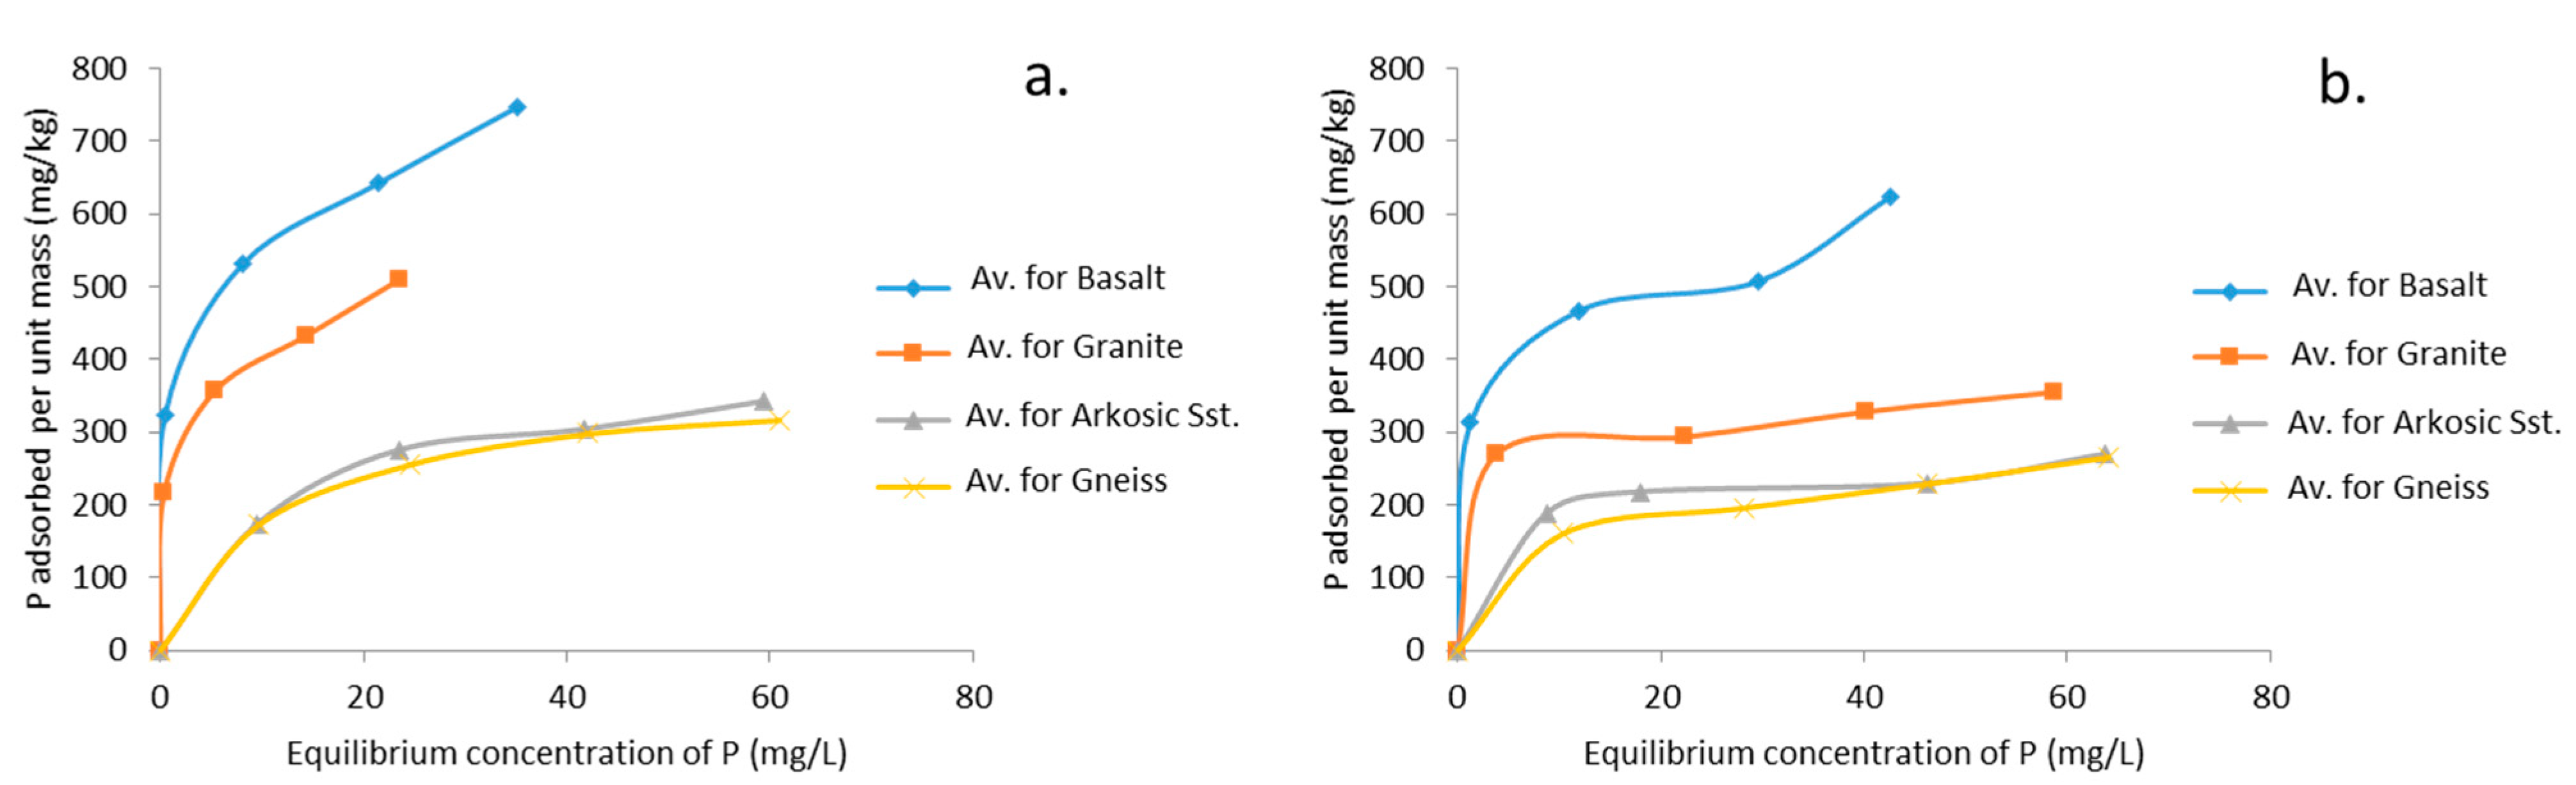
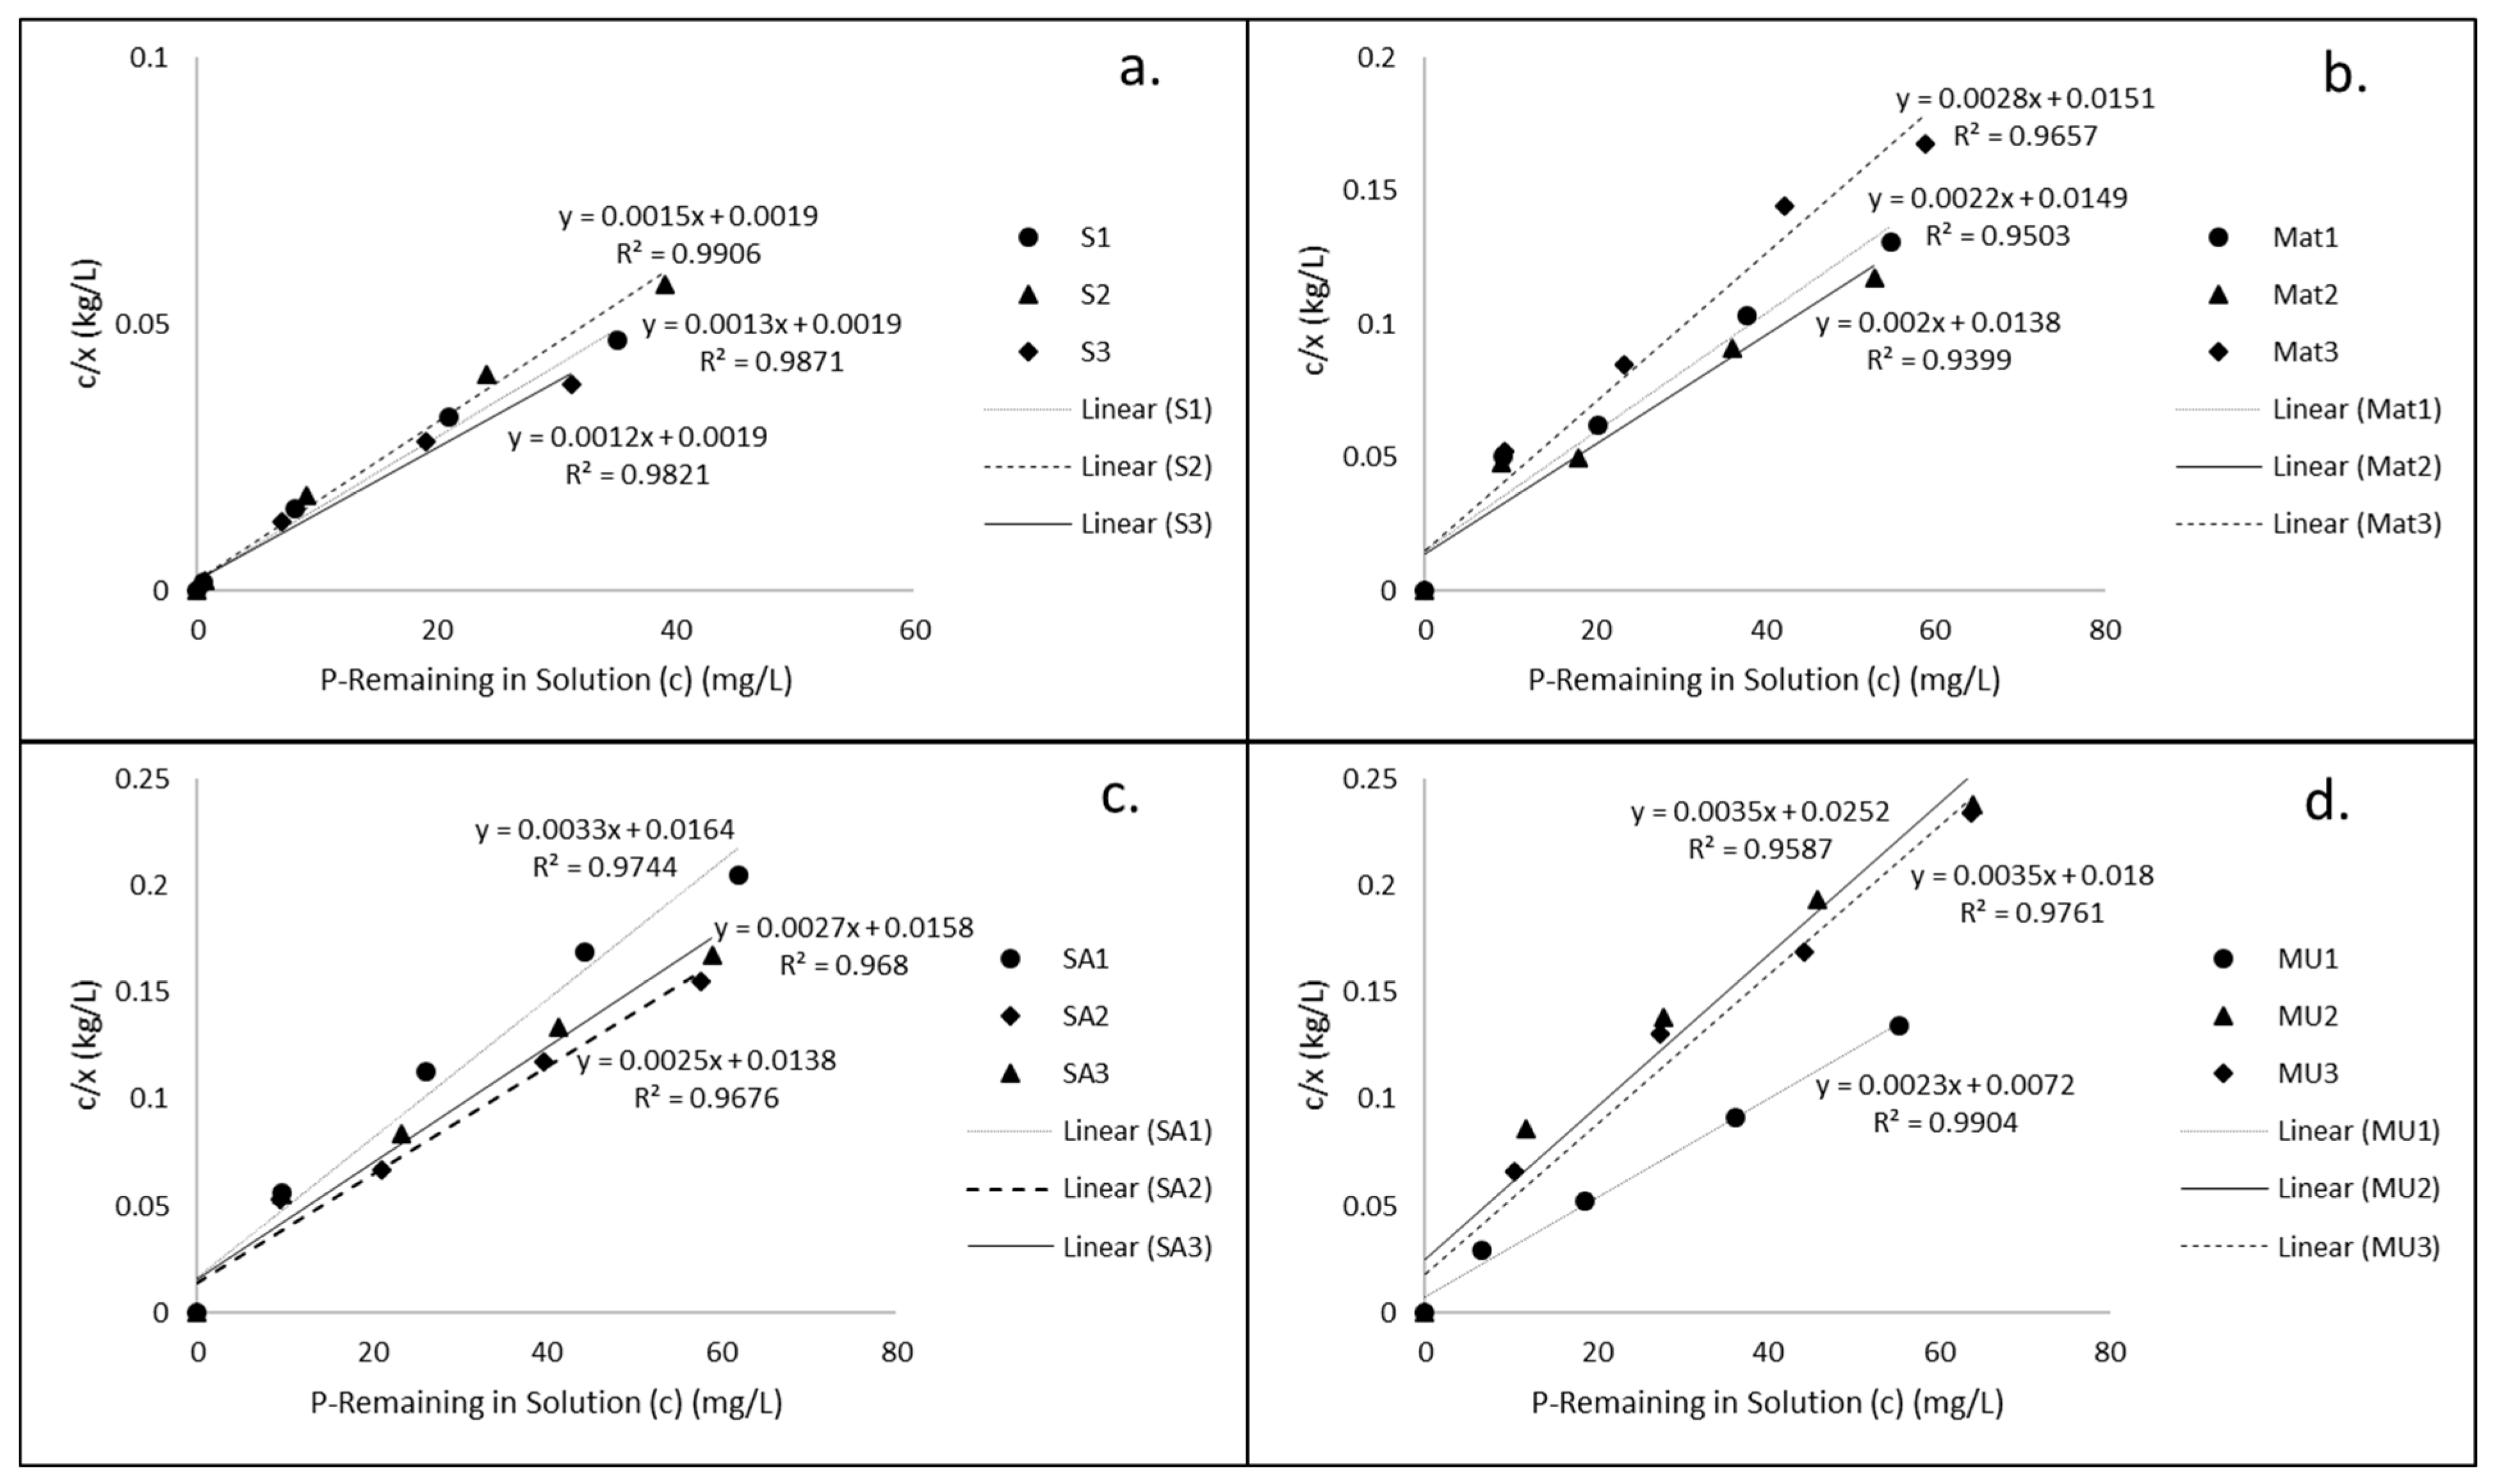
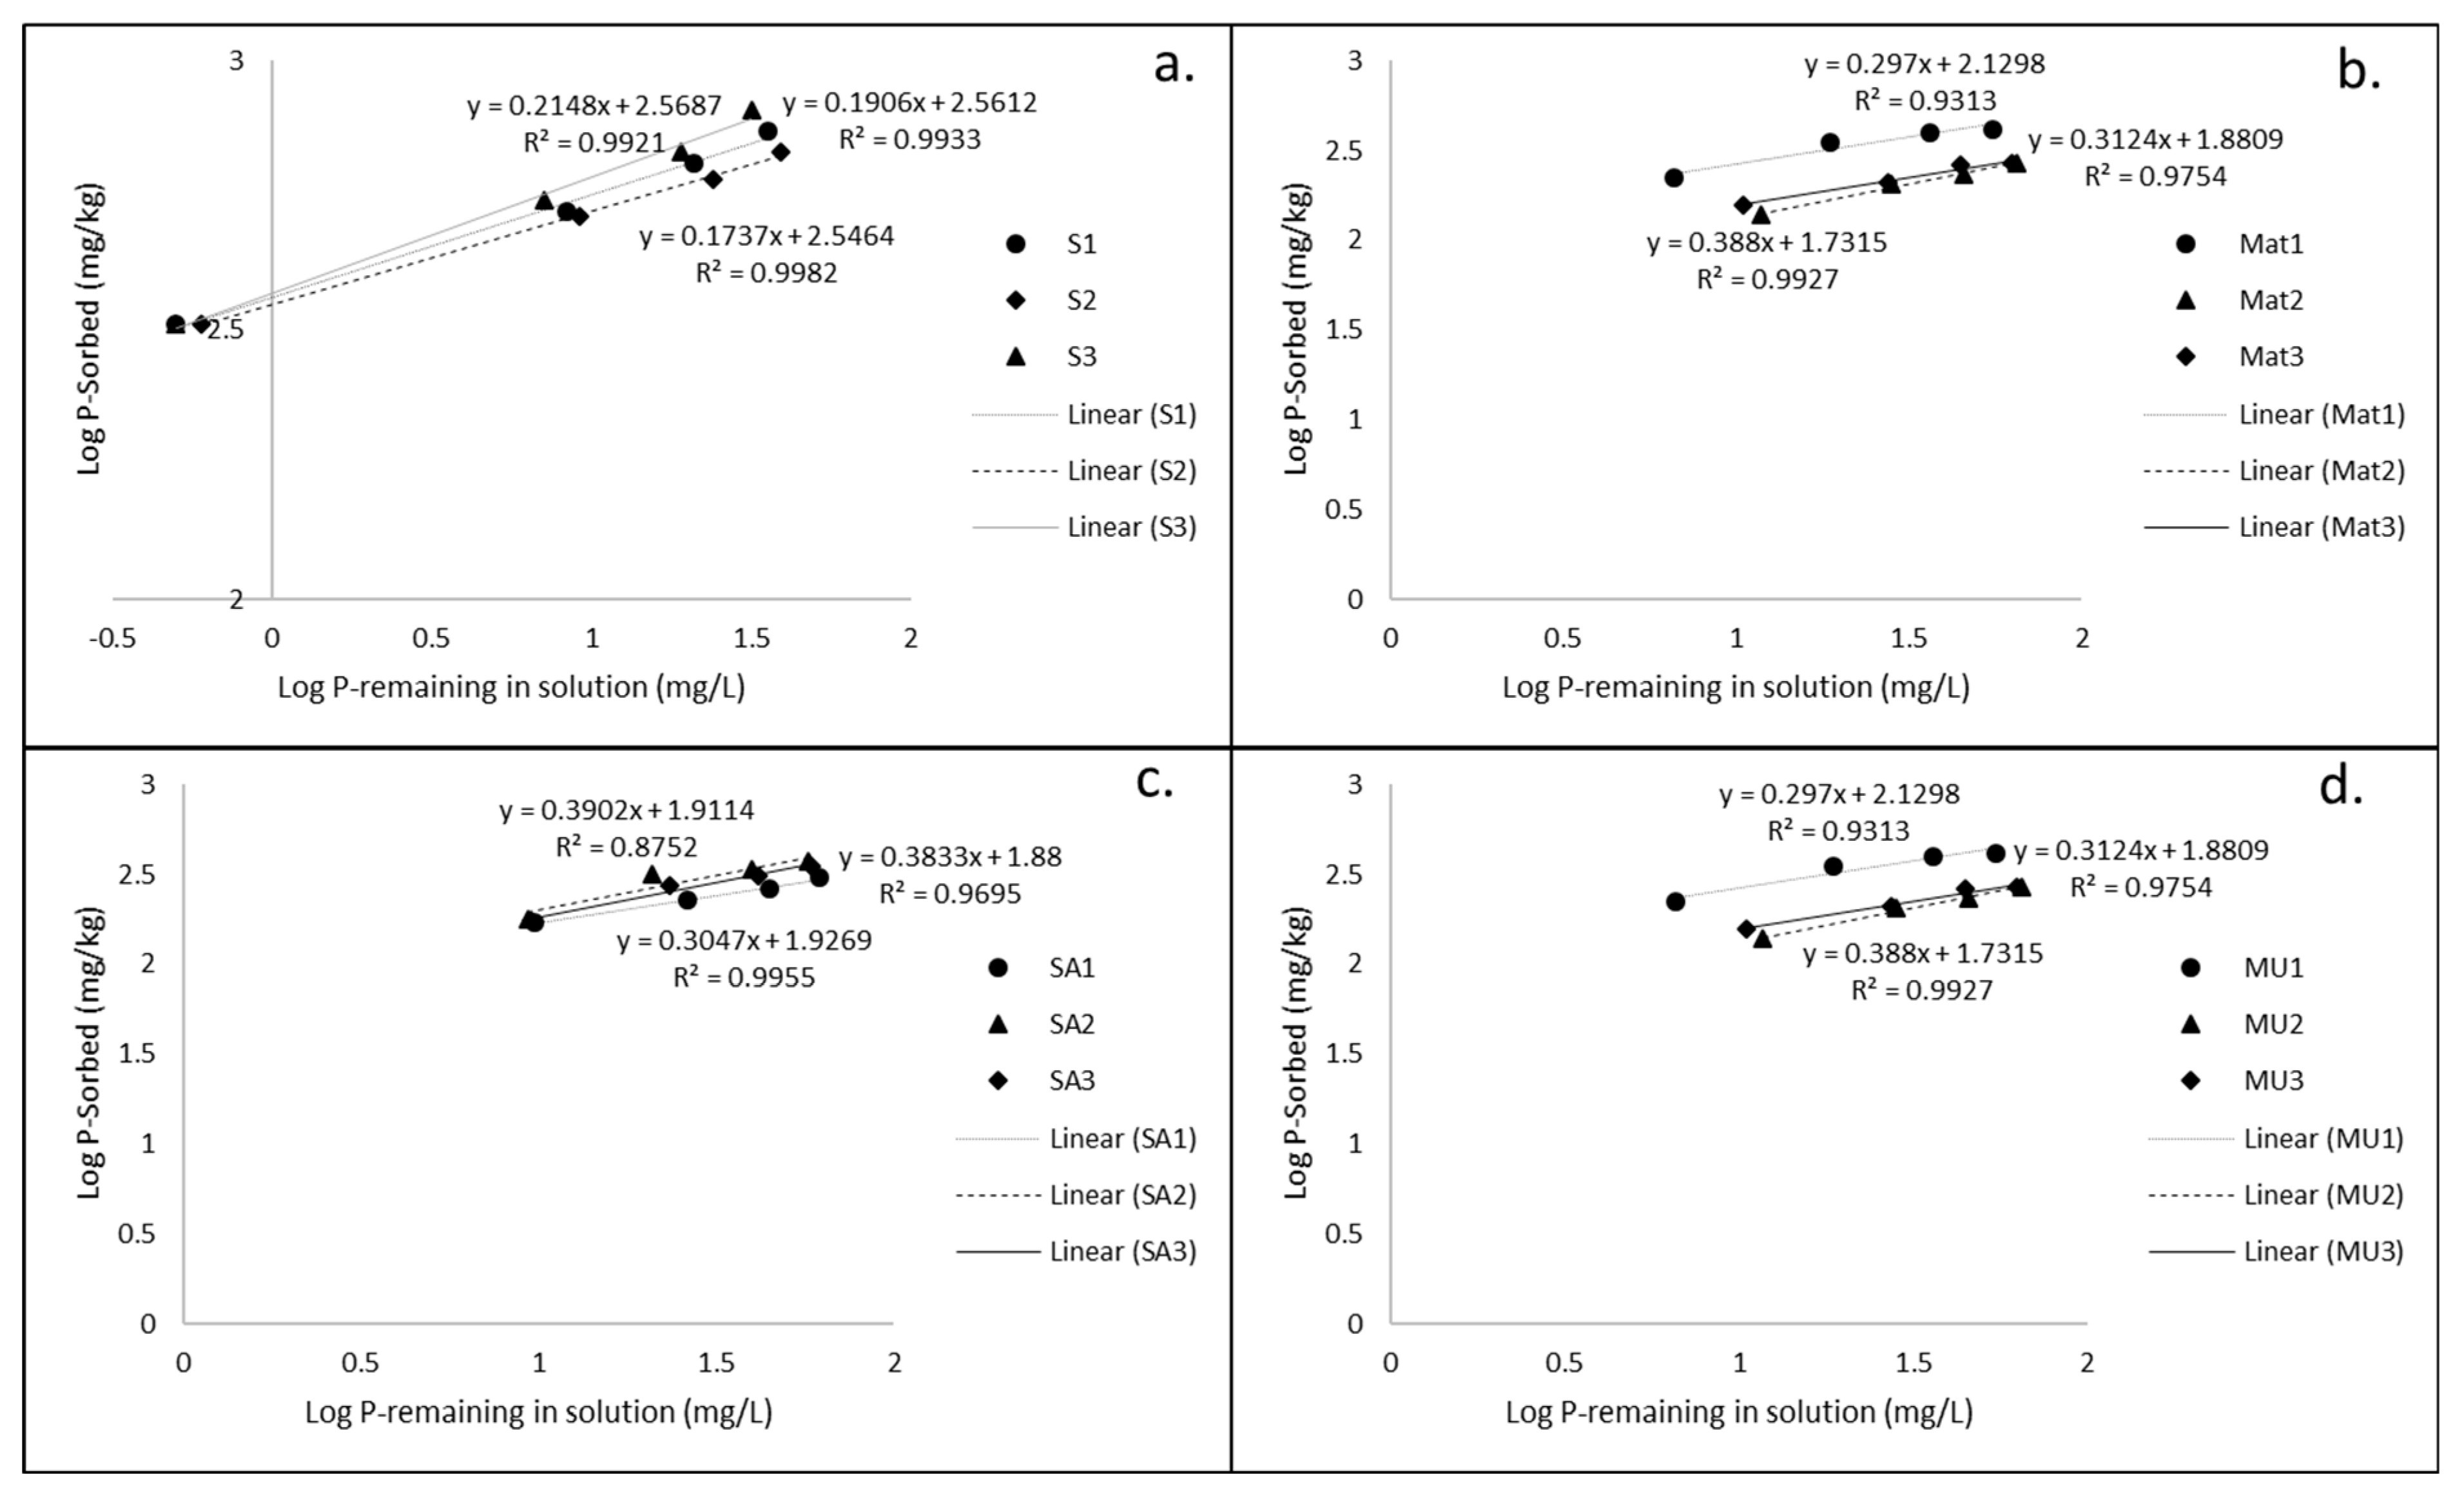
A total of 3 g of each of the bulk soil (<2 mm) and clay fraction (<2 μm) samples were equilibrated in 30 mL 0.01 M CaCl2, containing 0, 20, 40, 60, or 80 mg L−1 P, in 50 mL tubes for 120 h at 25 °C, based on the method that was developed by Fox and Kamprath [19]. Microbial growth was inhibited by adding drops of toluene to the tubes. The suspensions were shaken mechanically two times daily for 30 min using an isothermal shaker at room temperature. At the expiration of the 120 h, the suspensions were centrifuged at 1600 rpm for 15 min and the supernatants were filtered. The P concentrations in the filtrates were determined photometrically in triplicate using a MERCK Spectroquant Pharo 100 Spectrophotometer following the phosphate cell test manual (2016). The quantity of P that was sorbed (x) equals the difference between the initial concentration of P in solution and the final concentration of P at equilibrium (c). The data that were obtained were then fitted to the linearised form of the Langmuir (Equation (1)) and Freundlich (Equation (2)) models.
c/x = (1/aXm) + (c/Xm)
log x = log k + 1/b log c
From the Langmuir model equation, the different P buffer indices—such as the maximum P adsorption (Xm), binding energy (a), and maximum buffering capacity (aXm)—were determined [20,21]. In addition, the P sorption energy (b) and sorption capacity (k) were calculated from the Freundlich model equation [22,23,24]. The correlation coefficient (R2) values gave the goodness fit of the data to the model regression lines from the graphs. The external phosphorus requirement (EPR) was calculated by substituting the critical value (0.2 mg P L−1) into the fitted Langmuir (x = (a Xm c)/(1 + ac)) and Freundlich (x = k c1/b) equations, respectively [25,26]. The relationship between the P sorption parameters in the soils and clay fractions was investigated using the T-test and analysis of variance (ANOVA) methods, which were run on Statistical Package for Social Sciences (SPSS) 25.0 software.

3. Results

The P adsorption analyses of the soil and clay fraction samples that were developed from different parent rocks gave H-type non-linear adsorption isotherms (Figure 2) with high P adsorption at the start and further rises with higher amounts of P that were added [27,28]. The figures show that the greatest amount of P was adsorbed by the soils and clay fractions that were developed from basalt (Figure 2). The average maximum P adsorption values were developed from basalt > granite > arkosic sandstone > gneiss.

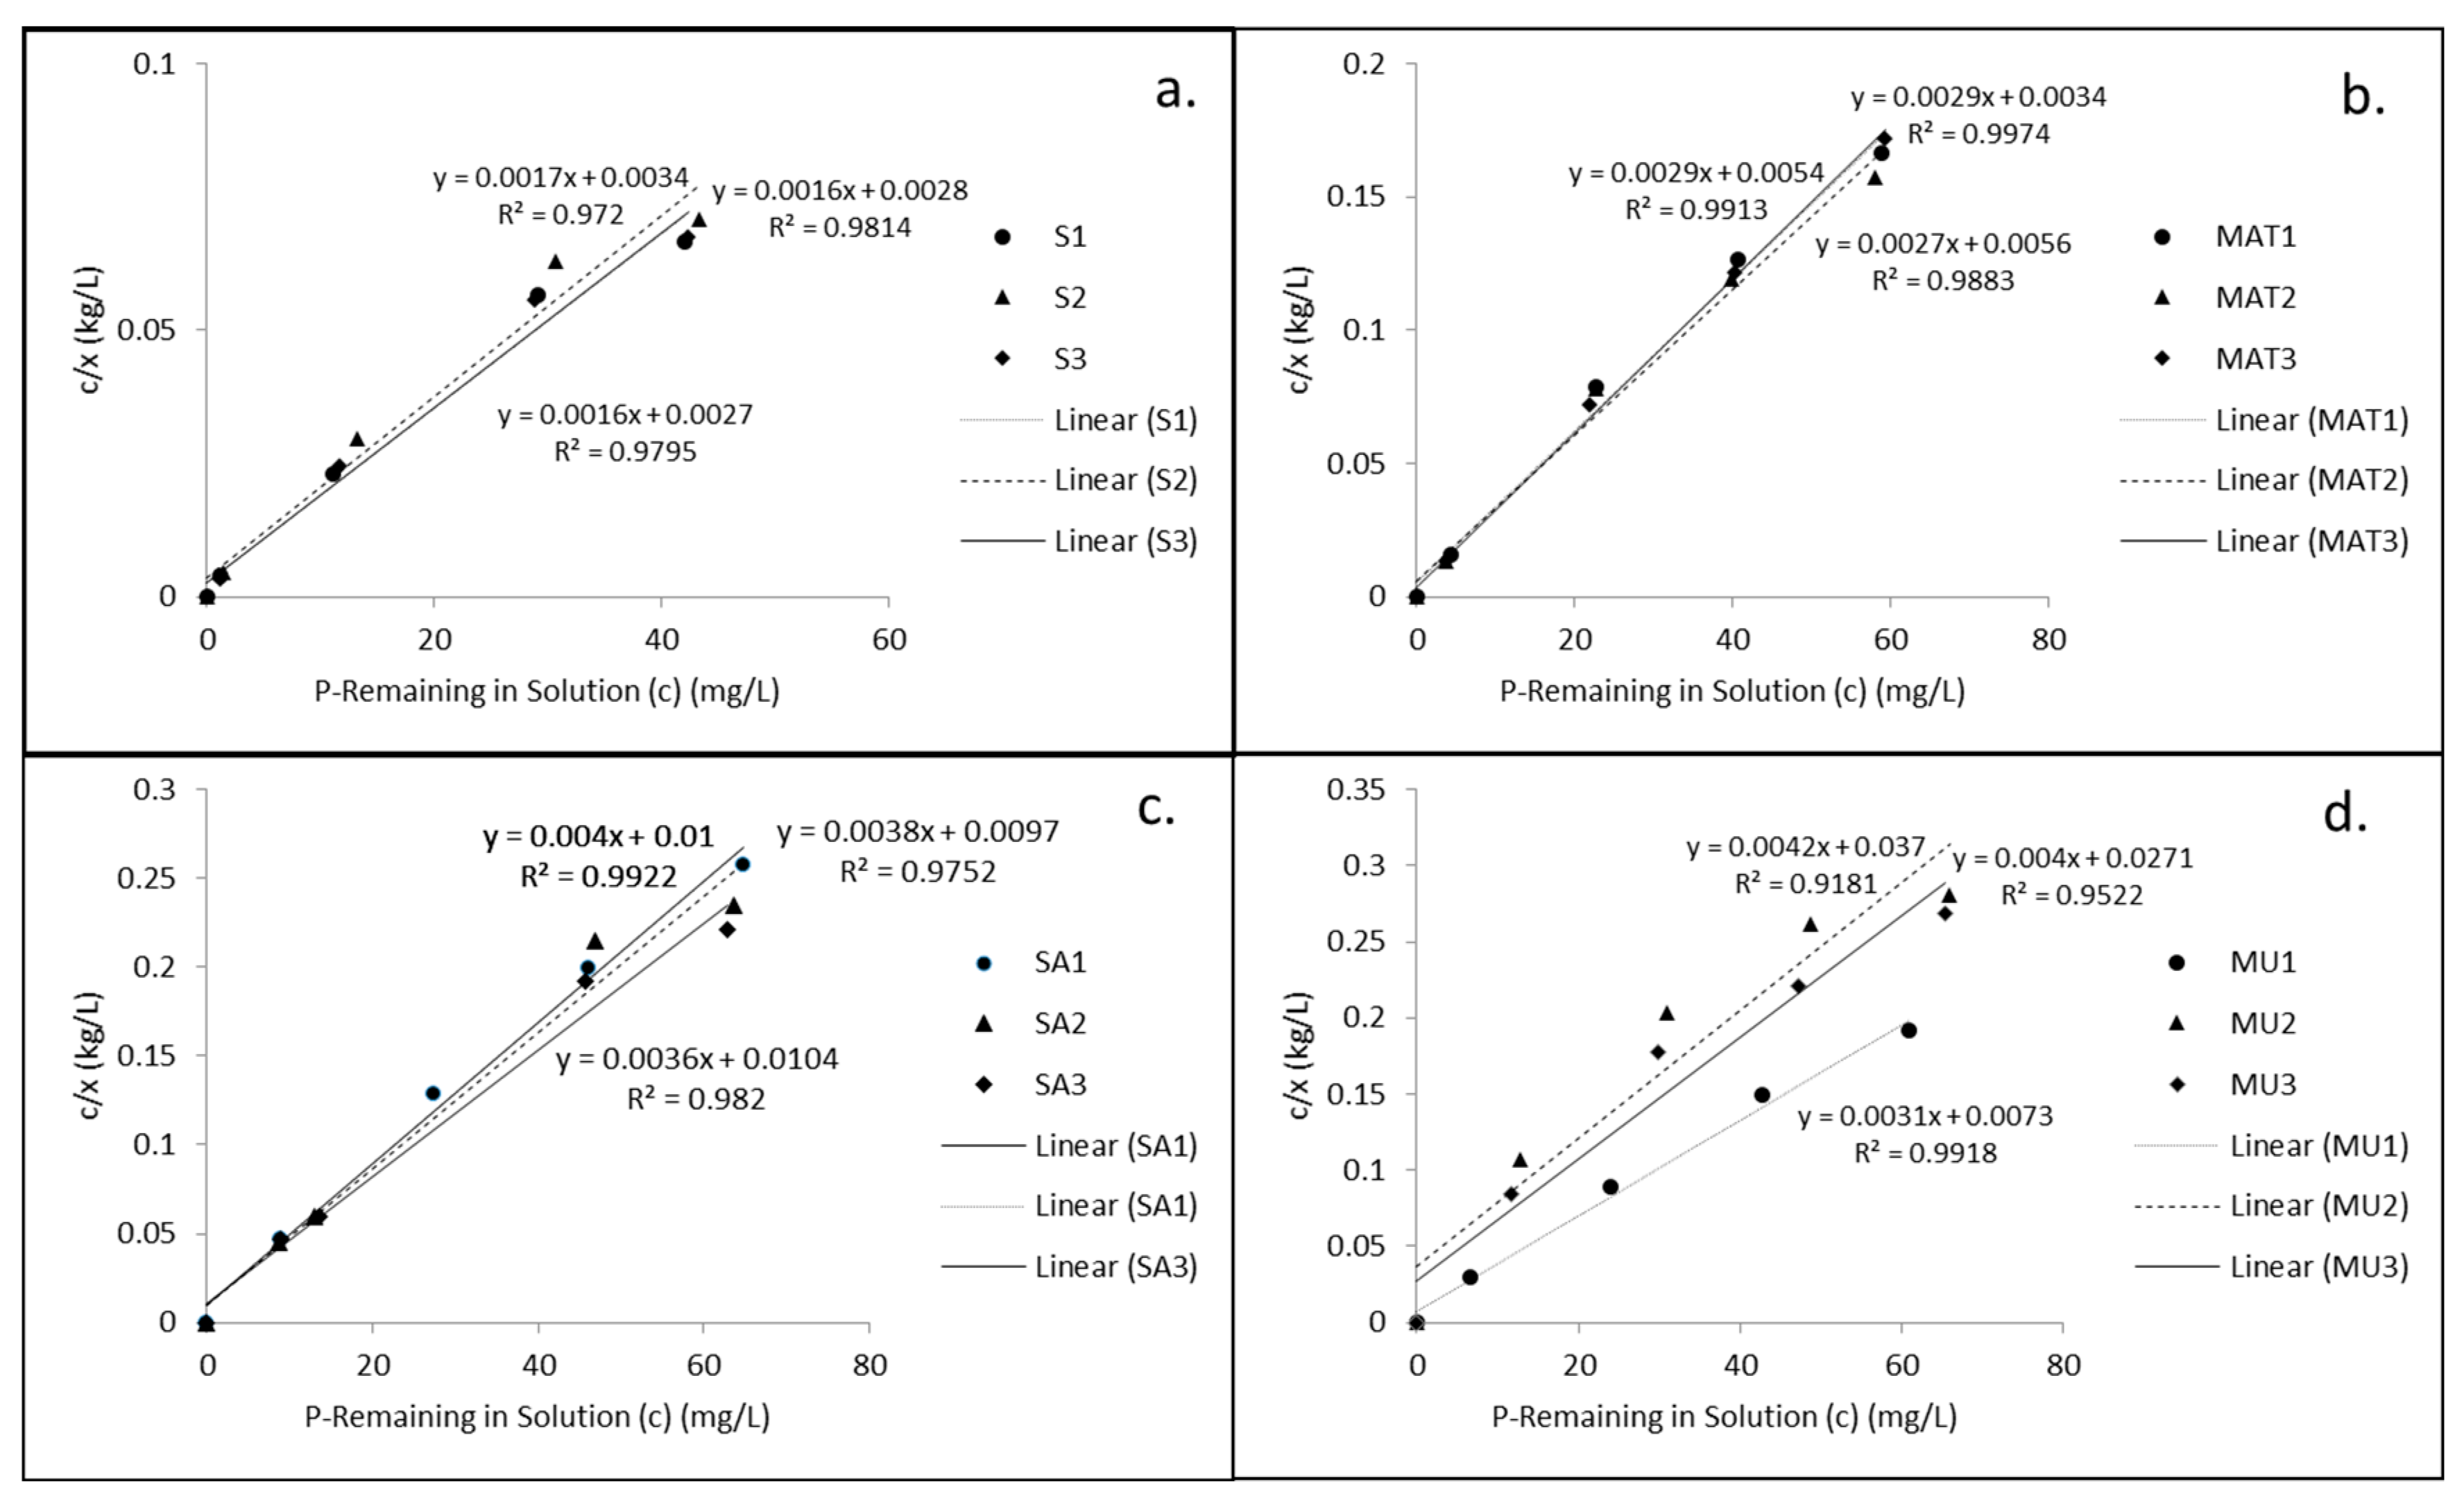
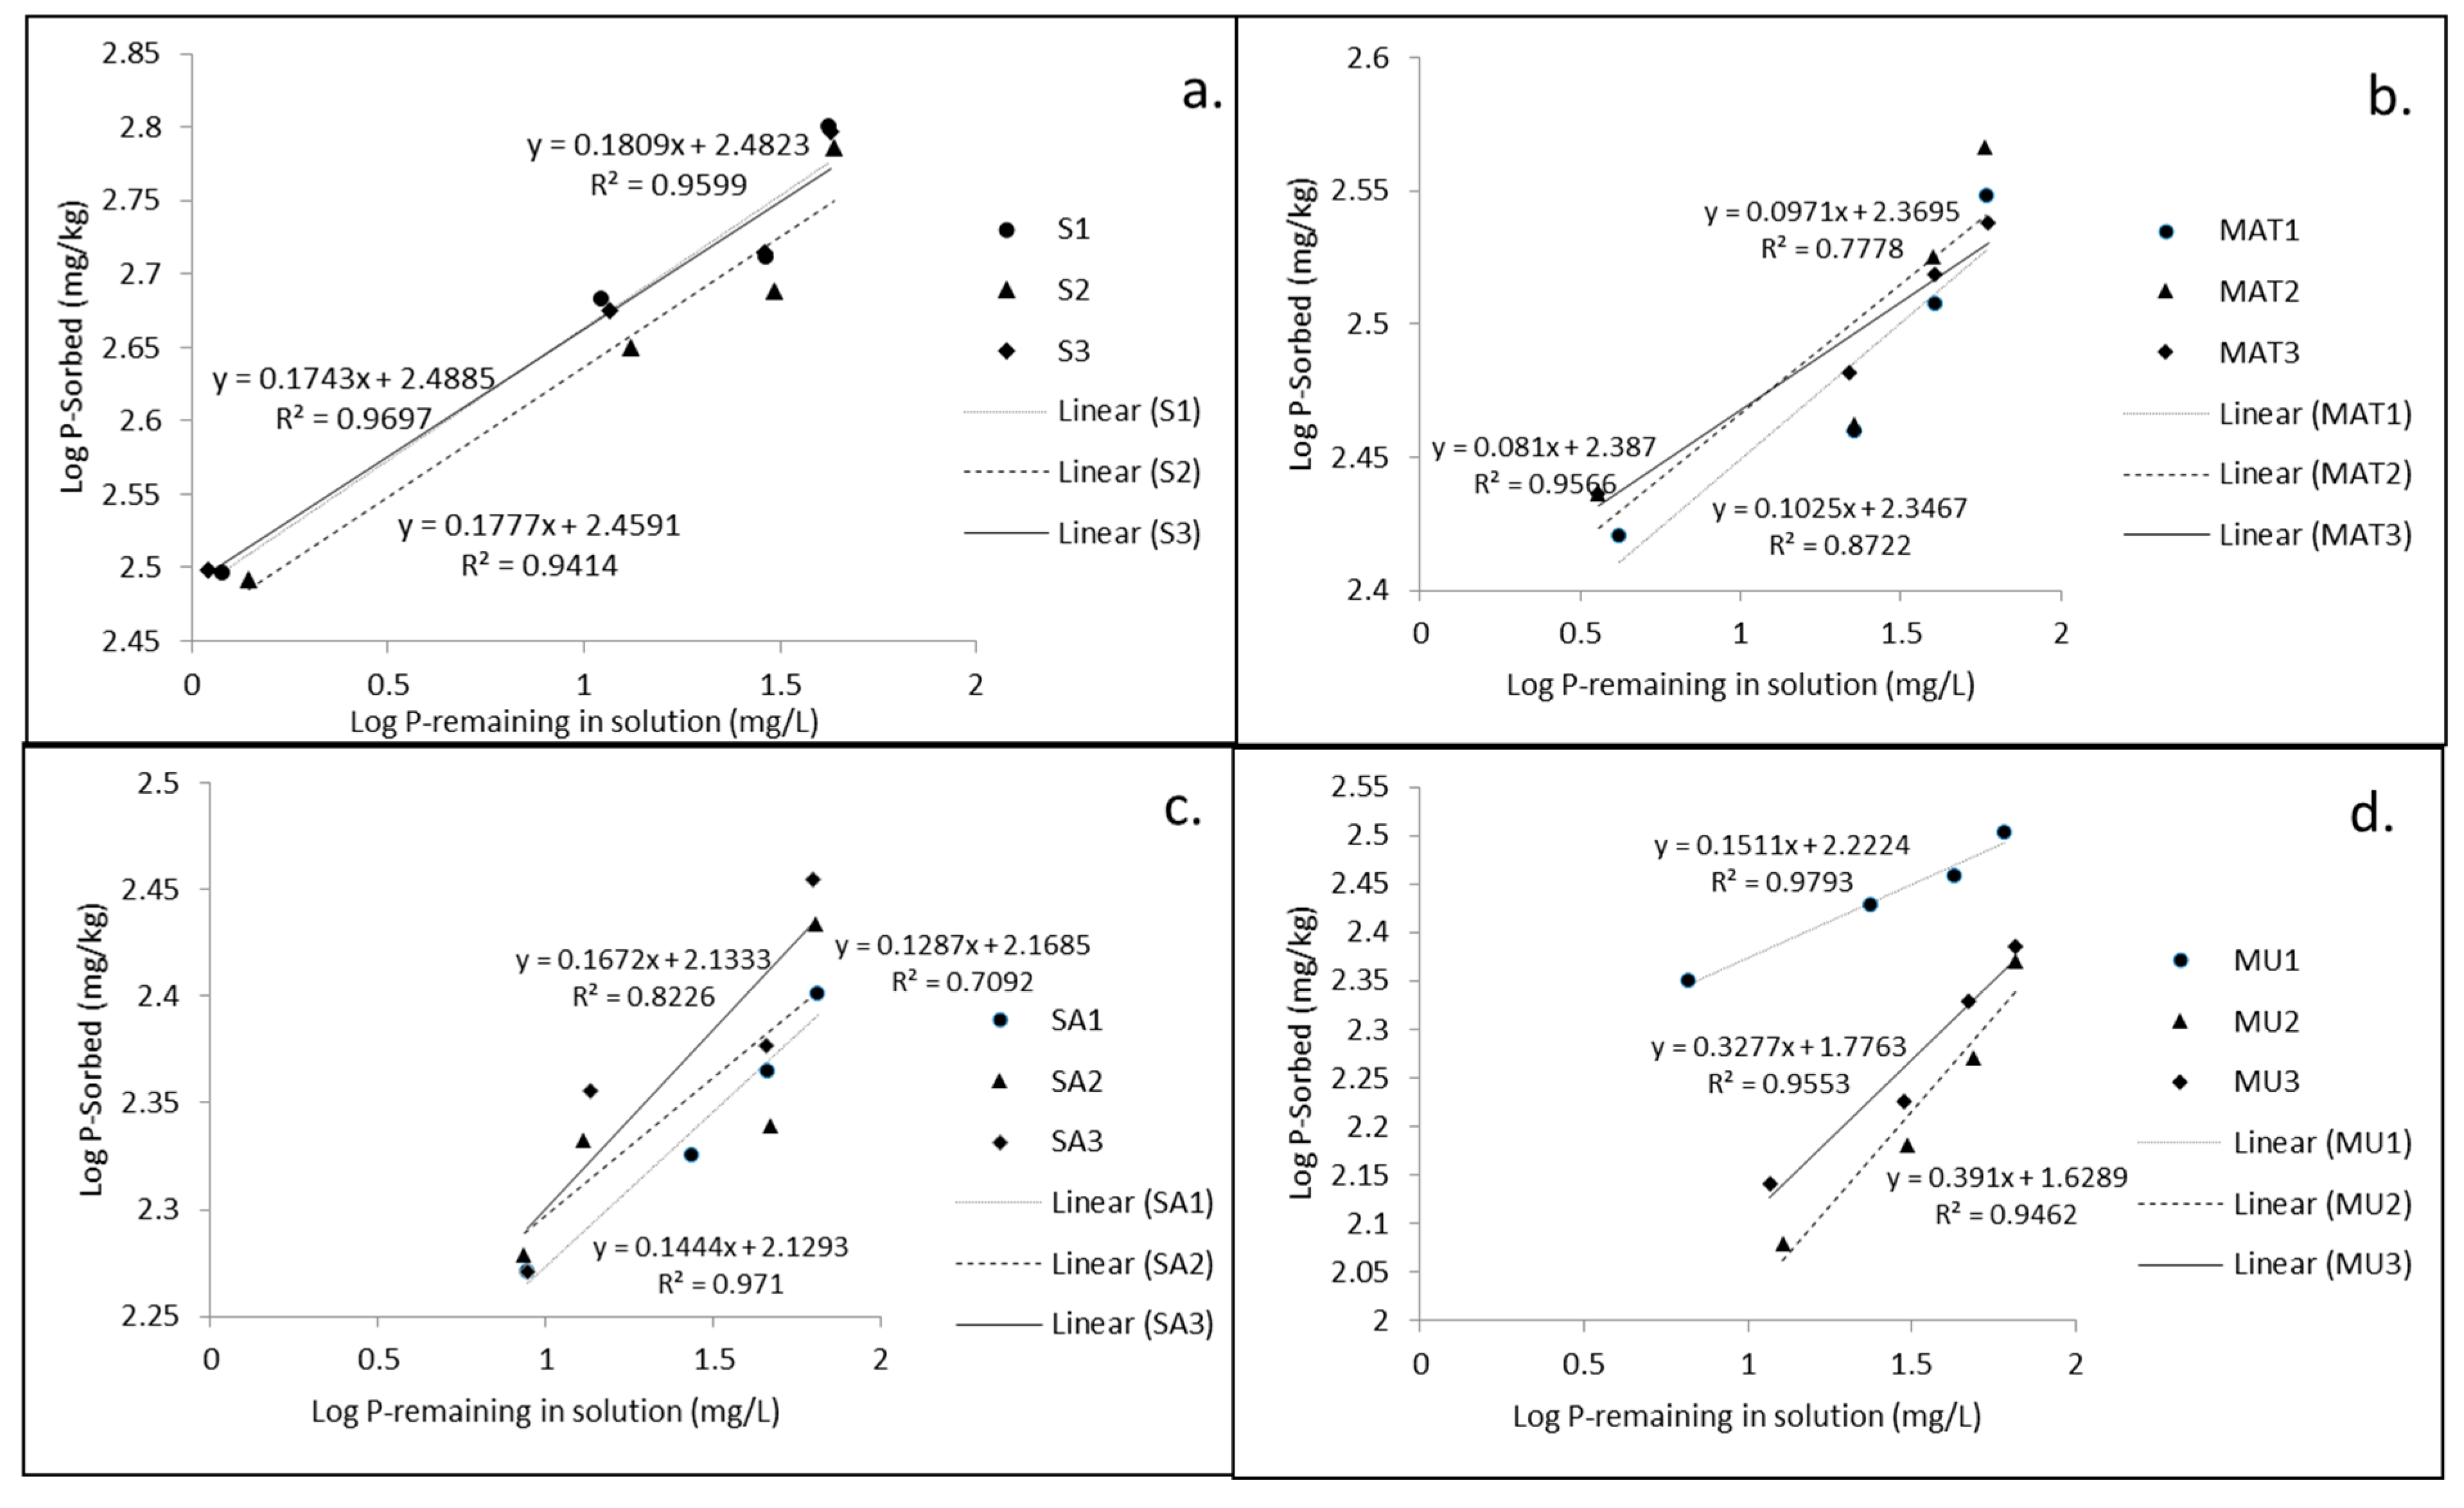
3.1. P Sorption Parameters in Soils

The highly significant average value of R2 ranging from 0.95 to 0.99 indicated that the data fitted well to the Langmuir model for all the soils (Figure 3). The observed linear isotherms for the soils with added P perhaps suggest that the P adsorption sites were not completely occupied [29].
The average P Xm for the soils (Table 2) were within the reported values for several acidic soils that had been developed from different parent materials in Indonesia, with values ranging from 294 to 1430 mg/kg [30,31]. However, Fontes [32] reported an average Xm value of 4482 mg/kg for Brazilian oxisols that were developed from sandstone, claystone, mafic rock, and schist. Clearly, the Brazilian oxisols are extremely highly P-fixing soils relative to the soils from this study, which are moderately P-fixing [31]. Further comparison of the average Xm values for the soils that were developed from basalt, granite–basement complex, and sandstone from Thailand (assuming their data is evenly spaced) [33] and Nigeria [34] (597 and 254 mg/kg, 313 and 231 mg/kg, and 132 and 294 mg/kg, respectively) showed that the soils from this study had higher P sorption capacities.
The bounding energy (a) was highest for the soils that were developed from basalt, followed by the soils that were developed from gneiss, then those that were developed from arkosic sandstone, and least so for the soils that were developed from granite (Table 2). Soil with an average “a” < 0.07 L/mg is likely to experience P loss in subsurface flow [35]; whereas soils with an average “a” value > 0.07 L/mg would have little or no vulnerability to P losses due to subsurface flow. Hence, this finding suggests that soils that are developed from basalt would have a greater ability to sorb and retain P relative than other soils, based on their average “a” value (Table 2) [31,34,36].
The buffering capacities (aXm) of the soils were found to be in the following order of magnitude: arkosic sandstone < granite < gneiss < basalt (Table 2). This order illustrates the minimum amount of P in the solid phase that would be needed to keep a specified amount of P in the solution. The Freundlich adsorption isotherms for the soils are presented in Figure 4. The highly significant average value of R2 (0.91–0.99) that was obtained for the Freundlich equation indicated that the data fitted well to the Freundlich equation for all of the soils that were developed from the different parent rocks.
The values of the sorption energy (b) showed an order of basalt < gneiss < arkosic sandstone < granite; whereas the values of the sorption capacity (k) showed a decreasing trend in the same order (i.e basalt > gneiss > arkosic sandstone > granite) (Table 2). This implies an inverse relationship between k and b [25]. The average k values that were reported for Thai soils that were developed from basalt (505 mg/kg), granite (168 mg/kg), and sandstone (100 mg/kg) [33] were relatively high compared to those that were obtained in this study. In addition, the trend was reversed in Thai soils, with the sequence being basalt > granite > sandstone for k and granite > sandstone > basalt for b [33].

3.2. P Sorption Parameters for Clay Fractions

The average R2 values that were derived from the Langmuir isotherms (Figure 5) ranged from 0.92–0.99, indicating that the P adsorption data of the studied clay fractions were well described by the Langmuir model. The Langmuir P adsorption maxima (Xm) values of the clay fractions were found in the following order: basalt > granite > gneiss > arkosic sandstone (Table 3). Singh and Gilkes [22] studied the maximum P sorption of clay fractions from South Western Australia and they reported it to be between 486 and 654 mg/kg with an average of 556.43 mg/kg. Thus, it appears that clay fractions from South Western Australia have a much higher capacity to sorb P than the clay fractions that were investigated in this study. This could be attributed to the higher kaolinite percentage in the former relative to the latter. This observation is consistent with the findings by Bajwa [37] that clay fractions with predominantly kaolinites are the greatest P-fixers, followed by those having them as a major component.
The bounding energy values (a) of the clay fractions that were developed from basalt and granite were marginally similar, with average values of 0.55 and 0.62; whereas the clay fractions that were developed from gneiss had the smallest average value of 0.23 (Table 3). The aXm of the clay fractions were found to be organised in the following order: basalt > granite > arkosic sandstone > gneiss.
The plots for the Freundlich model (Figure 6) were well correlated with average R2 values between 0.83 and 0.96. The clay fractions that were developed from basalt had the highest P sorption capacity (k) value, followed by granite, arkosic sandstone, and gneiss (Table 3). The P adsorption energy (b) values of the clay fractions that were studied were ordered as such: granite < arkosic sandstone < basalt < gneiss.

4. Discussion

The variation in the mineral compositions of the soils and clay fractions played a major role in their P adsorption dynamics. The soils and clay fractions that were developed from basalt were dominated by secondary minerals like kaolinite, anatase, goethite, hematite, and gibbsite (except for quartz); whereas those which were developed from granite, arkosic sandstone, and gneiss were dominated by primary (weatherable) minerals such as quartz, plagioclase feldspar, microcline, muscovite, and actinolite (except for montmorillonite and chlorite) (Table 4). More P sorption sites have been reported to occur in the secondary minerals with Al and Fe components [9]. The presence of goethite and hematite in the soils and clay fractions that were developed from basalt must also have, in addition to kaolinite, accounted for their higher P adsorption. In addition to the iron oxides that were present in the soils and clay fractions, SEM-EDX analysis of the kaolinites showed the presence of structural iron within their octahedral sites by ionic substitution for Al during pedogenesis [14]. Generally, goethite’s P adsorption is higher than that of hematite due to its higher surface charge and more positive charge [38]. The difference in the percentages of primary and secondary minerals in the soils and clay fractions is a function of their weathering intensities. As such, soils with higher percentages of secondary minerals, like those that are developed from basalt, must have undergone intense chemical weathering as indicated by the presence of gibbsite and their chemical index of alteration (CIA) values, relative to other soils that were developed from granite, arkosic sandstone, and gneiss that have higher levels of primary minerals without gibbsite and lower CIA values. From the foregoing, it is important to state that the parent rocks’ characteristics played a major role in determining the extent of the weathering since the sampling locations have similar prevailing climatic regimes, as was earlier indicated in Table 1. Basalt is a rock that includes ferromagnesian silicate minerals (such as olivine, pyroxene, and biotite) that weather faster to stable secondary minerals relative to the weathering times of granite, arkosic sandstone, and gneiss with non-ferromagnesian minerals (such as quartz and feldspars), which weather slowly at the surficial environment [39].

4.1. External Phosphorus Requirements (EPR)

The calculated EPR for the soils and clay fractions are presented in Table 5. The obtained EPR values for the soils, based on Langmuir model, were within the range of 2–123 mgP/kg that has been earlier reported for some surface soils in SA [41]. However, the Langmuir model range of 31.1–60.2 mgP/kg that was obtained for some Nigerian soils that were developed from basalt, sandstone, and basement complex [34] is higher than the values that were found in this study (except for those of the soils that were developed from basalt) with an average of 91.83 mgP/kg. Following the Juo and Fox [42] classification, the soils were generally low P sorbing with values between 10–100 mgP/kg (except for the soils developed from basalt, based on the Freundlich model). The lower EPR values of the soils that were developed from granite, arkosic sandstone, and gneiss indicate possible early P saturation relative to the soils that were developed from basalt. The pH of the studied soils that were developed from basalt, granite, arkosic sandstone, and gneiss ranged from 5.30–6.60, 5.58–5.90, 6.41–8.17, and 6.45–7.10, respectively [39]. This shows that the soils were slightly acidic to slightly basic. The simple correlation coefficients between the Langmuir EPR and pH values were 0.80, 0.94, −0.94, and 0.24 for soils developed from basalt, granite, arkosic sandstone, and gneiss, respectively. This suggests that the soil’s EPR increases with the increasing pH for soils that are developed from basalt, granite, and gneiss; whereas the soil’s EPR decreases with increasing pH for soils that are developed from arkosic sandstone. The inverse relationship between the two variables in the soils that are developed from arkosic sandstone may be due to electrostatic repulsion as a result of the increased negative surface charge as the pH rises, which can influence the protonation and deprotonation of the functional groups and surface of binding sites in the soils [43]. Positive and negative correlations between soil EPR and soil pH have also been reported by previous studies in Ethiopia, Malawi, Indonesia, and the United States of America [5,26,31,44]. This suggests that the influence of pH on P adsorption in soils cannot be generalised because of the inconsistencies which could be attributed to other soil properties (such as the organic matter content and the exchangeable cation concentrations in the soil solution) that can also affect the P sorption dynamics of soils [31].
Repeated applications of P fertilisers to the soils over time could cause increased concentrations of P in the soil solution as well as the eutrophication of fresh water bodies. A maximum of 1 mgP/L in surface runoff was recommended by the United States Environmental Protection Agency (USEPA) [45] for water quality monitoring and protection. The EPR values were also calculated by substituting this recommended value and the averages of the P sorption parameters for the different soils that were studied into the fitted Langmuir and Freundlich equations. The EPR values for the soils that were developed from basalt, granite, arkosic sandstone, and gneiss were 308.77, 58.91, 55.24, and 64.48 mgP/kg, respectively, for the Langmuir model and 362.13, 77.54, 84.51, and 89.91 mgP/kg, respectively, for the Freundlich model. These values are equivalent to 617.54, 117.82, 110.48, and 128.96 kgP/ha, respectively, for the Langmuir model and 724.26, 155.08, 169.02, and 179.82 kgP/ha, respectively, for the Freundlich model. P fertiliser application in SA ranges between 21 and 160 kgP/ha, depending on the crop group [46]. At this rate, without any increase in P fertiliser application, no imminent risk is posed to water quality in areas with soils that have developed from basalt. However, a blanket P fertiliser application in areas with soils that have developed from granite, arkosic sandstone, and gneiss that is above the EPR values could pose a threat to water quality in those regions. Hence, a site-specific P fertiliser application management strategy is important.

4.2. Variability of Adsorption Parameters

The values of the P adsorption parameters in the soils and clay fractions that were developed from different parent rocks within the study areas showed variability. Generally, the soils (especially those that developed from basalt) showed higher values of P adsorption parameters than the clay fractions. This could suggest the presence of additional constituents in the soils, relative to the clay fractions, that can absorb more P. Such constituents could be oxides of Fe and Al in the soils, which are also important in P sorption [14,38]. The P sorption energy (b) that was found in the soils and clay fractions at a value of less than 1 suggests that the P sorption process was chemical [47]. This is consistent with earlier results of Yousuf et al. [48].
Considering the average R2 values that were derived from the Langmuir and Freundlich models for the soils and clay fractions, the Langmuir model had slightly higher values (except for the soils that were developed from basalt) relative to the Freundlich model (Table 2 and Table 3). Hence, the Langmuir model is more satisfactory in describing the P adsorption in the soils and clay fractions since they conform better to it. This suggest that the adsorption sites in the soils and clay fractions in the present study are more homogenously distributed [49]. This is in line with previous recommendation by Henry and Smith [50] and Wiriyakitnateekul et al. [33] that the Langmuir isotherm is more suitable to modelling P adsorption in South African and Thai soils. Consequently, only the adsorption parameters that were derived from the Langmuir model were considered for the tests of significance (T-test and F-test (one-way ANOVA)).
Table 6 reveals that the significance levels (p-values) were greater than 0.05 for the bounding energy (p = 0.06), sorption capacity (p = 0.17), maximum buffering capacity (p = 0.84), and EPR (p = 0.84). Hence, there are no statistically significant differences between the P sorption parameters for the soils and clay fractions that were developed from different parent rocks in Limpopo Province, SA. This suggest that the sorption parameters that were obtained for the clay fractions could as well be taken as a good predictor of the P sorption and buffering in the soils [51].
Several experimentally proven studies have reported significant positive relationships between P sorption in Australian, Natal, Finnish, Thai, and North American soils and their respective clay fractions [10,22,51,52,53]. These various studies have corroborated that sufficient information regarding P sorption parameters in soils can be deduced from their clay fractions.
This study, for the first time, has reported and discussed the influence of the parent rocks’ characteristics on the P adsorption dynamics in soils that were developed from basalt, granite, arkosic sandstone, and gneiss in South Africa. Other rock types were not considered. As such, details relating to the excessive consumption of fertilisers, type of fertilisers, correlation to soil properties, and climate changes were not covered within the scope of this work. Hence, future studies can incorporate these aspects in order to fill these knowledge gaps.

5. Conclusions

This study examined P adsorption in soils and clay fractions that developed from different parent rocks in Limpopo Province, SA. The studied soils and clay fractions within the study area were characterised by H-type P adsorption isotherm curves. The linearity of the Langmuir and Freundlich isotherms for the soils and clay fractions suggest that the P adsorption sites were not completely occupied. In addition, the Langmuir model is most suited to describing the adsorption of P by the studied soils and clay fractions. The P sorption in the soils and clay fractions were more homogenous in nature and through chemical processes. The soils and clay fractions with the highest and lowest P-fixing capacities were those that were developed from basalt and arkosic sandstone, respectively. The observed P sorption dynamics were a function of their respective compositional characteristics, which, in this case, was determined by their degree of weathering. The standard P requirements for the soils were generally classified as low based on the Langmuir model. Blanket P fertiliser application in the region should be discouraged in order to avoid under-fertilisation or over-fertilisation problems. The statistical tests revealed that the P sorption and buffering parameters for the bulk soils can be deduced from the P sorption of the clay fractions.

Author Contributions

Conceptualization, O.O., G.-I.E. and J.O.; Formal analysis, O.O.; Funding acquisition, G.-I.E. and J.O.; Investigation, O.O.; Writing—original draft, O.O.; Writing—review & editing, G.-I.E. and J.O. All authors have read and agreed to the published version of the manuscript.

Funding

This research was funded by the University of Venda (South Africa), grant number S 999 and National Research Foundation (South Africa), grant number UID 91559.

Institutional Review Board Statement

Not applicable.

Informed Consent Statement

Not applicable.

Data Availability Statement

Not applicable.

Acknowledgments

The authors appreciate the support of Wasiu Ayinde of the University of Venda, South Africa.

Conflicts of Interest

The authors declare no conflict of interest.

References

  1. Gregory, D.I.; Bumb, B.L. Factors Affecting Supply of Fertilizer in Sub-Saharan Africa; Agriculture and Rural Development; World Bank: Washington, DC, USA, 2006; Volume 24. [Google Scholar]
  2. Statistics South Africa. Mid-Year Population Estimates 2014; Statistics South Africa: Pretoria, South Africa, 2014; p. 19. [Google Scholar]
  3. FAO; ITPS. Status of the World’s Soil Resources (SWSR); Food and Agriculture Organization of the United Nations and Intergovernmental Technical Panel on Soils: Rome, Italy, 2015. [Google Scholar]
  4. International Atomic Energy Agency. Assessment of Soil Phosphorus Status and Management of Phosphatic Fertilisers to Optimise Crop Production; International Atomic Energy Agency: Vienna, Austria, 2002; p. 482. [Google Scholar]
  5. Siradz, S.A. Mineralogy and Chemistry of Red Soils of Indonesia: I. General Soil Properties. J. Ilmu Tanah Lingk. 2008, 8, 16–32. [Google Scholar]
  6. Havlin, J.; Beaton, J.D.; Tisdale, S.L.; Nelson, W.L. Soil Fertility and Fertilizers: An Introduction to Nutrient Management, 8th ed.; Pearson Prentice Hall: Hoboken, NJ, USA, 2014. [Google Scholar]
  7. Behl, T.; Kaur, I.; Sehgal, A.; Singh, S.; Sharma, N.; Bhatia, S.; Al-Harrasi, A.; Bungau, S. The dichotomy of nanotechnology as the cutting edge of agriculture: Nano-farming as an asset versus nanotoxicity. Chemosphere 2022, 288, 132533. [Google Scholar] [CrossRef] [PubMed]
  8. Schoumans, O.F.; Chardon, W.J.; Bechmann, M.E.; Gascuel-Odoux, C.; Hofman, G.; Kronvang, B.; Rubæk, G.H.; Ulén, B.; Dorioz, J.-M. Mitigation Options to Reduce Phosphorus Losses from the Agricultural Sector and Improve Surface Water Quality: A Review. Sci. Total Environ. 2014, 468–469, 1255–1266. [Google Scholar] [CrossRef] [PubMed]
  9. Bortoluzzi, E.C.; Pérez, C.A.S.; Ardisson, J.D.; Tiecher, T.; Caner, L. Occurrence of iron and aluminum sesquioxides and their implications for the P sorption in subtropical soils. Appl. Clay Sci. 2015, 104, 196–204. [Google Scholar] [CrossRef]
  10. Gilkes, R.J.; Prakongkep, N. How the Unique Properties of Soil Kaolin Affect the Fertility of Tropical Soils. Appl. Clay Sci. 2016, 131, 100–106. [Google Scholar] [CrossRef]
  11. Rogeri, D.A.; Gianello, C.; Bortolon, L.; Amorim, M.B. Substitution of Clay Content for P-Remaining as an Index of the Phosphorus Buffering Capacity for Soils of Rio Grande Do Sul. Rev. Bras. Ciênc. Solo 2016, 40, e0140535. [Google Scholar] [CrossRef] [Green Version]
  12. Fey, M.V. A Short Guide to the Soils of South Africa, Their Distribution and Correlation with World Reference Base Soil Groups. In Proceedings of the 19th World Congress of Soil Science, Soil Solutions for a Changing World, Brisbane, Australia, 1 August 2010; pp. 32–35. [Google Scholar]
  13. Hall, R.; Wisborg, P.; Shirinda, S.; Zamchiya, P. Farm Workers and Farm Dwellers in Limpopo Province, South Africa. J. Agrar. Chang. 2013, 13, 47–70. [Google Scholar] [CrossRef]
  14. Oyebanjo, O.O.; Ekosse, G.E.; Odiyo, J.O. Geochemistry of Oxidic Soils Developed from Different Parent Rocks in the Limpopo Province, South Africa. Trans. R. Soc. S. Afr. 2020, 75, 165–180. [Google Scholar] [CrossRef]
  15. Conradie, D.C.U. South Africa’s Climatic Zones: Today, Tomorrow. In Proceedings of the Future Trends and Issues Impacting on the Built Environment, Sandton, South Africa, 25 July 2012; p. 9. [Google Scholar]
  16. Van Reeuwijk, L.P. Procedures for Soil Analysis, 6th ed.; Technical Paper; International Soil Reference and Information Centre: Wageningen, The Netherlands, 2002; ISBN 90-6672-052-2. [Google Scholar]
  17. Suslick, K.S.; Price, G.J. Applications of Ultrasound to Materials Chemistry. Annu. Rev. Mater. Sci. 1999, 29, 295–326. [Google Scholar] [CrossRef] [Green Version]
  18. Jakubowska, J. Effect of Irrigation Water Type on Soil Organic Matter (SOM) Fractions and Their Interactions with Hydrophobic Compounds. Ph.D. Thesis, Martin-Luther-Universität Halle-Wittenberg, Halle, Germany, 2007. [Google Scholar]
  19. Fox, R.L.; Kamprath, E.J. Phosphate Sorption Isotherms for Evaluating the Phosphate Requirements of Soils. Soil Sci. Soc. Am. J. 1970, 34, 902–907. [Google Scholar] [CrossRef]
  20. Olsen, S.R.; Watanabe, F.S. A Method to Determine a Phosphorus Adsorption Maximum of Soils as Measured by the Langmuir Isotherm. Soil Sci. Soc. Am. J. 1957, 21, 144–149. [Google Scholar] [CrossRef]
  21. Holford, I.C.R.; Mattingly, G.E.G. Phosphate Adsorption and Availability Plant of Phosphate. Plant Soil 1976, 44, 377–389. [Google Scholar] [CrossRef]
  22. Singh, B.; Gilkes, R.J. Properties of Soil Kaolinites from South-Western Australia. J. Soil Sci. 1992, 43, 645–667. [Google Scholar] [CrossRef]
  23. Amrani, M.; Westfall, D.G.; Moughli, L. Improving the Soil Test Phosphorus Calibration for Calcareous Soils. Commun. Soil Sci. Plant Anal. 1999, 30, 129–144. [Google Scholar] [CrossRef]
  24. Hamdi, W.; Pelster, D.; Seffen, M. Phosphorus Sorption Kinetics in Different Types of Alkaline Soils. Arch. Agron. Soil Sci. 2014, 60, 577–586. [Google Scholar] [CrossRef]
  25. Bolland, M.D.A.; Allen, D.G.; Barrow, N.J. Sorption of Phosphorus by Soils: How It Is Measured in Western Australia. Dep. Agric. Food West. Aust. Perth 2003, 4591, 1–33. [Google Scholar]
  26. Mnthambala, F.; Maida, J.H.; Lowole, M.W.; Kabambe, V.H. Phosphorus Sorption and External Phosphorus Requirements of Ultisols and Oxisols in Malawi. J. Soil Sci. Environ. Manag. 2015, 6, 35–41. [Google Scholar]
  27. Giles, C.H.; McEwan, T.; Nakhwa, S.; Smith, D. Studies in Adsorption. Part XI. A System of Classification of Solution Adsorption Isotherms, and Its Use in Diagnosis of Adsorption Mechanisms and in Measurement of Specific Surface Areas of Solids. J. Chern. Soc. 1960, 111, 3973–3993. [Google Scholar] [CrossRef]
  28. Njoyim, E.; Mvondo-Zé, A.; Mofor, N.; Onana, A. Phosphorus Adsorption Isotherms in Relation to Soil Characteristics of Some Selected Volcanic Affected Soils of Foumbot in the West Region of Cameroon. Int. J. Soil Sci. 2016, 11, 19–28. [Google Scholar]
  29. Poswa, L.Z. Factors Affecting Phosphorus Requirements for the Soils of South African Sugar Industry. Master’s Thesis, University of KwaZulu-Natal, Durban, South Africa, 2016. [Google Scholar]
  30. Hartono, A.; Funakawa, S.; Kosaki, T. Phosphorus Sorption-Desorption Characteristics of Selected Acid Upland Soils in Indonesia. Soil Sci. Plant Nutr. 2005, 51, 787–799. [Google Scholar] [CrossRef]
  31. Wolde, Z.; Haile, W. Phosphorus Sorption Isotherms and External Phosphorus Requirements of some Soils of Southern Ethiopia. Afr. Crop Sci. J. 2015, 23, 89–99. [Google Scholar]
  32. Fontes, M.P.F. Iron Oxide Mineralogy on Some Brazilian Oxisols; North Carolina State University: Raleigh, NC, USA, 1988. [Google Scholar]
  33. Wiriyakitnateekul, W.; Suddhiprakarn, A.; Kheuruenromne, I.; Gilkes, R.J. Extractable Iron and Aluminium Predict the P Sorption Capacity of Thai Soils. Aust. J. Soil Res. 2005, 43, 757–766. [Google Scholar] [CrossRef]
  34. Umoh, F.O.; Osodeke, V.E.; Edem, I.D.; Effiong, G.S. Application of Langmuir and Freundlich Models in Phosphate Sorption Studies in Soil of Contrasting Parent Materials in South-Eastern Nigeria. Open Access Libr. 2014, 1, e989. [Google Scholar] [CrossRef]
  35. Mcdowell, R.; Sharpley, A.; Withers, P. Indicator to Predict the Movement of Phosphorus from Soil to Subsurface Flow. Environ. Sci. Technol. 2002, 36, 1505–1509. [Google Scholar] [CrossRef]
  36. Munhoz, R.D.O.; Berton, R.S.; Camargo, O.A.D. Phosphorus Sorption and Redistribution on Soil Solid Phase in a Brazilian Haplorthox Amended with Biosolids. Appl. Environ. Soil Sci. 2011, 10, 283061. [Google Scholar] [CrossRef] [Green Version]
  37. Bajwa, M.I. Soil Clay Mineralogies in Relation to Fertility Management: Effect of Soil Clay Mineral Compositions on Phosphorus Fixation under Conditions of Wetland Rice Culture. Commun. Soil Sci. Plant Anal. 1981, 12, 475–482. [Google Scholar] [CrossRef]
  38. Kovács, J.; Farics, É.; Szabó, P.; Sajó, I. Fe-Al Phosphate Microcrystals in Pedogenic Goethite Pisoliths. Minerals 2020, 10, 357. [Google Scholar] [CrossRef]
  39. Oyebanjo, O.O.; Ekosse, G.E.; Odiyo, J.O. Mineralogy and geochemistry of clay fractions in soils developed from different parent rocks in Limpopo Province, South Africa. Heliyon 2021, 7, e07664. [Google Scholar] [CrossRef]
  40. Oyebanjo, O.O. Mineralogy and Geochemistry of Kaolins in Oxidic Soils Developed from Different Parent Rocks in Limpopo Province, South Africa. Ph.D. Thesis, University of Venda, Thohoyandou, South Africa, 2020. [Google Scholar]
  41. Gichangi, E.M.; Mnkeni, P.N.S.; Muchaonyerwa, P. Phosphate Sorption Characteristics and External P Requirements of Selected South African Soils. J. Agric. Rural Dev. Trop. Subtrop. 2008, 109, 139–149. [Google Scholar]
  42. Juo, A.S.R.; Fox, R.L. Phosphate Sorption Characteristics of Some Bench-Mark Soils of West Africa. Soil Sci. 1977, 124, 370–376. [Google Scholar] [CrossRef]
  43. Muindi, E.M.; Mrema, J.P.; Semu, E.; Mtakwa, P.W.; Gachene, C.K.; Njogu, M.K. Phosphorus Adsorption and Its Relation with Soil Properties in Acid Soils of Western Kenya. Int. J. Plant Soil Sci. 2014, 4, 203–211. [Google Scholar] [CrossRef] [Green Version]
  44. Zhang, H.; Schroder, J.L.; Fuhrman, J.K.; Basta, N.T.; Storm, D.E.; Payton, M.E. Path and multiple regression analyses of phosphorus sorption capacity. Soil Sci. Soc. Am. J. 2005, 69, 96–106. [Google Scholar] [CrossRef]
  45. United States Environmental Protection Agency. Environmental Indicators of Water Quality in the United States; USEPA, Office of Water (4503F): Washington, DC, USA, 1986. [Google Scholar]
  46. Food and Agricultural Organization. Fertilizer Use by Crop in South Africa; FAO: Rome, Italy, 2005. [Google Scholar]
  47. Sieczka, A.; Koda, E. Kinetic and Equilibrium Studies of Sorption of Ammonium in the Soil-Water Environment in Agricultural Areas of Central Poland. Appl. Sci. 2016, 6, 269. [Google Scholar] [CrossRef] [Green Version]
  48. Yousuf, T.S.; Hossain, M.E.; Afsar, M.Z.; Osman, K.T. Phosphate sorption indices as affected by the calcareousness of soils. Dhaka Univ. J. Biol. Sci. 2019, 28, 93–110. [Google Scholar] [CrossRef]
  49. Sparks, D.L. Environmental Soil Chemistry, 2nd ed.; Academic Press: Amsterdam, The Netherlands, 2003. [Google Scholar]
  50. Henry, P.C.; Smith, M.F. Phosphorous sorption study of selected South African soils. S. Afr. J. Plant Soil 2002, 19, 61–69. [Google Scholar] [CrossRef] [Green Version]
  51. Räty, M.; Peltovuori, T. Sorption of Phosphate Phosphorus in Ultrasound-Separated Particle-Size Fractions from Arable Soils. In Proceedings of the Phosphorus Management in Nordic-Baltic Agriculture: Reconciling Productivity and Environmental Protection: NJF Seminar 401, Nordic Association of Agricultural Scientists, Uppsala, Sweden, 22 September 2008; pp. 147–151. [Google Scholar]
  52. Bainbridge, S.H.; Miles, N.; Praan, R.; Johnston, M.A. Phosphorus Sorption in Natal Soils. S. Afr. J. Plant Soil 1995, 12, 59–64. [Google Scholar] [CrossRef]
  53. Brenner, J.; Porter, W.; Phillips, J.R.; Childs, J.; Yang, X.; Mayes, M.A. Phosphorus Sorption on Tropical Soils with Relevance to Earth System Model Needs. Soil Res. 2019, 57, 17–27. [Google Scholar] [CrossRef] [Green Version]
Figure 2. P adsorption isotherms for average soils (a) and clay fractions (b) developed from different parent rocks in Limpopo Province, South Africa.
Sustainability 14 08528 g002
Figure 3. Langmuir adsorption isotherms for soils developed from basalt (a), granite (b), arkosic sandstone (c), and gneiss (d).
Sustainability 14 08528 g003
Figure 4. Freundlich adsorption isotherms for soils developed from basalt (a), granite (b), arkosic sandstone (c), and gneiss (d).
Sustainability 14 08528 g004
Figure 5. Langmuir adsorption isotherms for clay fractions developed from basalt (a), granite (b), arkosic sandstone (c), and gneiss (d).
Sustainability 14 08528 g005
Figure 6. Freundlich adsorption isotherms for clay fractions developed from basalt (a), granite (b), arkosic sandstone (c), and gneiss (d).
Sustainability 14 08528 g006
Table 2. P sorption parameters for soils developed from different parent rocks in Limpopo Province, SA.
Parent Rock Langmuir IsothermFreundlich Isotherm
a
(L/mg)
Xm (mg/kg)aXm
(L/kg)
R2b (L/kg)k
(mg/kg)
R2
Basalt (n = 3)Minimum0.63666.67253.080.980.17351.880.99
Maximum0.79833.33526.670.990.21370.421.00
Average0.70756.41524.910.990.19362.130.99
Granite (n = 3)Minimum0.14357.1467.110.940.3573.190.86
Maximum0.19500.0070.000.970.4583.210.96
Average0.16437.2368.330.950.4277.540.91
Arkosic sandstone (n = 3)Minimum0.17303.0360.610.970.3075.860.88
Maximum0.20400.0072.000.970.3984.511.00
Average0.18357.8065.190.970.3584.510.95
Gneiss (n = 3)Minimum0.14285.7139.990.960.2958.890.93
Maximum0.32434.78139.130.990.39134.830.99
Average0.22335.4077.800.980.3389.910.97
Table 3. P sorption parameters for clay fractions developed from different parent rocks in Limpopo Province, SA.
Parent Rock Langmuir IsothermFreundlich Isotherm
a (L/mg)Xm (mg/kg)aXm (L/kg)R2b (L/kg)k (mg/kg)R2
Basalt (n = 3)Minimum0.50588.24294.120.970.17287.810.94
Maximum0.59625.00368.750.980.18303.600.97
Average0.55612.75339.710.980.18299.790.96
Granite (n = 3)Minimum0.48344.83177.780.990.08222.180.78
Maximum0.85370.37293.110.990.10243.780.96
Average0.62353.34219.030.990.09233.370.87
Arkosic sandstone (n = 3)Minimum0.36250.00100.000.980.13134.680.71
Maximum0.40277.78103.090.990.17147.400.97
Average0.38263.65101.030.980.15139.340.83
Gneiss (n = 3)Minimum0.11238.0926.190.920.1542.550.95
Maximum0.42322.58135.480.990.39166.880.98
Average0.23270.2266.390.95 0.2589.720.96
Table 4. Average percentages of minerals present (wt %) and CIA for soils and clay fractions developed from different parent rocks in Limpopo Province, South Africa (After Oyebanjo [39] and Oyebanjo et al. [40]).
Parent RockSample ID KaoQtzAnaGoeHemPlagMicMus/IllGibChlActMontCIA
Basalt Soil4524599---8---99
CF7412456-------
Granite Soil825---322113--1-65
CF2820---241014-32-
Ark. Sst Soil379----99----63
CF2433----1623-6-
GneissSoil925---506--1-961
CF368---2235---26
CF—clay fraction; Kao—kaolinite; Qtz—quartz; Ana—anatase; Goe—goethite; Hem—hematite; Plag—plagioclase; Mic—microcline; Mus—muscovite; Ill—illite; Gib—gibbsite; Chl—chlorite; Act—actinolite; Mont—montmorillonite; and CIA—chemical index of alteration.
Table 5. External phosphorus requirements (EPR) values for soils and clay fractions developed from different parent rocks in Limpopo Province, South Africa.
Parent RockEPR (mgP/kg)
Langmuir IsothermFreundlich Isotherm
SoilClay FractionsSoilClay Fractions
Basalt (n = 3)Minimum90.8053.47262.15216.91
Maximum92.9165.85267.90232.63
Average91.8361.17256.37225.25
Granite (n = 3)Minimum13.0532.6235.51188.39
Maximum13.5950.1047.11213.98
Average12.7638.7639.57200.89
Arkosic sandstone (n = 3)Minimum11.6518.5240.94103.86
Maximum13.8919.1351.75119.82
Average12.5718.7745.40110.14
Gneiss (n = 3)Minimum7.785.1331.5422.68
Maximum26.2524.9983.59130.85
Average15.1612.4769.5362.92
Table 6. T-test and ANOVA for significance of difference in P sorption parameters between soils and clay fractions developed from different parent rocks in Limpopo Province, South Africa (at 5% significant level).
ParameterMean (n = 13)SDt-Valuep-ValueF-Valuep-Value
Bounding energySoil0.310.23−1.940.063.760.06
Clay Fraction0.480.23
Sorption CapacitySoil461.95182.761.430.172.040.17
Clay Fraction369.46144.85
Maximum buffering capacitySoil176161.19−0.210.840.040.84
Clay Fraction189.49117.18
EPRSoil31.7428.51−0.20.840.040.84
Clay Fraction33.9620.59
SD—standard deviation.
Publisher’s Note: MDPI stays neutral with regard to jurisdictional claims in published maps and institutional affiliations.

