
Mismatch and Coupling: A Study on the Synergistic Development of Tourism-Economy-Ecology Systems in the Pearl River Delta


Abstract
:1. Introduction
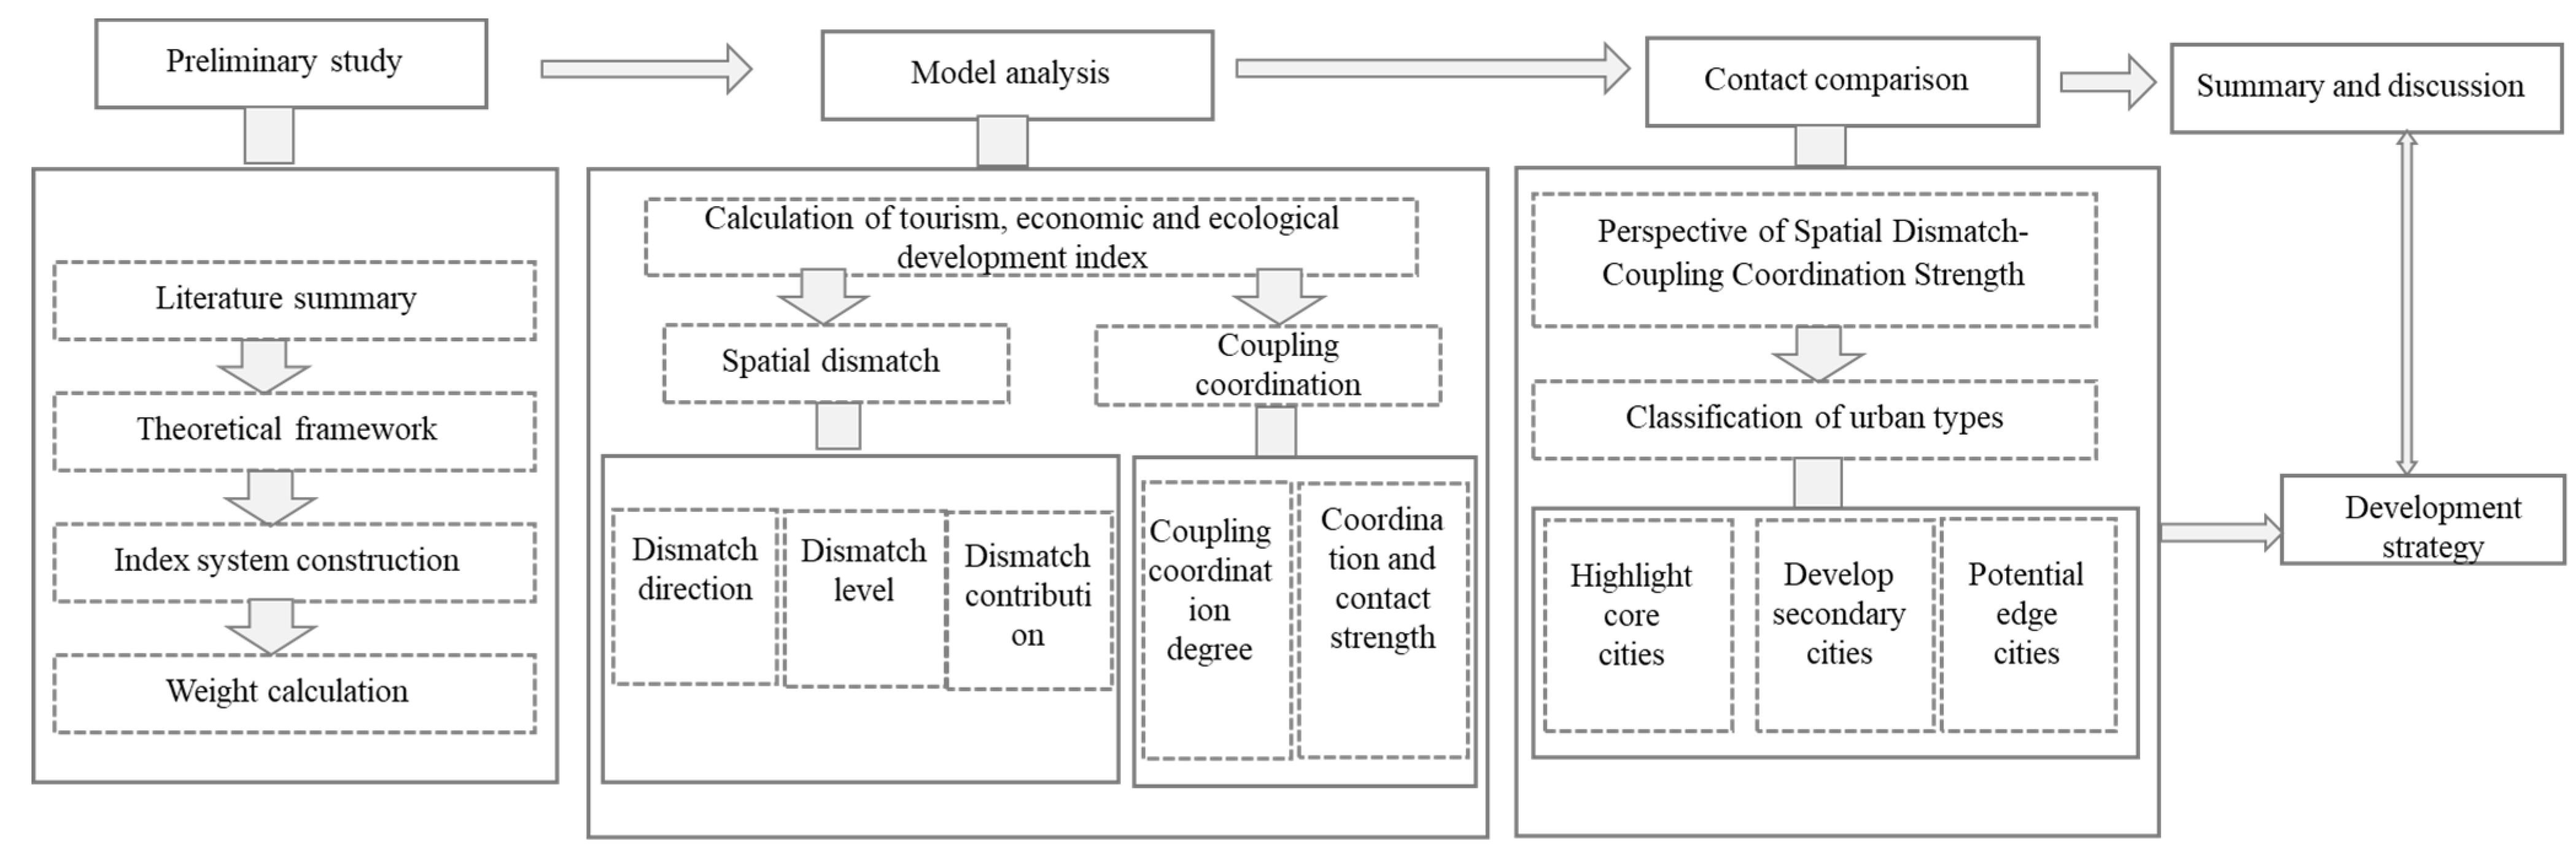
2. Methods
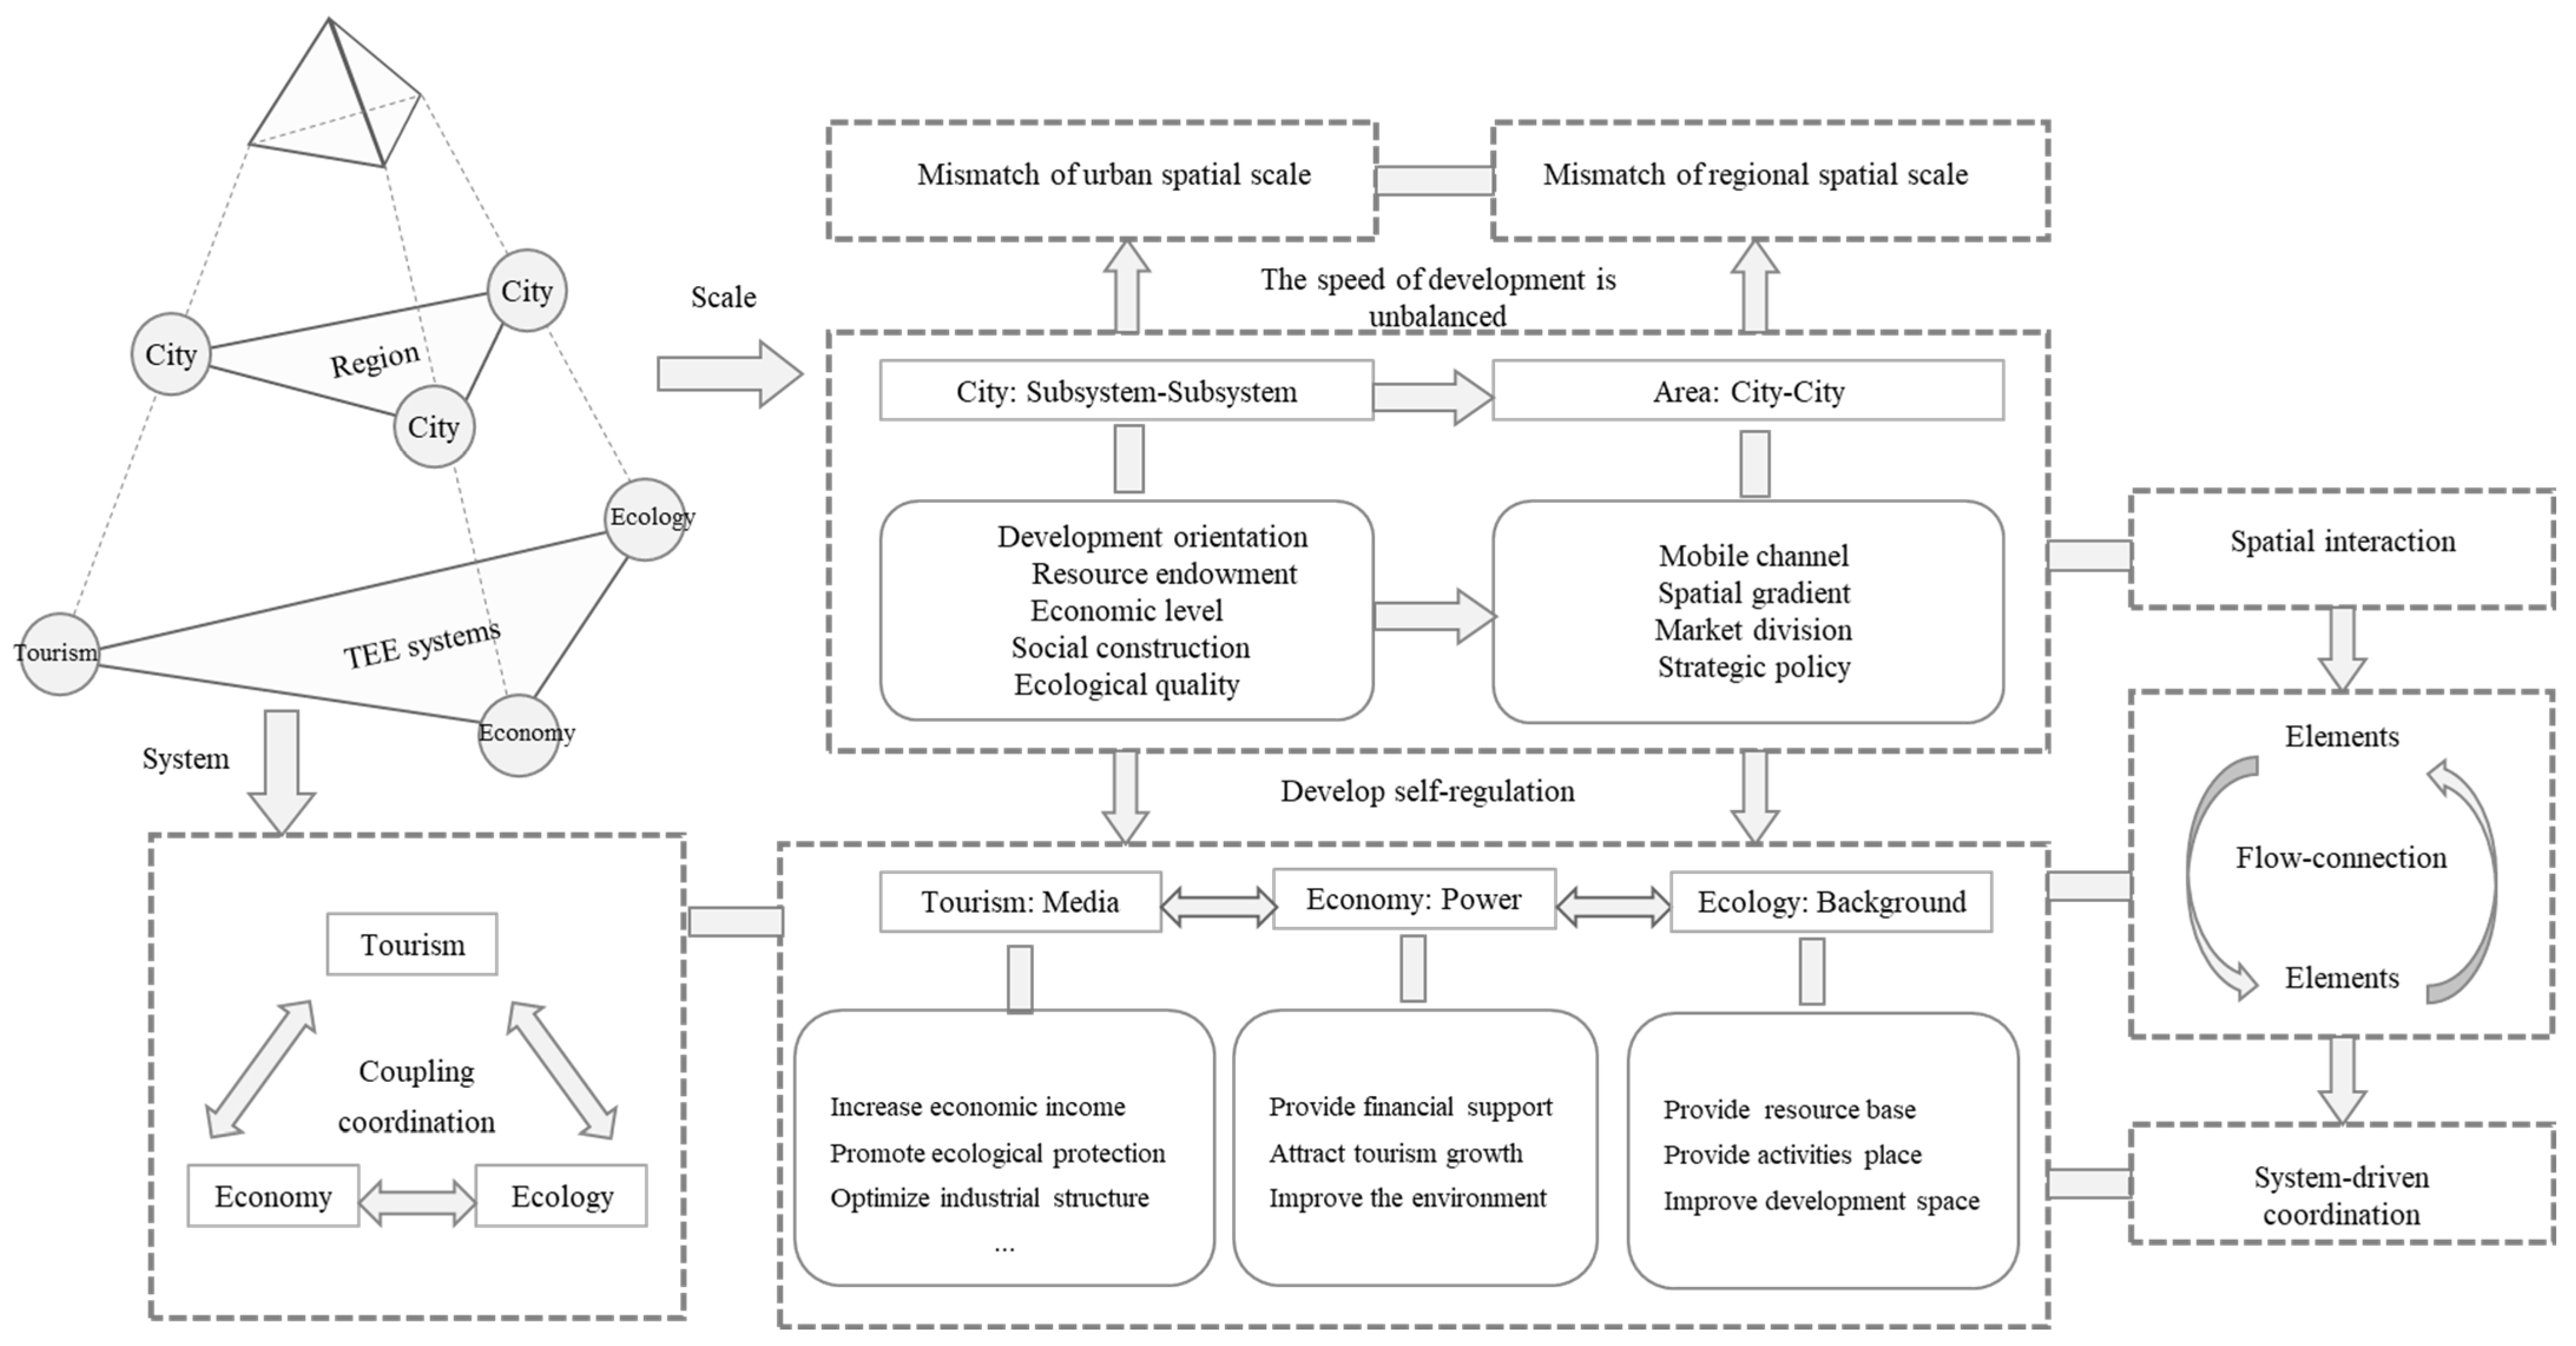
2.1. Theoretical Framework
2.2. Construction of Indicator System
2.3. Weights Determination
- (1)
- Building the original matrix
- (2)
- Standardizing the data
- (3)
- Calculate the ratio of the ith city/year to the jth index
- (4)
- Calculate the entropy value of the jth index
- (5)
- Calculate the coefficient of variation of the jth index
- (6)
- Calculate the weight of the jth index
2.4. Spatial Mismatch Theory
2.5. Coupling Coordination Degree Model
2.6. Gravity Model
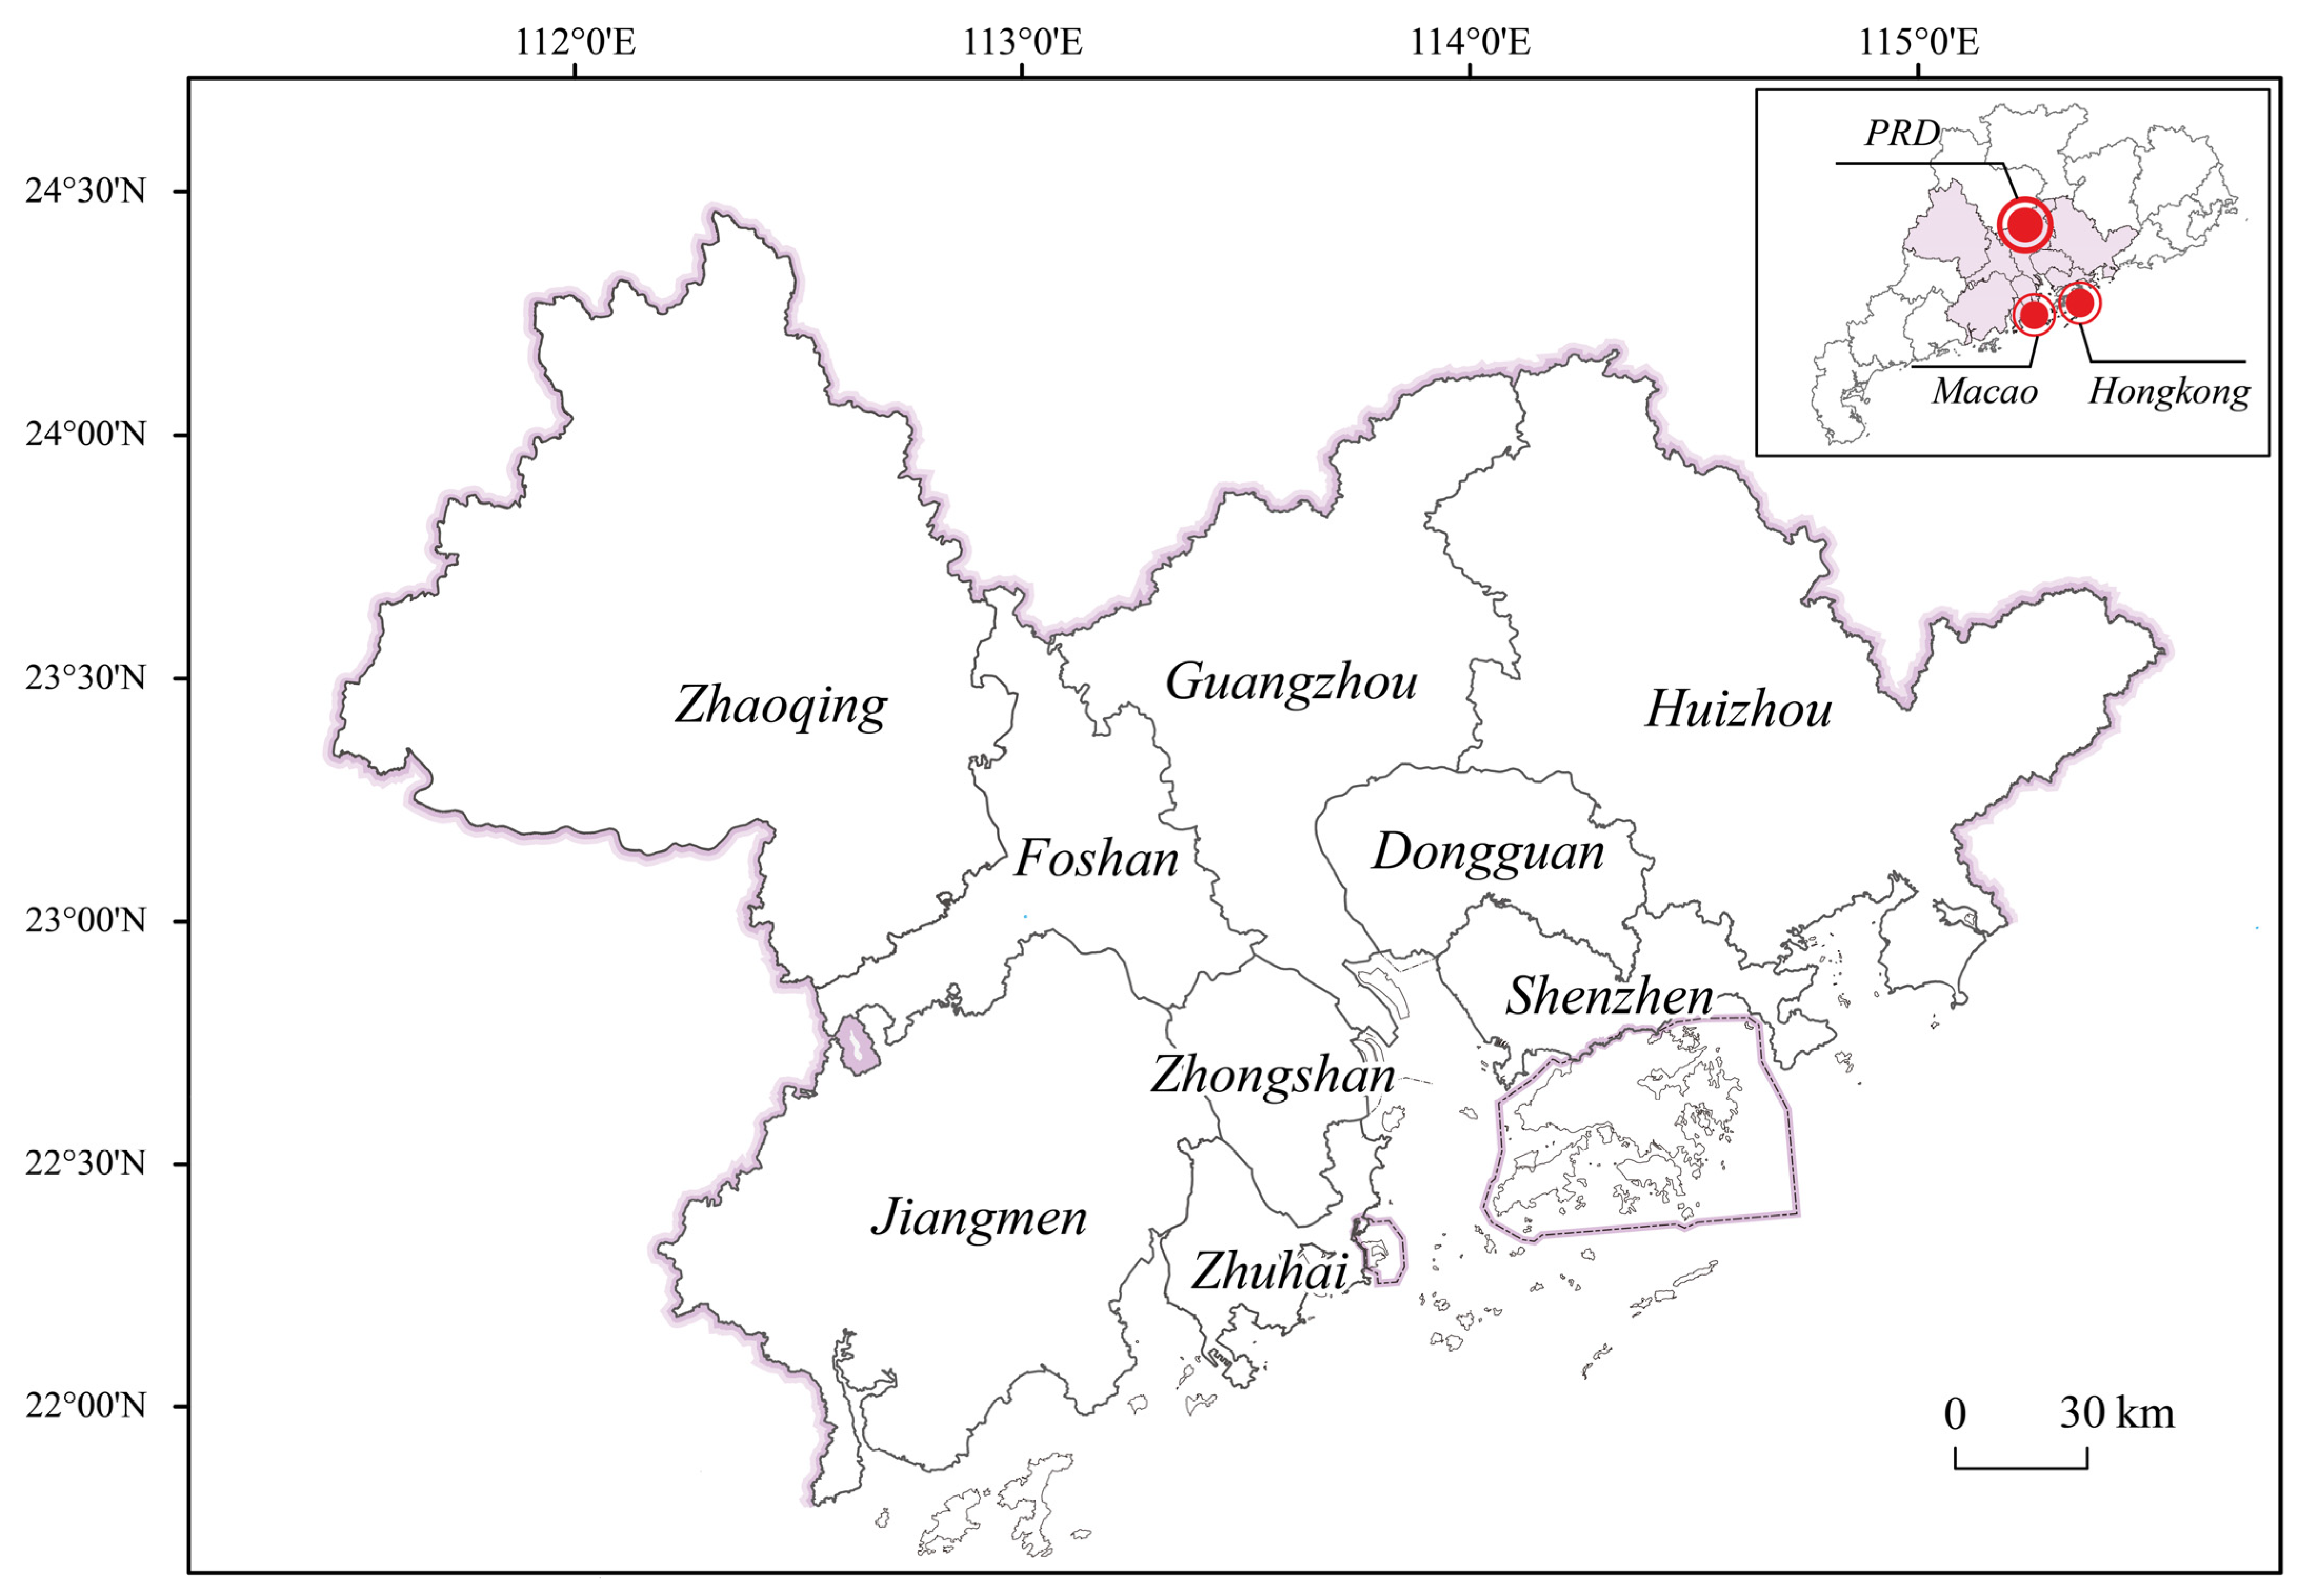
3. Study Area and Data Sources
3.1. Study Area
3.2. Data Sources
4. Results
4.1. Level of Tourism-Economy-Ecology Development in the PRD
- (1)
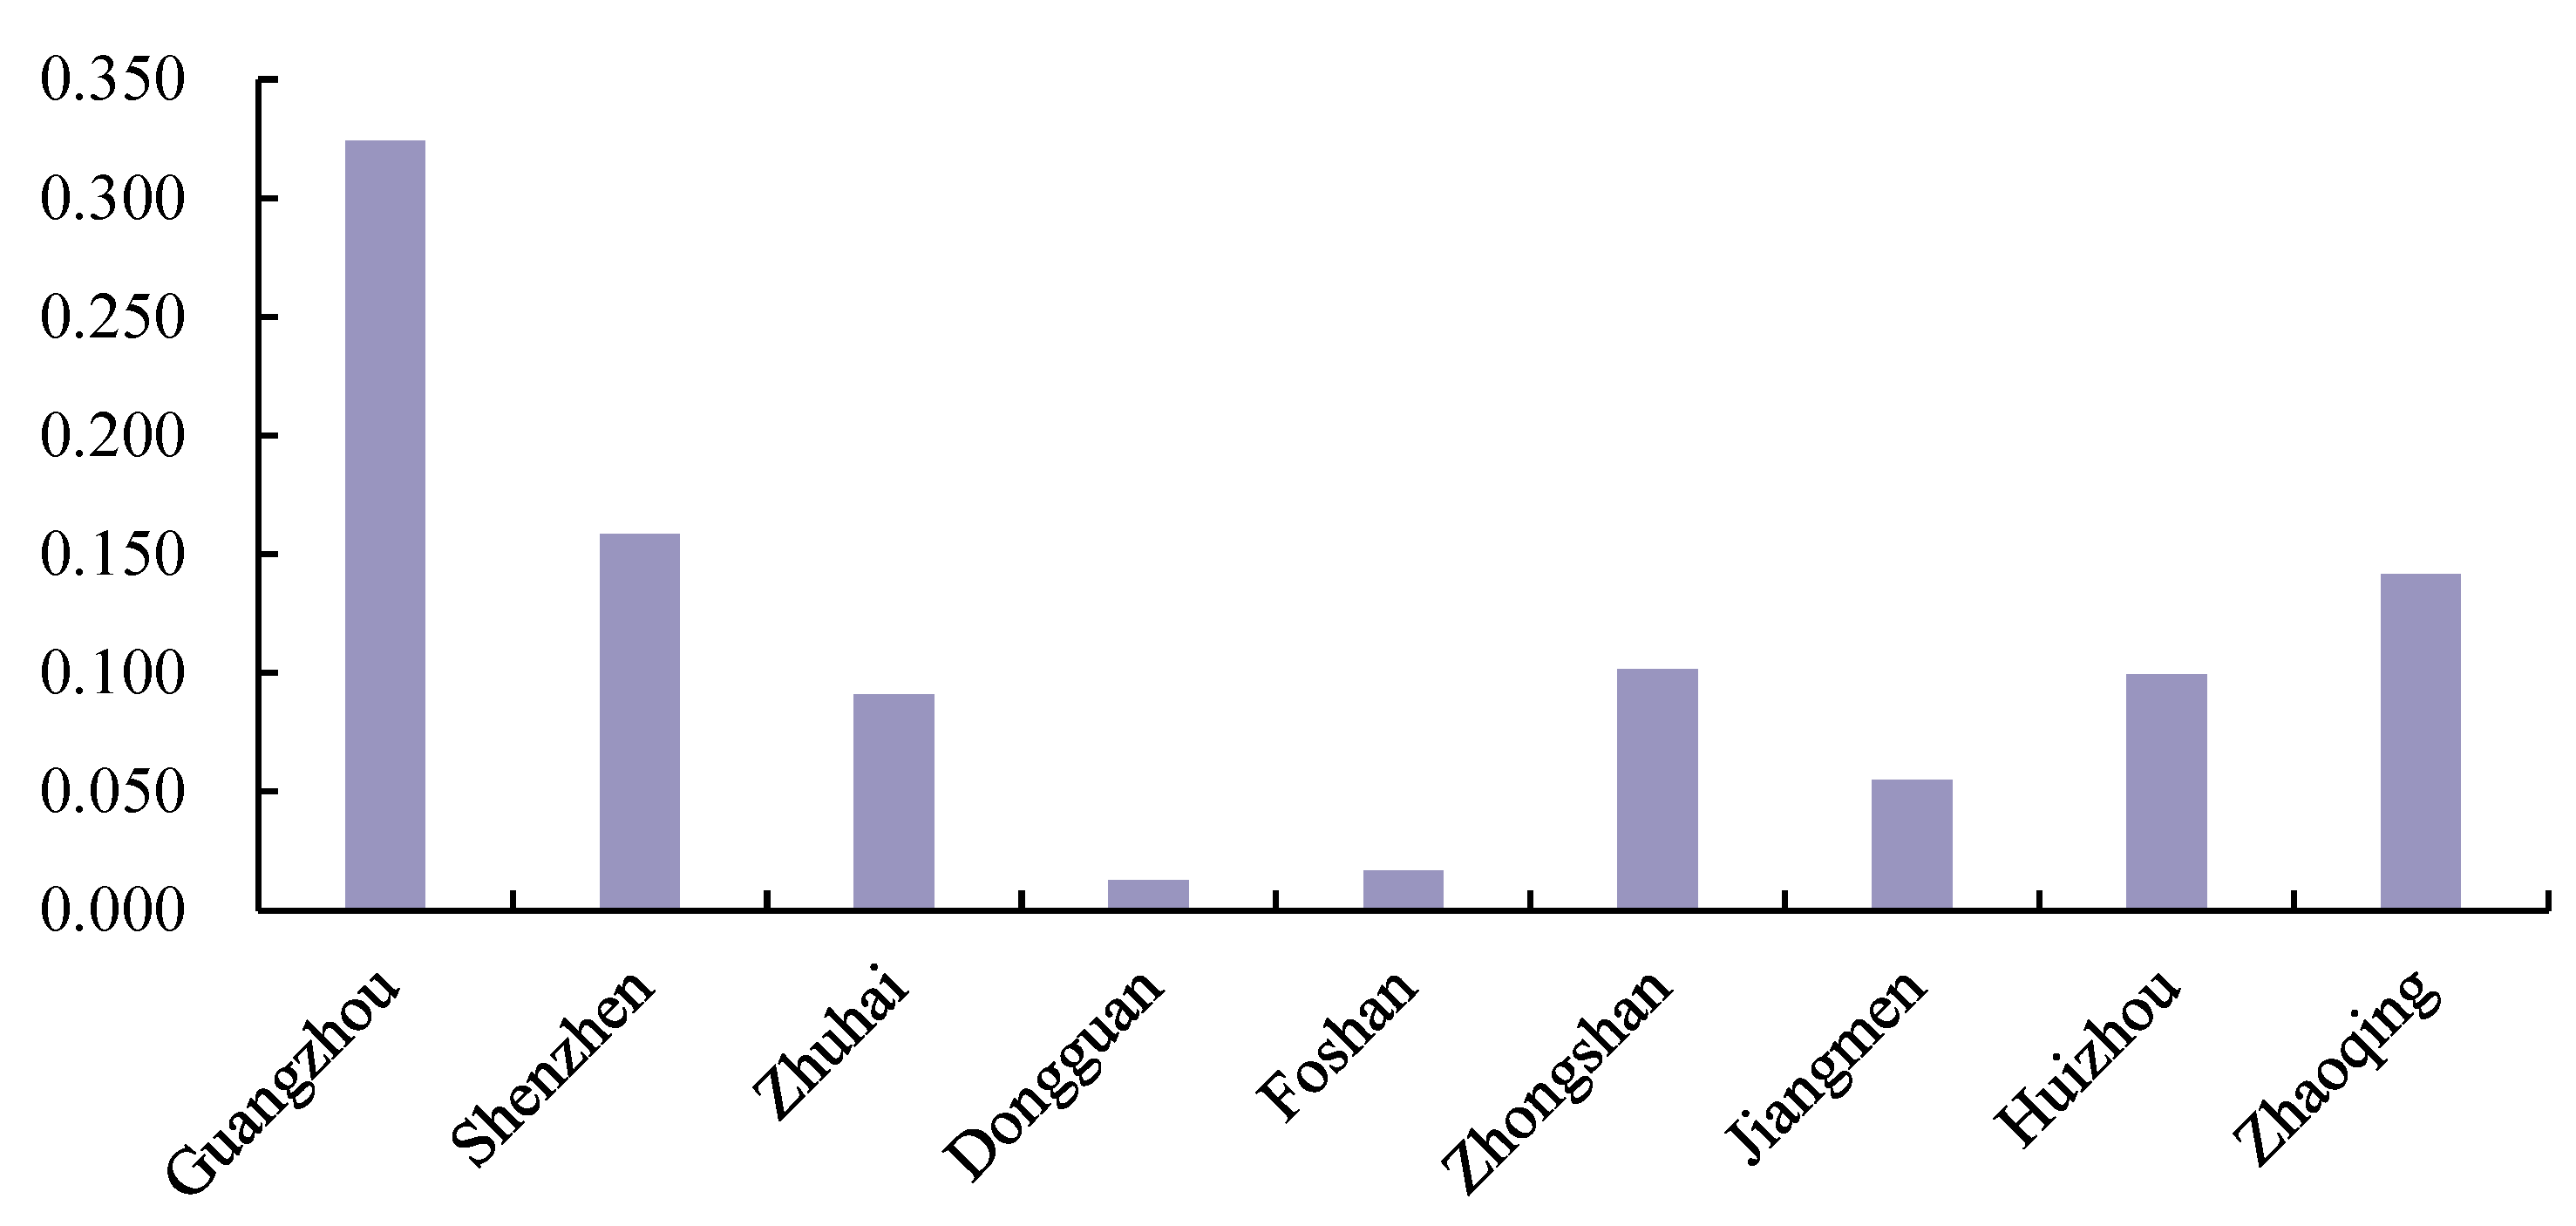
- Tourism development level: The tourism competitiveness of cities in the eastern part of the PRD was significantly stronger than that in the western part in 2009–2012, except for Guangzhou and Shenzhen. The tourism development index of the remaining cities is below 0.2, Zhongshan and Zhaoqing’s tourism development level is at the edge of the region, and the development of core cities and peripheral cities is extremely unbalanced. This state did not change in 2013–2015 and 2016–2019, but in numerical terms, the tourism development index of Guangzhou and Zhuhai declined at different magnitudes in 2013–2015, implying that the tourism development rate of this part of the city declined compared to other cities. Zhuhai, Huizhou and the cities of Zhongshan and Jiangmen, with slow development tourism development levels, improved in 2016–2019, and this increase in tourism visits and income is the direct driving force for the improvement of the tourism subsystem in these cities.
- (2)
- Economic development level: Guangzhou and Shenzhen remain the stable and dominant cities in the PRD. The 2009–2012 economic development indexes of Foshan, Zhongshan, Zhuhai and Dongguan are all greater than 0.1 and are in the second echelon of regional economic development, which is relatively similar to the overall pattern of tourism development levels. The 2013–2015 economic development indexes of some cities decreased, with Shenzhen and Dongguan being the most prominent, from 0.188 and 0.102 to 0.166 and 0.084, respectively, which is related to the decrease in the urban per capita disposable income and the investment share of related industries in these cities themselves. The economic development indexes of Guangzhou and Zhongshan decreased from 0.246 and 0.117 to 0.222 and 0.077, respectively; and the remaining cities had different increases in 2016–2019, indicating that the regional economic development level improves in a relatively coordinated state.
- (3)
- Ecology development level: The temporal changes in this dimension are stronger than the above two, but Zhaoqing was always the dominant city in regional ecology. The ecological development indexes of cities with a certain scale of high energy consumption and high emissions manufacturing industries, such as Foshan and Dongguan, were at a lower level during the study period. Jiangmen and Huizhou have continued to improve their ecological development conditions due to the increased control of pollutant emissions in social production and living processes, while Zhaoqing, Guangzhou and Shenzhen have seen their ecological development indices decline sharply due to the negative effects on the environment of economic activities, while also illustrating the relatively higher rate of ecological improvement in other cities.
4.2. Spatial Mismatch Pattern of the PRD TEE Systems
4.2.1. Spatial Mismatch Direction
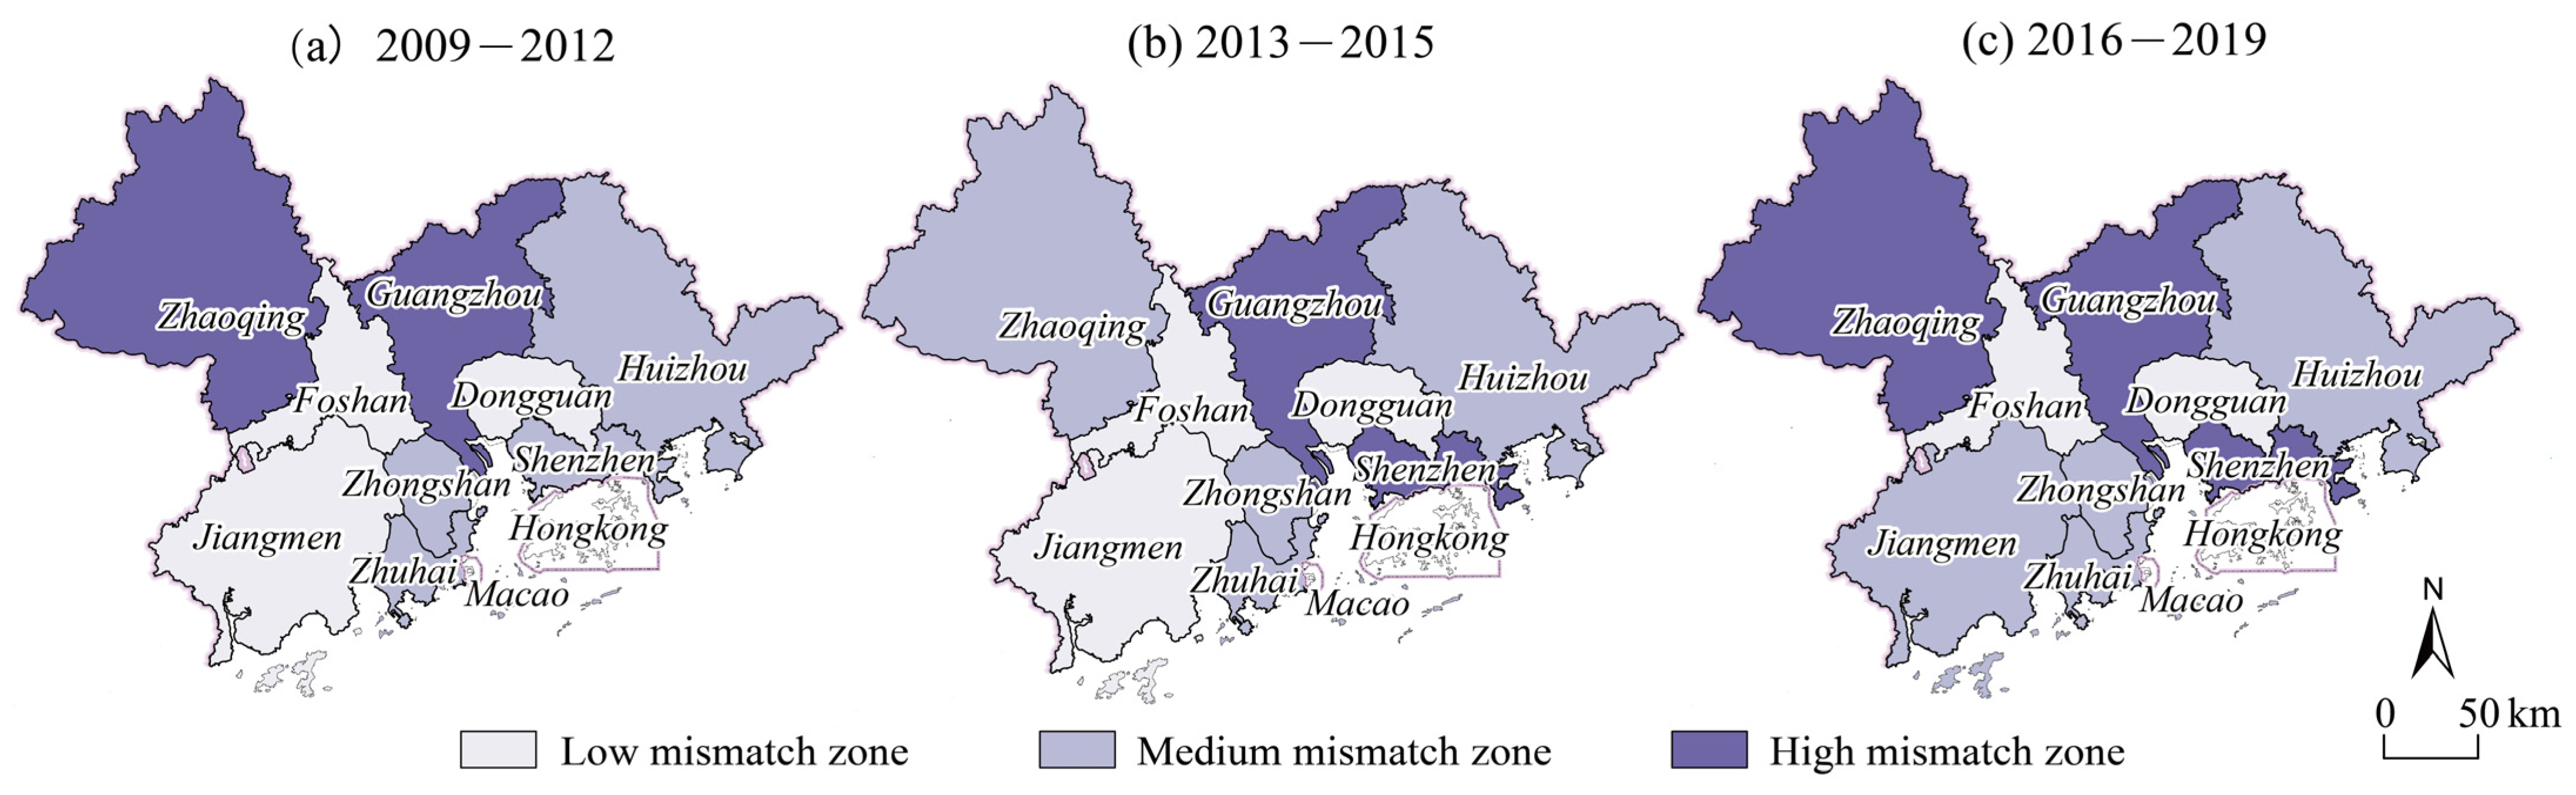
4.2.2. Spatial Mismatch Levels
4.2.3. Spatial Mismatch Contribution Rate
4.3. Coupling Coordination and Spatial Linkage of PRD TEE Systems
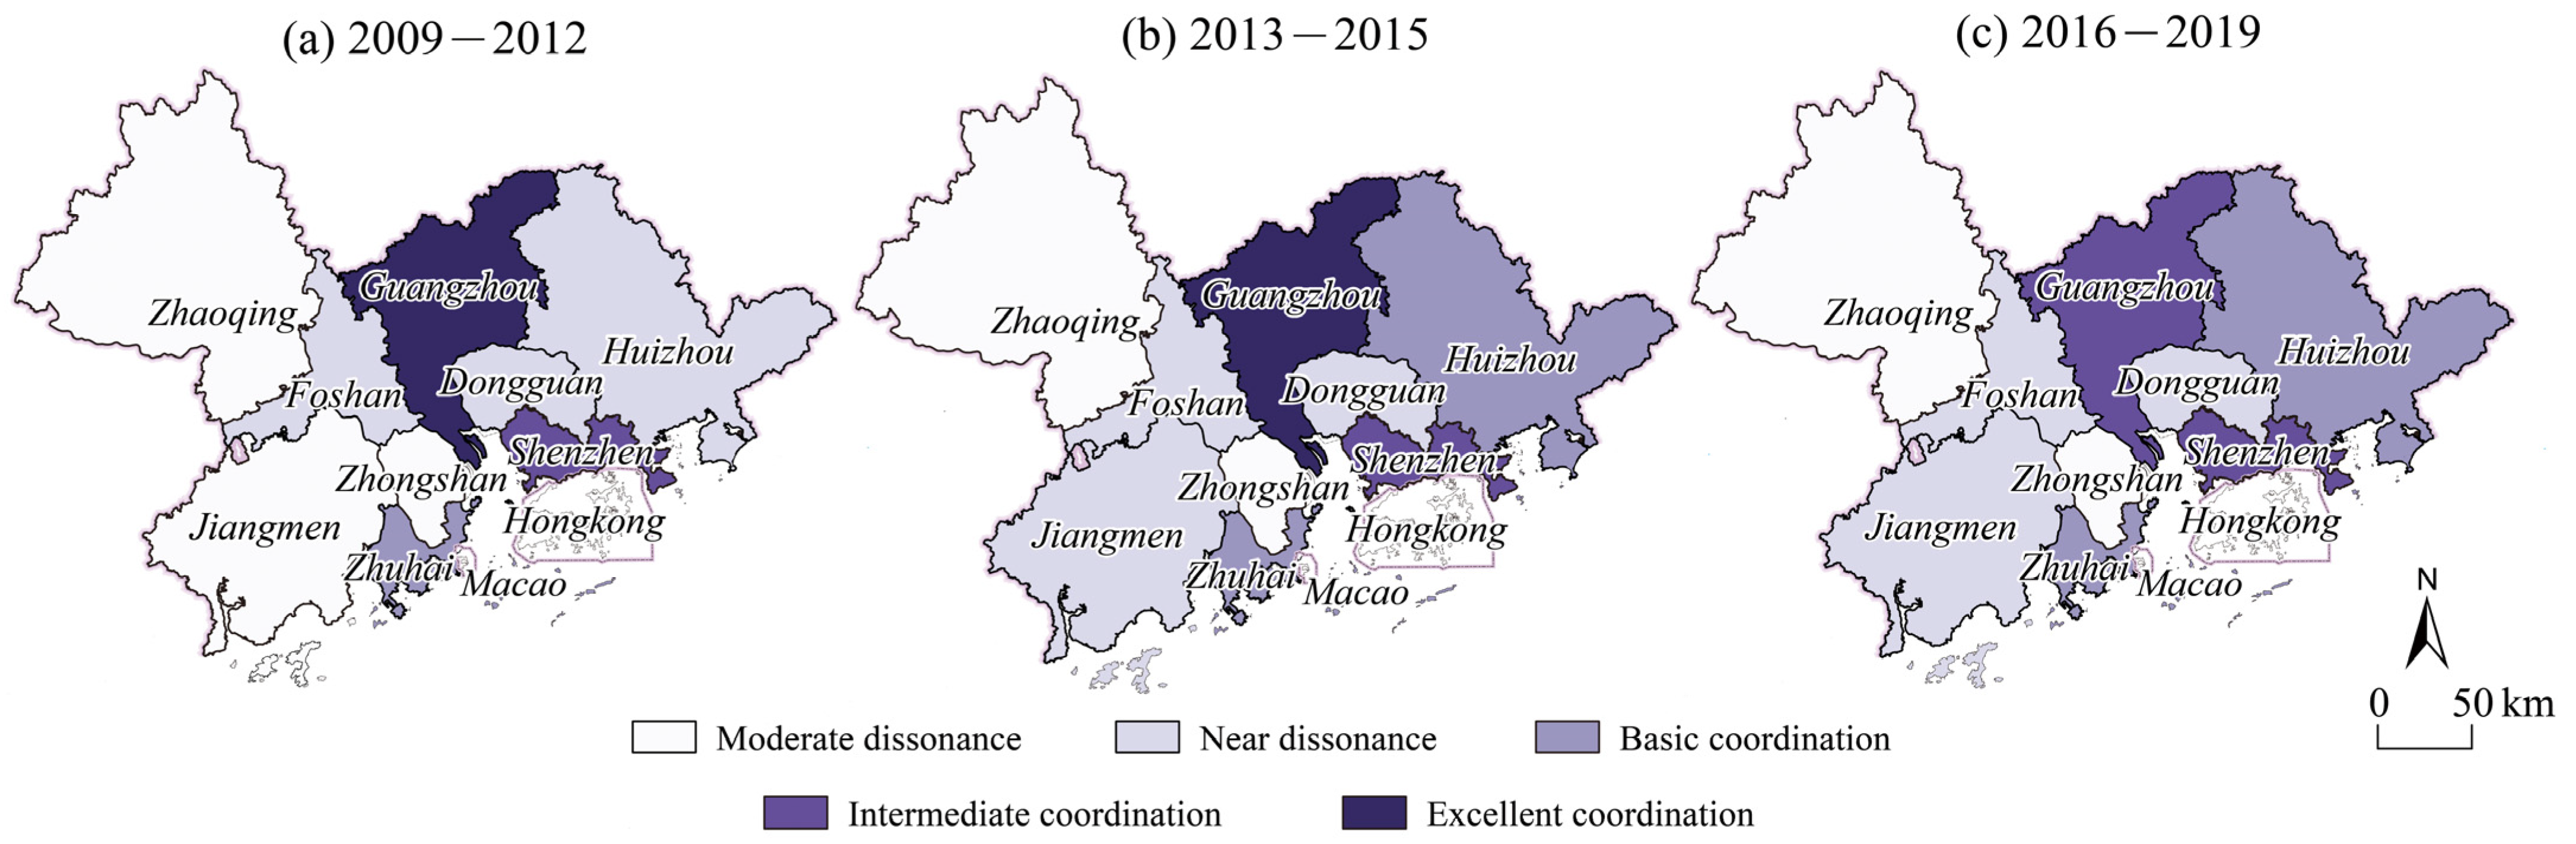
4.3.1. Spatial Differentiation of Coupling and Coordination
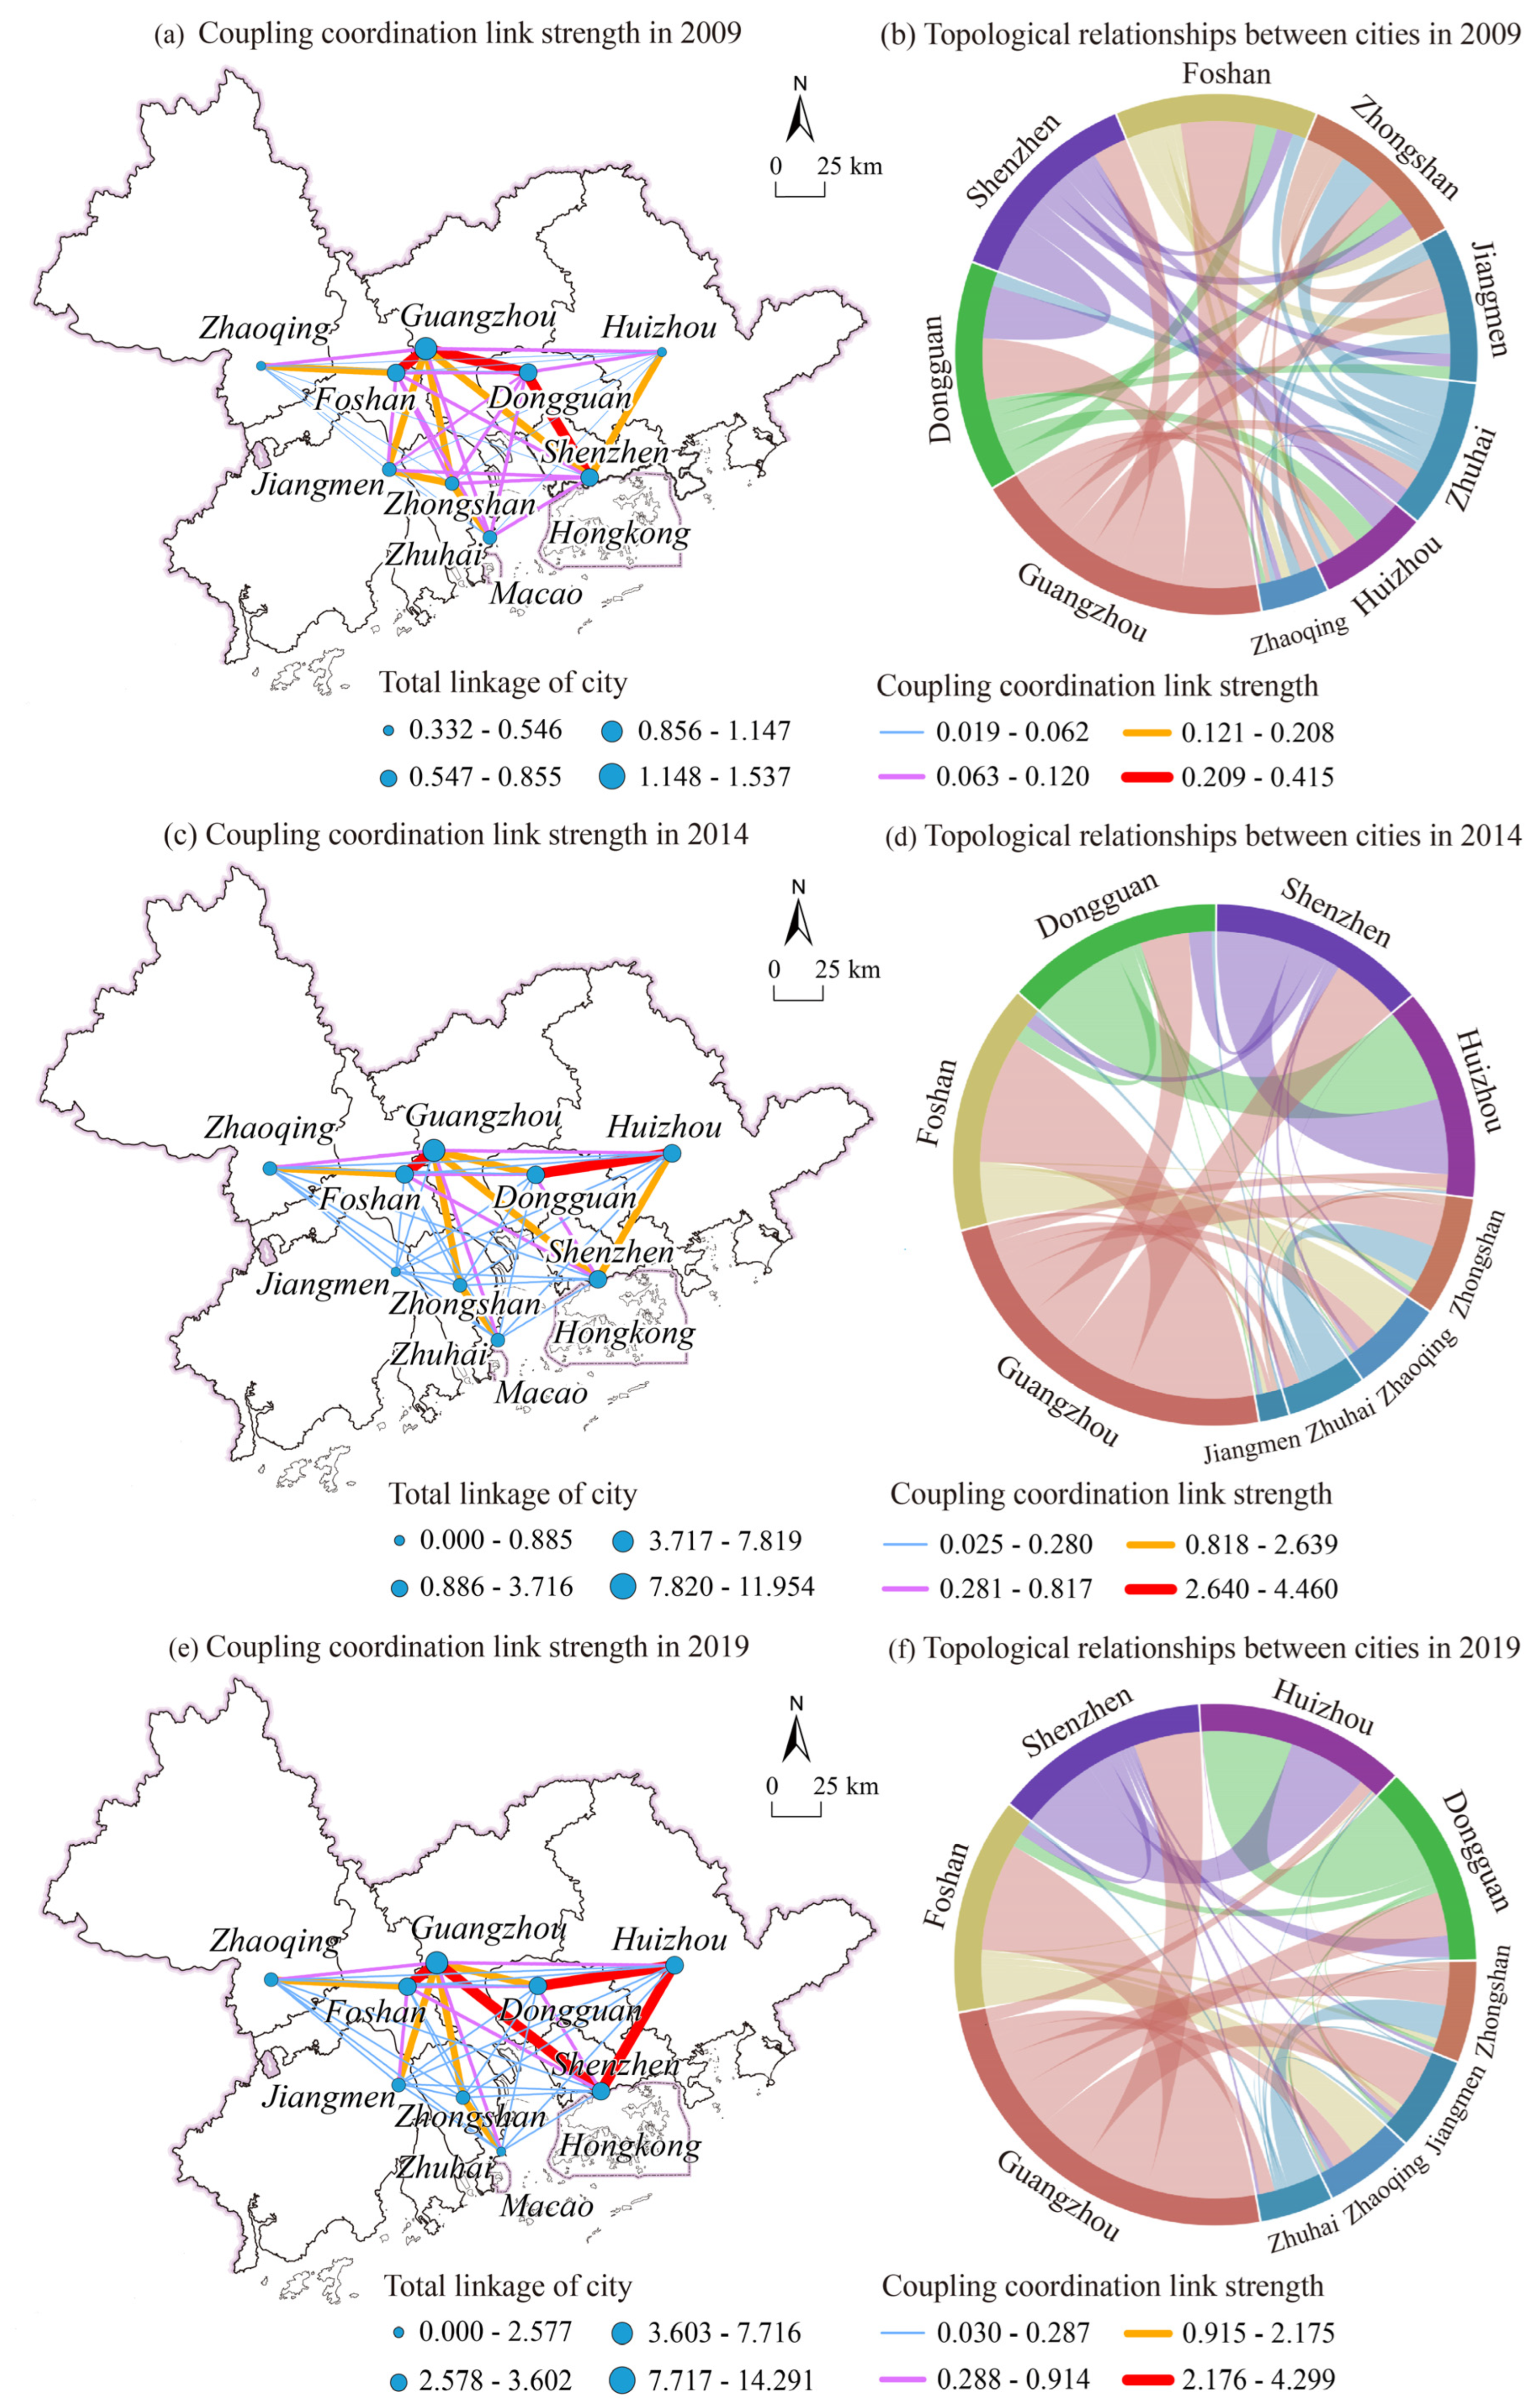
4.3.2. Coupling Coordination Link Strength
4.4. Spatial Mismatch-Coupling Coordination Comparison of the PRD TEE Systems
5. Discussions
6. Recommendations and Conclusions
6.1. Recommendations
- (1)
- Highlight the organization and driving role of core cities: Guangzhou and Shenzhen should control the development speed of the tourism industry, and maintain a relatively consistent pace with the development of the social economy and ecological environment. Given the decline of ecological environment quality in recent years, the need to control the “three wastes” emissions, as far as possible to reduce the occupation of greenery and water space in the construction process, to maintain the self-regulating ability of the urban climate, and the ecological environment conditions for tourism development should be improved, thus reducing the spatial mismatch of the TEE systems. From the macro space, relying on Guangzhou’s rich tourism resources and Shenzhen’s good tourism organization and reception capacity, the market of high-quality visitor sources should be broadened, the interaction of tourism flows and linkage of facility construction be promoted, complementary advantages and value chain integrations should be formed, and the leading effect to drive the coordinated development of tourism in other cities should be brought into play.
- (2)
- Promote coordination and linkages between core and peripheral cities: For Dongguan and Foshan, the intensity of coupling and coordination links is high under the location advantage, but the poor ecological environment condition is the main reason for the poor coordination of the TEE systems, and the radiation drive to other cities is limited. In future the waste emission of manufacturing production needs to be controlled, energy conservation, and emission reduction must adhere to the concept of ecological civilization development and make up for the deficiencies of the ecological environment system in order to improve the coordination of the TEE systems. Huizhou is a typical city rich in tourism resources but not fully developed, which is ultimately weak in tourism reception capacity. In the future, we need to focus on the improvement of the tourism accommodation and tourism organization systems, increase the probability of overnight stays and the consumption by tourists, and improve the development level of the tourism industry to reduce the degree of spatial mismatch. From the macro spatial point of view, this type of city needs to plan tourism resources in-depth and combine local socio-economic, cultural, and natural elements to create special tourism projects, such as Dongguan’s special food industry, Foshan’s martial arts cultural festival and Huizhou’s Daya Bay, to form their tourism brand symbols, use joint promotion, and better articulate the coordination linkage of TEE systems between core cities and peripheral cities.
- (3)
- Focus on tapping the development factors and advantageous conditions of potential cities: The biggest problem of this category of cities is the small development of tourism resources, limited local attractiveness, and the tourism industry lagging behind relative to socio-economic and ecological development. In the future, these cities need to fully release the dividends of geographical location, resources and other factors. For instance, Zhongshan, Zhuhai and Jiangmen can use the geo-space near the river or the sea to create a waterfront tourism industry belt, and Zhaoqing can use forest resources to develop ecological tourism through government guidance. The development of the tourism industry can reduce the degree of spatial mismatch of the TEE systems and improve the coupling and coordination of the system. From the macro space point of view, the cost of transportation distance is an important reason why the strength of coupling and coordination linkage of this type of city is at the edge of the region. In the future, it is necessary to increase the investment in transportation construction, shorten the time distance to core cities such as Guangzhou and Shenzhen, and open up the circulation channels of factors to fully accept the coupling and coordination drive of the TEE systems in the core area and expand the tourism competitiveness of Zhaoqing and the Pearl River central economic circle.
6.2. Conclusions
- (1)
- In the tourism and economic subsystems of the PRD, Guangzhou and Shenzhen represent the “power” cities. Furthermore, the overall patterns are relatively close to each other, with the development levels in both dimensions showing the pattern that the eastern cities are higher than the western ones, and there is an imbalance of development between the core cities and the peripheral cities. According to a comparison of the economic development level, the spatial polarization of the tourism development level reaches a more significant level, but this polarization has been reduced over time. Additionally, the tourism and economic development level of the whole region has shown improvement in a relatively coordinated state. In terms of ecology, Zhaoqing is the city with the most significant ecological advantage in the region, and the development changes of this subsystem are more notable compared to the tourism and economic subsystems. Moreover, the quality of the ecological environment tends to show improvement in most cities, despite a decline shown for Zhaoqing, Guangzhou and Shenzhen.
- (2)
- In respect of spatial mismatch, except for Dongguan, which shows changes in both negative and positive states, all the remaining cities perform more consistently. Guangzhou, Shenzhen and Foshan show a negative mismatch due to the development rate of the tourism industry being higher than in the socio-economic and ecological environments. By contrast, other cities such as Zhuhai, Zhongshan, and Jiangmen show a positive mismatch because the development level of the tourism industry relatively lags behind their own economic or ecological conditions. As for the spatial mismatch level, Dongguan, Foshan and Jiangmen are located in the low mismatch area, Zhuhai, Zhongshan, and Huizhou are located in the middle mismatch area, and Guangzhou, Shenzhen, and Zhaoqing are located in the middle mismatch area. This is because Guangzhou, Shenzhen and Zhaoqing show a significant mismatch due to the high value of the tourism industry or the ecological environment contributing significantly to the regional spatial mismatch. Although the whole region shows the characteristic that a higher ranking of the city leads to more significant changes in mismatch index, the rank state is stable, and the cities with changes in ranking include Shenzhen, Jiangmen and Zhaoqing, the first two of which show the development of dislocation to high rankings. Besides, Zhaoqing reverted to the high mismatch area after declining to the medium mismatch area in 2013–2015. Regarding the spatial mismatch contribution rate of subsystems, the economic and ecological subsystems contribute to the regional spatial mismatch of subsystems. The economic and ecological subsystems exert a limited mitigating effect on the spatial mismatch of the TEE systems, while the tourism subsystem is crucial for the occurrence of spatial mismatch.
- (3)
- The coupling and coordination level of the TEE systems in the east of the PRD is higher than in the west, where the coordination area covers Guangzhou, Shenzhen, Zhuhai and Huizhou, and the dysfunctional area covers Dongguan, Foshan, Zhongshan, Jiangmen and Zhaoqing. Furthermore, the coupling and coordination status shows a greater stability in most cities, and the coupling and coordination degree shows a slight increase. Guangzhou is the core city of regional TEE systems coupling and coordination linkage, while Shenzhen and Foshan are the secondary cores. High-level linkage also exists among these three cities, with the Guangzhou–Foshan one as the closest. During the period from 2016 to 2019, the economic circle of Shenzhen-Dongguan-Huizhou surpassed the economic circle of Guangzhou-Foshan-Zhaoqing, becoming the most closely coupled and coordinated linkage in the Pearl River Delta.
- (4)
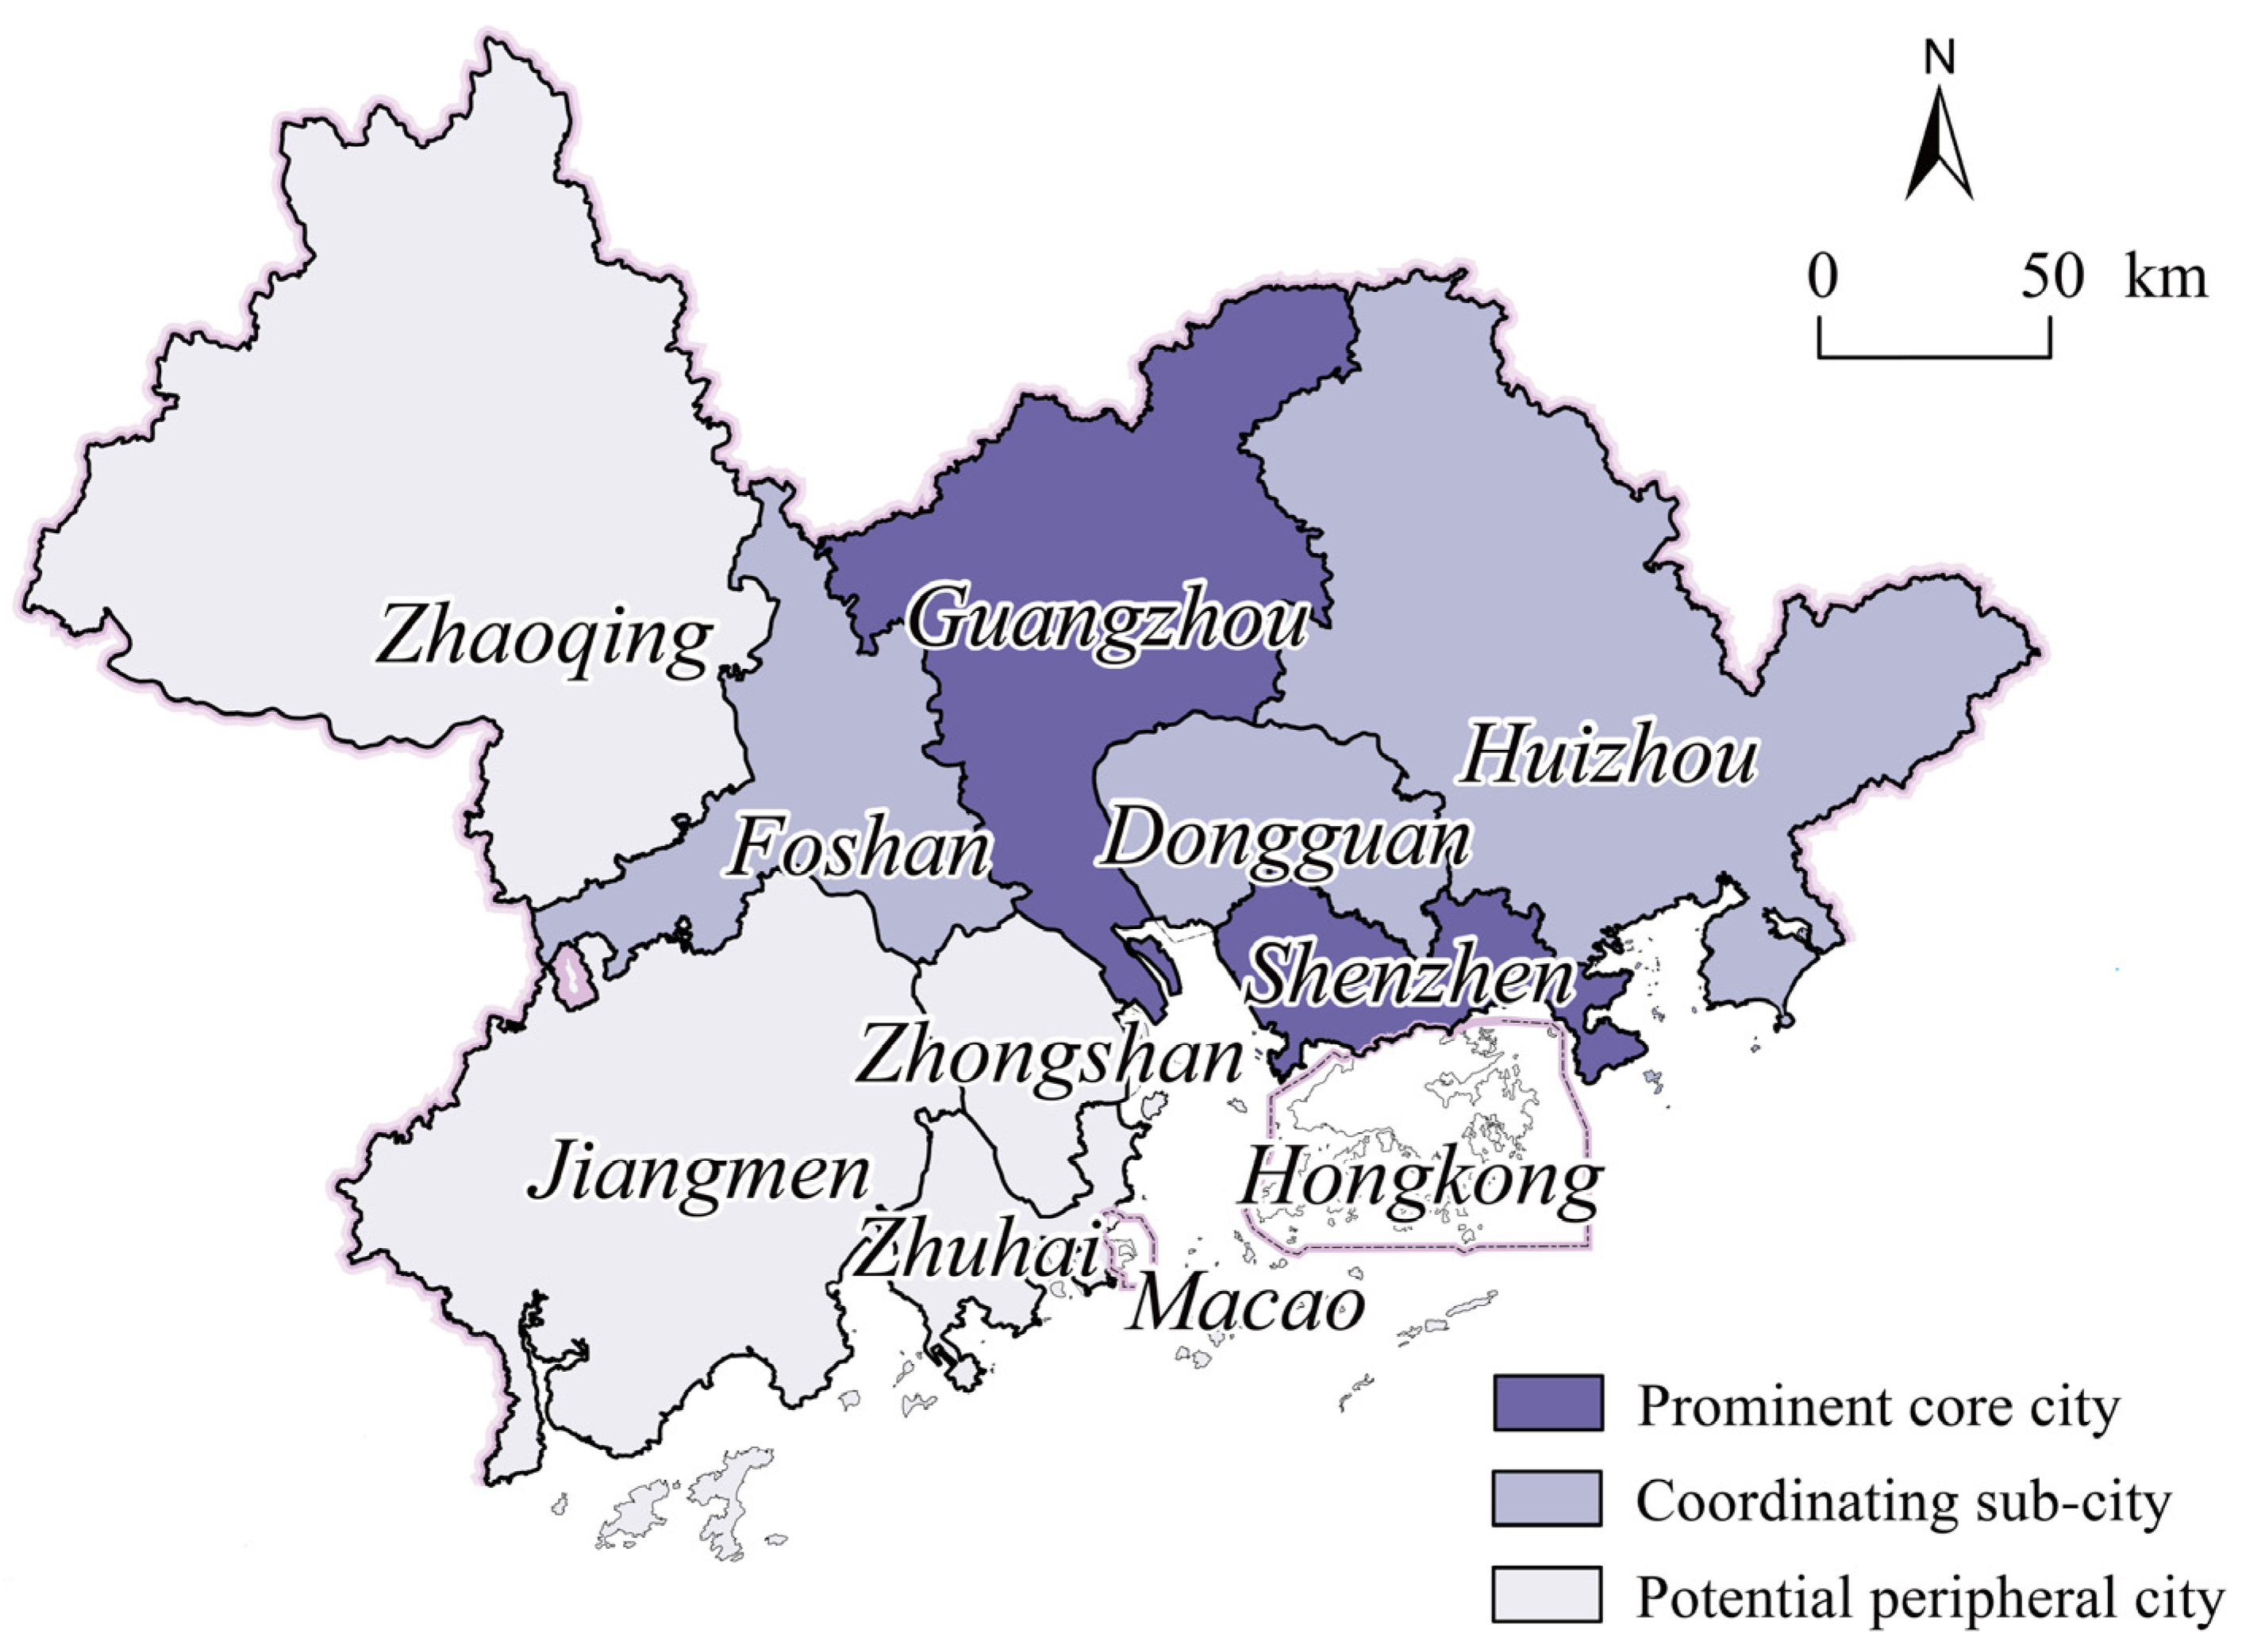
- According to the results of strength analysis for spatial mismatch and coupling coordination linkage, there are nine cities classified, among which Guangzhou and Shenzhen represent the prominent core cities; Dongguan, Foshan and Huizhou represent the secondary coordinating sub-cities; and Zhuhai, Zhongshan, Jiangmen, and Zhaoqing represent the potential peripheral cities. Regarding the prominent core cities, the priority in the future is to improve the quality of the ecological environment and reduce the mismatch between the TEE systems. Different from the core cities, there remains a lot of potential space for the level of tourism development in the coordinating sub-cities and potential peripheral cities. In addition, to strengthen the connection of the urban TEE systems and promote the coordinated development of regional tourism, the focus of further research should be placed on the insufficient development of tourism resources and the backwardness of tourism transportation, accommodation and other relevant facilities.
Author Contributions
Funding
Conflicts of Interest
References
- Kain, J.F. Housing segregation, negro employment, and metropolitan decentralization. Q. J. Econ. 1968, 82, 175–197. [Google Scholar] [CrossRef]
- Preston, V.; Mclafferty, S. Spatial mismatch research in the 1990s: Progress and potential. Pap. Reg. Sci. 1999, 78, 387–402. [Google Scholar] [CrossRef]
- Andersson, F.; Haltiwanger, J.C.; Kutzbach, M.J.; Pollakowski, H.O.; Weinberg, G.H. Job displacement and the duration of joblessness: The role of spatial mismatch. Rev. Econ. Stat. 2018, 100, 203–218. [Google Scholar] [CrossRef]
- Liu, Z.; Wang, M.; Chai, Y. Spatial mismatch theory: A review on empirical research and methodology. Hum. Geogr. 2010, 25, 1–6. [Google Scholar]
- Li, C.-X.; Ma, Y.-F.; Zhang, Y.-Y.; Gao, J. An analysis of space-time dynamic evolution and dislocation of inbound tourism based on typical cities: With the gravity model as an empirical research. Econ. Geogr. 2010, 30, 1372–1377. [Google Scholar]
- Peng, K.; He, X.; Lu, Y. Study on spatial mismatch and influencing factors of tourism industry-regional economy-ecological environment system in Yangtze River Economic Belt. Geogr. Geo-Inf. Sci. 2021, 37, 117–123. [Google Scholar]
- Han, L.; Wei, F.; Li, X. Synchrony and asynchrony: Study on collaborative development of city and tourism in Guanzhong Plain urban agglomeration from the perspective of scale. J. Zhejiang Univ. 2021, 48, 617–628. [Google Scholar]
- Wang, H.; Ma, Y. Research on the tourism resources and inbound tourism in Shaanxi Province based on the theory of spatial mismatch. J. Arid. Land Resour. Environ. 2016, 30, 198–203. [Google Scholar]
- Ding, X.; Li, Y.; Lv, K. A study on the regional disparity development of tourism in Henan Province based on spatial mismatch theory. Geogr. Geo-Inf. Sci. 2011, 27, 106–108. [Google Scholar]
- Deng, Z.; Ying, Y. An analysis of the spatial mismatch of tourism resources, location and inbound tourism revenue in China. Tour. Sci. 2009, 23, 6–10. [Google Scholar]
- Liu, Z.; Han, Z.; Xia, X. A study of regional differences in China’s coastal tourism based on spatial dislocation theory. Ocean. Dev. Manag. 2015, 32, 95–99. [Google Scholar]
- Li, L. The diagnosis of “synchronousness-asynchronousness” and the differences in and among the Chinese destinations: Based on the national tourism data of 31 provincial cellos. Hum. Geogr. 2008, 23, 87–90. [Google Scholar]
- Su, Z.; Aaron, J.R.; McDowell, W.C.; Lu, D.D. Sustainable Synergies between the Cultural and Tourism Industries: An Efficiency Evaluation Perspective. Sustainability 2019, 11, 6607. [Google Scholar] [CrossRef] [Green Version]
- Mazanec, J.A.; Ring, A. Tourism destination competitiveness: Second thoughts on the World Economic Forum reports. Tour. Econ. 2011, 17, 725–751. [Google Scholar] [CrossRef] [Green Version]
- Krstic, B.; Jovanovic, S.; Jankovic-Milic, V.; Stanisic, T. Examination of travel and tourism competitiveness contribution to national economy competitiveness of sub-Saharan Africa countries. Devel. S. Afr. 2016, 33, 470–485. [Google Scholar] [CrossRef]
- De Jong, M.; Joss, S.; Schraven, D.; Zhan, C.; Weijnen, M. Sustainable–smart–resilient–low carbon–eco–knowledge cities; making sense of a multitude of concepts promoting sustainable urbanization. J. Clean. Prod. 2015, 109, 25–38. [Google Scholar] [CrossRef] [Green Version]
- Wang, X.; Liu, D. The Coupling Coordination Relationship between Tourism Competitiveness and Economic Growth of Developing Countries. Sustainability 2020, 12, 2350. [Google Scholar] [CrossRef] [Green Version]
- Guan, D.; Gao, W.; Su, W.; Li, H.; Hokao, K. Modeling and dynamic assessment of urban economy–resource–environment system with a coupled system dynamics–geographic information system model. Ecol. Indic. 2011, 11, 1333–1344. [Google Scholar] [CrossRef]
- Oh, C.O. The contribution of tourism development to economic growth in the Korean economy. Tour. Manag. 2005, 26, 39–44. [Google Scholar] [CrossRef]
- Day, J.; Cai, L. Environmental and energy-related challenges to sustainable tourism in the United States and China. Int. J. Sustain. Dev. World Ecol. 2012, 19, 379–388. [Google Scholar] [CrossRef]
- Cui, F. Coordinated development degree of tourism ecomomy and ecological environment in Shanghai. China Popul. Resour. Environ. 2008, 5, 64–69. [Google Scholar]
- Zhou, C.; Feng, X.; Tang, R. Analysis and forecast of coupling coordination development among the regional economy-ecological environment-tourism industry: A case study of provinces along the Yangtze Economic Zone. Econ. Geogr. 2016, 36, 186–193. [Google Scholar]
- Liu, D.; Yang, Y. Coupling coordinative degree of regional economy-tourism-ecological environment: A case study of Anhui Province. Resour. Environ. Yangtze Basin 2011, 20, 892–896. [Google Scholar]
- Pan, Y.; Weng, G.; Sheng, K.; Li, L. Analysis of the spatiotemporal evolution characteristics and spatial difference of “Tourism +” system coordinated development in the Yangtze River Economic Belt. Resour. Environ. Yangtze Basin 2020, 29, 1897–1909. [Google Scholar]
- Wang, Q.; Yu, G. A study on the measurement of the niche of regional tourism cities and cooperation-competition Model: A case study on the Pearl River Delta region. Tour. Trib. 2008, 3, 50–56. [Google Scholar]
- Jiang, J.; Yu, G. A study on the regional tourism cooperation-competition model in the Yangtze River Delta based on the theory of econiche. Geogr. Geo-Inf. Sci. 2009, 25, 93–97, 101. [Google Scholar]
- Xue, H.; Tang, Z.; Fang, C.; Fan, Z. Research on coordination development of tourism-economy-environment system in Qinghai Province from the perspective of ecological civilization. Resour. Dev. Mark. 2016, 32, 410–413. [Google Scholar]
- Zhang, Y.; Xu, J.; Zeng, G.; Wu, Y. Construction of evaluation model and empirical study of sustainable coordinated development of tourism-economy-ecological system: A case study of Guilin in Guangxi. Tour. Sci. 2008, 3, 31–35, 54. [Google Scholar]
- Li, L.; Weng, G. Evolution analysis of tourism, culture and economy development in the western China based on spatial mismatch method. Geogr. Geo-Inf. Sci. 2016, 32, 121–126. [Google Scholar]
- Gobillon, L.; Selod, H.; Zenou, Y. The mechanisms of spatial mismatch. Urban Stud. 2007, 44, 2401–2427. [Google Scholar] [CrossRef] [Green Version]
- Wu, Z.; Zhang, L.; Huang, S. Spatial structure and characteristics of tourism economic connections in Guangdong-Hong Kong-Macao Greater Bay Area. Geogr. Res. 2020, 39, 1370–1385. [Google Scholar]
- Jia, Y.; Hu, J.; Liu, D.; Zhu, L.; Li, Y. Spatial-temporal pattern of the coordinated development of ecology-culture-tourism of China’s provinces. World Reg. Stud. 2021, 30, 620–631. [Google Scholar]
- Cheng, H.; Xu, Q.; Guo, Y. Temporal and spatial evolution of the coupling coordinated development between tourism resources development and ecological environment in China. Econ. Geogr. 2019, 39, 233–240. [Google Scholar]
- Bao, J. Coupled and coordinated development of tourism and ecological environment: The case of Huangshan city, Anhui Province. J. Anhui Univ. 2013, 37, 150–156. [Google Scholar]
- Castells, M. Grassrooting the space of flows. Urban Geogr. 1999, 20, 294–302. [Google Scholar] [CrossRef]
- Wang, C.; Ye, Y.; Wang, F.; Huang, Z.; Li, Z.; Chen, Y.; Lin, H.; Wu, K.; Lin, X.; Zhang, H. Measurement and evaluation of the coordinated development in the Guangdong-Hong Kong-Macao Greater Bay Area. Trop. Geogr. 2022, 42, 206–219. [Google Scholar]
- Wang, D.; Chen, T. Differences of religional tourism development based on competitiveness evaluation: A case study of the three circles in eastern coastal China. Prog. Geogr. 2011, 30, 249–256. [Google Scholar]
- Ma, L.; Sun, G.; Huang, Y.; Zhou, R. A correlative anaylsis on the relationship between domestic tourists and network attention. Econ. Geogr. 2011, 31, 680–685. [Google Scholar]
- Zhou, Y. Research on soft environment of tourism investment in border region of Xiang, Er, Yu, and Qian. Resour. Dev. Mark. 2010, 26, 749–751. [Google Scholar]
- Ma, L.; Sun, G.; Xie, Y.; Long, M. A study on variations of the tourism climate comfort degree in five typical cities in eastern China during the last 50 years. Resour. Sci. 2010, 32, 1963–1970. [Google Scholar]
- Yao, Y.; Wang, S.; Zhou, Y.; Liu, R.; Han, X. The application of ecological environment index model on national evaluation of ecological environment quality. Remote Sens. Inf. 2012, 27, 93–98. [Google Scholar]
- Chen, M.; Lu, D.; Zhang, H. Comprehensive evaluation and the driving factors of China’s urbanization. Acta Geogr. Sin. 2009, 64, 387–398. [Google Scholar]
- Wu, G.; Liu, W.; Zheng, X. Analysis on the spatial mismatch of tourism, culture and economic development level in various regions of China. Areal Res. Dev. 2018, 37, 80–84. [Google Scholar]
- Houston, D.S. Methods to test the spatial mismatch hypothesis. Econ. Geogr. 2005, 81, 407–434. [Google Scholar] [CrossRef]
- Chen, Q.; Cheng, C.; Tian, R. The spatial mismatch and its evolution of “Inbound Tourism-Tourism Attraction-Hotel” in Guangxi from ASEAN. Econ. Geogr. 2017, 37, 192–199. [Google Scholar]
- Luo, J.; Zhang, B.; Liu, S. Relationship between traffic accessibility and tourism economic contact of Guangdong-Hong Kong-Marco Greater Bay Area. Econ. Geogr. 2020, 40, 213–220. [Google Scholar]
- China Minzu Culture Resource. 2020. Available online: http://www.minzunet.cn/ (accessed on 31 December 2021). (In Chinese).
- Atmospheric Composition Analysis Group of Dalhousie University. 2020. Available online: https://sites.wustl.edu/acag/datasets/surface-pm2-5/ (accessed on 31 December 2021).
- National Meteorological Science Data Center. 2020. Available online: http://data.cma.cn/ (accessed on 31 December 2021). (In Chinese).
- Zhang, Y.; Wahap, H.; Dang, J.; Deng, B.; Wang, R. Coupled coordination degree of tourism-economy-ecological system in Turpan area. Hum. Geogr. 2014, 29, 140–145. [Google Scholar]
- Liu, D.; Wang, X.; Wu, X.; He, J.; Duan, Z. Coupling coordination between tourism competitiveness and economic development in global poverty-stricken countries and spatiotemporal changes. Prog. Geogr. 2018, 37, 1381–1391. [Google Scholar]

| Dimensions | Indicators | Indicator Meaning | |
|---|---|---|---|
| TEE Systems Spatial mismatch and Coupling Coordination | Tourism Industry [11,13,37,38] | Tourist arrivals (T1) | Tourism attractiveness |
| Tourism revenue (T2) | Tourism market size | ||
| The abundance of tourism resources (T3) | Resource endowment | ||
| Number of travel agencies (T4) | Tour organization capability | ||
| Number of star-rated hotels (T5) | Visitor reception level | ||
| Number of intangible cultural heritage projects at the provincial level (T6) | Featured cultural heritage | ||
| Socio-Economic [20,21,23,39] | GDP per capita (E1) | Economic level | |
| Urban per capita disposable income (E2) | Personal financial ability | ||
| Share of the tertiary sector labor force in the social labor force (E3) | Service industry human resources | ||
| Percentage of fixed asset investment in the culture, sports and entertainment industry (E4) | Related industry support | ||
| Visitor Turnover (E5) | Traffic conditions | ||
| Electricity consumption per capita (E6) | Power supply capacity | ||
| Number of beds in health facilities per 10,000 people (E7) | Medical and health care level | ||
| Per capita postal and telecommunications operations (E8) | Communication capability | ||
| Ecology [27,28,40,41] | Average PM2.5 concentration (S1) | Air Environment quality | |
| Wastewater discharge per capita (S2) | Water Environment quality | ||
| Industrial solid waste generation (S3) | Solid waste discharge | ||
| Climate Comfort (S4) | Climate environment | ||
| Parkland area per capita (S5) | Greening level | ||
| Ecological Environment Index (S6) | Ecological quality |
| Indicators | T1 | T2 | T3 | T4 | T5 | T6 | E1 | E2 | E3 | E4 | E5 | E6 | E7 | E8 | S1 | S2 | S3 | S4 | S5 | S6 |
|---|---|---|---|---|---|---|---|---|---|---|---|---|---|---|---|---|---|---|---|---|
| Nature | (+) | (+) | (+) | (+) | (+) | (+) | (+) | (+) | (+) | (+) | (+) | (+) | (+) | (+) | (−) | (−) | (−) | (+) | (+) | (+) |
| 2009 | 0.068 | 0.100 | 0.064 | 0.079 | 0.055 | 0.047 | 0.032 | 0.025 | 0.063 | 0.068 | 0.082 | 0.024 | 0.059 | 0.034 | 0.051 | 0.033 | 0.017 | 0.025 | 0.048 | 0.027 |
| 2010 | 0.063 | 0.106 | 0.064 | 0.091 | 0.056 | 0.046 | 0.032 | 0.024 | 0.062 | 0.054 | 0.076 | 0.024 | 0.049 | 0.032 | 0.028 | 0.028 | 0.016 | 0.063 | 0.057 | 0.027 |
| 2011 | 0.052 | 0.110 | 0.061 | 0.087 | 0.058 | 0.041 | 0.029 | 0.022 | 0.044 | 0.029 | 0.061 | 0.021 | 0.034 | 0.032 | 0.033 | 0.049 | 0.020 | 0.158 | 0.032 | 0.027 |
| 2012 | 0.064 | 0.134 | 0.058 | 0.105 | 0.057 | 0.047 | 0.034 | 0.024 | 0.049 | 0.052 | 0.063 | 0.023 | 0.041 | 0.034 | 0.032 | 0.035 | 0.029 | 0.067 | 0.022 | 0.031 |
| 2013 | 0.064 | 0.126 | 0.054 | 0.114 | 0.063 | 0.046 | 0.035 | 0.023 | 0.051 | 0.044 | 0.065 | 0.022 | 0.036 | 0.037 | 0.035 | 0.043 | 0.037 | 0.059 | 0.018 | 0.029 |
| 2014 | 0.069 | 0.117 | 0.050 | 0.108 | 0.061 | 0.047 | 0.037 | 0.027 | 0.040 | 0.065 | 0.118 | 0.022 | 0.033 | 0.037 | 0.026 | 0.032 | 0.031 | 0.024 | 0.018 | 0.040 |
| 2015 | 0.067 | 0.110 | 0.046 | 0.100 | 0.066 | 0.048 | 0.035 | 0.025 | 0.038 | 0.047 | 0.112 | 0.020 | 0.029 | 0.036 | 0.031 | 0.032 | 0.030 | 0.066 | 0.020 | 0.040 |
| 2016 | 0.073 | 0.112 | 0.047 | 0.106 | 0.063 | 0.052 | 0.037 | 0.027 | 0.053 | 0.042 | 0.053 | 0.022 | 0.031 | 0.037 | 0.028 | 0.031 | 0.030 | 0.081 | 0.023 | 0.054 |
| 2017 | 0.079 | 0.115 | 0.057 | 0.101 | 0.070 | 0.052 | 0.037 | 0.026 | 0.052 | 0.038 | 0.054 | 0.022 | 0.028 | 0.040 | 0.027 | 0.039 | 0.034 | 0.028 | 0.048 | 0.054 |
| 2018 | 0.072 | 0.106 | 0.049 | 0.100 | 0.080 | 0.058 | 0.037 | 0.027 | 0.054 | 0.041 | 0.062 | 0.022 | 0.030 | 0.037 | 0.031 | 0.040 | 0.035 | 0.028 | 0.041 | 0.052 |
| 2019 | 0.070 | 0.105 | 0.047 | 0.103 | 0.076 | 0.061 | 0.039 | 0.028 | 0.052 | 0.041 | 0.071 | 0.022 | 0.034 | 0.038 | 0.041 | 0.020 | 0.033 | 0.025 | 0.033 | 0.059 |
| Cities | 2009–2012 | 2013–2015 | 2016–2019 | ||||||
|---|---|---|---|---|---|---|---|---|---|
| Ti | Ei | Si | Ti | Ei | Si | Ti | Ei | Si | |
| Guangzhou | 0.412 | 0.242 | 0.120 | 0.407 | 0.246 | 0.106 | 0.399 | 0.222 | 0.089 |
| Shenzhen | 0.253 | 0.188 | 0.131 | 0.273 | 0.166 | 0.090 | 0.259 | 0.177 | 0.107 |
| Zhuhai | 0.058 | 0.140 | 0.090 | 0.053 | 0.157 | 0.086 | 0.057 | 0.157 | 0.107 |
| Dongguan | 0.076 | 0.102 | 0.071 | 0.074 | 0.084 | 0.061 | 0.071 | 0.085 | 0.060 |
| Foshan | 0.081 | 0.106 | 0.027 | 0.087 | 0.103 | 0.060 | 0.085 | 0.114 | 0.047 |
| Zhongshan | 0.013 | 0.105 | 0.073 | 0.013 | 0.117 | 0.093 | 0.019 | 0.077 | 0.080 |
| Jiangmen | 0.040 | 0.034 | 0.093 | 0.035 | 0.052 | 0.103 | 0.041 | 0.062 | 0.132 |
| Huizhou | 0.040 | 0.071 | 0.150 | 0.044 | 0.064 | 0.198 | 0.059 | 0.071 | 0.173 |
| Zhaoqing | 0.026 | 0.011 | 0.245 | 0.013 | 0.012 | 0.202 | 0.010 | 0.034 | 0.205 |
| 2009–2012 | 2013–2015 | 2016–2019 | 2009–2012 | 2013–2015 | 2016–2019 | ||
|---|---|---|---|---|---|---|---|
| Guangzhou | −23.091 | −23.160 | −24.322 | Zhongshan | 7.590 | 9.202 | 5.961 |
| Shenzhen | −9.305 | −14.509 | −11.715 | Jiangmen | 2.373 | 4.235 | 5.584 |
| Zhuhai | 5.662 | 6.884 | 7.463 | Huizhou | 7.085 | 8.738 | 6.282 |
| Dongguan | 0.993 | −0.192 | 0.149 | Zhaoqing | 10.152 | 9.382 | 11.027 |
| Foshan | −1.460 | −0.580 | −0.430 |
| (Di) | 0.8 < Di ≤ 1 | 0.7 < Di ≤ 0.8 | 0.6 < Di ≤ 0.7 | 0.5 < Di ≤ 0.6 |
| State | Excellent coordination | Intermediate coordination | Primary coordination | Basic coordination |
| (Di) | 0.4 < Di ≤ 0.5 | 0.2 < Di ≤ 0.4 | 0.0 < Di ≤ 0.2 | |
| State | Near dissonance | Moderate dissonance | Extreme dissonance |
Publisher’s Note: MDPI stays neutral with regard to jurisdictional claims in published maps and institutional affiliations. |
© 2022 by the authors. Licensee MDPI, Basel, Switzerland. This article is an open access article distributed under the terms and conditions of the Creative Commons Attribution (CC BY) license (https://creativecommons.org/licenses/by/4.0/).
Share and Cite
Tang, B.; Luo, H. Mismatch and Coupling: A Study on the Synergistic Development of Tourism-Economy-Ecology Systems in the Pearl River Delta. Sustainability 2022, 14, 8518. https://doi.org/10.3390/su14148518
Tang B, Luo H. Mismatch and Coupling: A Study on the Synergistic Development of Tourism-Economy-Ecology Systems in the Pearl River Delta. Sustainability. 2022; 14(14):8518. https://doi.org/10.3390/su14148518
Chicago/Turabian StyleTang, Bo, and Hao Luo. 2022. "Mismatch and Coupling: A Study on the Synergistic Development of Tourism-Economy-Ecology Systems in the Pearl River Delta" Sustainability 14, no. 14: 8518. https://doi.org/10.3390/su14148518
APA StyleTang, B., & Luo, H. (2022). Mismatch and Coupling: A Study on the Synergistic Development of Tourism-Economy-Ecology Systems in the Pearl River Delta. Sustainability, 14(14), 8518. https://doi.org/10.3390/su14148518