Article

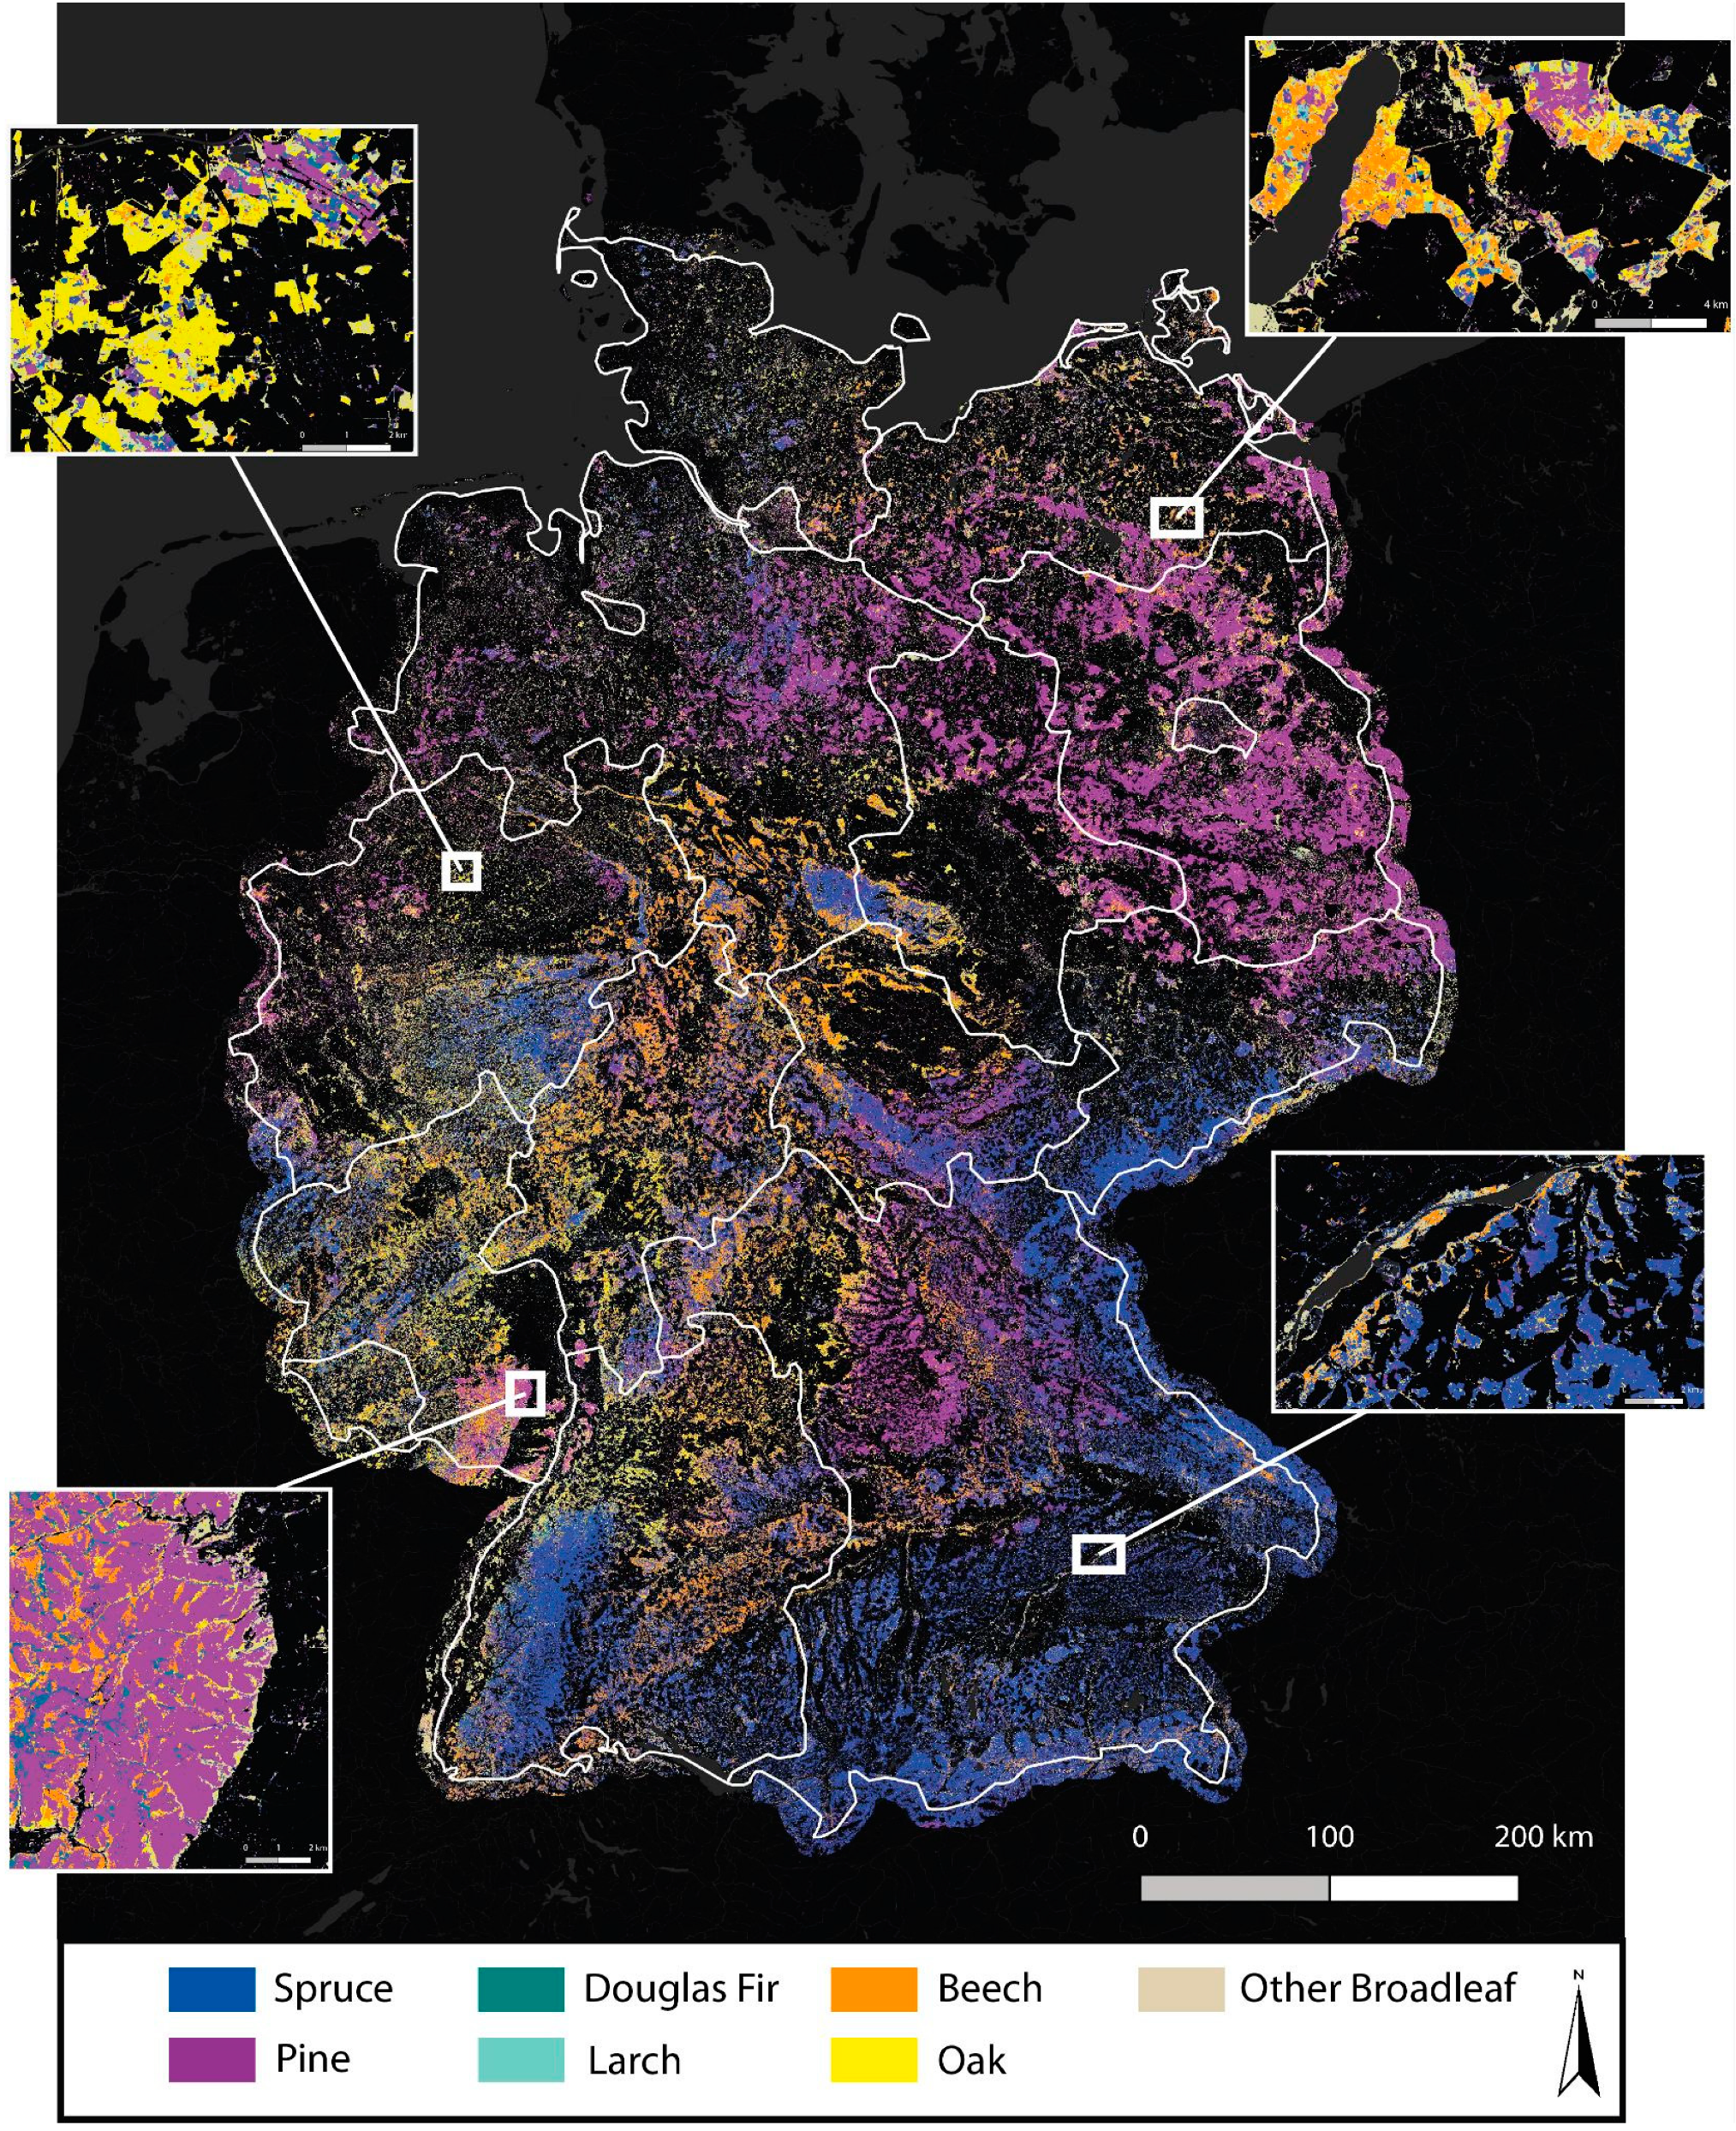
Mapping Dominant Tree Species of German Forests

1
Naturwald Akademie gGmbH, Roeckstr. 40, 23568 Lübeck, Germany
2
Remote Sensing Solutions GmbH, Dingolfinger Str. 9, 81673 München, Germany
*
Author to whom correspondence should be addressed.
Remote Sens. 2022, 14(14), 3330; https://doi.org/10.3390/rs14143330
Submission received: 16 May 2022 / Revised: 24 June 2022 / Accepted: 7 July 2022 / Published: 11 July 2022
(This article belongs to the Section Forest Remote Sensing)

Abstract

:
The knowledge of tree species distribution at a national scale provides benefits for forest management practices and decision making for site-adapted tree species selection. An accurate assignment of tree species in relation to their location allows conclusions about potential resilience or vulnerability to biotic and abiotic factors. Identifying areas at risk helps the long-term strategy of forest conversion towards a natural, diverse, and climate-resilient forest. In the framework of the national forest inventory (NFI) in Germany, data on forest tree species are collected in sample plots, but there is a lack of a full coverage map of the tree species distribution. The NFI data were used to train and test a machine-learning approach that classifies a dense Sentinel-2 time series with the result of a dominant tree species map of German forests with seven main tree species classes. The test of the model’s accuracy for the forest type classification showed a weighted average F1-score for deciduous tree species (Beech, Oak, Larch, and Other Broadleaf) between 0.77 and 0.91 and for non-deciduous tree species (Spruce, Pine, and Douglas fir) between 0.85 and 0.94. Two additional plausibility checks with independent forest stand inventories and statistics from the NFI show conclusive agreement. The results are provided to the public via a web-based interactive map, in order to initiate a broad discussion about the potential and limitations of satellite-supported forest management.

1. Introduction

About one third of Germany is covered with forest and thus ranks among the most forest-rich countries in the European Union [1]. The information about forest characteristics and the forest status is very fragmented in Germany and due to a lack of open access information at a national level, science-based evidence in support of national strategies for sustainable forest management, forest protection, and restoration is still limited. The effect of the three drought years in 2018, 2019, and 2020 had strong negative impacts on German forests [2,3] and revealed the need for more accurate information for better forest management and protection. Especially in the light of climate change, detailed information on different forest types, such as tree species composition, their occurrence, and distribution, is important to adapt forest management practices. Currently, nationwide information such as the distribution of the main tree species are spatially not explicit since they can only be derived on the basis of the sample points from the national forest inventory (NFI), which is conducted every ten years [1,2]. The four main tree species groups Spruce (25.4 percent), Pine (22.3 percent), Beech (15.4 percent), and Oak (10.4 percent) cover together 73.5 percent of the stand area in Germany [4].
As a central pillar of the European Green Deal, the New EU Forest Strategy for 2030 foresees actions for strengthening forest protection and restoration, enhancing sustainable forest management, and improving the monitoring of forests. In regard to forest monitoring, the strategy also makes a legislative proposal for a forest observation, reporting, and data collection framework, which aims at developing an EU-wide forest observation framework to provide open access to detailed, accurate, regular, and timely information on the condition and management of forests [5]. Earth observation is a key technology in this regard since it allows for ecosystem monitoring and mapping over large areas [6,7,8]. Remote sensing-based forest information is produced by the Copernicus land monitoring service (CLMS) with the aim of offering information concerning the environment to all European citizens (Website: https://www.copernicus.eu/en/copernicus-services/land, accessed on 16 May 2022). The service provides various forest-related data such as Corine land cover classification which is divided into three classes (deciduous forest, coniferous forest, and mixed forest) with a spatial resolution of one hectare per pixel [9]. In addition, high-resolution layers including forest cover and dominant leaf type (broadleaved or coniferous) are available with a spatial resolution of 20 m [10]. The Joint Research Center (JRC) offers a European Atlas of Forest Tree Species with a resolution of 1 km2 based on remote sensing data and statistical interpolation approaches [11]. However, all these existing data are either suffering from low spatial detail or from missing information depth which limits the use of these data to inform management and support ecological-assessment decisions at national and subnational scales [11]. Recent studies therefore examined the feasibility of deriving detailed forest information such as forest type, tree species composition, and stand development stages based on high-resolution satellite data and new approaches in machine learning [6,12,13,14,15]. For the German federal state of Rhineland-Palatinate, such an approach resulted in tree species maps comparable with ground-truth-based inventory maps [12,13]. In a study that aimed at first experiences on Sentinel-2-based tree species classifications for an area in Bavaria, seven different deciduous and coniferous tree species were differentiated at 10 m spatial resolution using a supervised random forest classifier [14]. The study confirmed the capabilities to produce reliable tree species maps, although the full potential of Sentinel-2 data, especially the temporal information, was not considered [13,14]. Enhanced classification results could be obtained by using multitemporal Sentinel-2 data to derive tree species [16,17,18,19,20,21,22,23]. In this context, the red-edge and SWIR (short-wave infrared) bands were especially important for capturing the phenological differences between the tree species [16,21]. Comparative results were provided by a study from China, which concluded that freely accessible multispectral remote sensing data have tremendous potential in forest type identification in support of monitoring and management of forest ecological resources at regional or global scales [15]. While these studies demonstrated suitable classification accuracies for tree species, the transfer to larger areas presents a significant challenge mainly due to fragmented or non-available reference data [6,13]. Only a few studies tried to classify larger areas, e.g., at country level. Bjerreskov et al. [18] and Breidenbach et al. [24] aimed at classifying forested areas, forest types, and tree species groups using NFI data at a country scale. Some studies used additional input data such as Sentinel-1, digital terrain models, aerial images, or light detection and ranging (LiDAR) data [18,25,26,27,28]. Another previously limiting factor for a large-scale national characterization of forests via remote sensing has been the large amount of data that need to be processed [6]. This might be one reason for the fact that the majority of previous forest-related remote sensing studies were conducted at a regional scale [29]. With the constellation of the Sentinel satellites and an open data policy, the European Copernicus program is an important driver of digital transformation in ecosystem management. The growing satellite data availability, together with efficient and performant data-processing capacities and automated machine-learning frameworks, make it possible to perform more complex calculations on these data for large-scale applications, which was thought impossible just a decade ago.
The aim of this study was to assess the potential of Sentinel-2 data to derive the dominant tree species for forests in Germany, since no full-coverage, high-resolution, and open access tree species distribution map exists yet. By using Sentinel-2 time series, the dominant tree species were classified by their species-dependent spectral–phenological features, by a machine-learning approach trained through reference data from the NFI. The mapping of the dominant tree species focused on the economically most important tree species in Germany, whereby seven species classes were differentiated. The final dominant tree species map is provided open access via a web-map application to allow interactions with the public and to stimulate cooperation with the science community to further improve the approach in the future.
In the present publication, we present all input data for the classification of the dominant tree species of German forests. We describe how the NFI data were used as reference data to train and test the machine-learning approach and how additional forest stand inventory data from local forestry offices served for validation and for plausibility checks of the final dominant tree species map.

2. Materials and Methods

2.1. Satellite Data

All available Sentinel-2 images covering Germany for an 11-month period (1 March 2017 and 30 November 2017) were used. The year 2017 was chosen because the droughts in 2018, 2019 and 2020 caused anomalies in species-dependent phenology as well as severe forest damages in Germany [30,31] which would deteriorate the classification of tree species if data from more recent years would have been used. In addition, a pre-drought dominant tree species map of 2017 allows for a species-dependent drought impact assessment. The multispectral Sentinel-2 data provide spectral information in the visible, red-edge, near-infrared (NIR), and short-wave infrared (SWIR) part of the electromagnetic spectrum [32]. The ten spectral bands with 10 and 20 m spatial resolution, which provide valuable data for vegetation and forest monitoring, were considered (visible bands 2, 3 and 4; red-edge bands 5, 6 and 7; NIR bands 8 and 8A; as well as the SWIR bands 11 and 12). Level-1C images were acquired and first transformed into corrected bottom-of-atmosphere reflectance data utilizing Sen2Cor [33]. The automated processing chain then resampled the six bands with 20 m spatial resolution to match the four 10 m spatial resolution bands. For each image, the normalized difference vegetation index (NDVI) was calculated and added as an additional band to each 10-band image stack. All images were then grouped per month and per Sentinel-2 tile and monthly composites were generated. Thereby, the composite is created by assessing pixel-by-pixel the maximum NDVI value per month, whereby the pixel reflectance values from the respective image are then assigned into the composite. The result is a 10-band reflectance composite per month (bands listed above) and a maximum NDVI band as band 11. This maximum NDVI-based image composition has the advantage of preferring unclouded pixels in a time series over vegetated areas which minimizes cloud cover. Few remaining clouded areas (pixels in areas that were clouded in all images in a month) were masked afterwards. The resulting nine monthly composites (March to November) were finally stacked per Sentinel-tile, where each image stack had 99 bands (9 times 10 reflectance bands and 9 NDVI bands) that were later used as input variables for the classification model. The complete set of data stacks covering Germany had an approximate total size of 1.6 TB. This spectral time series was used for the classification, as it reflects the species-dependent phenology, which is a main characteristic for differentiating forest tree species using remote sensing data [34,35,36].

2.2. Reference Data from NFI

The availability, quality, timeliness and extent of forest reference data are crucial for the quality of the dominant tree species classification results. In Germany, all federal states are responsible for their forest information assessment, but unfortunately no common data framework exists between the federal states. The only homogenous reference data set is the national forest inventory (NFI). The NFI is a terrestrial random inventory at permanent sample plots that is conducted every ten years (in 2012, the third NFI was completed). A total of 60,000 sample plots are spread over Germany in a representative grid, while the grid size can vary between federal states. At the grid nodes, the sample plots are located. Each sample plot is defined by a square with a side length of 150 m, where at each of the corners the collection of terrain, stand and tree characteristics are recorded [4,37].
The exact locations of the permanent NFI plots are not made public, to preserve sample anonymity. They are spatially flawed and only represented in the INSPIRE 1 km × 1 km grid (https://bwi.info/Download/de/BWI-Basisdaten/_Hinweise_BWI-Basisdaten.pdf, accessed on 16 May 2022). These nonspatial explicit data hinder the use as training and test data for classification of high-resolution satellite data, since no spatial link between the satellite data and the plot information can be established. In this study, to make the data suitable as reference data by keeping the confidentiality of the accurate NFI plot locations, the responsible institution of the NFI, the Institute of Forest Ecosystems of the Thünen-Institute, extracted all pixel values at the accurate NFI plot coordinates from a multitemporal Sentinel-2 image stack that we provided. We then received a table that contains the extracted remotely sensed data linked with the plot attributes. This specific data-sharing agreement essentially provided this study with access to the data with their precise locations without anyone accessing the confidential location information.
The individual tree species in the NFI database were aggregated into main tree species categories, for example common spruce, Omorica spruce, Sitka spruce, Black spruce, and blue Spruce were categorized into spruce trees [37,38]. For selecting the reference data set used for the classification, the number of trees recorded in each plot, the tree species and the stand type were considered. Using the information recorded in each plot, we distinguished between mixed stands and more pure stands, whereas pure stands were here defined by a share of the leading tree species of equal or greater than 80 percent. As soon as other tree species reach a combined share of more than 20 percent, the corresponding stand is defined as a mixed stand [38]. In order to retain the highest representativeness of the reference data for the different tree species and to minimize potential location inaccuracies of the reference data, only the defined pure stands were used as training data. In addition, the density of the stand was considered by using only those plots with a certain tree density, which was defined by a minimum number of trees of the respective tree species equal or greater than 4. Finally, the reference data based on NFI data contain the following attributes: sample plot attribute, number of trees, tree species and number, and stand type.
In a last step, all remaining pure stand samples were investigated in regard to their total sample size, since only those tree species could be considered which have a minimum number of samples required for a robust training and testing of the classification. Figure 1 shows the distribution of samples per tree species, which were considered in this study. The tree species that could be considered were limited through the sample sizes in the reference data, to spruce, pine, douglas fir and larch as conifers and beech, oak and other broadleaf trees as broadleaf species.

2.3. Machine-Learning Model for Classification

The XGBoost python package was used for an efficient implementation of the gradient-boosted trees machine-learning algorithm to classify the Sentinel-2 time series image stacks. XGBoost belongs to a class of ensemble-learning algorithms in which weak models are built sequentially by minimizing errors from previous models using gradient descent. The use of a regularization term reduces overfitting and XGBoost can even naturally handle sparse data, e.g., missing data values, by learning default classification directions in decision trees that are taken in case a feature value is missing. It was shown to perform well on the classification of tabular data in machine-learning competitions and its flexible and efficient implementation that allows it to run on a CPU, a GPU, or on distributed systems has added to its popularity [39]. As the pixel-based classification of satellite imagery can also be viewed as a task that requires the classification of tabular data, XGBoost is being increasingly used in the field of remote sensing. Fields of application include measuring air pollution [40], individual tree biomass estimation [41], forest aboveground-biomass estimation using Landsat 8 and Sentinel-1 data [42,43], hyperspectral image classification [44], land use and land cover classification [45,46], and tree species classification from Sentinel-2 data [47].
In order to train and test the machine-learning model, the tabular NFI reference data were used, which contain the 99 spectral information from the satellite data and the dominant tree species at the sampling locations of the NFI. To account for regional differences in forest ecosystems and thus for different phenologies mainly due to mountainous terrain, four regional models were trained and tested through spatially splitting the reference data. A criterion for each regional model was the presence of sufficient reference data for the different tree types. In each regional model, a hierarchical classification was conducted, whereby non-forest and forest areas were differentiated in the first step. To create this basic forest mask, the High-Resolution Layer (HRL) Forest from the Copernicus land monitoring service was additionally used for generating training data. In the second step, deciduous and non-deciduous forest types were classified within the forest mask and the dominant tree species were classified within the forest type mask in a third step. In each regional model, the reference data from the NFI were split into 70% training and 30% test data. Samples with the same area ID (i.e., taken from the same reference area) might be correlated, so we ensured that these samples were not mixed as training and test data, with the result of having a more independent test data set. In order to account for the different scale of the band reflectance values and the NDVI values, input features were standardized by removing the mean and scaling to unit variance using Scikit-learn’s StandardScaler. The mean and the variance were estimated based on the training data before model training. Furthermore, during model training, an automatic hyperparameter tuning was applied separately for each regional model using Scikit-learn’s implementation of random search with 5-fold cross-validation to evaluate the performance of each model for the specific hyperparameter configurations. In total, 45 configurations were tested, and the best-performing model with regard to a multiclass generalization of the Matthew’s correlation coefficient provided by Scikit-learn was selected. The Matthew’s correlation coefficient (MCC) is widely used, for example, in the field of computational biology, and is considered to perform well as a statistical score even for imbalanced data sets [48,49]. However, there are also authors arguing that the MCC is not a suitable metric for evaluating classifications based on imbalanced data [50]. Since hyperparameter tuning was performed separately for each of the regional models, the tuning process resulted in different hyperparameter values that were used in the final models. For the prediction step, the tuned and trained models were applied to each pixel of the Sentinel-2 stacks for predicting the class probabilities.
Figure 2 summarizes the schematic workflow of the methodology.

2.4. Additional Plausibility Checks

Besides the quantitative validation of the classification via the test data, two additional plausibility checks were conducted by using completely independent data sets. This allowed for an additional assessment of the limitations of the classification approach. First, forest stand inventory data from four different communal forests in Germany were used. Central European forestry is characterized by intensive and small-parcel use of the forest areas. For sustainable forest management, sufficient information is needed which is mainly collected through communal forest stand inventories which are carried out every ten years to record for example the dominant tree species type within the stand. Various information regarding the forest stand area is recorded such as size, location, tree type, age and stock volume. This information is based on individual estimations from forest managers supplemented by measurements at stand level. Hence, the accuracy of forest stand inventory data is subjective since it is dependent on the expertise of the forest manager [51]. For the plausibility check, the dominant tree species information per management unit was used from this data source to compare with the dominant tree species classification.
As a second plausibility check, a comparison between the shares of the dominant tree species as derived from the point-based NFI data with the shares of the classification was carried out. A direct comparison of the areas is not possible, since the NFI sample point data do not allow area calculations. Therefore, a comparison of area percentages (shares) covered by each tree species per federal state was carried out to assess the variation between the classification and the NFI in percentages. In order to statistically test these area differences, two analyses were carried out. First, a correlation analysis, and second, a Mann–Whitney-U-Test was calculated.

3. Results

The final dominant tree species map of Germany is shown in Figure 3. The map reflects the large-scale general pattern of the dominant tree species in Germany, with the spruce dominating mountainous and low mountainous areas, the pine belt in the northeast, and the more broadleaved tree dominating the area in the central and western part of Germany. It also reflects the small-scale pattern, the heterogeneity, and diversity of tree species across short distances, as displayed in the zoomed map examples.
The test of the model accuracy for the forest type classification (deciduous vs. nondeciduous) showed a weighted average F1-score of 0.95. The regional classifications of the deciduous tree species (including beech, oak, other broadleaved trees and larch) showed weighted average F1-scores between 0.77 and 0.91, while the classifications of non-deciduous tree species (spruce, pine and douglas fir) showed weighted average F1-scores between 0.85 and 0.94, depending on the regional model. Table 1 additionally lists species-dependent observed F1-score ranges, which range from reasonable to very good F1-scores. Douglas fir and larch are those species with the lowest F1-scores, while the highest scores were achieved for spruce, beech and pine. The lower F1-scores of the classes larch and douglas fir correspond with the lowest number of available samples in the reference data (Figure 1). The still reasonable F1-scores for these classes suggest that more reference data could support higher classification accuracies.
Besides the assessment of the model precisions via test data that is reflected by the F1-scores, the additional plausibility check of the dominant tree species map, through a comparison with independent forest stand inventory data from forest management plans, shows the spatial representativeness of the classification (Figure 4). A predominantly good agreement was found between the satellite-based classification and the forest stand inventory data. Since the forest stand inventory data represent the dominant tree species per forest management unit, the classification, with a spatial resolution of 10 m, is spatially more detailed and can thus reflect the variability of tree species in each management unit.
However, this comparison also provides insights into inaccuracies of the classification in regard to class confusion. The comparison in the four communal forests for which forest stand inventory data were available in this study, proves the observed F1-scores, since douglas fir and larch are in few cases misclassified as mainly spruce and other broadleaf, respectively. Larches, as deciduous conifers, obviously have spectral–phenological characteristics which are classified by the model as other broadleaved trees.
The results of the second plausibility check to test the classification results are shown in Table 2 and Table 3. The comparison of areas covered by the seven main tree species in the forest area between the NFI and the classification per federal state shows reasonable results. Within the NFI area data, spruce also includes fir for this comparison, since the classification could not distinguish between spruce and fir due to insufficient training data for fir. For example, in Baden-Württemberg, the classification overestimates the share of pine with 1.8 percent whereas for douglas fir, the share is underestimated with 0.4 percent. The variation for spruce is between –1.0 for Thuringia and 12.8 for Bavaria and thus shows a variation in range for various federal states. This comparison shows a slight systematic underrepresentation of douglas fir and larch in the classification, which corresponds with the lower F1-scores and the lowest number of reference samples as reported above.
The correlation analysis showed significant results with very high correlation coefficients for six tree species. Only for the area percentages of larch, no significant correlation was found. The nonparametric Mann–Whitney-U-Test was performed to explore the difference in two independent and not normally distributed data groups. The null hypothesis describes no difference between both groups. The results of the test in Table 4 show p-values greater than the significance level of 0.05. Hence, no statistically significant difference observed between the NFI area information and the classification, except for larch, is calculated. This means that for most tree species, the shares as derived from the classification are comparable with the NFI results.

4. Discussion

The main challenges of large-scale national tree species mapping so far have been the limited availability and quality of tree species reference data for training and testing of classification models as well as the processing of large satellite data volumes [6]. While in 2021 and 2016, Fassnacht et al. [34] and Pu [36] provided a good overview of studies on tree species classification from remotely sensed data, more recent studies showed the potential of mainly Sentinel-2 data for regional tree species classifications [13,14]. For instance, the feasibility study from Zeug et al. [6] showed the high potential of Copernicus data for a determination of the tree species composition in forests, which was demonstrated in several regions in Germany and Austria. They concluded that a nation-wide tree species classification would require denser Sentinel-2 time series and well-distributed reference data, such as the data from the National Forest Inventory. However, these were only of limited use so far, since the NFI data lack area reference and the location accuracy of the public data (inventory points) is not sufficient [6].
For the present study, reference data from the precise locations of the NFI were made available through a data-sharing agreement, which essentially allowed us to use these data for a Germany-wide dominant tree species mapping for the first time. The last NFI in Germany took place in 2011/2012 and the remote-sensing data were from 2017. There might have occurred forest cover changes in this period in some inventory points, although changes in tree species composition are slow and thus no major alteration in the almost-pure stands that were used is to be expected. Cases of complete loss of forest cover were excluded through a hierarchical classification approach, in which forest and non-forest was first differentiated, before deciduous and non-deciduous forest stands and later the dominant tree species were classified. With respect to the accuracy of reference locations, we decided to take only pure stands as reference data and the 10 × 10 m pixel-scale of Sentinel-2, where the geographical coordinates from the NFI inventory sample points fit in. The assumption is that those pixels are definitely referable to the NFI information and that the effect of the inaccurate area reference in the angle-counting sample inventories is neglectable.
Our results show that the NFI data can be used as training and test data and that a Germany-wide classification of seven main tree species is possible. The spectral–phenological information of the dense Sentinel-2 time series proved to be suitable to map tree species accurately over a large area [52]. While some previous regional studies classified some more tree species [6,12,13], only seven classes of main tree species were differentiated in our study, due to limited reference data for pure stands of various tree species. This can be seen as a trade-off between the number of considered species and a very large classification area, for the sake of a harmonized Germany-wide dominant tree species map. If the reference data set can be extended for some species by more pure stands or by even more rare species in the future, for example through additional forest inventory data collected in the federal states, the range of tree species in the classification could be extended. The classification results show plausible tree species distribution patterns, reasonable to very good F1-scores (tree-species-dependent) and a good agreement with completely independent forest inventory data. A comparison of our results with the results from the national mapping in Denmark [18] and Norway [24] show that we could differentiate more tree species, since the study in Norway differentiated three dominant tree species (spruce, pine, and deciduous). Of course, spruce and pine cover more than 70 percent of the forested area in Norway, but a further differentiation of deciduous tree species (such as birch) would be an asset [24]. The study for Denmark considered six dominant tree species (spruce, pine, other conifers, beech, oak and other broadleaves); however, the accuracies differ from our results. Although the study in Denmark [18] included additional data such as Sentinel-1, the classification showed lower accuracies (oak: 34%, beech: 63%, other broadleaves: 59%, spruce: 73%, pine: 73%, and other conifers: 65%).
Other studies reported that the use of a digital elevation model (DEM) in the classification of tree species improved the accuracies for some species [53]. For instance, Grabska et al. [35] found that the DEM improved the accuracy of the classification of Spruce in the mountainous Polish Carpathians, since their natural occurrence is mainly limited to altitudes above 1200 m asl. In Germany, spruce occurrence is not limited to higher altitudes, since it was planted in lowland areas outside of their potential natural occurrence area for decades. However, spruce showed the highest F1-scores in our study and spruce stands could be differentiated by their spectral phenology, supported by a large number of reference samples. The lowest F1-scores were related to low species reference samples, which was also observed in previous studies [35]. In our study for example, fir could not be included in the classification, since the number of pure reference stands in the NFI data were too low. Classification tests including fir with a low number of training data caused confusion, mainly with the class Spruce. In regions where Larch could not be classified due to limited reference samples, Larch often falls into the class Other Broadleaf due to its deciduous character. The additional plausibility checks also indicated areas with higher uncertainties of the classification. These areas are mainly tree stands over surfaces that are not typical forest understories such as artificial or heavily managed understories (e.g., tree stands along streets or inner-urban tree stands). Uncertainties were also found in forest stands in highly variable terrain (that varies in slope and slope orientation at short distances) with a wide diversity of tree species (e.g., Palatinate Forest or the northern part of the Black Forest). For such areas with highly variable terrain, the additional use of aspect and slope as input variables for the classification could improve the accuracy [25].
In this study, only optical satellite data were used for the classification of the dominant tree species, since time series of these data can cover the species-dependent spectral phenology, as already applied in previous studies [13,21,22,23]. Lechner et al. [26] found that the additional use of Sentinel-1 SAR (synthetic aperture radar) data only increased the accuracy of their tree species classification by 0.5% in comparison to the classification that bases on a Sentinel-2 time series. Similar results were even found for the binary classification of tree types (broadleaved vs. coniferous), where the additional use of Sentinel-1 data only yielded minor improvements in accuracy [25]. However, additional SAR data could be integrated to increase the information depth beyond tree species mapping. Since SAR data might not be as suitable for tree species mapping as optical data, it proved to be sensitive to structural forest parameters, since the backscatter is mainly influenced by crown density, leaf moisture, forest volume, age, etc. [34]. SAR data could therefore be used for assessing additional forest characteristics, with a particular potential for assessing the variation within each tree species class. In addition, tree height or forest structure information derived from satellite-based LiDAR (light detection and ranging) could also be integrated to assess forest stand age and to improve large-scale forest stand biomass estimates [13,54]. Future research should therefore focus on hierarchical approaches, where each information level is produced by using the most promising data type that was already proven to be effective, rather than differentiating various forest characteristics such as forest type, tree species and structural parameters at once.
The plausibility check using independent data allowed for additional insights in the spatial representation of the classification, and can initiate discussions on how such satellite-based assessment could support forest inventories for forest management plans, or in opposite, how these forest inventories can be used to generate more precise and locally adjusted classification models. However, it must be noted that forest stand inventories also vary depending on the individual forest manager and are therefore a subjective record. For example, in forest stand descriptions, a stand with 80 percent beech trees and 20 percent other broadleaved trees is defined based on the stock volume of the beech trees rather than on the number of stems. Hence, forest stands with some old big beech with 80 percent of stock volume, trees might have less area covered with beech compared to the 20 per cent of other broadleaved trees. Since satellite images rather cover the area of trees through the view from above, there can be a discrepancy between the forest stand inventory and the satellite-based classification. Hence, in this example, the satellite-based classification would probably classify a forest stand with more other broadleaved trees than beech trees.
In comparison with other national tree species classifications [18,24], our study shows very good results demonstrated by reasonable to very high F1-scores. The additional plausibility checks proved to provide more relevant information about uncertainties beyond the F1-scores. The comparison of area percentages between the NFI point data and the classification per federal state revealed for some tree species and federal states larger deviation, such as for spruce in Bavaria. This might be caused by several factors. On the one hand, the NFI data also have inaccuracies since they rely on point information extrapolated to an area (in this case to the federal state level). On the other hand, our model for Bavaria could not differ between douglas fir, fir and other conifers due to insufficient reference data, which led to more classified spruce stands in Bavaria as compared to NFI. A comparison between state forest inventory in Saarland with NFI data revealed different shares of tree species [55]. Thus, remote sensing-based approaches as presented in this study provide valuable information for the assessment of area information which can complement the sample point inventories.
Most likely, the classification results could be further enhanced in regard to thematic depth (tree species) and accuracies (F1-scores) through additional reference data, but the access, availability, quality and scope of more suitable forest reference data vary between the federal states in Germany. There is not yet a common data policy and the willingness to provide data is diverse among forest administrations and national authorities. In 2021, 141 countries, including Germany, signed the Glasgow Leaders’ Declaration on Forests and Land Use at the COP26 (https://ukcop26.org/glasgow-leaders-declaration-on-forests-and-land-use/, accessed on 16 May 2022). In regard to this declaration, a successful transformation to a better protection and more sustainable management of forests also depends on much-improved access to forest information [56]. Nabuurs et al. [56] highlight the need that governments share the taxpayer-funded NFI data freely, which will permit complementing the decadal forest inventories through satellite-based annual forest assessments. Additionally, in regard to the New EU Forest Strategy for 2030 and the related ‘forest observation, reporting and data collection framework’, an open access data policy is fundamental. An example of such an open data repository is the recently published Tallo database (global tree allometry and crown architecture database), which provides a comprehensive database on tree characteristics, even though just a subset of entries have the required geolocation precision for a direct link with high-resolution satellite data [57]. In addition, we also consider it fundamental that results from research studies on satellite-based forest assessments are made available publicly, beyond scientific publications. Giving access to the results for the interested public, forestry experts, the scientific Earth observation community and governmental authorities can initiate a broader discussion on the potential and limitations of Earth-observation-based forest information. A comparison of results from different studies could ensure that the methodologies can be effectively improved in the future. We therefore provide the dominant tree species map of Germany’s forests via a web-based interactive map that can be accessed by the public and we will incorporate the feedback in regard to the potentials and limitations of this map in our future research.

5. Conclusions

This study presents an approach for the first satellite-based dominant tree species map for Germany. Driven by a time-series of Sentinel-2 data that covers the spectral–phenological characteristics of tree species and sufficient reference data from the NFI, this national map could be generated via a machine-learning-based processing pipeline. The dominant tree species map complements the forest information that is available from the NFI sample plots and extends the available forest information in Germany through a full coverage and spatially explicit data set. Precise knowledge of the occurrence and spatial distribution of tree species is important for assessing their adaptability and resilience due to climate change impacts. However, satellite-based approaches cannot replace forest stand inventories or NFIs, but are rather dependent on these data. This study demonstrates that synergies between Earth observation and forest inventories can add benefit and can support decision making in policy and forestry practice. Open access of forest inventory data from NFIs would further improve the quality of satellite-based maps. However, also open access of satellite-derived information from research, as provided in this study, is fundamental to strengthen the exchange between science, society, practitioners and policy. Such synergies are required to support national and international initiatives such as the EU Forest Strategy for 2030 or the implementation of digital forest monitoring as mentioned in the German coalition agreement for 2021–2025 [58].

Author Contributions

Conceptualization, T.W. and J.F.; methodology, J.F., L.A. and T.W.; software, K.K., S.K. and L.A.; validation, L.A., T.W. and J.F.; formal analysis, L.A.; investigation, L.A., T.W. and J.F.; data curation, S.K.; writing—Original draft preparation, L.A., T.W. and J.F.; writing—Review and editing, L.A., K.K., T.W. and J.F.; visualization, S.K. and L.A.; supervision, J.F.; project administration, T.W. and J.F. All authors have read and agreed to the published version of the manuscript.

Funding

This research received no external funding.

Data Availability Statement

The final dominant tree species map of German forests that has been generated in the framework of this study can be viewed in the interactive web-map application via the following link (German version): www.waldmonitor-deutschland.org, accessed on 29 May 2022).

Acknowledgments

Special thanks go to the Thünen Institute of Forest Ecosystems (Germany) for linking the provided Sentinel-2 time series to the forest inventory plot data of the National Forest Inventory that was used as training and test data in this study.

Conflicts of Interest

The authors declare no conflict of interest.

References

  1. EEA. European Forest Ecosystems: State and Trends; EEA Report No 5/2016; European Environment Agency Publications Office: Luxembourg, 2016. [Google Scholar]
  2. Ergebnisse der Waldzustandserhebung 2020; BMEL: Bonn, Germany, 2021; 72p. Available online: https://www.bmel.de/SharedDocs/Downloads/DE/Broschueren/ergebnisse-waldzustandserhebung-2020.pdf?__blob=publicationFile&v=7 (accessed on 28 April 2022).
  3. Schuldt, B.; Buras, A.; Arend, M.; Vitasse, Y.; Beierkuhnlein, C.; Damm, A.; Gharun, M.; Grams, T.E.E.; Hauck, M.; Hajek, P.; et al. A First Assessment of the Impact of the Extreme 2018 Summer Drought on Central European Forests. Basic Appl. Ecol. 2020, 45, 86–103. [Google Scholar] [CrossRef]
  4. BMEL. The Forests in Germany. Selected Results of the Third National Inventory; BMEL: Berlin, Germany, 2018; 56p. Available online: https://www.bmel.de/SharedDocs/Downloads/EN/Publications/ForestsInGermany-BWI.pdf?__blob=publicationFile&v=4 (accessed on 28 April 2022).
  5. European Commission. Proposal for a Forest Observation, Reporting and Data Collection Framework. Available online: https://ec.europa.eu/info/law/better-regulation/have-your-say/initiatives/13396-EU-forests-new-EU-Framework-for-Forest-Monitoring-and-Strategic-Plans_en (accessed on 28 April 2022).
  6. Zeug, G.; Geltendorf, T.; Immitzer, M.; Atzberger, C. Machbarkeitsstudie zur Nutzung von Satellitenfernerkundung (Copernicus) für Zwecke der Ableitung ökologischer Belastungsgrenzen und der Verifzierung von Indikatoren der Deutschen Anpassungsstrategie an den Klimawandel; Umweltbundesamt: Dessau-Roßlau, Germany, 2018.
  7. Wulder, M.A.; Hall, R.J.; Coops, N.C.; Franklin, S.E. High spatial resolution remotely sensed data for ecosystem characterization. BioScience 2004, 54, 511–521. [Google Scholar] [CrossRef] [Green Version]
  8. Hansen, M.C.; Potapov, P.V.; Moore, R.; Hancher, M.; Turubanova, S.A.; Tyukavina, A.; Thau, D.; Stehman, S.V.; Goetz, S.J.; Loveland, T.R.; et al. High-resolution global maps of 21st-century forest cover change. Science 2013, 342, 850–853. [Google Scholar] [CrossRef] [Green Version]
  9. Pekkarinen, A.; Reithmaier, L.; Strobl, P. Pan-European forest/non-forest mapping with Landsat ETM+ and Corine land cover 2000 data. ISPRS J. Photogramm. Remote Sens. 2009, 64, 171–183. [Google Scholar] [CrossRef]
  10. Copernicus Land Monitoring Service (CLMS). High Resolution Land Cover Characteristics. Tree-Cover/Forest and Change 2015–2018. User Manual. Available online: https://land.copernicus.eu/user-corner/technical-library/forest-2018-user-manual.pdf (accessed on 16 May 2022).
  11. European Commission, Joint Research Centre. European Atlas of Forest Tree Species; Houston Durrant, T., De Rigo, D., Mauri, A., Caudullo, G., San-Miguel-Ayanz, J., Eds.; Publications Office: Luxembourg, 2016. [Google Scholar] [CrossRef]
  12. Nink, S.; Hill, J.; Stoffels, J.; Buddenbaum, H.; Frantz, D.; Langshausen, J. Using Landsat and Sentinel-2 Data for the Generation of Continuously Updated Forest Type Information Layers in a Cross-Border Region. Remote Sens. 2019, 11, 2337. [Google Scholar] [CrossRef] [Green Version]
  13. Stoffels, J.; Hill, J.; Sachtleber, T.; Mader, S.; Buddenbaum, H.; Stern, O.; Langshausen, J.; Dietz, J.; Ontrup, G. Satellite-Based Derivation of High-Resolution Forest Information Layers for Operational Forest Management. Forests 2015, 6, 1982–2013. [Google Scholar] [CrossRef]
  14. Immitzer, M.; Vuolo, F.; Atzberger, C. First Experience with Sentinel-2 Data for Crop and Tree Species Classifications in Central Europe. Remote Sens. 2016, 8, 166. [Google Scholar] [CrossRef]
  15. Liu, Y.; Gong, W.; Hu, X.; Gong, J. Forest Type Identification with Random Forest Using Sentinel-1A, Sentinel-2A, Multi-Temporal Landsat-8 and DEM Data. Remote Sens. 2018, 10, 946. [Google Scholar] [CrossRef] [Green Version]
  16. Persson, M.; Lindberg, E.; Reese, H. Tree Species Classification with Multi-Temporal Sentinel-2 Data. Remote Sens. 2018, 10, 1794. [Google Scholar] [CrossRef] [Green Version]
  17. Axelsson, A.; Lindberg, E.; Reese, H.; Olsson, H. Tree species classification using Sentinel-2 imagery and Bayesian inference. Int. J. Appl. Earth Obs. Geoinf. 2021, 100, 102318. [Google Scholar] [CrossRef]
  18. Bjerreskov, K.S.; Nord-Larsen, T.; Fensholt, R. Classification of Nemoral Forests with Fusion of Multi-Temporal Sentinel-1 and 2 Data. Remote Sens. 2021, 13, 950. [Google Scholar] [CrossRef]
  19. Kollert, A.; Bremer, M.; Löw, M.; Rutzinger, M. Exploring the potential of land surface phenology and seasonal cloud free composites of one year of Sentinel-2 imagery for tree species mapping in a mountainous region. Int. J. Appl. Earth Obs. Geoinf. 2021, 94, 102208. [Google Scholar] [CrossRef]
  20. Lim, J.; Kim, K.-M.; Kim, E.-H.; Jin, R. Machine Learning for Tree Species Classification Using Sentinel-2 Spectral Information, Crown Texture, and Environmental Variables. Remote Sens. 2020, 12, 2049. [Google Scholar] [CrossRef]
  21. Immitzer, M.; Neuwirth, M.; Böck, S.; Brenner, H.; Vuolo, F.; Atzberger, C. Optimal Input Features for Tree Species Classification in Central Europe Based on Multi-Temporal Sentinel-2 Data. Remote Sens. 2019, 11, 2599. [Google Scholar] [CrossRef] [Green Version]
  22. Grabska, E.; Hostert, P.; Pflugmacher, D.; Ostapowicz, K. Forest Stand Species Mapping Using the Sentinel-2 Time Series. Remote Sens. 2019, 11, 1197. [Google Scholar] [CrossRef] [Green Version]
  23. Hemmerling, J.; Pflugmacher, D.; Hostert, P. Mapping temperate forest tree species using dense Sentinel-2 time series. Remote Sens. Environ. 2021, 276, 112743. [Google Scholar] [CrossRef]
  24. Breidenbach, J.; Waser, L.T.; Debella-Gilo, M.; Schumacher, J.; Rahlf, J.; Hauglin, M.; Puliti, S.; Astrup, R. National mapping and estimation of forest area by dominant tree species using Sentinel-2 data. Can. J. For. Res. 2021, 51, 365–379. [Google Scholar] [CrossRef]
  25. Waser, L.T.; Rüetschi, M.; Psomas, A.; Small, D.; Rehush, N. Mapping dominant leaf type based on combined Sentinel-1/-2 data—Challenges for mountainous countries. ISPRS J. Photogramm. Remote Sens. 2021, 180, 209–226. [Google Scholar] [CrossRef]
  26. Lechner, M.; Dostálová, A.; Hollaus, M.; Atzberger, C.; Immitzer, M. Combination of Sentinel-1 and Sentinel-2 Data for Tree Species Classification in a Central European Biosphere Reserve. Remote Sens. 2022, 14, 2687. [Google Scholar] [CrossRef]
  27. Ma, M.; Liu, J.; Liu, M.; Zeng, J.; Li, Y. Tree Species Classification Based on Sentinel-2 Imagery and Random Forest Classifier in the Eastern Regions of the Qilian Mountains. Forests 2021, 12, 1736. [Google Scholar] [CrossRef]
  28. Wan, H.; Tang, Y.; Jing, L.; Li, H.; Qiu, F.; Wu, W. Tree Species Classification of Forest Stands Using Multisource Remote Sensing Data. Remote Sens. 2021, 13, 144. [Google Scholar] [CrossRef]
  29. Holzwarth, S.; Thonfeld, F.; Abdullahi, S.; Asam, S.; Da Ponte Canova, E.; Gessner, U.; Huth, J.; Kraus, T.; Leutner, B.; Kuenzer, C. Earth Observation Based Monitoring of Forests in Germany: A Review. Remote Sens. 2020, 12, 3570. [Google Scholar] [CrossRef]
  30. Thonfeld, F.; Gessner, U.; Holzwarth, S.; Kriese, J.; da Ponte, E.; Huth, J.; Kuenzer, C. A First Assessment of Canopy Cover Loss in Germany’s Forests after the 2018–2020 Drought Years. Remote Sens. 2022, 14, 562. [Google Scholar] [CrossRef]
  31. Buras, A.; Rammig, A.; Zang, C.S. Quantifying Impacts of the 2018 Drought on European Ecosystems in Comparison to 2003. Biogeosciences 2020, 17, 1655–1672. [Google Scholar] [CrossRef] [Green Version]
  32. European Space Agency (ESA). Sentinel-2 User Handbook; ESA Standard Document; ESA: Paris, France, 2015; 64p. [Google Scholar]
  33. Main-Knorn, M.; Pflug, B.; Louis, J.; Debaecker, V.; Müller-Wilm, U.; Gascon, F. Sen2Cor for Sentinel-2. In Proceedings of the Image and Signal Processing for Remote Sensing XXIII, Warsaw, Poland, 11–13 September 2017; p. 10427. [Google Scholar]
  34. Fassnacht, F.E.; Latifi, H.; Stereńczak, K.; Modzelewska, A.; Lefsky, M.; Waser, L.T.; Straub, C.; Ghosh, A. Review of studies on tree species classification from remotely sensed data. Remote Sens. Environ. 2016, 186, 64–87. [Google Scholar] [CrossRef]
  35. Grabska, E.; Frantz, D.; Ostapowicz, K. Evaluation of machine learning algorithms for forest stand species mapping using Sentinel-2 imagery and environmental data in the Polish Carpathians. Remote Sens. Environ. 2020, 251, 112103. [Google Scholar] [CrossRef]
  36. Pu, R. Mapping Tree Species Using Advanced Remote Sensing Technologies: A State-of-the-Art Review and Perspective. J. Remote Sens. 2021, 2021, 9812624. [Google Scholar] [CrossRef]
  37. Riedel, T.; Hennig, P.; Kroiher, F.; Polley, H.; Schmitz, F.; Schwitzgebel, F. Die dritte Bundesaldinventur (BWI 2012). Inventur- und Auswertemethoden; Eberswalde; Thünen-Institut für Waldökosysteme: Eberswalde, Germany, 2017; p. 124.
  38. Welle, T.; Sturm, K.; Bohr, Y. Der Alternative Waldzustandsbericht 2018; Naturwald Akademie: Lübeck, Germany, 2018; p. 263. Available online: https://naturwald-akademie.org/wp-content/uploads/2020/06/Alternativer-Waldzustandsbericht_Stand_24_04_2018_1.pdf (accessed on 16 May 2022).
  39. Chen, T.; Guestrin, C. XGBoost: A Scalable Tree Boosting System. In Proceedings of the 22nd ACM SIGKDD International Conference on Knowledge Discovery and Data Mining, New York, NY, USA, 13–17 August 2016; pp. 785–794. [Google Scholar]
  40. Zamani Joharestani, M.; Cao, C.; Ni, X.; Bashir, B.; Talebiesfandarani, S. PM2.5 Prediction Based on Random Forest, XGBoost, and Deep Learning Using Multisource Remote Sensing Data. Atmosphere 2019, 10, 373. [Google Scholar] [CrossRef] [Green Version]
  41. Zhao, Y.; Ma, Y.; Quackenbush, L.J.; Zhen, Z. Estimation of Individual Tree Biomass in Natural Secondary Forests Based on ALS Data and WorldView-3 Imagery. Remote Sens. 2022, 14, 271. [Google Scholar] [CrossRef]
  42. Li, Y.; Li, C.; Li, M.; Liu, Z. Influence of Variable Selection and Forest Type on Forest Aboveground Biomass Estimation Using Machine Learning Algorithms. Forests 2019, 10, 1073. [Google Scholar] [CrossRef] [Green Version]
  43. Li, Y.; Li, M.; Li, C.; Liu, Z. Forest aboveground biomass estimation using Landsat 8 and Sentinel-1A data with machine learning algorithms. Sci. Rep. 2020, 10, 9952. [Google Scholar] [CrossRef] [PubMed]
  44. Samat, A.; Li, E.; Wang, W.; Liu, S.; Lin, C.; Abuduwaili, J. Meta-XGBoost for Hyperspectral Image Classification Using Extended MSER-Guided Morphological Profiles. Remote Sens. 2020, 12, 1973. [Google Scholar] [CrossRef]
  45. Rousset, G.; Despinoy, M.; Schindler, K.; Mangeas, M. Assessment of Deep Learning Techniques for Land Use Land Cover Classification in Southern New Caledonia. Remote Sens. 2021, 13, 2257. [Google Scholar] [CrossRef]
  46. Park, J.; Lee, Y.; Lee, J. Assessment of Machine Learning Algorithms for Land Cover Classification Using Remotely Sensed Data. Sens. Mater. 2021, 33, 3885–3902. [Google Scholar] [CrossRef]
  47. Łoś, H.; Sousa Mendes, G.; Cordeiro, D.; Grosso, N.; Costa, H.; Benevides, P.; Caetano, M. Evaluation of Xgboost and Lgbm Performance in Tree Species Classification with Sentinel-2 Data. In Proceedings of the 2021 IEEE International Geoscience and Remote Sensing Symposium IGARSS, Brussels, Belgium, 11–16 July 2021; pp. 5803–5806. [Google Scholar] [CrossRef]
  48. Chicco, D. Ten quick tips for machine learning in computational biology. BioData Min. 2017, 10, 35. [Google Scholar] [CrossRef] [PubMed]
  49. Boughorbel, S.; Jarray, F.; El-Anbari, M. Optimal classifier for imbalanced data using Matthews Correlation Coefficient metric. PLoS ONE 2017, 12, e0177678. [Google Scholar] [CrossRef]
  50. Qiuming, Z. On the performance of Matthews correlation coefficient (MCC) for imbalanced dataset. Pattern Recognit. Lett. 2020, 136, 71–80. [Google Scholar] [CrossRef]
  51. Kurth, H. Forsteinrichtung. Nachhaltige Regelung des Waldes; Deutscher Landwirtschaftsverlag: Berlin, Germany, 1994; p. 592. [Google Scholar]
  52. Xi, Y.; Ren, C.; Tian, Q.; Ren, Y.; Dong, X.; Zhang, Z. Exploitation of Time Series Sentinel-2 Data and Different Machine Learning Algorithms for Detailed Tree Species Classification. IEEE J. Sel. Top. Appl. Earth Obs. Remote Sens. 2021, 14, 7589–7603. [Google Scholar] [CrossRef]
  53. Hościło, A.; Lewandowska, A. Mapping Forest Type and Tree Species on a Regional Scale Using Multi-Temporal Sentinel-2 Data. Remote Sens. 2019, 11, 929. [Google Scholar] [CrossRef] [Green Version]
  54. Potapov, P.; Li, X.; Hernandez-Serna, A.; Tyukavina, A.; Hansen, M.C.; Kommareddy, A.; Pickens, A.; Turubanova, S.; Tang, H.; Silva, C.E.; et al. Mapping and monitoring global forest canopy height through integration of GEDI and Landsat data. Remote Sens. Environ. 2021, 253, 112165. [Google Scholar] [CrossRef]
  55. SaarForst Landesbetrieb. Staatswaldinventur des Saarlandes 2018. Ein Faktencheck. 2018. Available online: https://www.saarland.de/saarforst/DE/service/publikationen/publikationen/publ_staatswaldinventur.pdf?__blob=publicationFile&v=1 (accessed on 16 May 2022).
  56. Nabuurs, G.J.; Harris, N.; Sheil, D.; Palahi, M.; Chirici, G.; Boissière, M.; Fay, C.; Reiche, J.; Valbuena, R. Glasgow forest declaration needs new modes of data ownership. Nat. Clim. Chang. 2022, 12, 415–417. [Google Scholar] [CrossRef]
  57. Jucker, T.; Fischer, F.; Chave, J.; Coomes, D.; Caspersen, J.; Ali, A.; Loubota Panzou, G.J.; Feldpausch, T.; Falster, D.; Usoltsev, V.; et al. Tallo Database (1.0.0). Zenodo 2022. Available online: https://zenodo.org/record/6637599 (accessed on 13 June 2022). [CrossRef]
  58. Mehr Fortschritt wagen. Bündnis für Freiheit, Gerechtigkeit und Nachhaltigkeit. Koalitionsvertrag zwischen SPD, Bündnis 90/Die Grünen und FDP. Berlin, SPD, Die Grünen, FDP. 2022. p. 144. Available online: https://www.spd.de/fileadmin/Dokumente/Koalitionsvertrag/Koalitionsvertrag_2021-2025.pdf (accessed on 28 April 2022).
Figure 1. Graph showing the number of spectral–phenological reference data from defined pure stands as derived from the NFI data used in this study. Colors represent the colors of the final dominant tree species map.
Remotesensing 14 03330 g001
Figure 2. Schematic representation of the workflow.
Remotesensing 14 03330 g002
Figure 3. Dominant tree species map of Germany for the year 2017.
Remotesensing 14 03330 g003
Figure 4. Dominant tree species classification (A1,B1) compared to the dominant tree species per forest management unit as recorded by the forest inventories of the forest management plans (A2,B2).
Remotesensing 14 03330 g004
Table 1. F1-score ranges for the different tree species classifications from region-dependent models.
Dominant Tree SpeciesF1-Score Range
Pine0.79–0.92
Spruce0.88–0.96
Douglas fir0.69–0.74
Larch0.75
Beech0.83–0.87
Oak0.76–0.78
Other broadleaf0.60–0.80
Table 2. Percentage of area covered by each tree species in the forest area per federal state. Comparison of NFI data and the classification (DTS). Diff shows the difference in percentages for coniferous trees.
Dominant Tree SpeciesPineSpruceDouglas FirLarch
Federal StateNFIDTSDiffNFIDTSDiffNFIDTSDiffNFIDTSDiff
Baden-Wurttemberg5.87.61.841.446.75.33.32.9−0.41.70.0−1.7
Bavaria16.817.30.543.256.012.80.80.0−0.82.10.0−2.1
Brandenburg and Berlin70.172.42.31.83.21.41.00.2−0.81.20.8−0.4
Hessen9.38.4−0.921.828.36.53.61.8−1.84.60.3−4.3
Mecklenburg Western Pomerania36.738.51.87.78.50.91.40.5−0.93.11.0−2.1
Lower Saxony28.633.54.916.818.82.02.41.1−1.34.70.9−3.7
Northrhine-Westphalia6.711.64.929.530.00.51.71.0−0.73.31.1−2.2
Rhineland Palatinate9.99.5−0.420.226.96.86.45.5−0.92.40.1−2.3
Saarland5.12.4−2.712.422.710.33.75.21.52.50.0−2.5
Saxony28.227.9−0.334.544.710.20.20.1−0.13.40.5−2.9
Saxony-Anhalt42.648.05.49.912.32.40.50.3−0.22.40.9−1.5
Schleswig-Holstein7.712.95.217.417.90.52.01.4−0.67.40.8−6.6
Thruringia14.123.39.238.537.5−1.00.40.1−0.33.20.2−3.0
Hamburg and Bremen10.626.515.92.210.78.50.90.5−0.42.41.2−1.2
Table 3. Percentage of area covered by each tree species in the forest area per federal state. Comparison of NFI data and the classification (DTS). Diff shows the difference in percentages for deciduous trees.
Dominant Tree SpeciesBeechOakOther Broadleaf
Federal StateNFIDTSDiffNFIDTSDiffNFIDTSDiff
Baden-Wurttemberg21.519.0−2.57.58.51.017.115.3−1.9
Bavaria13.613.3−0.36.63.6−3.014.79.8−4.9
Brandenburg and Berlin3.33.0−0.36.64.6−2.014.615.81.2
Hesse30.131.91.813.214.21.014.215.21.0
Mecklenburg Western Pomerania12.312.20.19.46.6−2.827.232.65.4
Lower Saxony13.513.0−0.512.39.8−2.519.122.83.7
Northrhine-Westphalia18.316.7−1.616.016.30.320.723.32.6
Rhineland Palatinate21.823.31.520.218.0−2.216.816.6−0.2
Saarland19.822.93.119.816.7−3.134.430.1−4.3
Saxony4.24.50.38.65.5−3.118.716.8−1.9
Saxony-Anhalt6.79.32.612.38.5−3.821.220.7−0.5
Schleswig-Holstein19.312.2−7.015.816.40.628.938.49.5
Thuringia19.821.51.76.87.91.115.59.5−5.9
Hamburg and Bremen11.22.8−8.418.911.5−7.444.446.82.5
Table 4. Results of the Mann–Whitney-U-Test for percentage of area covered by each main tree species.
PineSpruceDouglas FirLarchBeechOakOther Broadleaf
Pearson’s correlation0.9680.9610.9150.2050.9180.8820.932
p-Value0.0000.0000.0000.4810.0000.0000.000
Mann–Whitney-U84.0079.0068.000.0090.0077.0098.00
Z−0.643−0.873−1.378−4.503−09.368−0.9650.00
p-Value0.5410.4010.1780.000.7340.3521.00
Publisher’s Note: MDPI stays neutral with regard to jurisdictional claims in published maps and institutional affiliations.

