Review

Satellite Altimetry: Achievements and Future Trends by a Scientometrics Analysis

1
First Institute of Oceanography, Ministry of Natural Resources, Qingdao 266061, China
2
Key Laboratory of Marine Environmental Survey Technology and Application, Ministry of Natural Resource, Guangzhou 510300, China
3
Institute of Oceanology, Chinese Academy of Sciences, Qingdao 266071, China
4
Qingdao National Laboratory for Marine Science and Technology, Qingdao 266373, China
5
University of Chinese Academy of Sciences, Beijing 100864, China
6
Key Laboratory of Marine Science and Numerical Modeling, Minsitry of Natural Resources, Qingdao 266061, China
7
Naval Research Academy, Tianjin 300061, China
8
State Key Laboratory of Geo-Information Engineering, Xi’an 710054, China
9
Geodesy and Geomatics Engineering Lab, Technical University of Crete, GR-73100 Chania, Greece
10
National Satellite Ocean Application Service, Beijing 100081, China
*
Author to whom correspondence should be addressed.
Remote Sens. 2022, 14(14), 3332; https://doi.org/10.3390/rs14143332
Submission received: 24 May 2022 / Revised: 30 June 2022 / Accepted: 5 July 2022 / Published: 11 July 2022
(This article belongs to the Special Issue Advances in Satellite Altimetry)

Abstract

:
Scientometric reviews, facilitated by computational and visual analytical approaches, allow researchers to gain a thorough understanding of research trends and areas of concentration from a large number of publications. With the fast development of satellite altimetry, which has been effectively applied to a wide range of research topics, it is timely to summarize the scientific achievements of the previous 50 years and identify future trends in this field. A comprehensive overview of satellite altimetry was presented using a total of 8541 publications from the Web of Science Core Collection covering the years from 1970 to 2021. We begin by presenting the fundamental statistical results of the publications, such as the annual number of papers, study categories, countries/regions, afflictions, journals, authors, and keywords, in order to provide a comprehensive picture of satellite altimetry research. We discuss the co-occurrence of the authors in order to reveal the global collaboration network of satellite altimetry research. Finally, we utilised co-citation networks to detect the development trend and associated crucial publications for various specific topics. The findings show that satellite altimetry research has been changed immensely during the last half-century. The United States, France, China, England, and Germany made the most significant contributions in the field of satellite altimetry. The analysis reveals a clear link between technology advancements and the trend in satellite altimetry research. As a result, wide swath altimetry, GNSS-reflectometry, laser altimetry, terrestrial hydrology, and deep learning are among the most frontier study subjects. The findings of this work could guide a thorough understanding of satellite altimetry’s overall development and research front.

Graphical Abstract

1. Introduction

In the 1960s, the idea of using a radar altimeter on a spacecraft to detect sea surface height was proposed [1]. The theoretical idea of observing heights from a satellite was then successfully demonstrated by several missions launched in the 1970s, including the Skylab-3 in 1973, the GEOS-3 in 1975, and the Seasat in 1978 [2,3]. The real upsurge of satellite altimetry came after the launch of TOPEX/Poseidon (T/P) in the 1990s, as a result of the proven capability of such observations and their increasing accuracy [4].
Until now, a number of satellite radar altimeters have been successfully launched and operated by various international agencies with the support of, primarily, the United States, the European Union, China, Japan, and India. As shown in Figure 1, the past and current satellite altimeters, including the ESA-1/2, Envisat, Sentinel-3A/B, Jason-1/2/3, Sentinel-6, HY-2A/B/C/D, SARAL/AltiKa, CryoSat-2, and ICESat/ICESat-2, have offered a homogeneous, high-precision, and long time series of Earth observations, particularly over the ocean [5,6,7,8,9]. The nearly 30 years of high-quality satellite altimetry data have greatly promoted the development of marine geodesy and oceanography to chart the statics and dynamics of the ocean from space [10,11,12]. Numerous studies have also been expanded to include other scientific fields, such as continental hydrology, the cryosphere, land topography, forest, soil, and even marine organisms and anthropology [3,13,14], demonstrating that satellite altimetry is of a wider scientific interest.
Reviewing the previous scientific findings is one of the most important tasks, and essential in leading us to new directions of research in altimetry. However, describing all progress made in a comprehensive way over the past and long years is a difficult task, as it covers many different scientific and engineering fields. The earlier reviews on satellite altimetry were the pioneering works by Wunsch and Stammer [15] and Fu [16], which focused on marine geodesy and ocean circulation with Seasat and GEOS-3. Then, several review papers covered specific topics of satellite altimetry, such as sea surface wind [17], geophysical altimetry [18,19], ocean circulation [20], bathymetry [21,22], ice sheet [23], land water [24,25], eddy [26,27], sea level change [28,29,30,31,32], land soil moisture [33], the troposphere [34], and the Arctic [35]. In 2019, Fu et al. provided a comprehensive analysis of ocean satellite remote sensing in the last 50 years, with a focus on satellite altimetry [2]. The most recent review paper, finished by more than 300 co-authors, summarized the recent 25 years of progress in satellite altimetry and identified critical key challenges for future missions [36].
With the rapidly increasing number of published papers on satellite altimetry in a wide range of disciplines, keeping track of everything is becoming impractical. Furthermore, typical review articles may focus on specialized disciplines, and it is difficult to avoid personal subjectivity, which may preclude a thorough evaluation of valuable satellite altimetry knowledge. As a result, it is especially important to review the research progress in satellite altimetry using the published documents as much as possible based on scientific methodologies, such as the scientometrics. Scientometrics is a new scientific field based on a set of statistical methods. It quantitatively analyzes big scientific data, tracks their evolution over time, and determines the knowledge gained and its boundary [37,38]. As a result of the tremendous development on computational, visual analytic approaches, and big data evaluations, scientometrics, with the assistance of science mapping, has also been significantly developed [38]. At present, the graphical representation of bibliometric maps can be achieved by software such as CiteSpace [39], VOSviewer [40], and the Bibliometrix R-tool [41]. Although these quantitative techniques were initially developed by informetrics people, they are now widely used in various scientific domains, including remote sensing [42]. Some review articles, for instance, have employed bibliometric analytic approaches for detecting research advancements and directions on Google Earth Engine, remote sensing for grassland and agriculture, oil spill and phytoplankton blooms detection, coral reefs and soil monitoring, carbon emissions, ocean big data and marine protection, climate change, as well as human health [43,44,45,46,47,48,49,50,51,52,53,54,55,56,57,58,59,60,61,62,63,64,65,66].
These scientometric tools have greatly advanced our understanding of the past, present, and future of certain scientific topics. However, no attempt has been made thus far to analyze satellite altimetry using a scientometric analysis. Using a scientometric method, we plan to provide a “grand picture” of satellite altimetry based on meta-data in Web of Science (WoS) from 1970 to 2021. The purpose of this study is to: (1) reveal the global literature characteristics, such as the number variation for publication years, countries/regions, affiliations, etc.; (2) provide an accurate overview of research topic evolution over time; (3) reveal the inner connections of literature and authors by visualizing and analyzing citation networks of scientific publications; and (4) trace the intellectual roots and popular research frontiers. We hope that this work will provide a comprehensive overview of the intellectual landscape of satellite altimetry during the past 50 years, aid new researchers in their pursuit of study in this field, and assist experienced and active researchers in keeping their knowledge of the field up to date.

2. Data and Methods

Before conducting this scientometric analysis, it is necessary to collect trustworthy publication data. Consequently, we can determine the structure, relationships, and emerging trends of the satellite altimetry literature. In addition, advanced methods for analyzing meta-data and creating a map of scientific knowledge are required.

2.1. Wos Data

WoS provides access to many databases, including complete citation data for numerous academic subjects. In this study, data were retrieved from the WoS Core Collection. Because it contains the most widely used databases, such as the Science Citation Index Expanded (SCIE) and the Conference Proceedings Citation Index—Science (CPCI-S). Each article’s cited references have also been indexed in order to facilitate the co-citation analysis. Specifically, WoS gives a preliminary analysis of the literature, including publication counts, research categories, countries/regions, citation counts, etc.
We built the satellite altimetry dataset using a topic search for “satellite altimet*,” which returned results for “satellite altimeter” and “satellite altimery” by searching the article title, abstract, keywords, and keywords plus. The findings indicated that the first scientific journal article on satellite altimetry was published in 1970. Thus, the retrieval period was set to “1970–2021” to obtain as many relevant papers as feasible. The WoS Core Collection topic search returns 8514 publications, including 7223 SCI-E indexed journal papers, 1378 CPCI-S indexed conference papers, and a small number of other indexed papers (i.e., Book Citation Index—Science). All WoS records include the metadata of author, keyword, title, publication year, country/region, source document, abstract, and cited references. The essential details are listed in Table 1.

2.2. Review Methods

CiteSpace, VOSviewer, and Bibliometrix were used in this work to analyze and visualize the WoS data set on satellite altimetry [38,40,41,42,67]. These tools are qualified to give powerful basic statistics of the literature’s features, cluster analysis, and extensive social network reasoning. They are able to be used to track the primary thematic concentrations as well as the connections between diverse clusters within the scientific field of satellite altimetry. Furthermore, the use of Structural Variation Analysis (SVA) could also help us identify hotspot research topics throughout time and uncover new publications with transformational potentials that have just been published [67].

3. Review Results

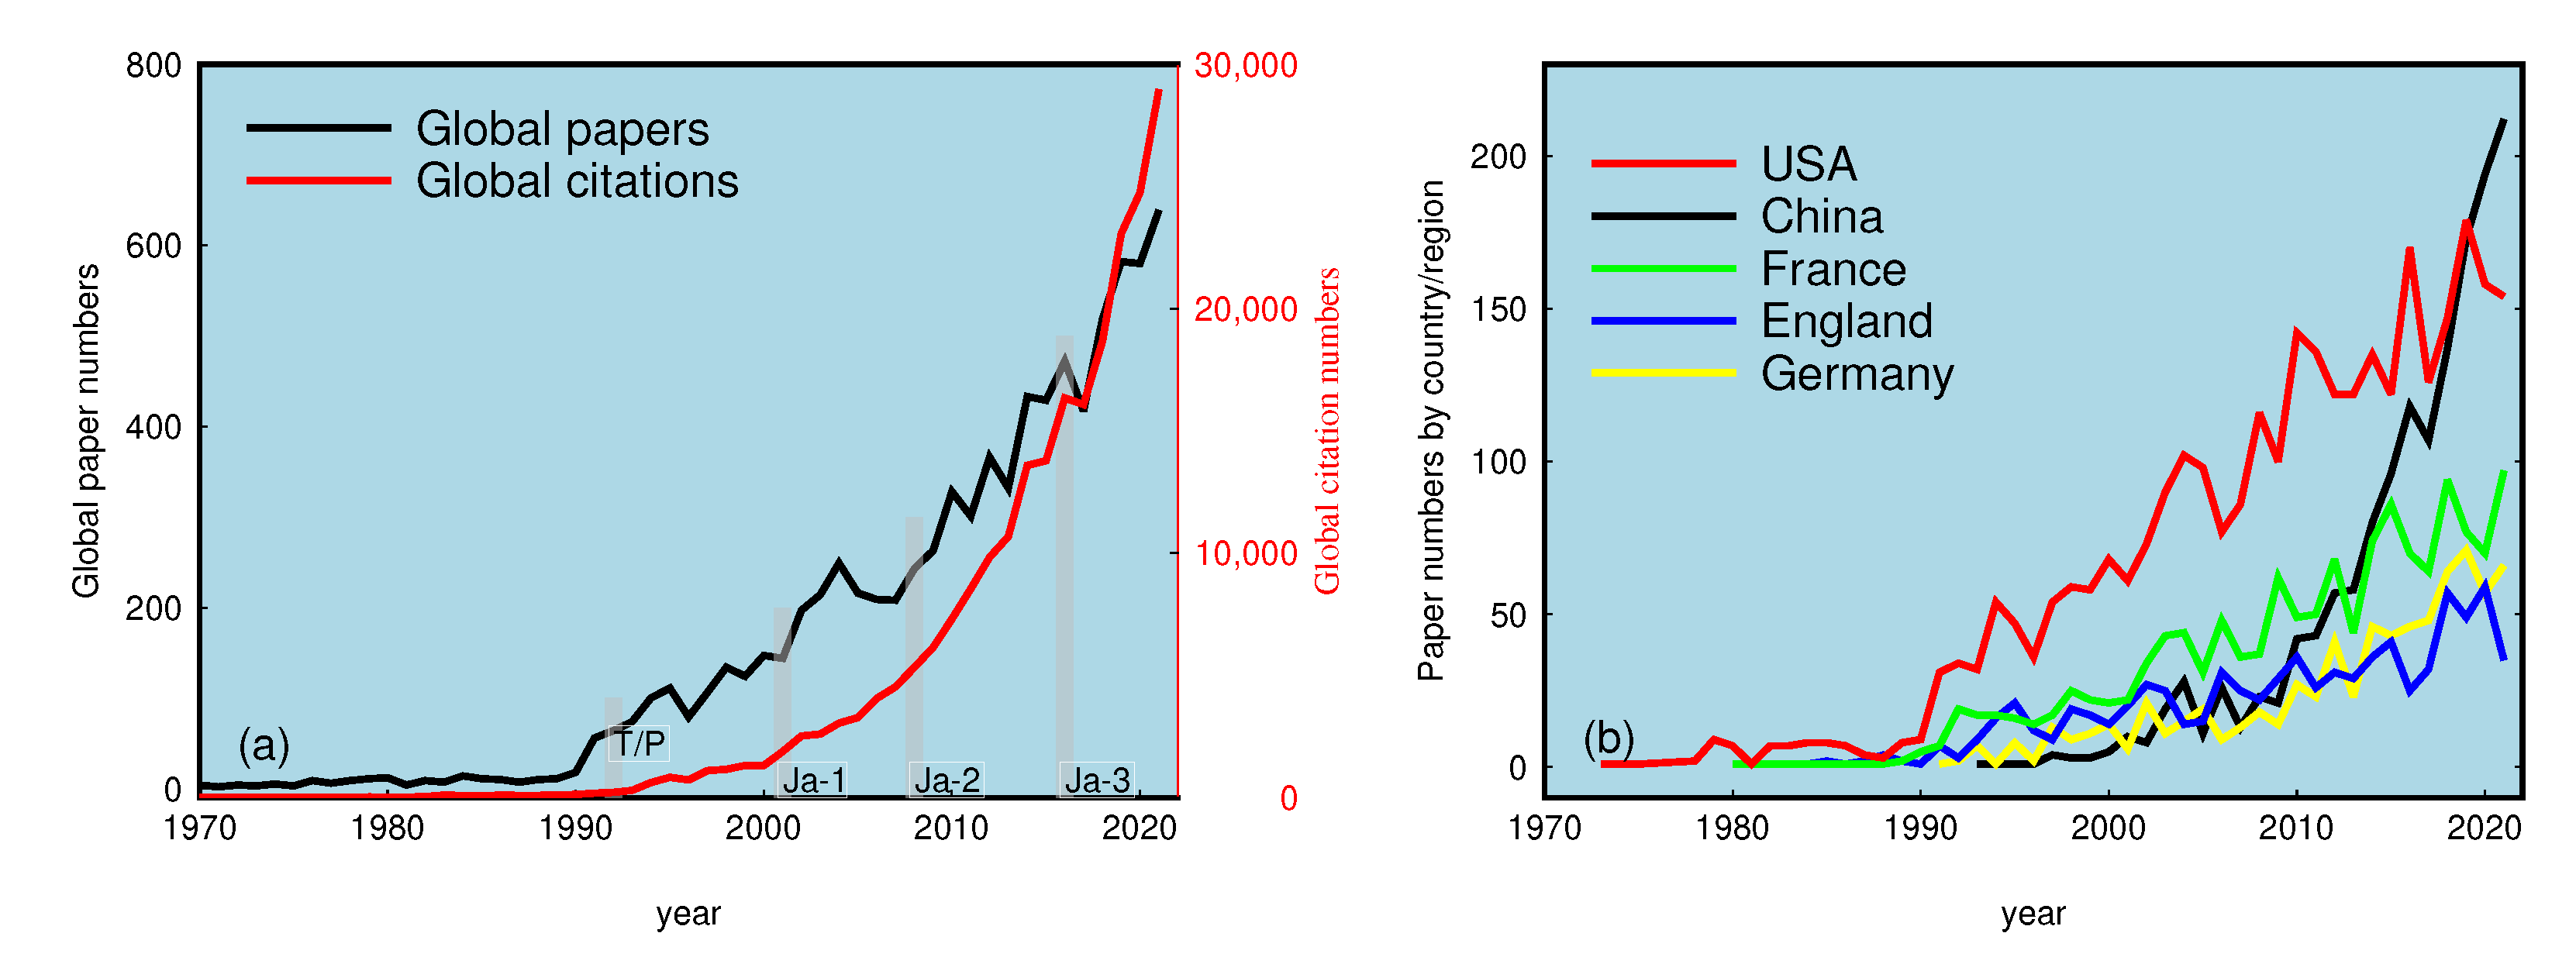
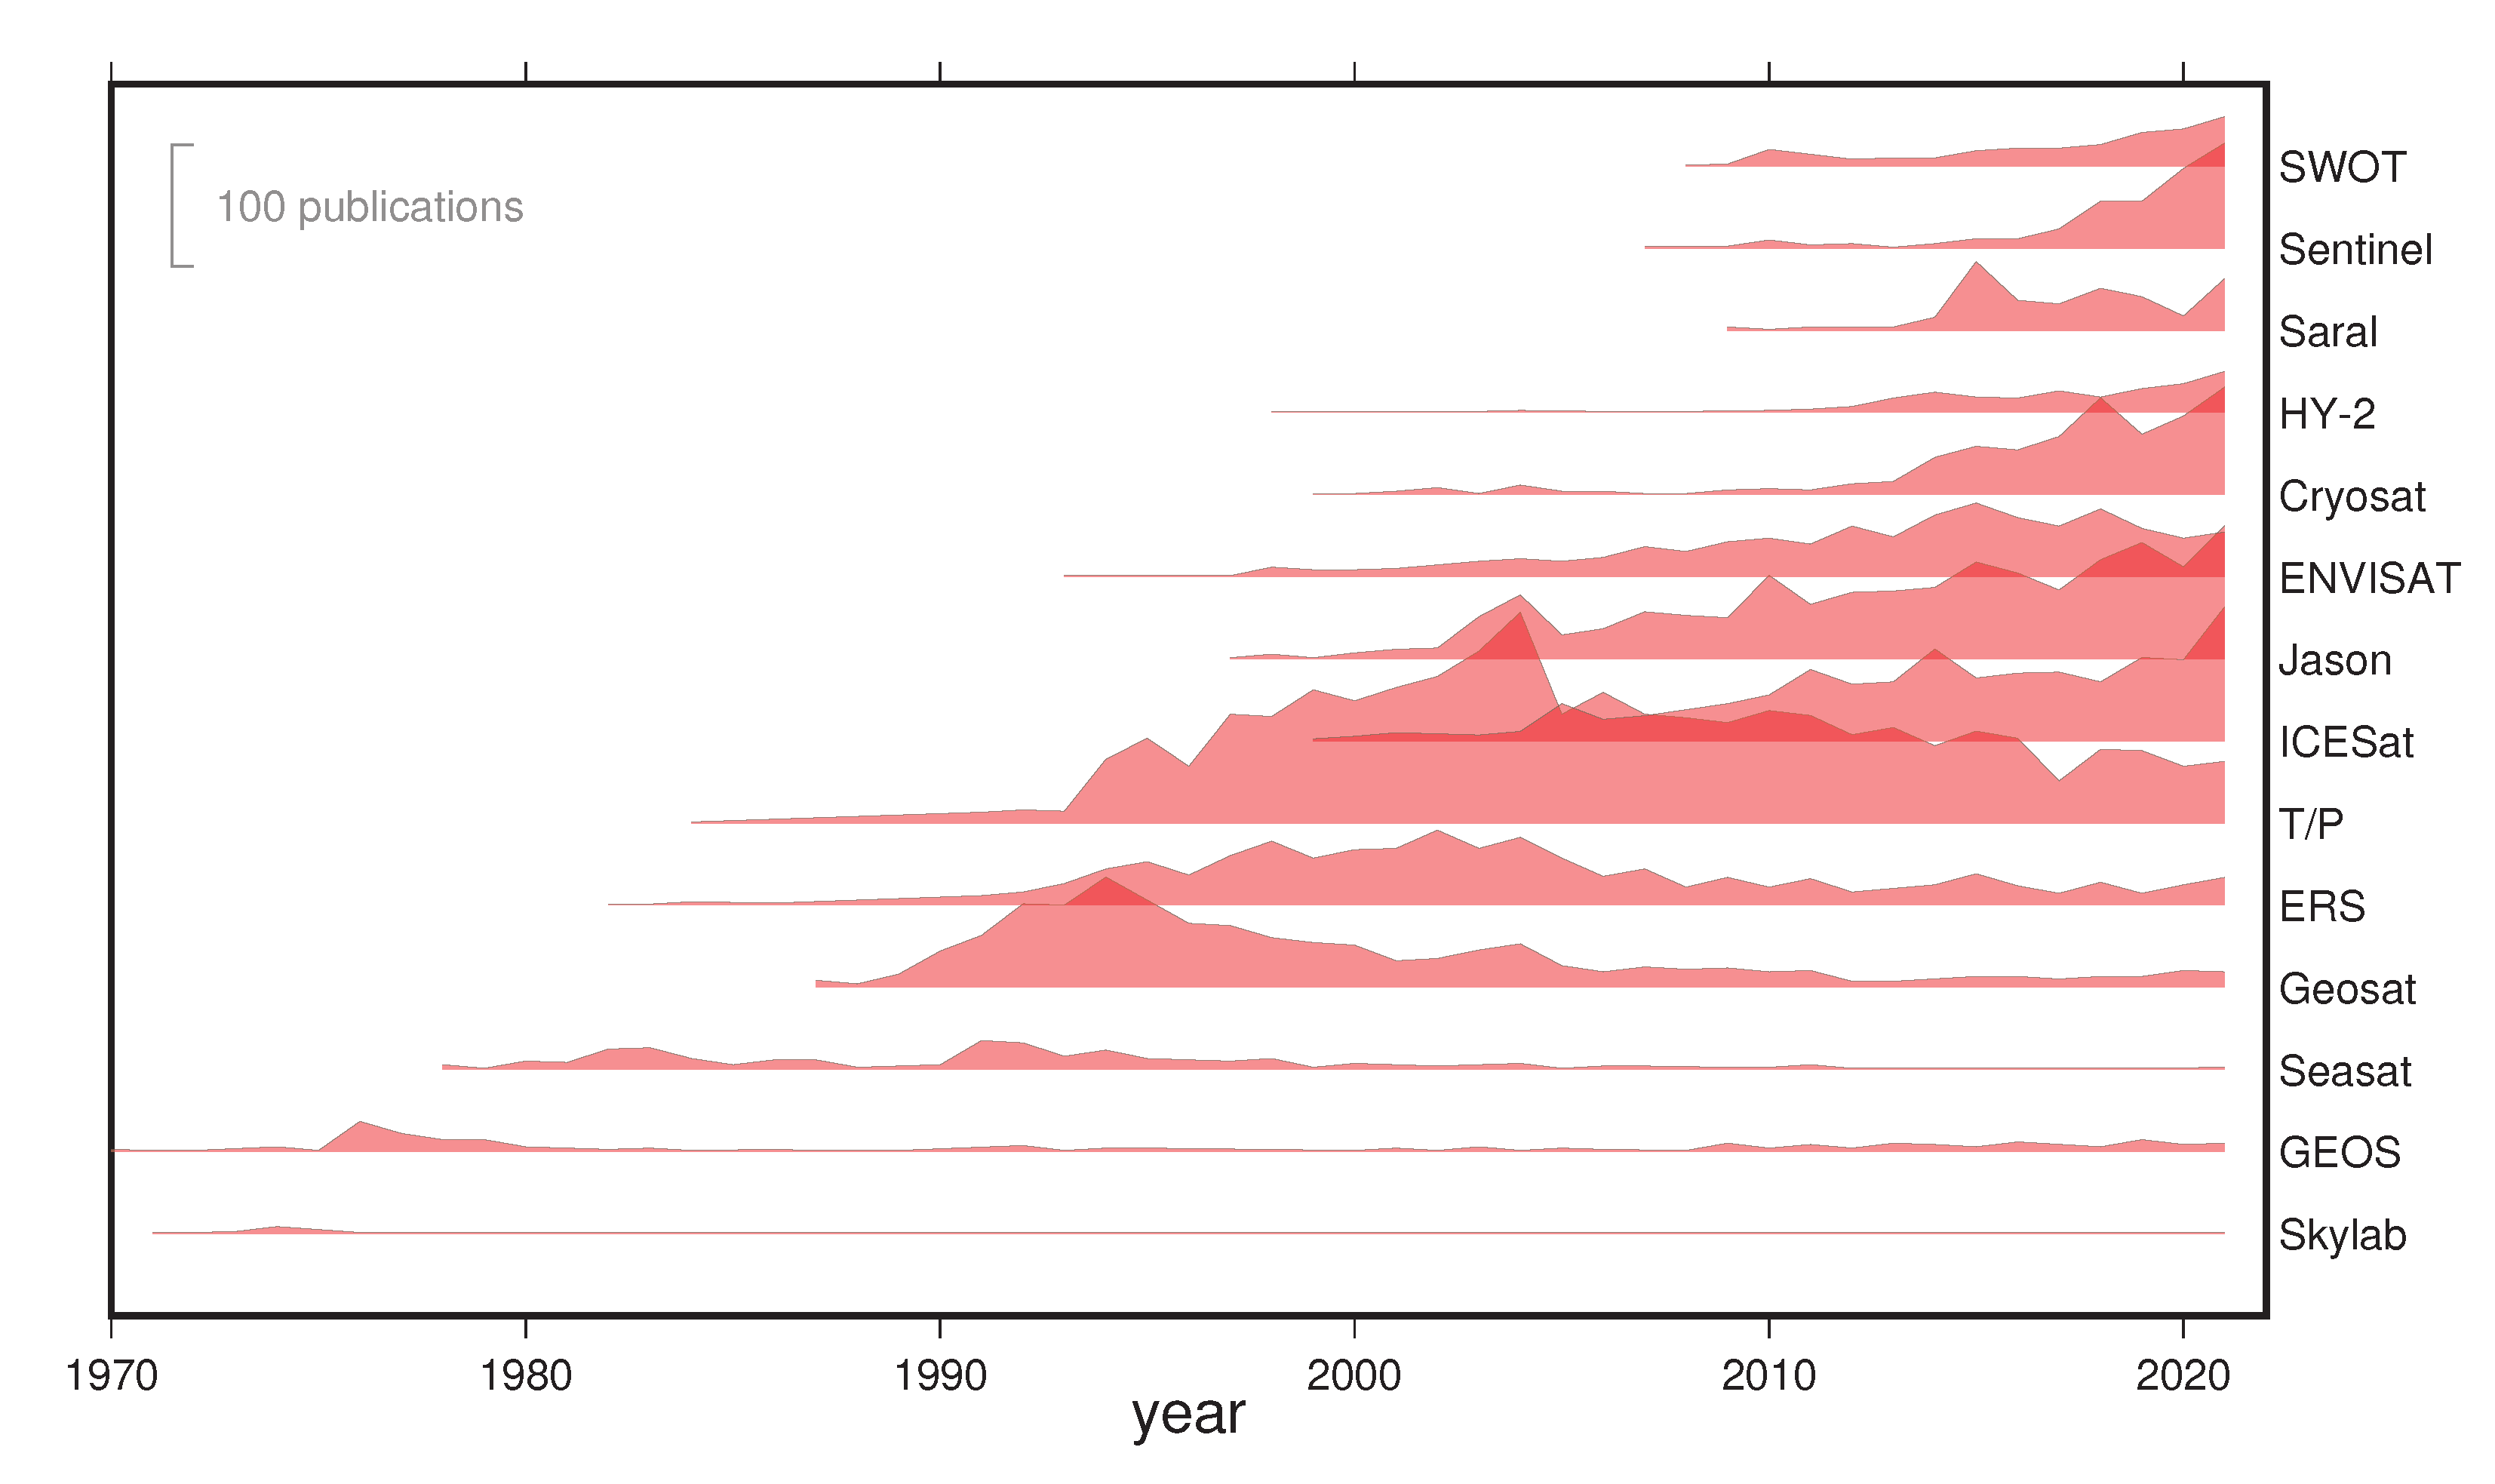
3.1. Temporal Evolution of Documents

Figure 2 displays the annual paper number and the number of times these publications were cited in relation to satellite altimetry from 1970 to 2021. Over the past 50 years, the number of published papers and citations have increased significantly, demonstrating the expanding influence of satellite altimetry in scientific applications. From 1970 to 1990, the annual number of published papers is less than twenty, and the rate of growth was moderate. During this time, satellite altimeter missions had a relatively low precision. In addition, the military has made their satellite altimetry data confidential, which further restricts research in this subject [68].
Due to the deployment of the satellite altimeter TOPEX/Poseidon, the first surge of published papers occurred around 1991. Since the TOPEX/Poseidon, the accuracy on sea surface height (ssh) determination has been estimated to be between 2 and 3 cm as a result of the development of the altimeter equipment, precise orbit determination, and improvements in the correction models [69]. In 2021, more than 600 papers were published, and this number is expected to keep rising. Particularly, in 2021 more than half of the annual papers, approximately 400, were open access (OA). These altimetry publications have received more than 230,000 citations, according to a WoS statistic.

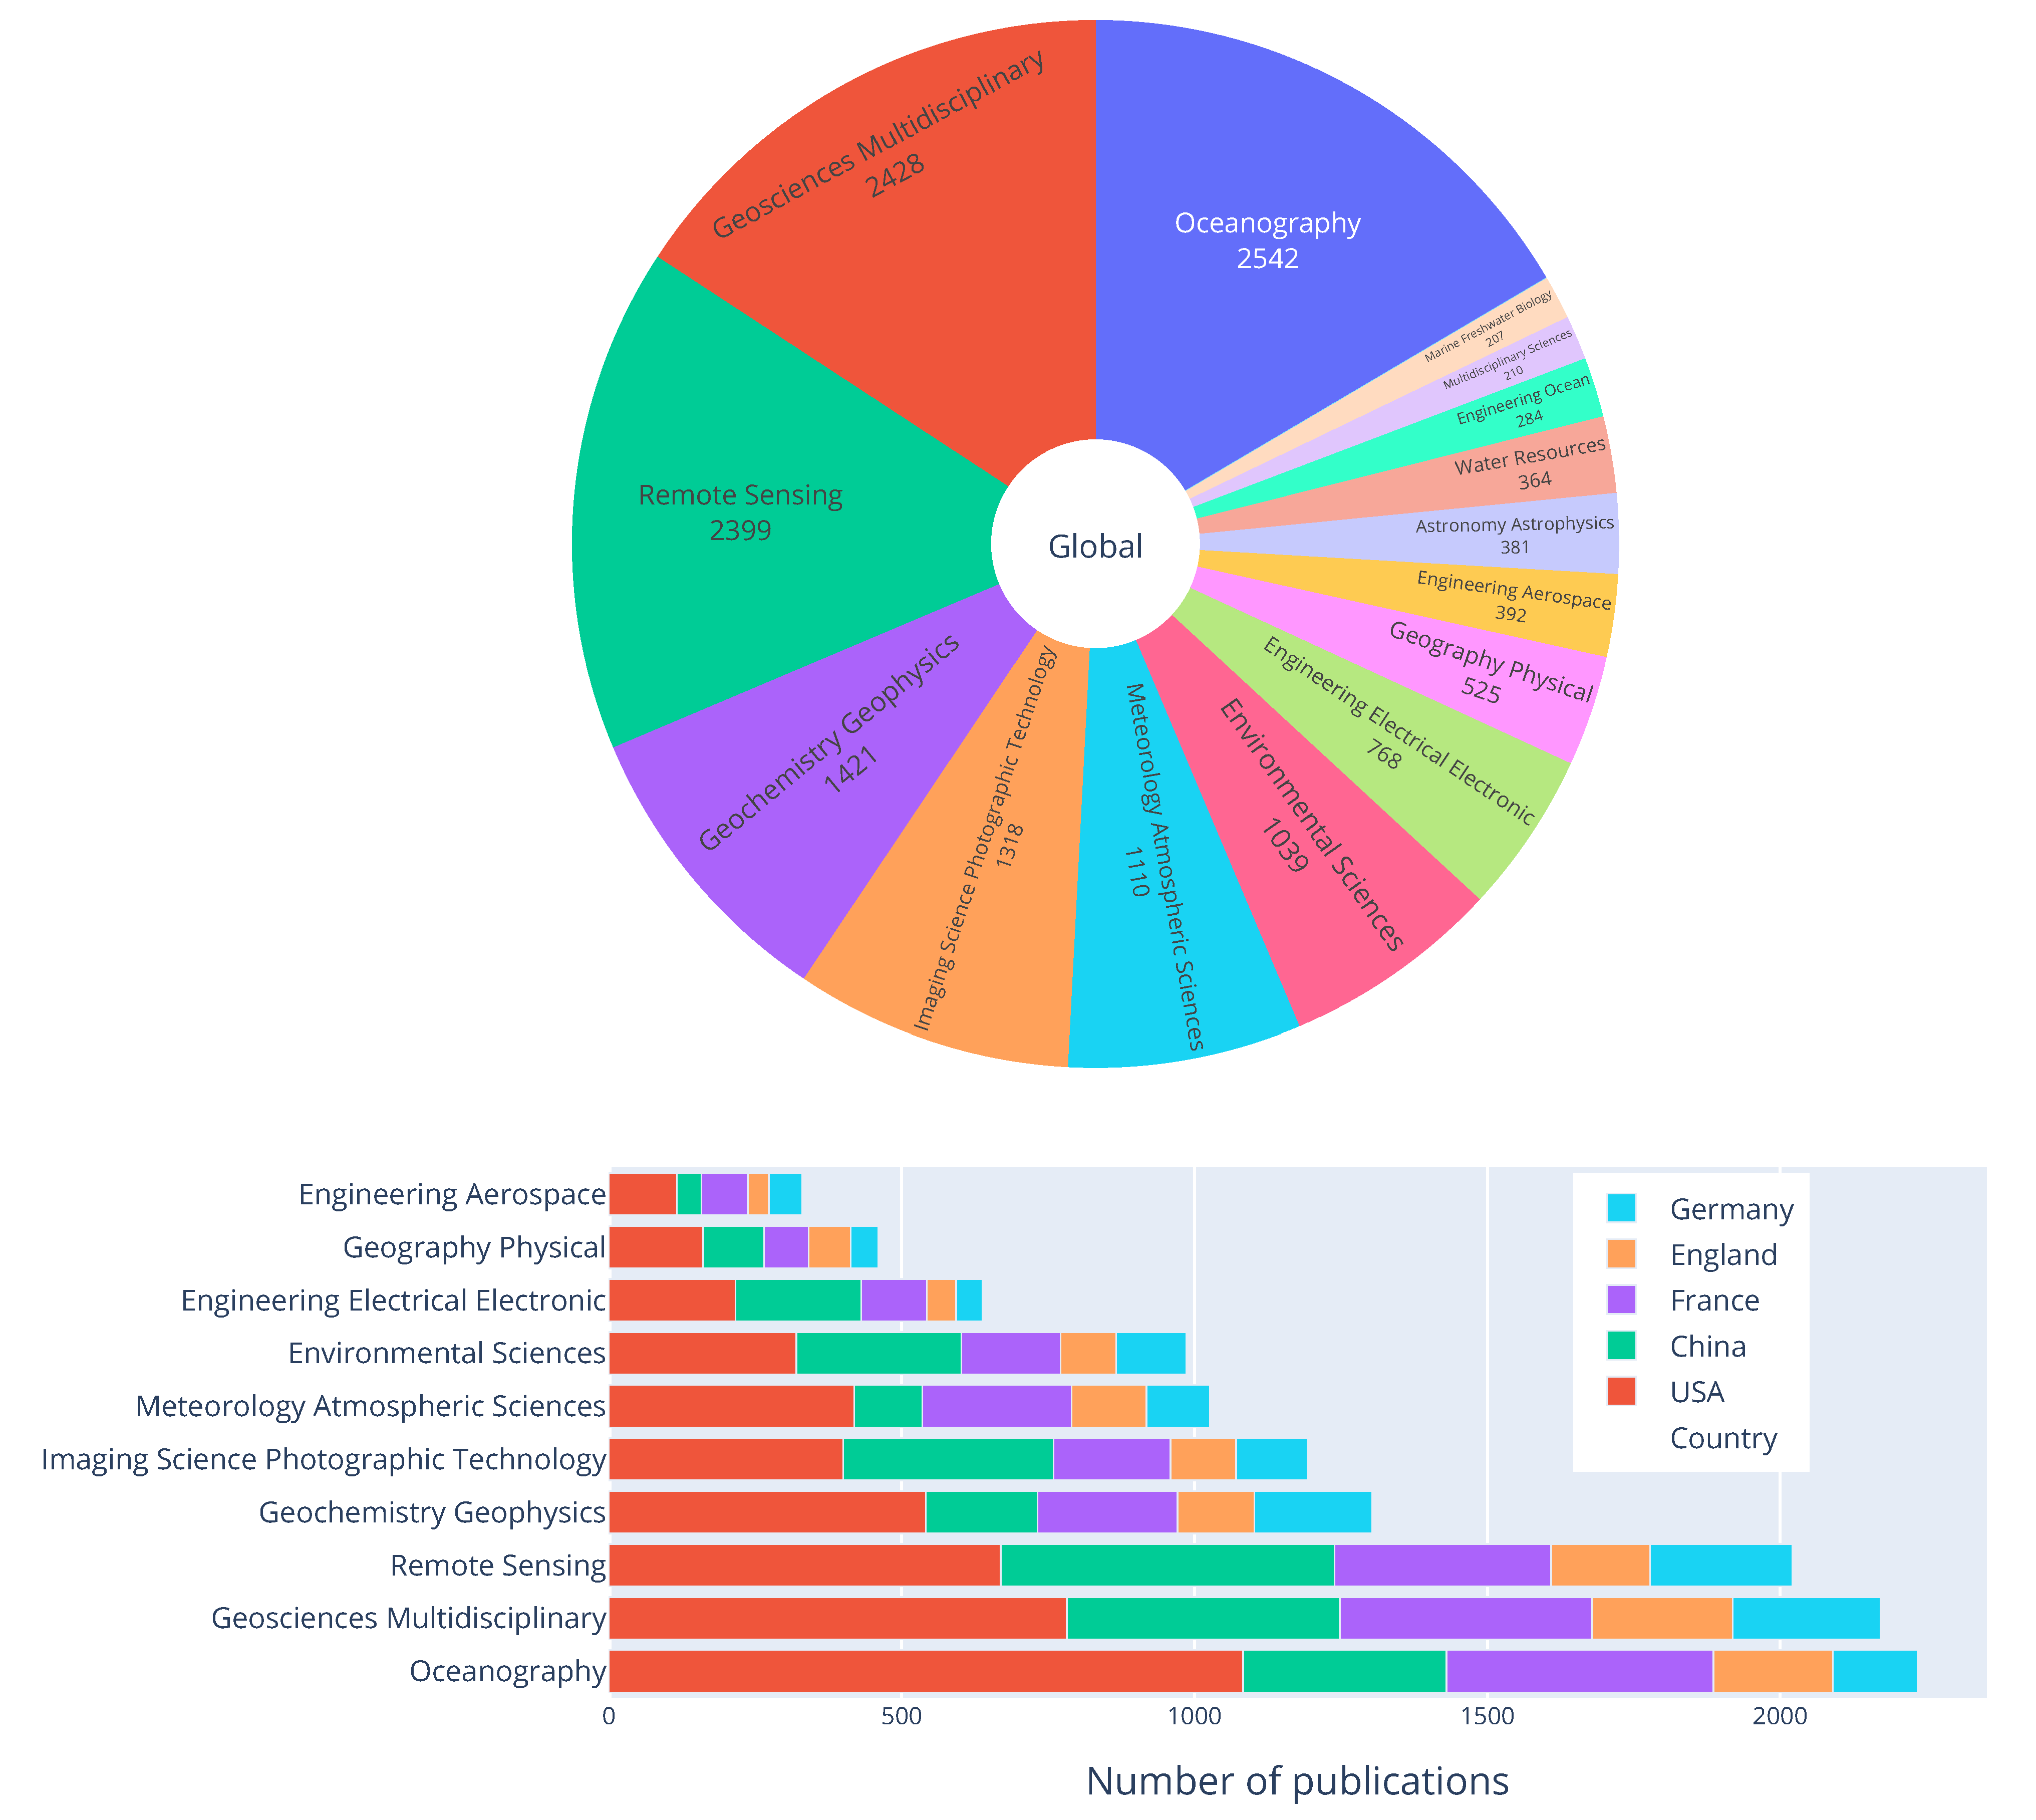
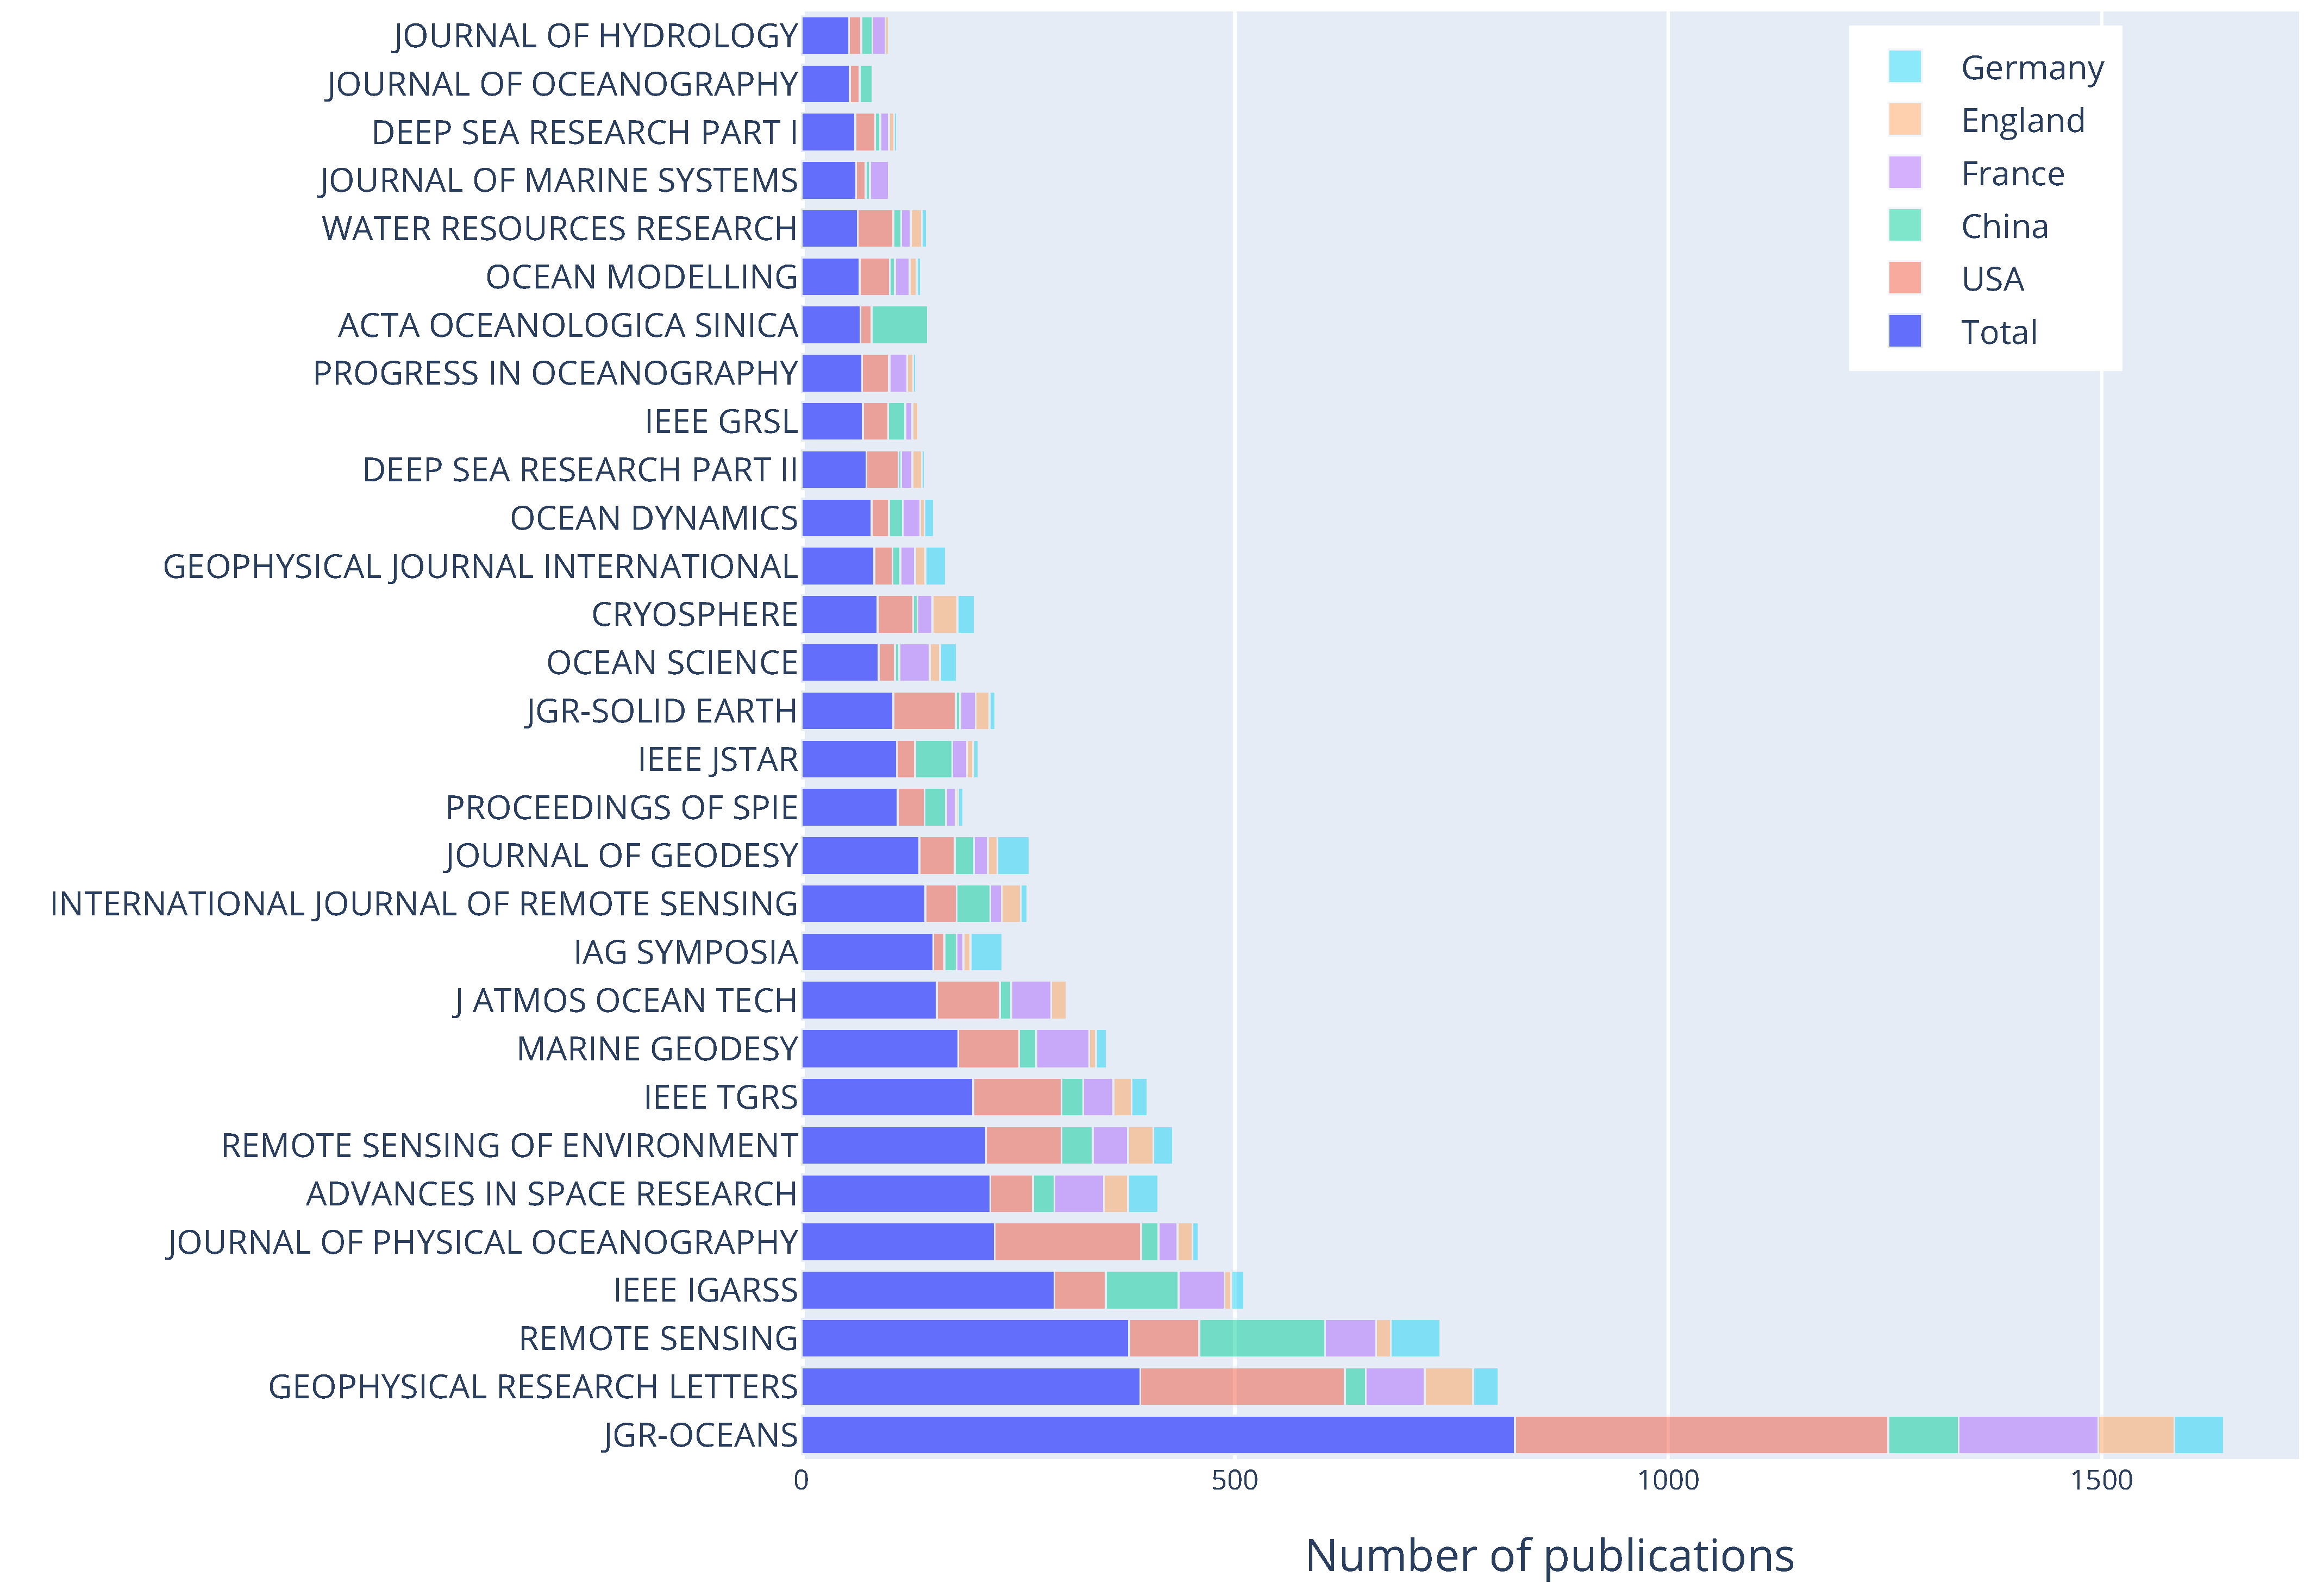
3.2. Research Areas and Journal Sources

In total, 98 categories of WoS publications were found to be connected to satellite altimetry, demonstrating that the study domain encompasses a broad range of fields. Figure 3 depicts the primary research categories containing more than 200 papers, with the top 10 categories subdivided into five major publishing nations. With 2542, 2428, and 2399 papers, the oceanographic science, multidisciplinary geosciences, and remote sensing are the top three categories in terms of total number of papers. In addition, the geochemistry and geophysics, image science and photographic technology, meteorology, atmospheric science, and environmental sciences are all prominent categories, with more than 1000 papers in each of these fields. However, the categories are distributed differently between countries. This may be due to the differences in research interests among the nations involved. For example, in China, remote sensing is the most major category in satellite altimetry research, and oceanography is only the fourth most significant category, whereas the oceanography category is the first most significant category in the United States and France.
In terms of satellite altimetry related publication sources, there were 1318 items, which included journals, book chapters, and proceedings. Figure 4 shows the top 20 sources in terms of number of publications, as well as the relevant distribution for the top five nations. The Journal of Geophysical Research-Oceans (JGR-Ocean, 823 papers) and the Geophysical Research Letter (GRL, 391 papers) rank first and second, respectively, according to the results. It is followed by the open access journal Remote Sensing (RS), which published 378 relevant papers, accounting for 4.6% of all publications. The annual papers of Remote Sensing have increased at a remarkable rate, starting from one paper in 2009 and reaching up to 96 papers in 2021, much exceeding the growth of all other journals combined. Particularly noteworthy among the Remote Sensing articles is that China contributed almost half of the studies in the satellite altimetry field.
The results reveal that the Journal of Physical Oceanography (JPO), Advances in Space Research (ASR), Remote Sensing of Environment (RSE), and IEEE Transactions on Geoscience and Remote Sensing (TGRS) are the most common scientific journals for researchers to submit their research results. Additional sources for satellite altimetry publications include scientific proceedings, such as the IEEE The International Geoscience and Remote Sensing Symposium (IGARSS) and the International Association of Geodesy Symposia.
The number of open access publications has been significantly increased in recent years. Until now, over 400 publications have published as open access papers. The JGR-Ocean, with a total of 530, is the largest journal publishing OA papers, according to the results. Following journal sources publishing the OA papers are RS, GRL, JPO, and the Journal of Atmospheric And Oceanic Technology (J ATMOS OCEAN TECH), with publication numbers of 378, 297, 147, and 107, respectively.

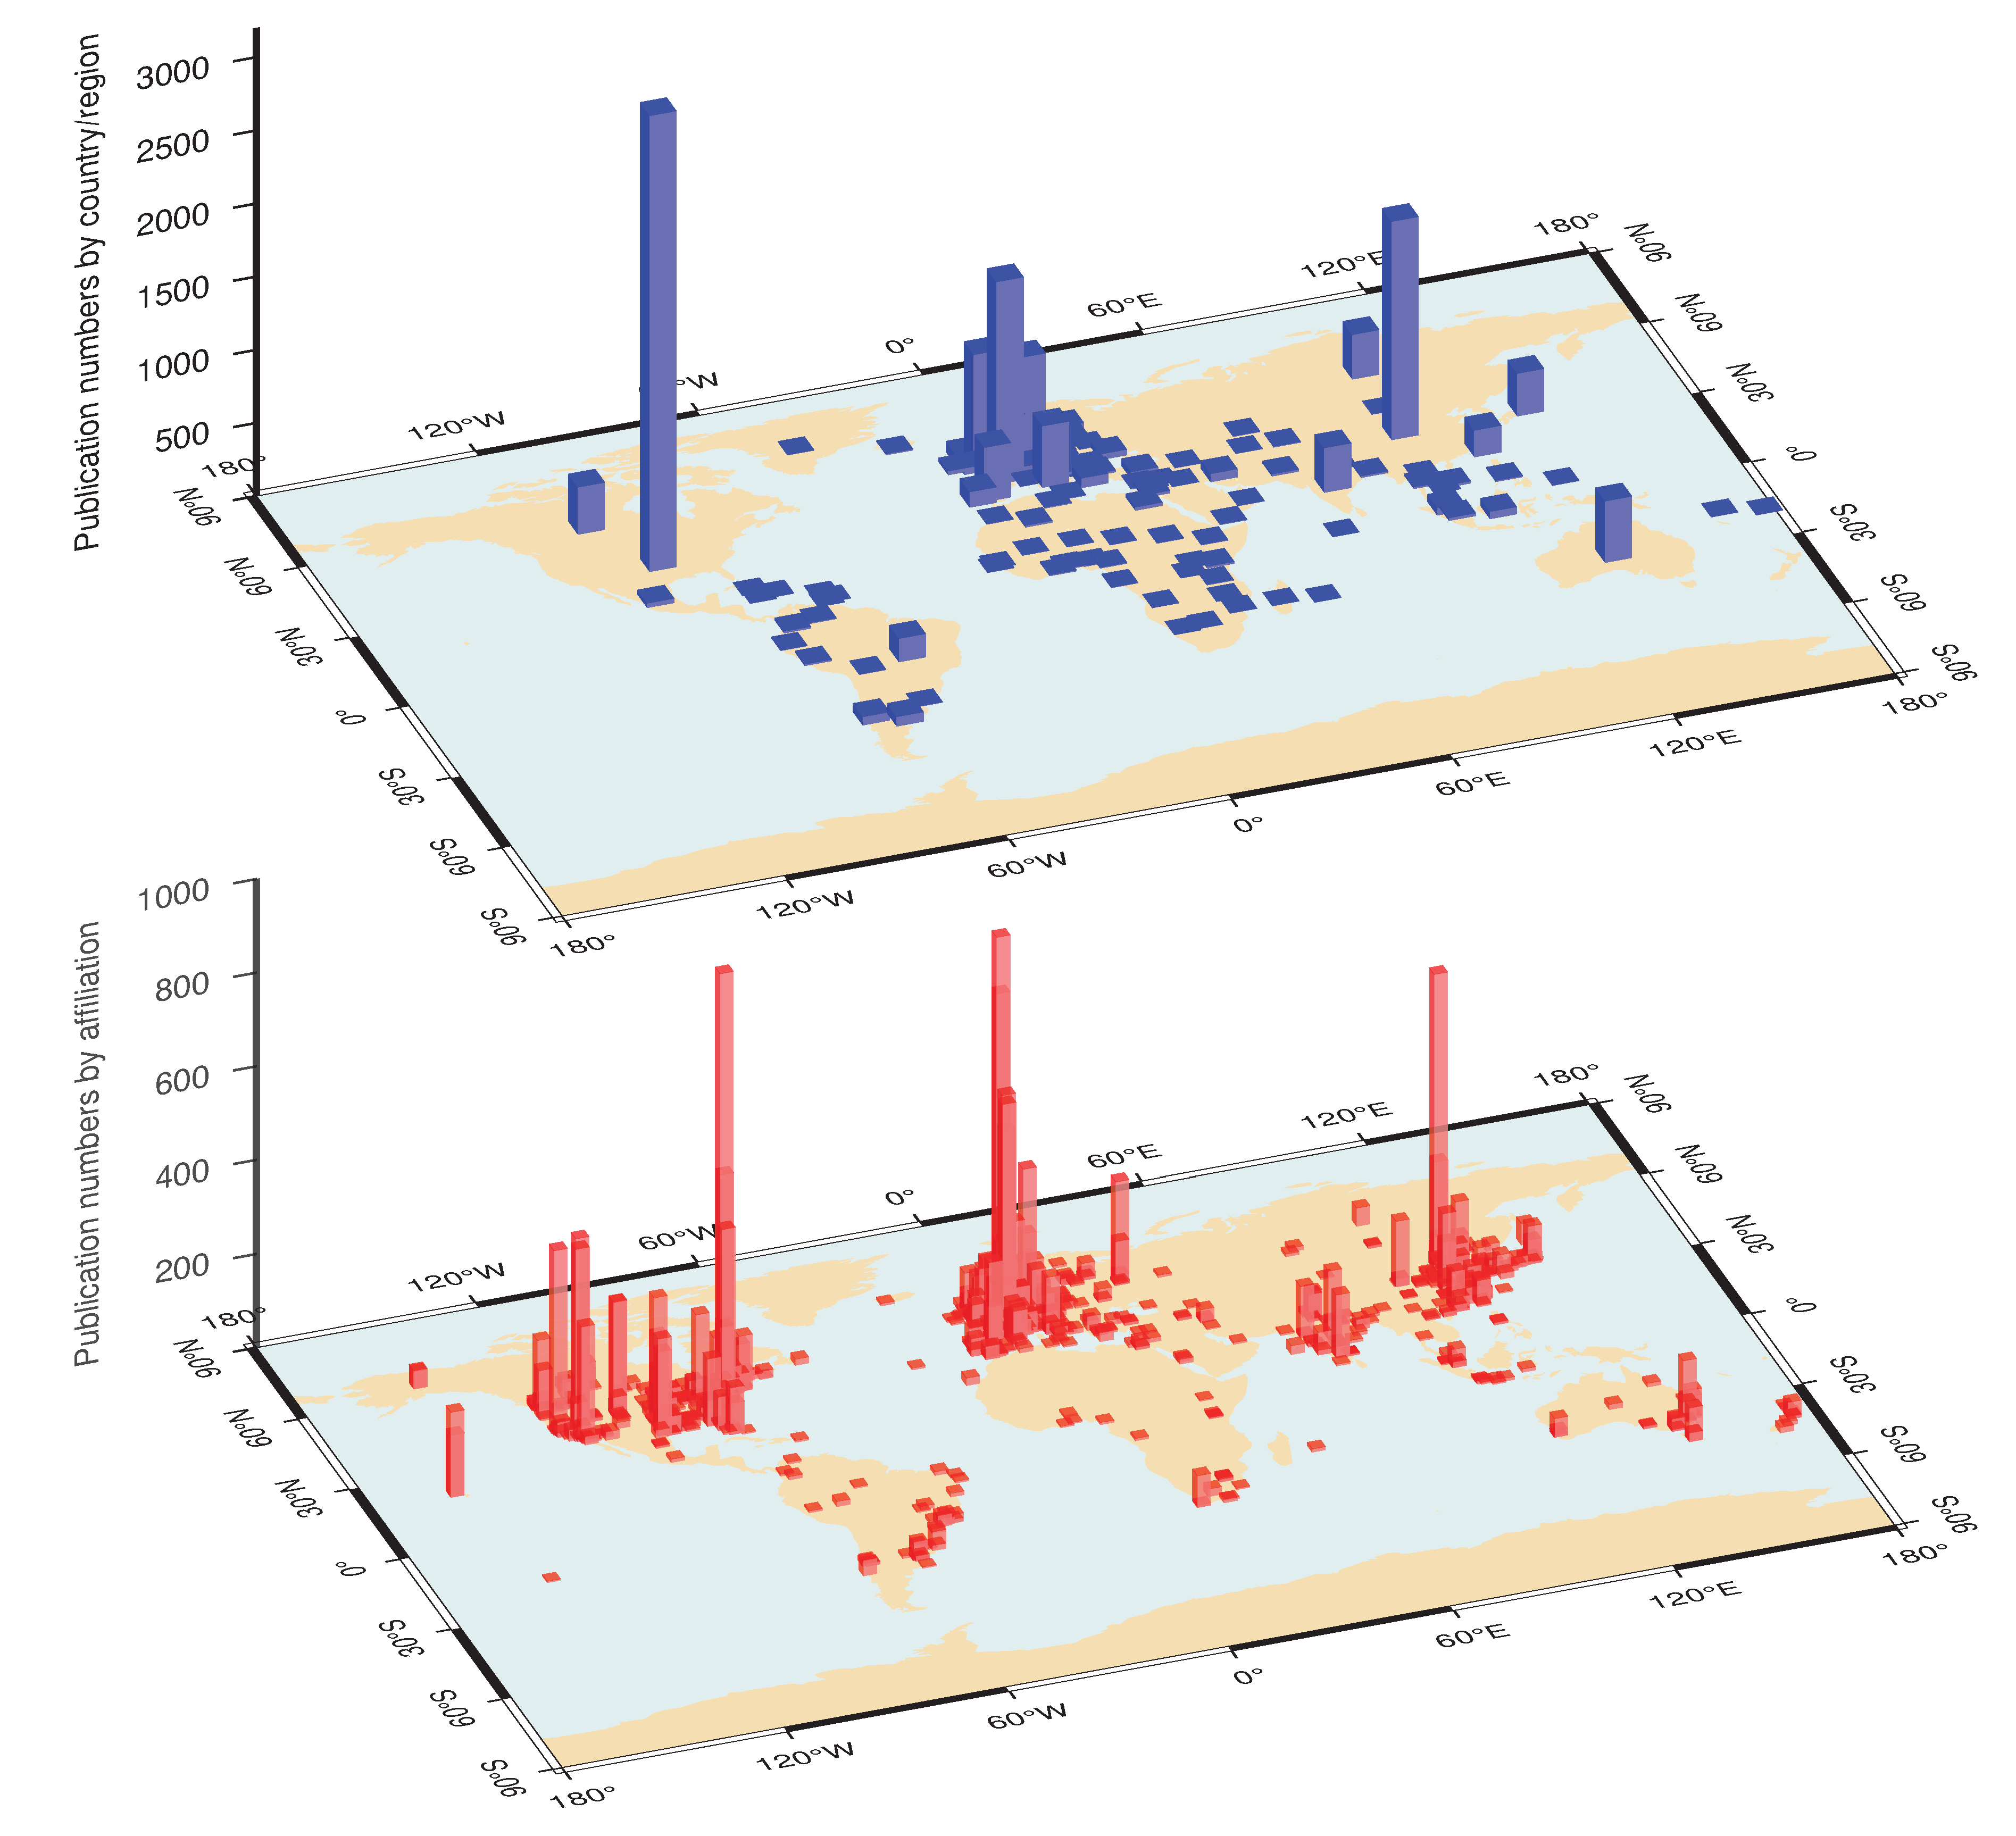
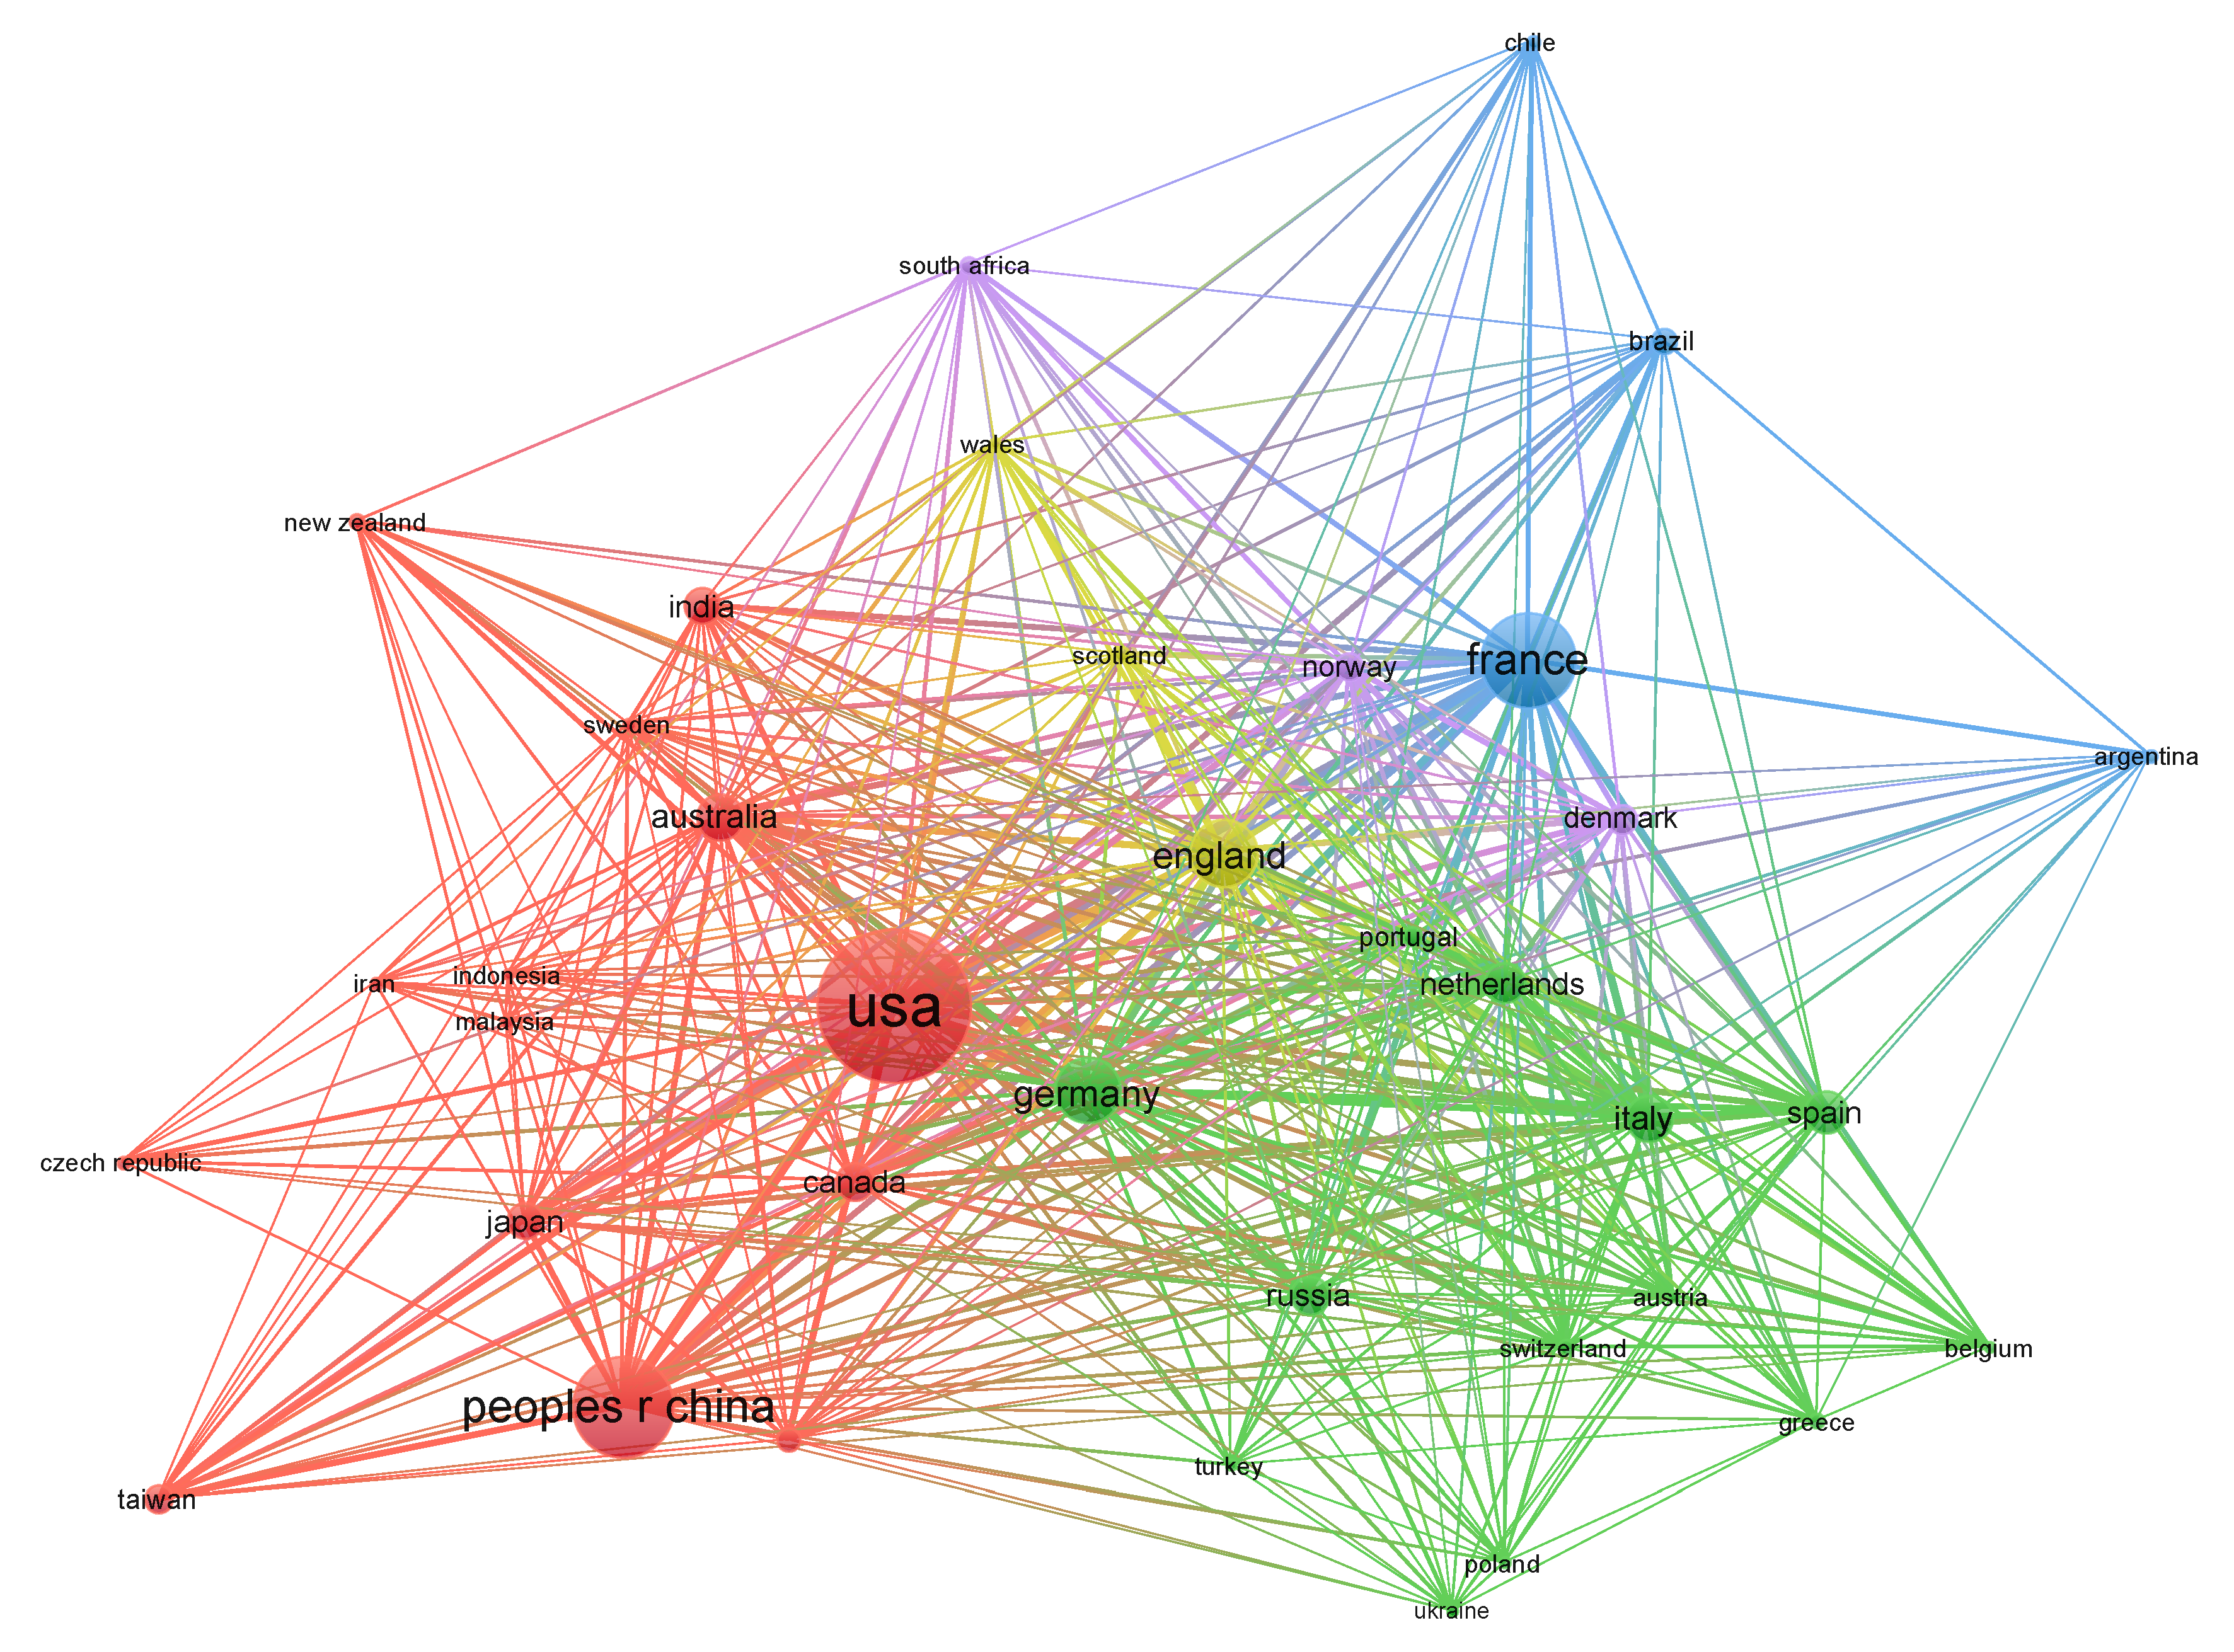
3.3. Spatial Distribution of Publications

As shown in Figure 5, 137 countries/regions have engaged in satellite altimetry research. The top five countries by number of publications are the United States (3118), China (1149), France (1383), England (804), and Germany (748). Nevertheless, the United States accounts for more than one-third of all publications and is the most productive and prominent nation in the subject. In addition, we find that the EU has a notable group feature with a high research density. The result is related to the fact that the USA, the EU, and China operate most of the satellite altimetry missions. Specially, as shown in Figure 2, China has the fastest growth rate, surpassing France in 2013 and the United States in 2019. Presently, China publishes about 200 papers annually, ranking top in the world. We hypothesize that the Chinese’s rapid rate of publication in the satellite altimetry sector is related to their increasing investments in the ocean and space industries. From 2011 through 2020, China has launched a series of altimetry missions, designated as HY-2A/B/C/D [5].
The cited times were also assessed for each country, demonstrating that the United States has significantly outperformed the other countries with 105,761 times. France (29,102), the United Kingdom (18,539), China (15,433), and Australia (10,564) are the following countries on the list. Despite the fact that China has a significant number of papers published, the scientific influence is still less than France and England. In terms of national cooperation centrality, which is used to indicate the strength of research cooperation, the top five countries are the United States, France, England, Germany, and China. As shown in Figure 6, there are 91 connections between the United States and other countries, with more than 2200 publications produced in collaboration. The United States and China have the most substantial cooperation connection, followed by the United States and France, the United States and the United Kingdom, and the United States and Germany.
It is estimated that more than 3000 affiliations have made contributions to satellite altimetry research. As shown in Figure 5, the global distribution of research institutes is primarily concentrated in the United States, the European Union, East China, and India. Additionally, institution clusters can be found in Australia, Brazil, and South Africa. Table 2 lists the top 10 research institutions with the greatest amount of documents. NASA in the United States was the most productive institution, with over 900 publications. The CNRS and IRD in France ranked second and third with 828 and 707 publications, respectively. The CAS in China and the Université de Toulouse in France published 629 and 517 publications, respectively, placing them fourth and fifth in the list.

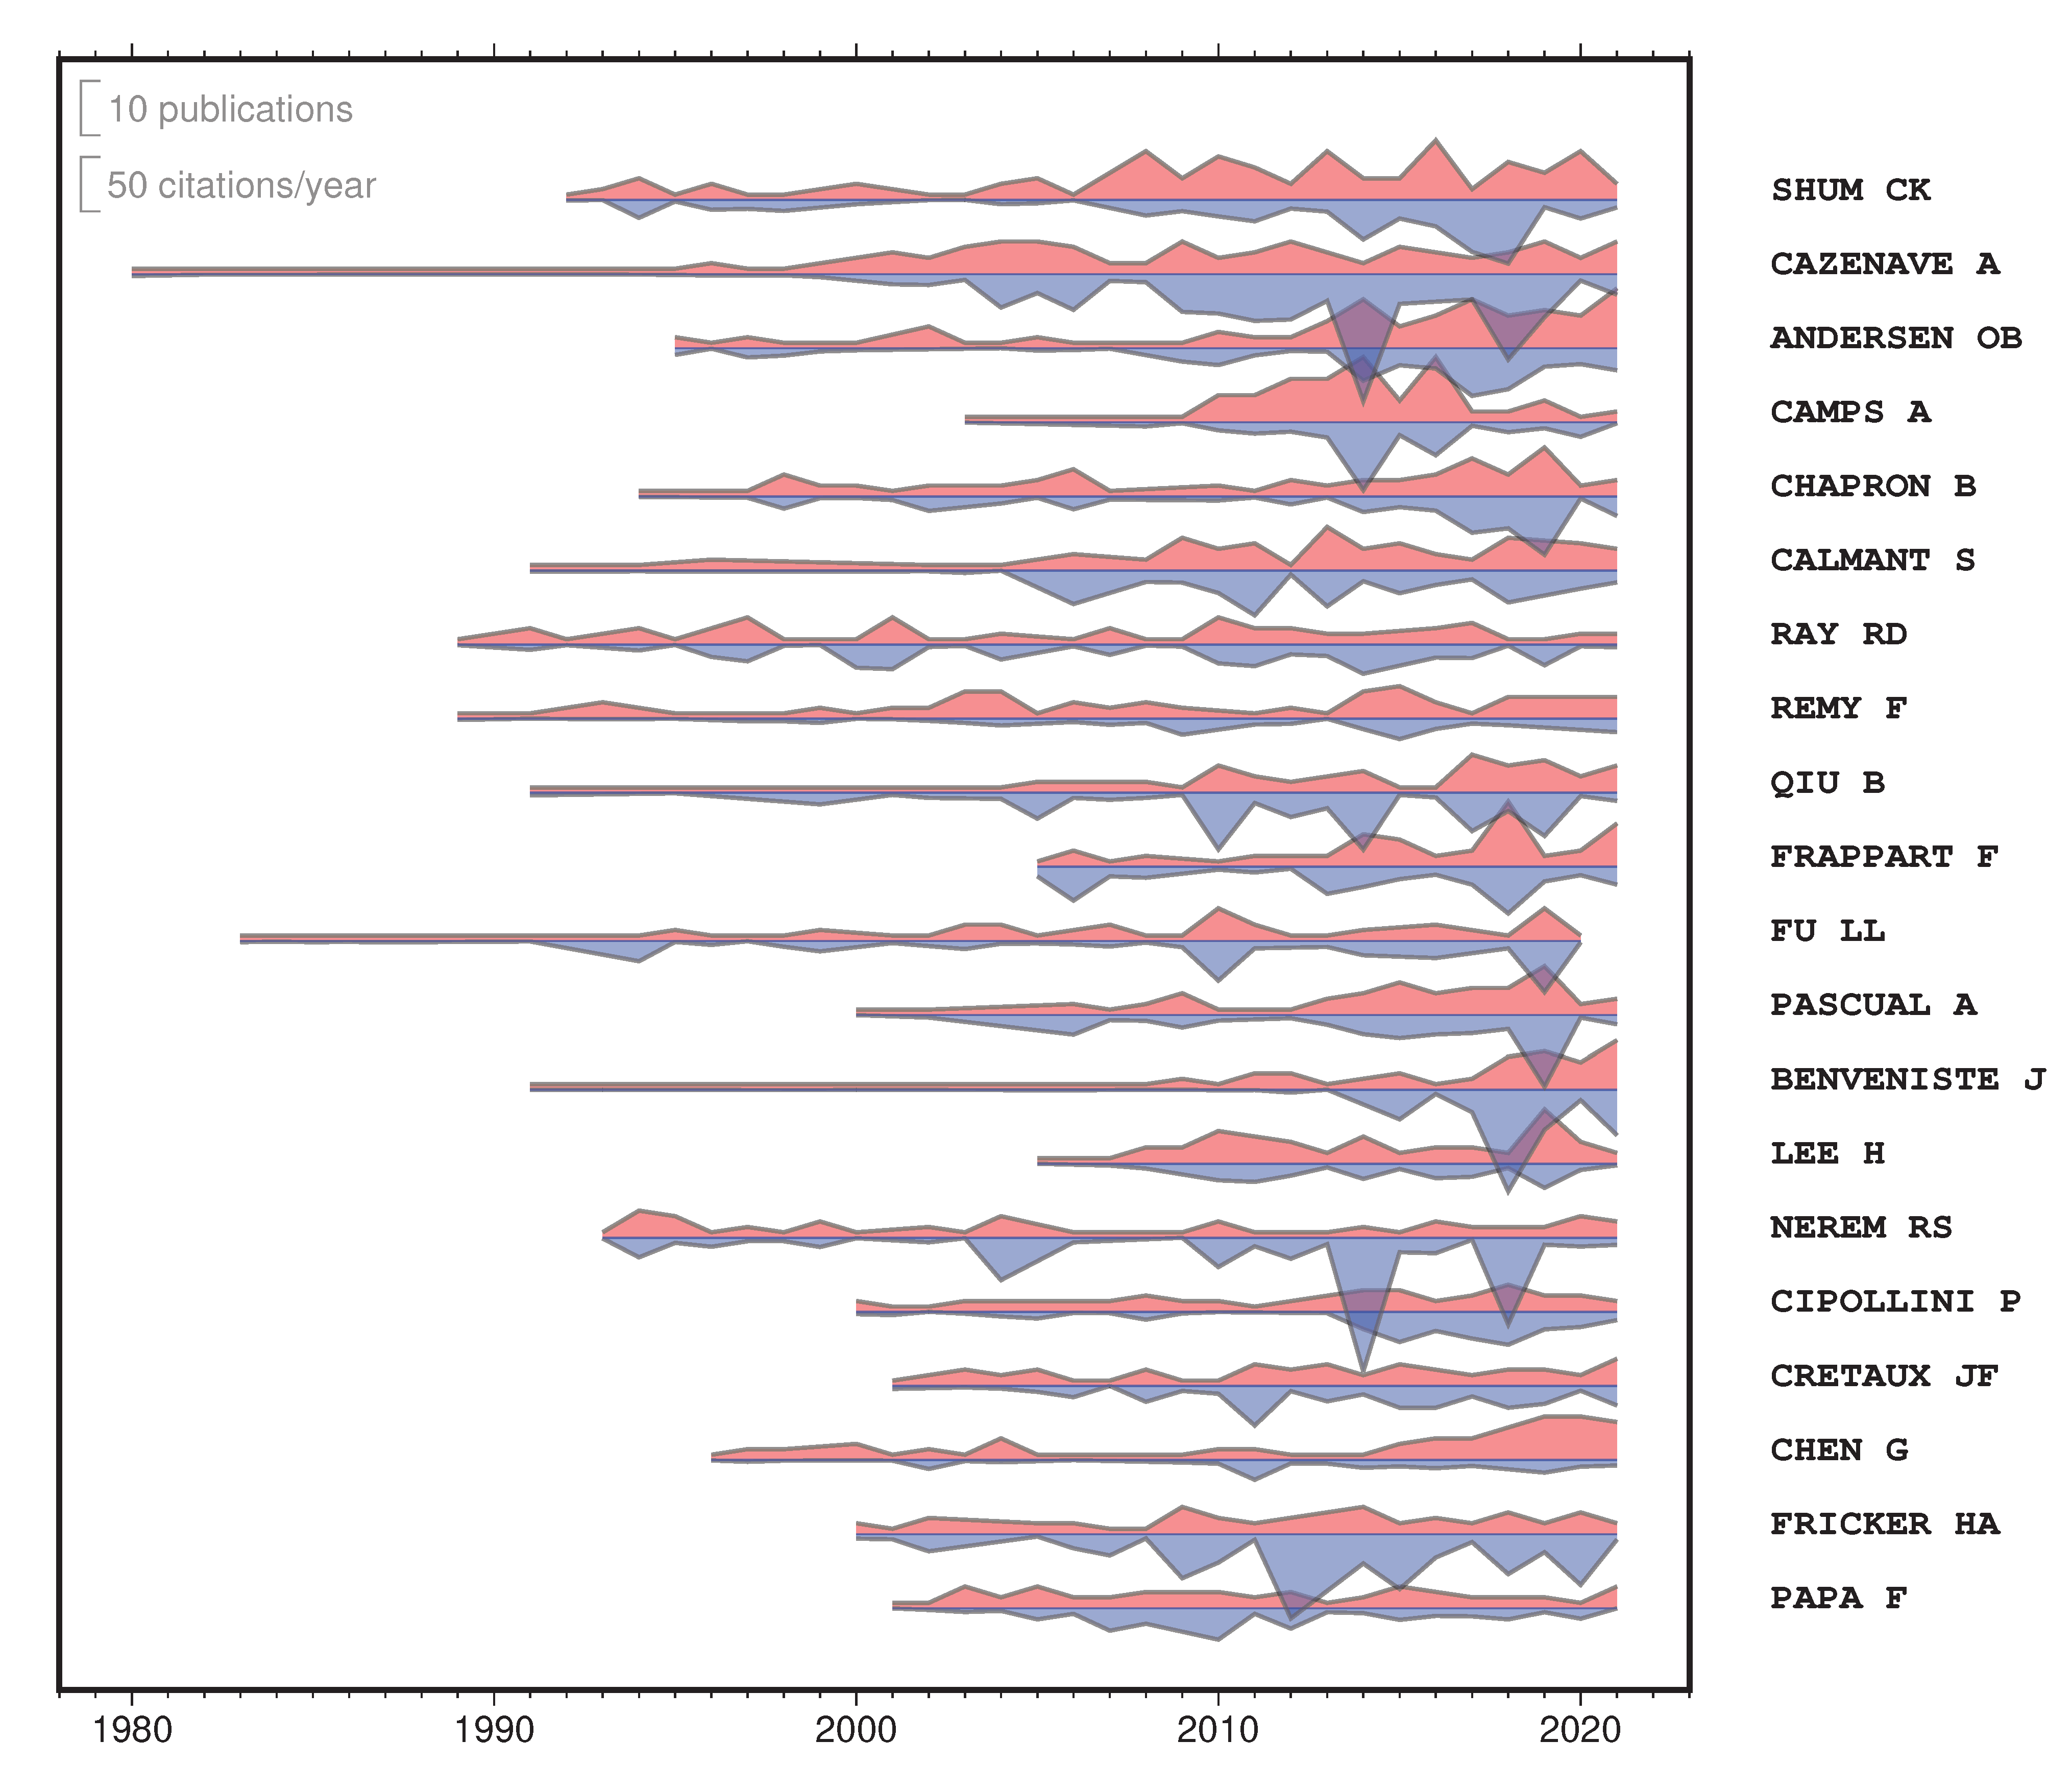
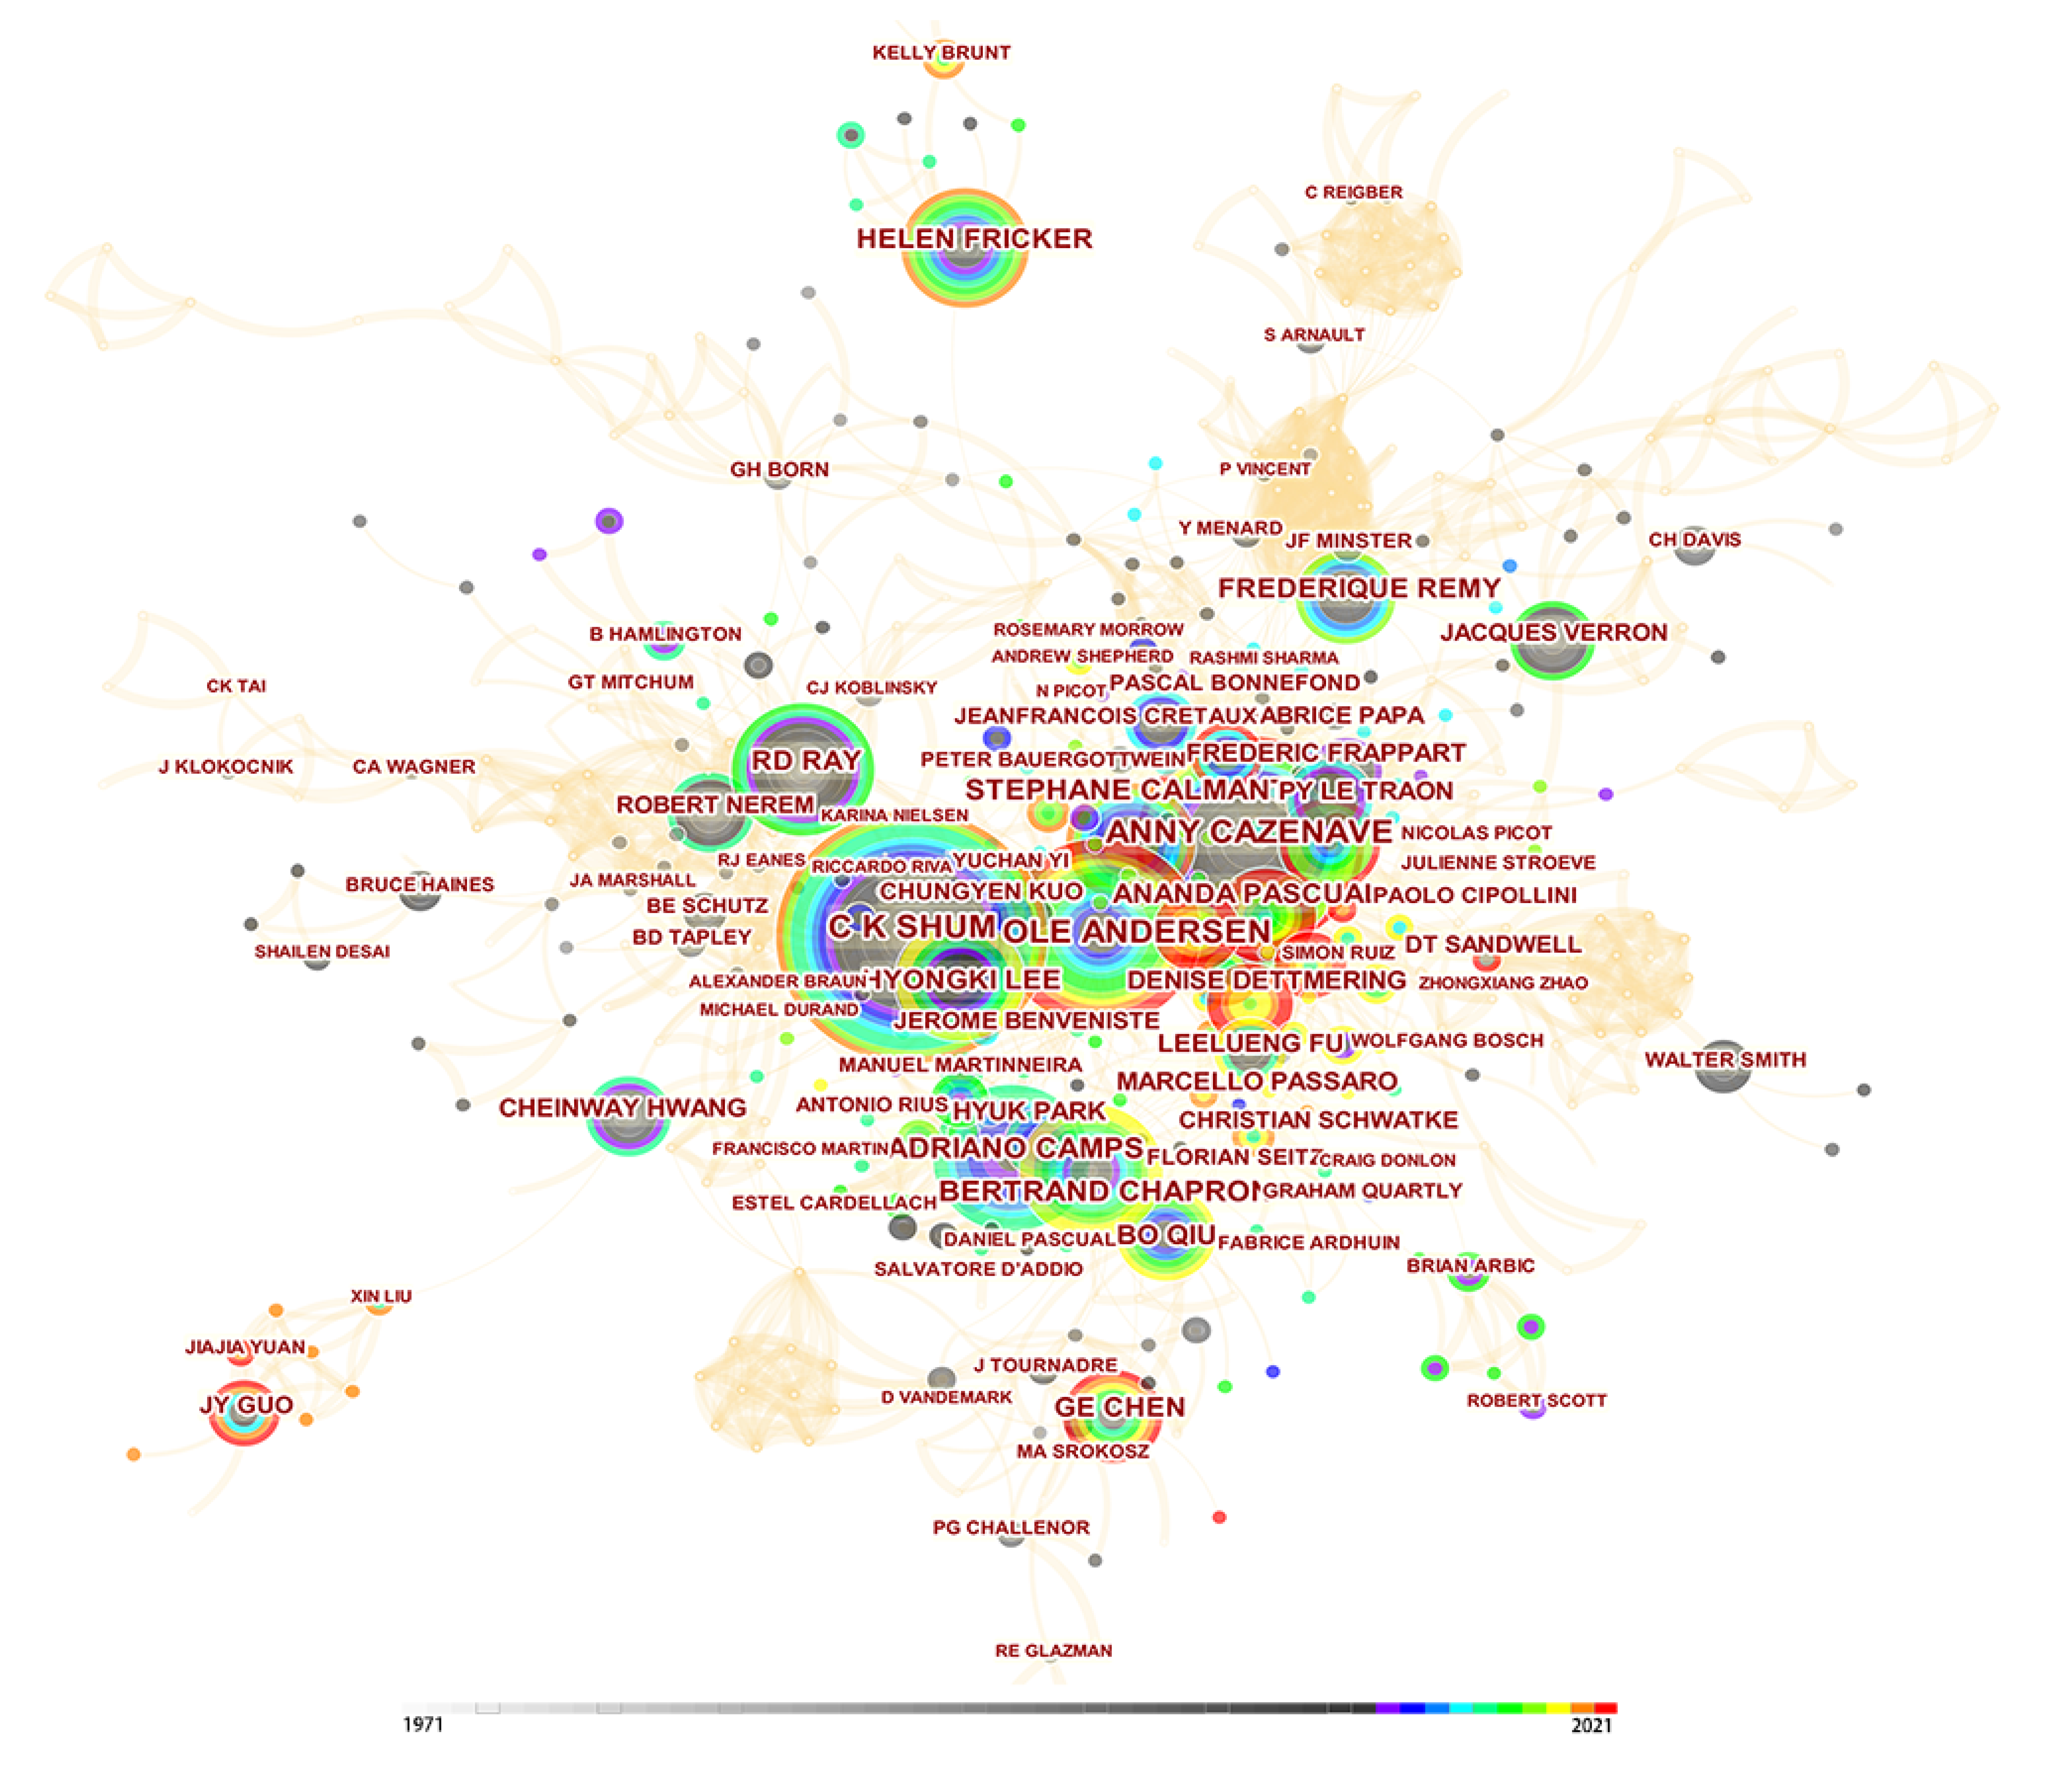
3.4. Authors and Co-Authorship

Using the database of authors, we could determine which authors are the most engaged, productive, and valuable in satellite altimetry research. Satellite altimetry’s WoS documents include 15,750 authors, and 18 of those authors have published more than 50 papers.
Figure 7 shows the top 20 authors in terms of the number of documents and citations. In the field of marine geodesy, Shum CK from the United States is the most prolific author, with over 100 publications. Cazenave A has 95 papers, most of which are in physical oceanography and climate change; Andersen OB has 89 papers, the large percentage of which are in marine gravity and bathymetry; Camps A has 68 papers, the majority of which are in GNSS-R altimetry; and Chapron B has 67 papers, which are focused on physical processes at the ocean surface and the upper atmosphere.
Also included in this study was the calculation of the H-index, which is used to evaluate the cumulative impact of an author’s scholarly output and performance. Regarding the H-index, the top five authors were Cazenave A (42), Fricker HA (32), Shum CK (32), Fu LL (31), and Qiu B (31), mainly focusing on sea level change, cryosphere, geodesy, and physical oceanography [70,71,72,73,74]. These authors with a high H-index are the most influential in the satellite altimetry field.
In addition, we analysed the co-author network to reveal the cooperation relationships between different authors. The results indicate that there were only 452 authors of single-authored documents. The majority of papers were written by multiple authors, and the average number of co-Authors per document is 4.5. As shown in Figure 8, the authors who collaborated well and had similar research interests were grouped into the same clusters. Based on Citespace’s statistical algorithm, 1329 author nodes were connected by 3759 edges. The most productive and influential authors were located close to the center and were able to facilitate communication between different research groups. For instance, the authors in the bottom left corner of the figure formed a marine-geodesy-focused research group [75,76,77,78]. This small group is connected to the global research community by the bridge of Chenway Hwang, who furthermore had better collaborations with other research groups [79,80]. Such collaborations between the corner group and the center group may boost the flow of knowledge in research communication.

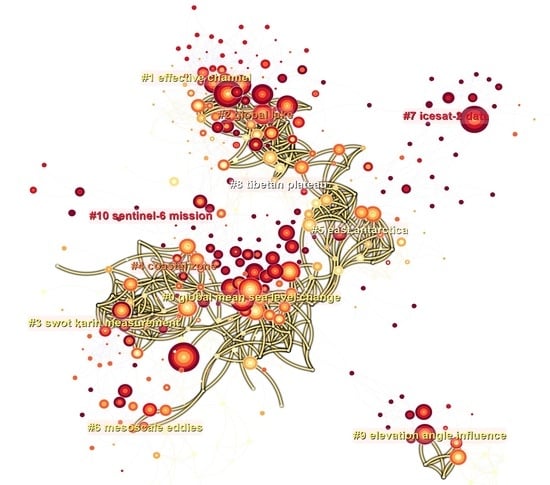
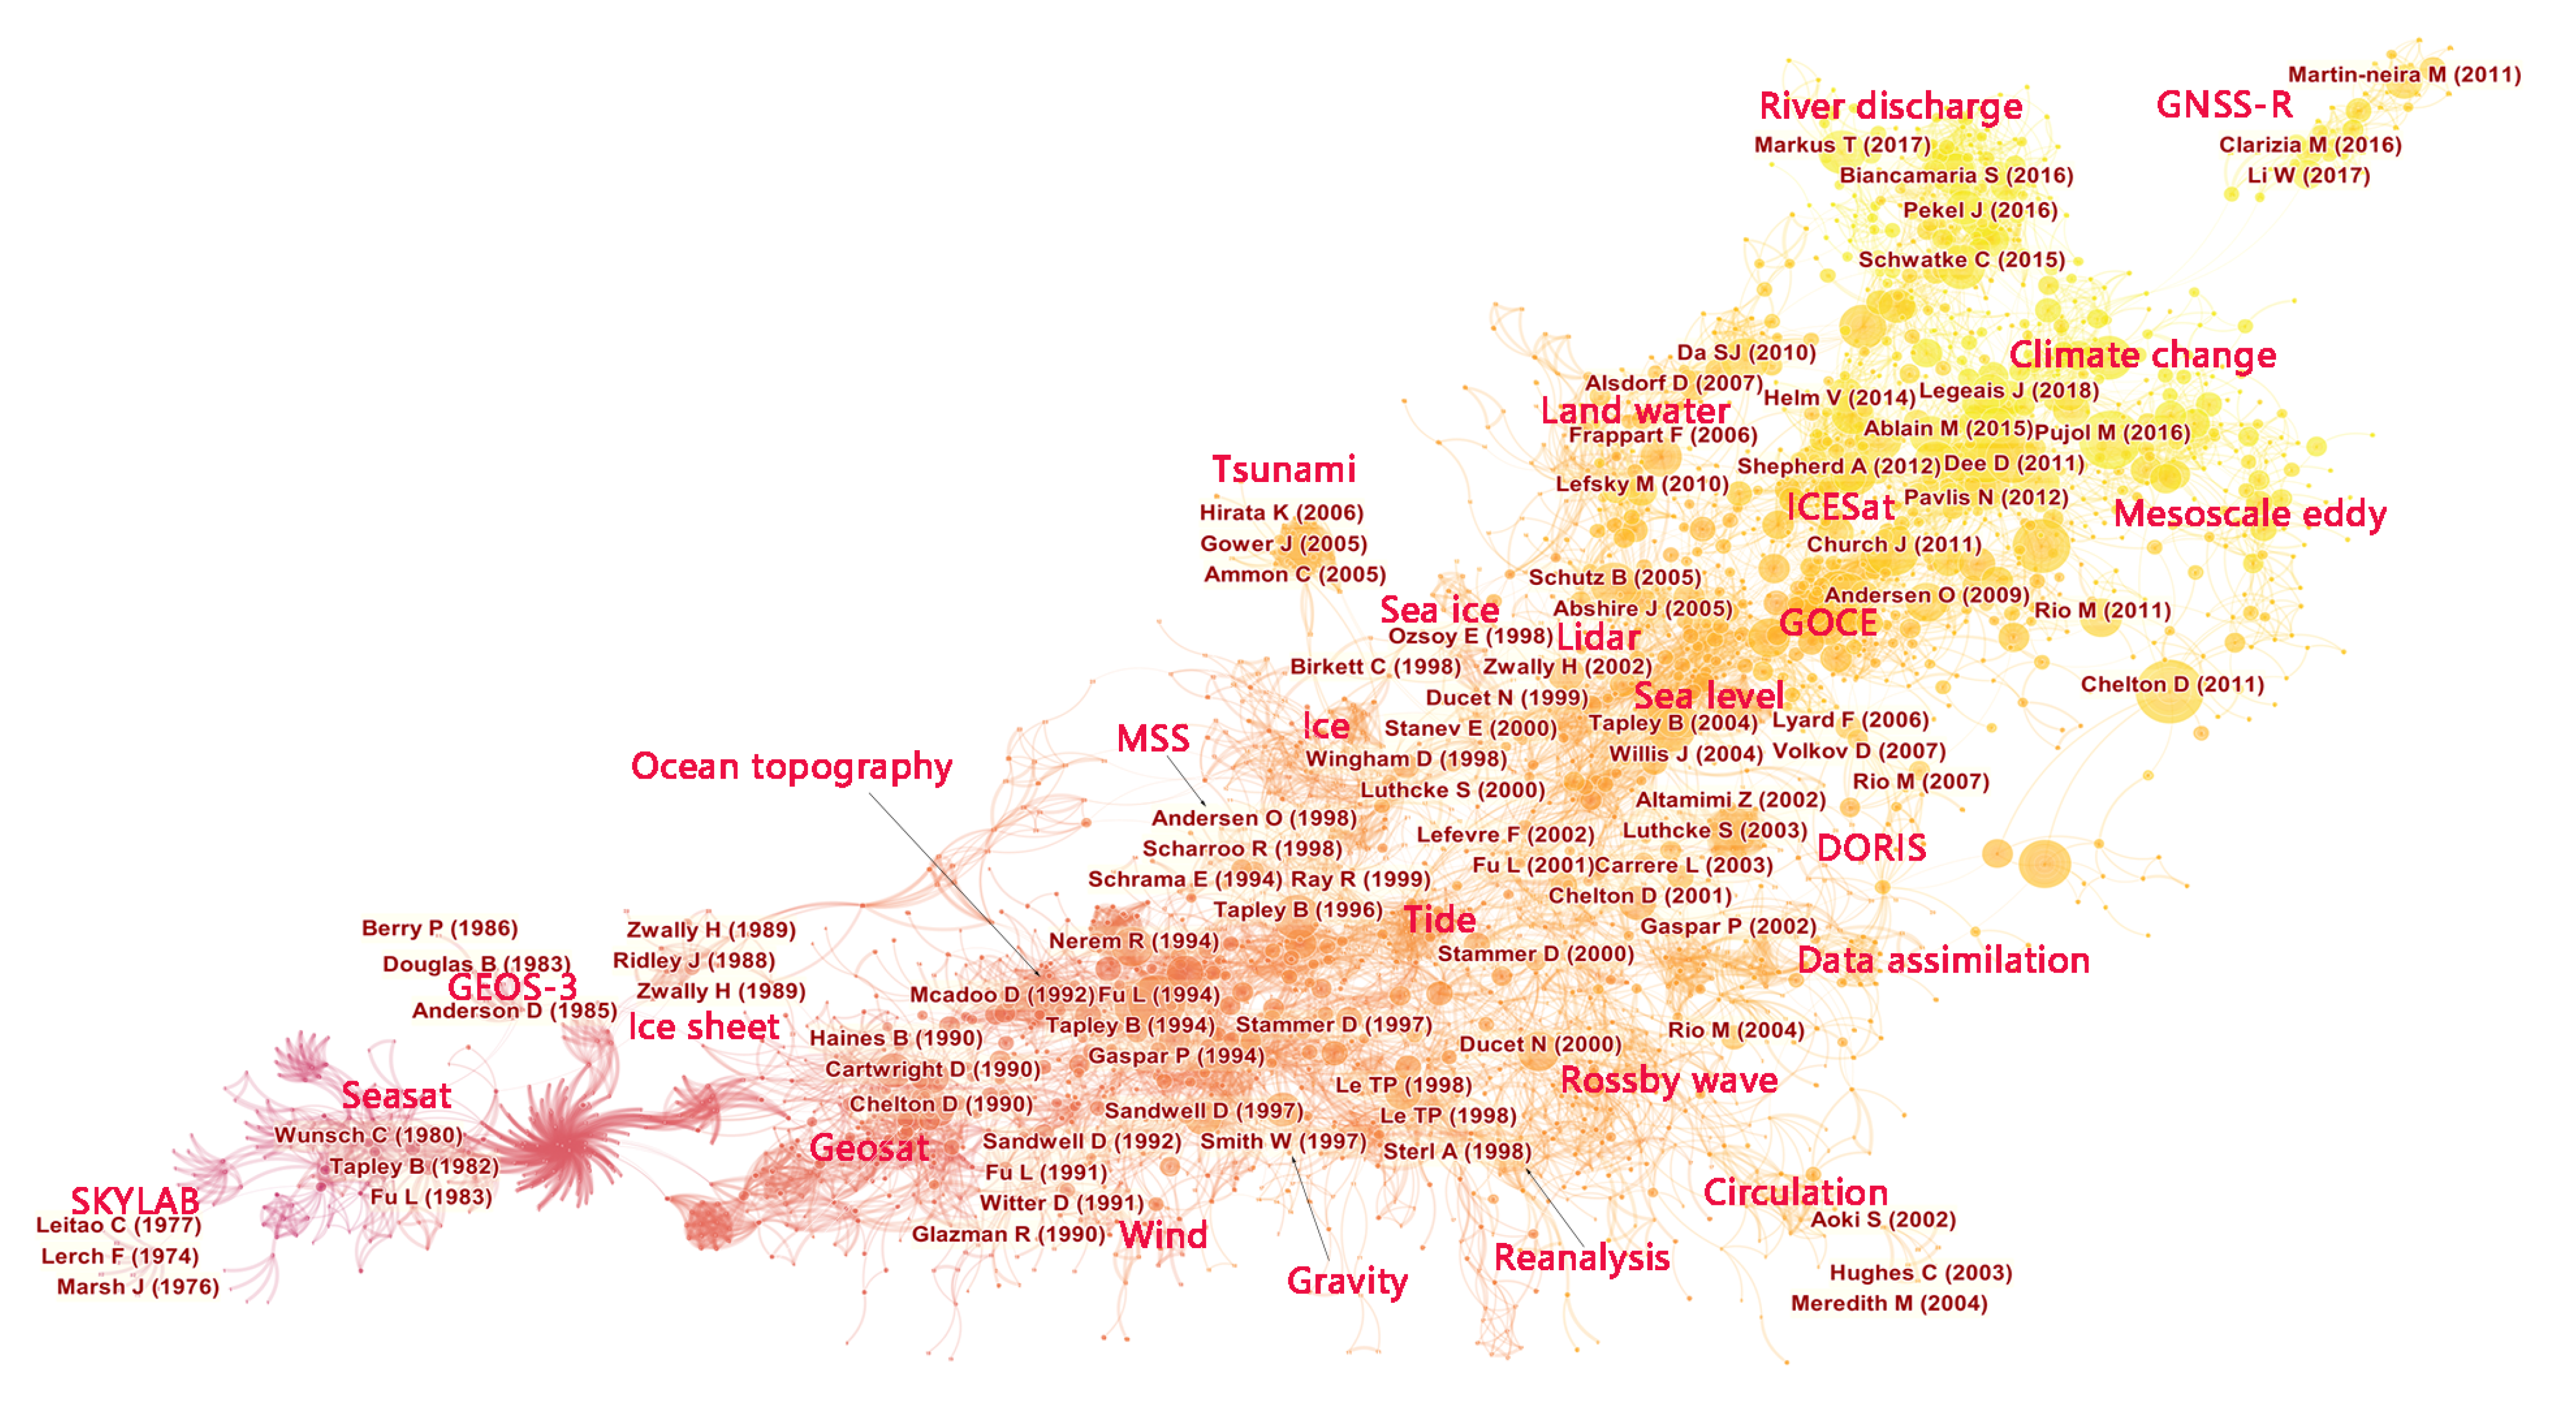
3.5. Network of Co-Citation

Through the connections between key paper nodes, the co-citation network could reveal the entire knowledge structure, dynamics, and paradigm developments of a specific field. When two documents are cited together in the same source article, they have a co-citation relationship, and research clusters on a particular topic could be formed [81]. In a co-citation network, the betweenness centrality metric, which measures the proportion of shortest paths to which a node belongs, is employed to identify potential pivotal nodes over time [37]. High betweenness centrality is typically associated with creativity, originality, and bridging contributions in various clusters [39]. The publication values could be visualized and evaluated with the aid of frequency, burst, and betweenness centrality.
Figure 9 demonstrates the main network structure of co-cited references derived from satellite-altimetry-related documents from 1970 to 2021. This co-citation network consists of 2426 nodes and 10,350 links. The network was divided into 38 clusters with the modularity (Q value) of 0.8673, and the mean silhouette (S value) of 0.9399, indicating that the quality and reliability of the categorized clusters are high. In Figure 9, the size of each node is proportional to the total co-citation frequency of the associated reference. Each line between nodes in Figure 9 represents at least one co-citation link between the two references [38].
An interesting finding in Figure 9 is that scientific publications in the satellite altimetry field exhibit time characteristics [38], with the earliest works appearing on the left and the latest on the right. For instance, the publications relating to the Skylab and Seasat satellite missions are located in the lower left side of the network, while the publications referring to the GNSS-R frontier are located in the upper right corner. Compared to large-scale research on geodesy and ocean circulation in the 1970s, which relied on relatively low-precision data, satellite altimetry has now been significantly expanded to encompass a wide range of topics, including the cryosphere, land hydrology, and climate change.
According to the findings, the research paper on nonlinear mesoscale eddies carried out by Chelton D. et al. is the one being cited more frequently than any other in the field of satellite altimetry [82]. This study examined 1.15 million individual eddy observations using sixteen years of sea-surface height data. The findings of this study highlight the predominance of westward propagations by nonlinear mesoscale eddies, which significantly supported the research of oceanic transports and physical–biological interaction [83,84]. Moreover, four of the other top five co-cited papers are about reprocessed multi-mission altimeter data [85], overviews of ICESat-2 and TOPEX/Poseidon missions [4,86], and overview of the ERA-Interim reanalysis [87]. We also notice that the overview of the Earth Gravitational Model 2008 [88], CNES-CLS09 global mean dynamic topography model [89], and SWOT Mission for Land Hydrology [90] were also listed in the high co-citation papers. Such publications comprise the key knowledge for contemporary satellite altimetry.
Using the betweenness centrality and visual inspection, we also identified turning point documents that serve as intellectual bridges from one time slice to the next [42]. Tapley B et al., the authors of the paper with the highest betweenness centrality, reported the novel gravity field adopted for the re-release of TOPEX/Poseidon altimeter data [91]. Since then, the accuracy of orbit determination for the TOPEX/Poseidon has been greatly enhanced, as has the accuracy of the sea surface height. Therefore, this publication may bridge the research fields of geodesy and oceanography that rely on SSH data with high precision. The research on oceanic tides by D. Cartwright et al. [92] is among the other works with a strong betweenness centrality, following with the mantle geophysical research by D. Mcconathy [93] and electromagnetic error analysis by E. Walsh [94], etc. Although not all of the pivotal documents receive high citation scores, the results indicate that these publications may serve as intellectual linchpins between distinct research clusters.

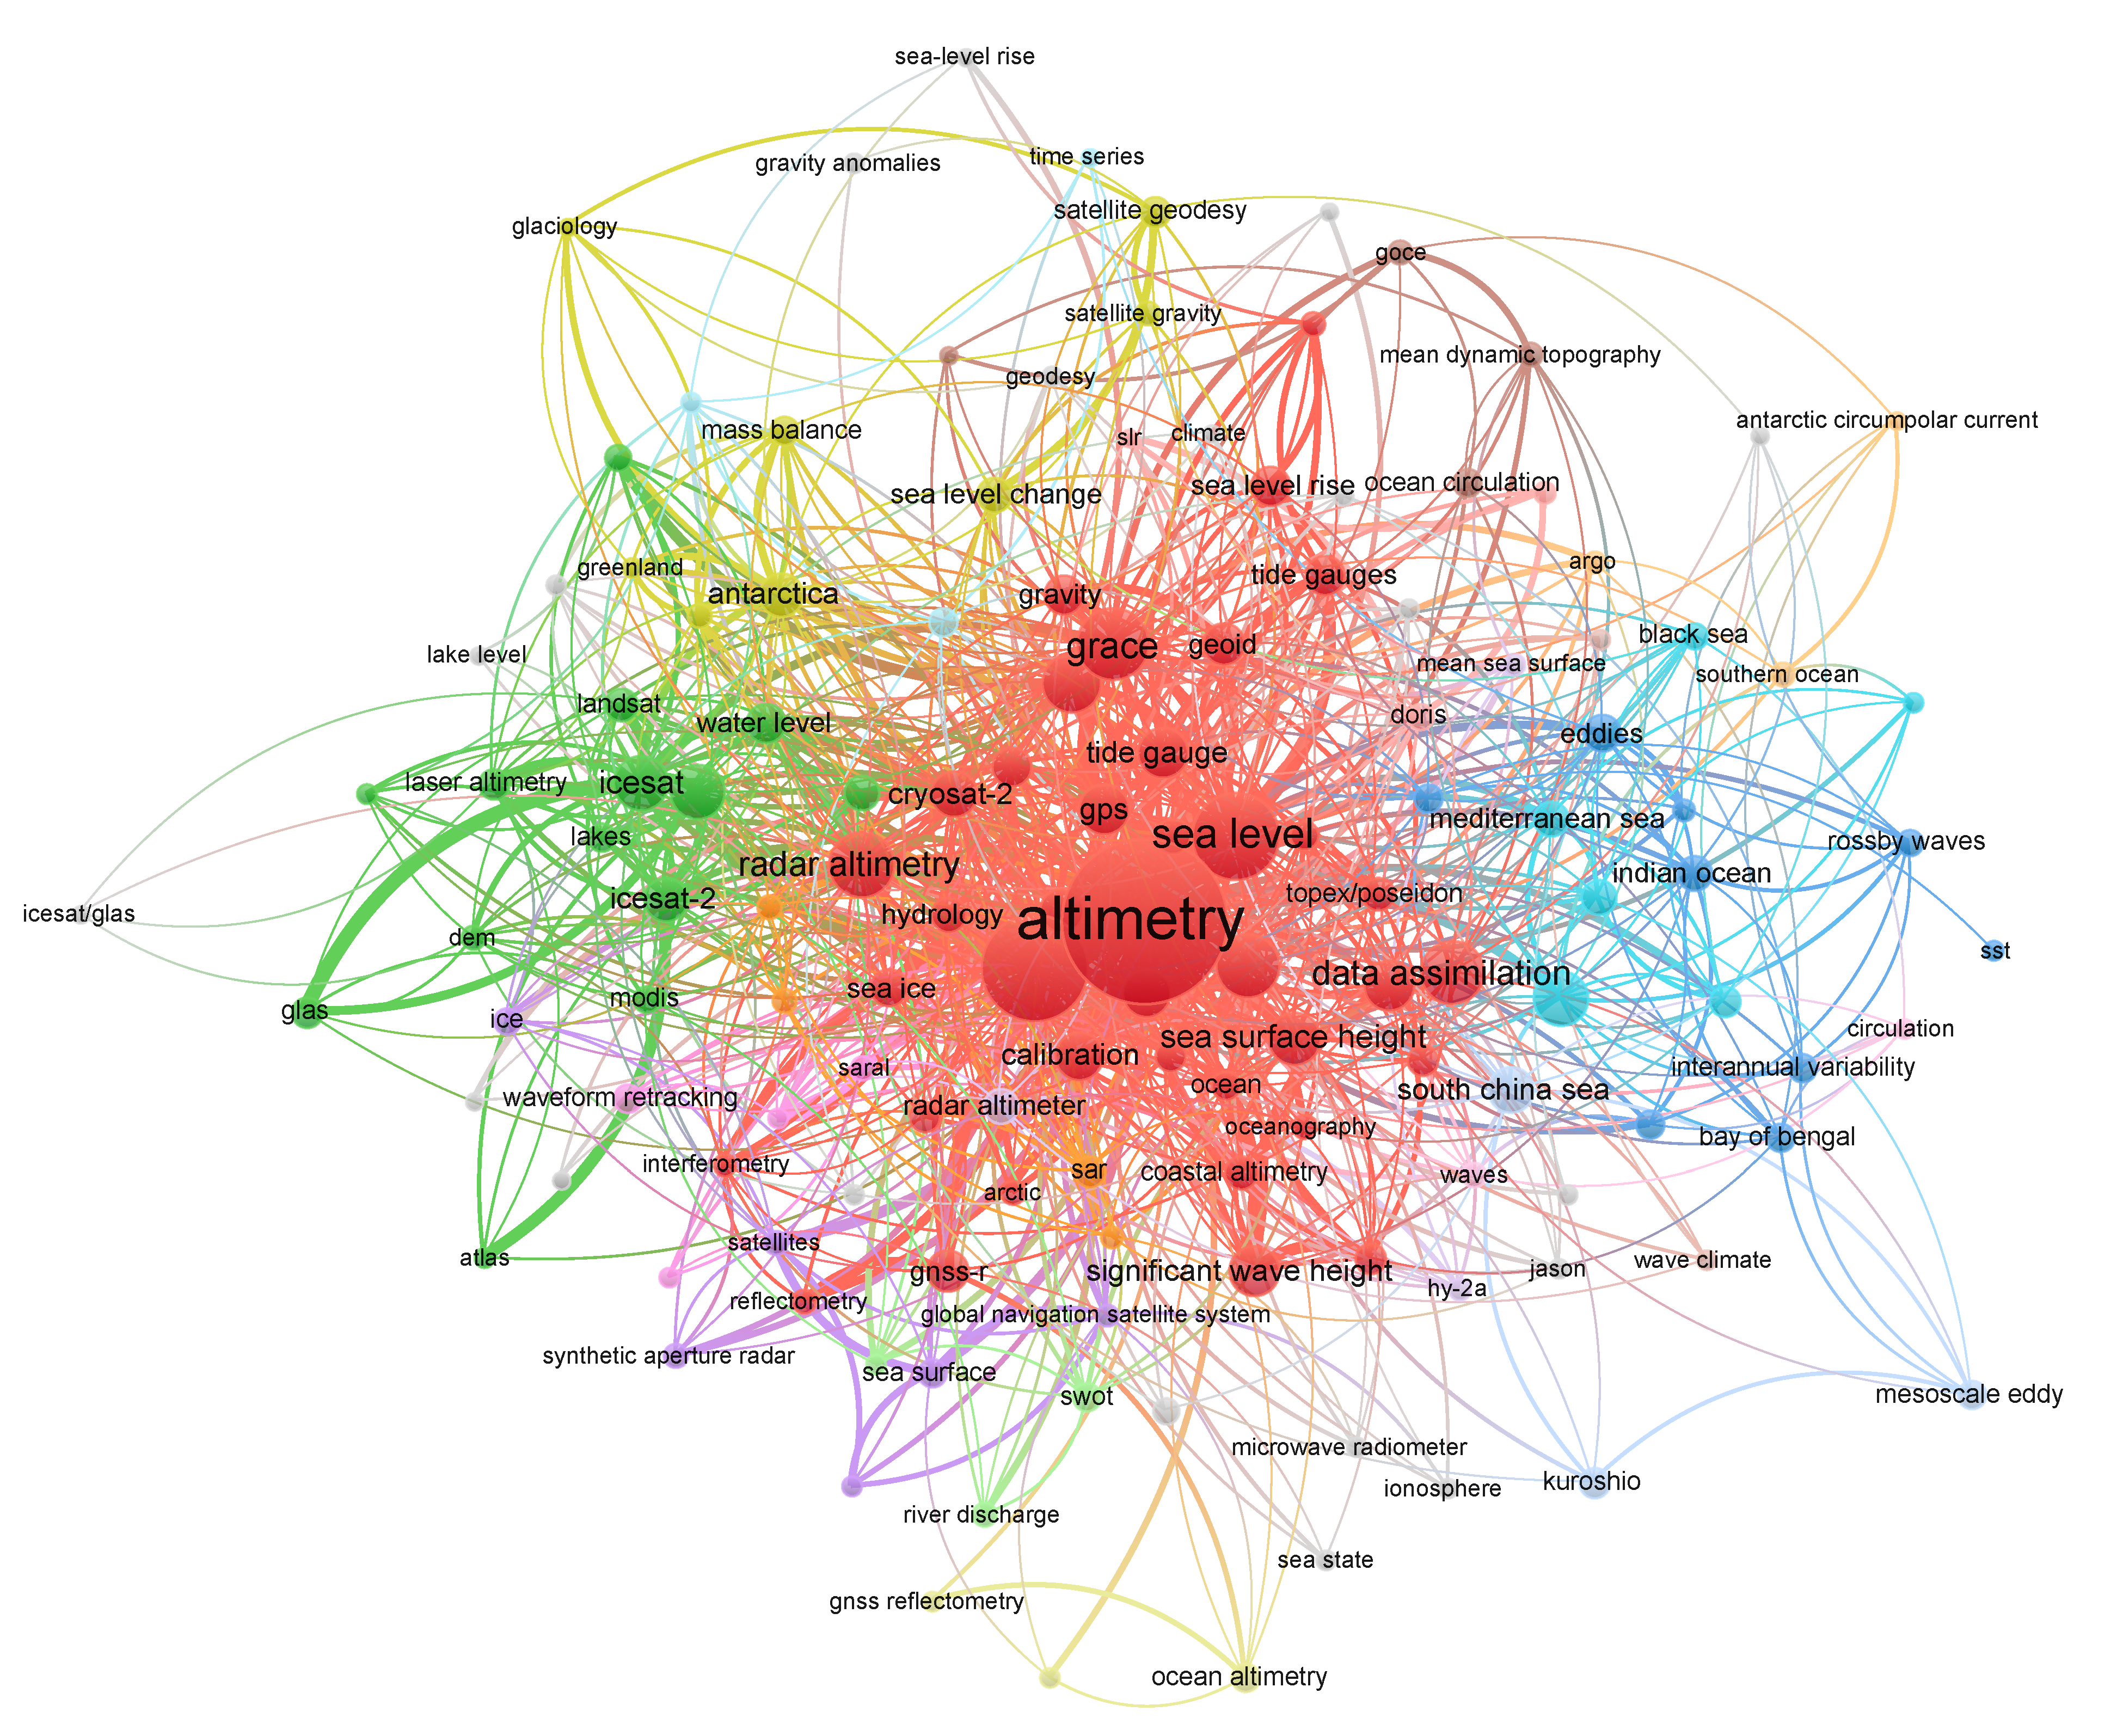
3.6. Common Interests in Research Topics

Since the beginning of satellite altimetry research occurred in the 1970s, research interests have been shifted dramatically during the past half century. Research keywords are a highly condensed representation of a paper’s content and could represent its central aspect. Up to 11,215 keywords were found in the WoS data set, showing a wide variety of satellite altimetry study areas.
Figure 10 demonstrates the co-occurrence distribution of the author’s keywords, which were classified into five groups based on similarity. The five clusters can be synthesized as follows: radar altimeter, laser altimeter, novel altimeter technology, ocean dynamics, and ocean geodesy.
The most frequently occurring keywords for the first cluster radar altimeter include sea surface height, significant wave height, calibration and validation, sea level anomaly, tides, precise orbit determination, gravity anomalies, as well as the satellite mission names Jason-1, Jason-2, SARAL, HY-2, etc. The majority of keywords in this cluster relate to the data processing of conventional radar altimeters and their prevalent applications [32,95,96,97]. The second cluster consists of the keywords ICESat, CryoSat-2, ICESat-2, laser altimetry, antarctica, Landsat, lakes, ice sheet, and Tibetan plateau, which are primarily associated with laser altimetry and its applications over ice and lakes. The third group of terms comprises GNSS reflectometry, SWOT, river discharge, synthetic aperture radar, and interferometry. Clearly, this cluster is focused on the novel radar altimetry technology and its unique applicability across land and sea. The fourth cluster includes data assimilation, mesoscale eddies, south china sea, eddies, indian ocean, kuroshio, El Nio–Southern Oscillation (ENSO), interannual variability, rossby waves, Southern Ocean, argo, circulation, eddy kinetic energy, and Pacific Ocean as keywords. The majority of these terms are associated with oceanography and ocean dynamics. The final cluster contains the keywords satellite geodesy, GOCE, satellite gravity, mean dynamic topography, and gravity field, which are clearly associated with marine geodesy.

3.7. Research Trend and Front

The above keyword analysis was based on statistical information and gives a brief overview of satellite altimetry studies. However, it is unable to provide the temporal progression of trending themes. In order to assess the research trend and front, we first analysed the temporal evolution of publications of the top 10 categories and the satellite missions over the past half century. Then, we analysed the keywords burst over the last five years.
Figure 11 shows the annual publications for top 10 categories of the satellite altimetry. The Environmental Science shows the greatest increasing trend in last 10 years, mainly focusing on the research of forest, lake/river/reservoirs water level, wetlands, glaciers, and sea level change [98,99,100,101,102,103,104,105]. According to the WoS categories, the Imaging Science Photographic Technology is heavily overlapped with the Environmental Science for satellite altimetry, and it similarly shows the rising trend. The categories of Remote Sensing and Geosciences Multidisciplinary also have strong trend of growth. However, because the two groups cover such a broad spectrum of topics, it is challenging to make any generalizations. Geophysics, which mostly focuses on gravity and bathymetry, has shown a decreasing tendency over the last decade. We hypothesize that there may be some technical impediments for geophysics research using present satellite altimetry data, and it might be overcome by launching cutting-edge missions like the SWOT [10].
Due to the fact that each mission has its own unique characteristics and applications, the trend of one satellite mission may mirror the trend of particular research fields. The publications associated with specific satellite missions were examined in order to illustrate the distribution of literature according to the altimetry satellite mission. Figure 12 displays the annual documents for 15 different satellite missions. Due to the development of POD and related correction models, the TOPEX/Poseidon mission was the first one to achieve a sea-surface height accuracy of 2–3 cm. Consequently, it is evident that TOPEX/Poseidon-related publications exhibited a considerable increase tendency between 1990 and 2004, essentially encompassing their whole lifespan. After 2004, there is a downward trend in TOPEX/Poseidon-related publications.
In recent years, the literature on laser altimetry missions (ICESat and ICESat-2) and SAR altimetry missions (CryoSat and Sentinel-3A/B) has exhibited a high growth trend, which may imply that the polar, ice, and terrestrial rivers/lakes are currently hot research subjects [106,107,108,109]. In spite of the fact that the HY-2 mission has a total of four satellites (HY-2 A, B, C, and D), the number of publications associated with the HY-2 mission is rather low when compared to those associated with other missions. In addition, the majority of the HY-2-related publications were from Chinese authors (172 out of 182 papers), and the calibration and validation topic is the most pertinent. It was reasonable to anticipate that the variety of uses for HY-2 data would explode because the data were made available in a more open manner and the quality was enhanced [110,111]. Another remarkable discovery was that even though the SWOT mission has not yet been launched, it shows a tendency of research interest. The majority of the SWOT-related publications have focused on validation experiments, model simulations of ocean and land hydrology, data assimilation, and error analysis [112,113,114,115]. For the near-term SWOT mission, designed to investigate sub-mesoscale ocean dynamics and terrestrial hydrology, there will be an explosion of research in these fields.
In addition, we assessed the topical trend based on the evolution of key words. Here, we examine satellite altimetry research conducted after 2015 to identify the most recent trends. The results show that internal gravity wave, one significant study topic for SWOT mission and ocean mixing in submesoscale dynamic processes, is the most frequently noted in publications in 2020–2021 [116,117,118,119]. Another prominent research key word is the terrestrial hydrology, focusing on the river, lake, and reservoir water levels and rating curves using CryoSat-2, ICESat-2, Sentinel-3A/B, and SWOT simulation data [120,121,122,123]. In addition, the Arctic and Tibetan plateaus are hot issues, which primarily involve the study of sea ice, snow, glaciers, and Tibetan lakes and adopt the data of CryoSat-2 and ICESat-2 [124,125,126,127,128]. Finally, we detected a surging of diverse deep learning topics covering nearly all possibilities of satellite altimetry, such as SWH prediction, SSH reconstruction, eddy detection, 3D ocean state estimation, eddy heat flux estimation, and surface current derivation [129,130,131,132,133,134,135,136,137]. The majority of current research trends, according to the analysis, are related to innovative altimetry technologies (such as SAR altimetry and interferometer altimetry) and cross-disciplines (such as the computer and information science of deep learning technology).

4. Scope and Limitations of This Analysis

In this research, the WoS Core Collection was used only for the scientometric analysis. In addition to the WoS, other significant databases, such as the CNKI in China and CiNii in Japan, are frequently used in particular countries. Additionally, restricted phrases (“satellite altimet*” mostly includes “satellite altimeter” or “satellite altimetry”) were utilized as search terms in the WoS database. However, such search keywords may exclude some multidisciplinary publications that are relevant to the satellite altimetry field. The used software and settings may also have a minor effect on the outcomes. Therefore, we acknowledge that scientometrics results may vary depending on the database, search terms, and program used.
More important, our co-occurrence analysis was based on an assumption that the structure of scientific knowledge can be essentially captured through semantically similar text and explicit citation links [38]. There are still concerns over the validity of such an assumption. All of the conclusions reported in this work must be considered in light of these constraints.

5. Conclusions

Using scientometrics analysis, we provided a complete overview of satellite altimetry research papers from 1970 to 2021. Our analysis consisted of bibliometric data regarding to annual publication counts, subject categories, source journals, nations, organizations, and keywords. To depict spatial trends, collaborations, and research hotspots in satellite altimetry research, co-occurrence and co-citation networks were created.
Since the launch of TOPEX/Poseidon in the 1990s, the quantity of satellite altimetry research publications has increased significantly. Currently, the number of documents published annually exceeds 600 and continues to expand exponentially, indicating that an increasing number of researchers are participating in this subject. The oceanography is the largest research category, followed by the multidisciplinary geoscience and remote sensing. The geographic distribution analysis demonstrates that the satellite altimetry research is globally involved. The United States, France, China, the United Kingdom, and Germany were the most productive research nations. NASA, CNRS, IRD, and CAS are the most fruitful research organizations. The United States, China, and the European Union have the strongest international collaboration. The most popular journals adopted by researchers are well-known journals such as JGR-Oceans, GRL, RS, JPO, and ASR, with RS trending upwards the most. In terms of the production and influence, Shum CK, Cazenave A, Andersen OB, Camps A, Chapron B, Ricker HA, Fu LL, and Qiu B are the most distinguished authors.
In the past 50 years, satellite altimetry research has advanced at a remarkable rate. Satellite altimetry’s current study topic has been continuously extended greatly since its beginnings. Despite the usual applications of satellite altimetry (oceanography and geodesy), numerous publications referred to continental hydrology, the cryosphere, land topography, and even forest and soil monitoring. The accuracy of altimetry measurements (mostly sea-surface height) has improved dramatically, and the spatial/temporal resolution of the combined altimetry data has been seen significant progress, which has greatly facilitated the use of altimetry for fine-scale oceanography.
From 1970 to 2021, research topics have developed into several clusters, ranging from the theoretical study and uses of the classical radar altimeter to the SAR altimetry, GNSS-R, and wide-swath altimetry. The analysis of research trends reveals that cutting-edge topics are closely related to the new altimetry technologies (such as the application of SAR altimetry to the land hydrology and polar area). Particularly, as the SWOT mission is expected to be launched in 2022, satellite altimetry is rapidly transitioning from “grid” to “pixel” resolution phases [138,139,140]. In the near future, it is anticipated that more unique topics related to this new altimetry technique will be explored. In addition, collaboration with deep learning is a cutting-edge field in satellite altimetry.

Author Contributions

Conceptualization, L.Y.; methodology, L.L.; software, L.Y.; validation, N.L.; formal analysis, L.Y.; investigation, L.H.; resources, N.L.; data curation, L.Y.; writing—original draft preparation, L.Y.; writing—review and editing, Y.X. and S.P.M.; visualization, L.Y.; supervision, N.L. and M.L.; project administration, L.F. and Y.J.; funding acquisition, N.L. All authors have read and agreed to the published version of the manuscript.

Funding

This research was funded by the Key Laboratory of Marine Environmental Survey Technology and Application Ministry of Natural Resource (MESTA-2020-B010), National Natural Science Foundation of China (41806214) and Global Change and Air-Sea Interaction (ZY0722031). We acknowledge the support of the Dragon 5 Cooperation (2020–2024) Project of the European Space Agency and the National Remote Sensing Center of China (NRSCC, under MOST) with Principal Investigators Prof. S. P. Mertikas (Technical University of Crete, Chania, Greece) and Prof. Mingsen Lin (NSOAS, Beijing, China).

Acknowledgments

The free software Bibliometrix, CiteSpace, and VOSviewer were used for scientometric analysis. The Geocode (https://geocode.xyz/api) (accessed on 4 April 2022) was used for parsing geographical locations of afflictions. Part of figures were created by the Generic Mapping Tools (GMT) and Python. Data and Code for visualisation are stored at Github https://github.com/yangleir/RemoteSensing_paper (accessed on 4 April 2022).

Conflicts of Interest

The authors declare no conflict of interest.

Abbreviations

The following abbreviations are used in this manuscript:
SCI-EScience Citation Index-Expanded
GNSSGlobal Navigation Satellite System
GNSS-RGNSS reflectometry
T/PTOPEX/Poseidon
SWOTSurface Water and Ocean Topography
WoSWeb of Science
SSHSea Surface Height
PODPrecise Orbit Determination
CNKIChina National Knowledge Infrastructure
OAOpen Access

References

  1. Pierson, W.J., Jr.; Mehr, E. Average Return Pulse Form and Bias for the S193 Radar Altimeter on Skylab as a Function of Wave Conditions. In The Use of Artificial Satellites for Geodesy; American Geophysical Union (AGU): Washington, DC, USA, 1972; pp. 217–226. [Google Scholar] [CrossRef]
  2. Fu, L.L.; Lee, T.; Liu, W.T.; Kwok, R. 50 Years of Satellite Remote Sensing of the Ocean. Meteorol. Monogr. 2019, 59, 5.1–5.46. [Google Scholar] [CrossRef]
  3. Vignudelli, S.; Kostianoy, A.G.; Cipollini, P.; Benveniste, J. (Eds.) Coastal Altimetry; Springer: Berlin/Heidelberg, Germany, 2011. [Google Scholar] [CrossRef] [Green Version]
  4. Fu, L.L.; Christensen, E.J.; Yamarone, C.A.; Lefebvre, M.; Ménard, Y.; Dorrer, M.; Escudier, P. TOPEX/POSEIDON mission overview. J. Geophys. Res. Ocean. 1994, 99, 24369–24381. [Google Scholar] [CrossRef]
  5. Lin, M.; Jia, Y. Past, Present and Future Marine Microwave Satellite Missions in China. Remote Sens. 2022, 14, 1330. [Google Scholar] [CrossRef]
  6. Donlon, C.J.; Cullen, R.; Giulicchi, L.; Vuilleumier, P.; Francis, C.R.; Kuschnerus, M.; Simpson, W.; Bouridah, A.; Caleno, M.; Bertoni, R.; et al. The Copernicus Sentinel-6 mission: Enhanced continuity of satellite sea level measurements from space. Remote Sens. Environ. 2021, 258, 112395. [Google Scholar] [CrossRef]
  7. Lambin, J.; Morrow, R.; Fu, L.L.; Willis, J.K.; Bonekamp, H.; Lillibridge, J.; Perbos, J.; Zaouche, G.; Vaze, P.; Bannoura, W.; et al. The OSTM/Jason-2 Mission. Mar. Geod. 2010, 33, 4–25. [Google Scholar] [CrossRef]
  8. Tran, N.; Girard-Ardhuin, F.; Ezraty, R.; Feng, H.; Femenias, P. Defining a Sea Ice Flag for Envisat Altimetry Mission. Geosci. Remote Sens. Lett. 2009, 6, 77–81. [Google Scholar] [CrossRef] [Green Version]
  9. Wang, X.; Gong, P.; Zhao, Y.; Xu, Y.; Cheng, X.; Niu, Z.; Luo, Z.; Huang, H.; Sun, F.; Li, X. Water-level changes in China’s large lakes determined from ICESat/GLAS data. Remote Sens. Environ. 2013, 132, 131–144. [Google Scholar] [CrossRef]
  10. Yu, D.; Hwang, C.; Andersen, O.B.; Chang, E.T.Y.; Gaultier, L. Gravity recovery from SWOT altimetry using geoid height and geoid gradient. Remote Sens. Environ. 2021, 265, 112650. [Google Scholar] [CrossRef]
  11. Fu, L.L.; Chelton, D.B.; Le Traon, P.Y.; Morrow, R. Eddy dynamics from satellite altimetry. Oceanography 2010, 23, 14–25. [Google Scholar] [CrossRef] [Green Version]
  12. Sandwell, D.T.; Smith, W.H.F. Global marine gravity from retracked Geosat and ERS-1 altimetry: Ridge segmentation versus spreading rate. J. Geophys. Res. Solid Earth 2009, 114, B01411. [Google Scholar] [CrossRef] [Green Version]
  13. Eppelbaum, L.V.; Katz, Y.I. Combined Zonation of the African-Levantine-Caucasian Areal of Ancient Hominin: Review and Integrated Analysis of Paleogeographical, Stratigraphic and Geophysical-Geodynamical Data. Geosciences 2022, 12, 21. [Google Scholar] [CrossRef]
  14. Mori, M.; Corney, S.P.; Melbourne-Thomas, J.; Welsford, D.C.; Klocker, A.; Ziegler, P.E. Using satellite altimetry to inform hypotheses of transport of early life stage of Patagonian toothfish on the Kerguelen Plateau. Ecol. Model. 2016, 340, 45–56. [Google Scholar] [CrossRef] [Green Version]
  15. Wunsch, C.; Gaposchkin, E. On Using Satellite Altimetry to Determine the General-Circulation of the Oceans with Application to Geoid Improvement. Rev. Geophys. 1980, 18, 725–745. [Google Scholar] [CrossRef]
  16. Fu, L. Recent Progress in the Application of Satellite Altimetry to Observing the Mesoscale Variability and General-Circulation of the Oceans. Rev. Geophys. 1983, 21, 1657–1666. [Google Scholar] [CrossRef]
  17. Chelton, D.; Mccabe, P. A review of satellite altimeter measurement of sea surface wind speed: With a proposed new algorithm. J. Geophys. Res. Part Ocean. Atmos. 1985, 90, 4707–4720. [Google Scholar] [CrossRef]
  18. Douglas, B.; Mcadoo, D.; Cheney, R. Oceanographic and Geophysical Applications of Satellite Altimetry. Rev. Geophys. 1987, 25, 875–880. [Google Scholar] [CrossRef]
  19. Sandwell, D. Geophysical Applications of Satellite Altimetry. Rev. Geophys. 1991, 29, 132–137. [Google Scholar] [CrossRef]
  20. Fu, L.; Cheney, R. Application of Satellite Altimetry to Ocean Circulation Studies - 1987–1994. Rev. Geophys. 1995, 33, 213–223. [Google Scholar] [CrossRef]
  21. Calmant, S.; Baudry, N. Modelling bathymetry by inverting satellite altimetry data: A review. Mar. Geophys. Res. 1996, 18, 123–134. [Google Scholar] [CrossRef]
  22. Smith, W.H.F. Seafloor tectonic fabric from satellite altimetry. Annu. Rev. Earth Planet. Sci. 1998, 26, 697–747. [Google Scholar] [CrossRef]
  23. Remy, F.; Legresy, B.; Testut, L. Ice sheet and satellite altimetry. Surv. Geophys. 2001, 22, 1–29. [Google Scholar] [CrossRef]
  24. Calmant, S.; Seyler, F.; Cretaux, J.F. Monitoring Continental Surface Waters by Satellite Altimetry. Surv. Geophys. 2008, 29, 247–269. [Google Scholar] [CrossRef]
  25. Papa, F. Surface Water Storage in Rivers and Wetlands Derived from Satellite Observations: A Review of Current Advances and Future Opportunities for Hydrological Sciences. Remote Sens. 2021, 13, 4162. [Google Scholar] [CrossRef]
  26. Chaigneau, A.; Eldin, G.; Dewitte, B. Eddy activity in the four major upwrelling systems from satellite altimetry (1992–2007). Prog. Oceanogr. 2009, 83, 117–123. [Google Scholar] [CrossRef]
  27. Rubio, A.; Blanke, B.; Speich, S.; Grima, N.; Roy, C. Mesoscale eddy activity in the southern Benguela upwelling system from satellite altimetry and model data. Prog. Oceanogr. 2009, 83, 288–295. [Google Scholar] [CrossRef]
  28. Ablain, M.; Legeais, J.F.; Prandi, P.; Marcos, M.; Fenoglio-Marc, L.; Dieng, H.B.; Benveniste, J.; Cazenave, A. Satellite Altimetry-Based Sea Level at Global and Regional Scales. Surv. Geophys. 2017, 38, 7–31. [Google Scholar] [CrossRef]
  29. Cazenave, A.; Palanisamy, H.; Ablain, M. Contemporary sea level changes from satellite altimetry: What have we learned? What are the new challenges? Adv. Space Res. 2018, 62, 1639–1653. [Google Scholar] [CrossRef]
  30. Carret, A.; Johannessen, J.A.; Andersen, O.B.; Ablain, M.; Prandi, P.; Blazquez, A.; Cazenave, A. Arctic Sea Level During the Satellite Altimetry Era. Surv. Geophys. 2017, 38, 251–275. [Google Scholar] [CrossRef]
  31. MacIntosh, C.R.; Merchant, C.J.; von Schuckmann, K. Uncertainties in Steric Sea Level Change Estimation During the Satellite Altimeter Era: Concepts and Practices. Surv. Geophys. 2017, 38, 59–87. [Google Scholar] [CrossRef]
  32. Vignudelli, S.; Birol, F.; Benveniste, J.; Fu, L.L.; Picot, N.; Raynal, M.; Roinard, H. Satellite Altimetry Measurements of Sea Level in the Coastal Zone. Surv. Geophys. 2019, 40, 1319–1349. [Google Scholar] [CrossRef]
  33. Uebbing, B.; Forootan, E.; Braakmann-Folgmann, A.; Kusche, J. Inverting surface soil moisture information from satellite altimetry over arid and semi-arid regions. Remote Sens. Environ. 2017, 196, 205–223. [Google Scholar] [CrossRef] [Green Version]
  34. Fernandes, M.J.; Lázaro, C.; Vieira, T. On the role of the troposphere in satellite altimetry. Remote Sens. Environ. 2021, 252, 112149. [Google Scholar] [CrossRef]
  35. Quartly, G.D.; Rinne, E.; Passaro, M.; Andersen, O.B.; Dinardo, S.; Fleury, S.; Guillot, A.; Hendricks, S.; Kurekin, A.A.; Müller, F.L.; et al. Retrieving Sea Level and Freeboard in the Arctic: A Review of Current Radar Altimetry Methodologies and Future Perspectives. Remote Sens. 2019, 11, 881. [Google Scholar] [CrossRef] [Green Version]
  36. Abdalla, S.; Abdeh Kolahchi, A.; Adusumilli, S.; Aich Bhowmick, S.; Alou-Font, E.; Amarouche, L.; Andersen, O.B.; Antich, H.; Aouf, L.; Arbic, B.; et al. Altimetry for the future: Building on 25 years of progress. Adv. Space Res. 2021, 68, 319–363. [Google Scholar] [CrossRef]
  37. Chen, C. CiteSpace II: Detecting and visualizing emerging trends and transient patterns in scientific literature. J. Am. Soc. Inf. Sci. Technol. 2006, 57, 359–377. [Google Scholar] [CrossRef] [Green Version]
  38. Chen, C.; Song, M. Visualizing a field of research: A methodology of systematic scientometric reviews. PLoS ONE 2019, 14, e0223994. [Google Scholar] [CrossRef] [Green Version]
  39. Chen, C. Science Mapping: A Systematic Review of the Literature. J. Data Inf. Sci. 2017, 2, 1–40. [Google Scholar] [CrossRef] [Green Version]
  40. Van Eck, N.J.; Waltman, L. Software survey: VOSviewer, a computer program for bibliometric mapping. Scientometrics 2010, 84, 523–538. [Google Scholar] [CrossRef] [Green Version]
  41. Aria, M.; Cuccurullo, C. bibliometrix: An R-tool for comprehensive science mapping analysis. J. Inf. 2017, 11, 959–975. [Google Scholar] [CrossRef]
  42. Chen, C. Searching for intellectual turning points: Progressive knowledge domain visualization. Proc. Natl. Acad. Sci. USA 2004, 101, 5303–5310. [Google Scholar] [CrossRef] [Green Version]
  43. Yu, D. A scientometrics review on aggregation operator research. Scientometrics 2015, 105, 115–133. [Google Scholar] [CrossRef]
  44. Li, T.; Cui, L.; Xu, Z.; Hu, R.; Joshi, P.K.; Song, X.; Tang, L.; Xia, A.; Wang, Y.; Guo, D.; et al. Quantitative Analysis of the Research Trends and Areas in Grassland Remote Sensing: A Scientometrics Analysis of Web of Science from 1980 to 2020. Remote Sens. 2021, 13, 1279. [Google Scholar] [CrossRef]
  45. Zhao, Q.; Yu, L.; Li, X.; Peng, D.; Zhang, Y.; Gong, P. Progress and Trends in the Application of Google Earth and Google Earth Engine. Remote Sens. 2021, 13, 3778. [Google Scholar] [CrossRef]
  46. Wu, Y.; Wang, H.; Wang, Z.; Zhang, B.; Meyer, B.C. Knowledge Mapping Analysis of Rural Landscape Using CiteSpace. Sustainability 2020, 12, 66. [Google Scholar] [CrossRef] [Green Version]
  47. Yu, D.; Xu, C. Mapping research on carbon emissions trading: A co-citation analysis. Renew. Sustain. Energy Rev. 2017, 74, 1314–1322. [Google Scholar] [CrossRef]
  48. Fang, Y.; Yin, J.; Wu, B. Climate change and tourism: A scientometric analysis using CiteSpace. J. Sustain. Tour. 2017, 26, 108–126. [Google Scholar] [CrossRef]
  49. Duan, P.; Wang, Y.; Yin, P. Remote Sensing Applications in Monitoring of Protected Areas: A Bibliometric Analysis. Remote Sens. 2020, 12, 772. [Google Scholar] [CrossRef] [Green Version]
  50. Rashidi, M.; Mohammadi, M.; Sadeghlou Kivi, S.; Abdolvand, M.M.; Truong-Hong, L.; Samali, B. A Decade of Modern Bridge Monitoring Using Terrestrial Laser Scanning: Review and Future Directions. Remote Sens. 2020, 12, 3796. [Google Scholar] [CrossRef]
  51. Wang, L.; Zhang, G.; Wang, Z.; Liu, J.; Shang, J.; Liang, L. Bibliometric Analysis of Remote Sensing Research Trend in Crop Growth Monitoring: A Case Study in China. Remote Sens. 2019, 11, 809. [Google Scholar] [CrossRef] [Green Version]
  52. Hu, K.; Qi, K.; Guan, Q.; Wu, C.; Yu, J.; Qing, Y.; Zheng, J.; Wu, H.; Li, X. A Scientometric Visualization Analysis for Night-Time Light Remote Sensing Research from 1991 to 2016. Remote Sens. 2017, 9, 802. [Google Scholar] [CrossRef] [Green Version]
  53. Viana, J.; Santos, J.V.; Neiva, R.M.; Souza, J.; Duarte, L.; Teodoro, A.C.; Freitas, A. Remote Sensing in Human Health: A 10-Year Bibliometric Analysis. Remote Sens. 2017, 9, 1225. [Google Scholar] [CrossRef] [Green Version]
  54. Bielecka, E.; Jenerowicz, A. Intellectual Structure of CORINE Land Cover Research Applications in Web of Science: A Europe-Wide Review. Remote Sens. 2019, 11, 2017. [Google Scholar] [CrossRef] [Green Version]
  55. Bajocco, S.; Raparelli, E.; Teofili, T.; Bascietto, M.; Ricotta, C. Text Mining in Remotely Sensed Phenology Studies: A Review on Research Development, Main Topics, and Emerging Issues. Remote Sens. 2019, 11, 2751. [Google Scholar] [CrossRef] [Green Version]
  56. Pricope, N.G.; Mapes, K.L.; Woodward, K.D. Remote Sensing of Human–Environment Interactions in Global Change Research: A Review of Advances, Challenges and Future Directions. Remote Sens. 2019, 11, 2783. [Google Scholar] [CrossRef] [Green Version]
  57. Ogashawara, I. Determination of Phycocyanin from Space—A Bibliometric Analysis. Remote Sens. 2020, 12, 567. [Google Scholar] [CrossRef] [Green Version]
  58. Jiménez-Lao, R.; Aguilar, F.J.; Nemmaoui, A.; Aguilar, M.A. Remote Sensing of Agricultural Greenhouses and Plastic-Mulched Farmland: An Analysis of Worldwide Research. Remote Sens. 2020, 12, 2649. [Google Scholar] [CrossRef]
  59. Vasconcelos, R.N.; Lima, A.T.C.; Lentini, C.A.D.; Miranda, G.V.; Mendonça, L.F.; Silva, M.A.; Cambuí, E.C.B.; Lopes, J.M.; Porsani, M.J. Oil Spill Detection and Mapping: A 50-Year Bibliometric Analysis. Remote Sens. 2020, 12, 3647. [Google Scholar] [CrossRef]
  60. Mo, Y.; Xu, Y.; Chen, H.; Zhu, S. A Review of Reconstructing Remotely Sensed Land Surface Temperature under Cloudy Conditions. Remote Sens. 2021, 13, 2838. [Google Scholar] [CrossRef]
  61. Wang, J.; Wang, S.; Zou, D.; Chen, H.; Zhong, R.; Li, H.; Zhou, W.; Yan, K. Social Network and Bibliometric Analysis of Unmanned Aerial Vehicle Remote Sensing Applications from 2010 to 2021. Remote Sens. 2021, 13, 2912. [Google Scholar] [CrossRef]
  62. Tziolas, N.; Tsakiridis, N.; Chabrillat, S.; Demattê, J.A.M.; Ben-Dor, E.; Gholizadeh, A.; Zalidis, G.; van Wesemael, B. Earth Observation Data-Driven Cropland Soil Monitoring: A Review. Remote Sens. 2021, 13, 4439. [Google Scholar] [CrossRef]
  63. Li, Y.; Zhou, Q.; Zhang, Y.; Li, J.; Shi, K. Research Trends in the Remote Sensing of Phytoplankton Blooms: Results from Bibliometrics. Remote Sens. 2021, 13, 4414. [Google Scholar] [CrossRef]
  64. Bastos, L.M.; Froes de Borja Reis, A.; Sharda, A.; Wright, Y.; Ciampitti, I.A. Current Status and Future Opportunities for Grain Protein Prediction Using On- and Off-Combine Sensors: A Synthesis-Analysis of the Literature. Remote Sens. 2021, 13, 5027. [Google Scholar] [CrossRef]
  65. Siłuch, M.; Bartmiński, P.; Zgłobicki, W. Remote Sensing in Studies of the Growing Season: A Bibliometric Analysis. Remote Sens. 2022, 14, 1331. [Google Scholar] [CrossRef]
  66. Singh, A.P.; Yerudkar, A.; Mariani, V.; Iannelli, L.; Glielmo, L. A Bibliometric Review of the Use of Unmanned Aerial Vehicles in Precision Agriculture and Precision Viticulture for Sensing Applications. Remote Sens. 2022, 14, 1604. [Google Scholar] [CrossRef]
  67. Chen, C. A Glimpse of the First Eight Months of the COVID-19 Literature on Microsoft Academic Graph: Themes, Citation Contexts, and Uncertainties. Front. Res. Metrics Anal. 2020, 5, 607286. [Google Scholar] [CrossRef] [PubMed]
  68. Cheney, R.; Douglas, B.; Agreen, R.; Miller, L.; Milbert, D.; Porter, D. The GEOSAT Altimeter Mission: A milestone in satellite oceanography. Trans. Am. Geophys. Union 1986, 67, 1354–1355. [Google Scholar] [CrossRef]
  69. Chelton, D.; Ries, J.; Haines, B.; Fu, L.; Callahan, P. Satellite Altimetry and Earth Sciences: A Handbook of Techniques and Applications; Academic Press: San Diego, CA, USA, 2001; Volume 69. [Google Scholar]
  70. Cazenave, A.; Dominh, K.; Guinehut, S.; Berthier, E.; Llovel, W.; Ramillien, G.; Ablain, M.; Larnicol, G. Sea level budget over 2003–2008: A reevaluation from GRACE space gravimetry, satellite altimetry and Argo. Glob. Planet. Chang. 2009, 65, 83–88. [Google Scholar] [CrossRef] [Green Version]
  71. Fricker, H.A.; Padman, L. Ice shelf grounding zone structure from ICESat laser altimetry. Geophys. Res. Lett. 2006, 33. [Google Scholar] [CrossRef]
  72. Shum, C.; Schutz, B.; Tapley, B.; Zhang, B. Altimeter crossover methods for precision orbit determination and the mapping of geophysical parameters. J. Astronaut. Sci. 1990, 38, 355–368. [Google Scholar]
  73. Fu, L.L. On the wave number spectrum of oceanic mesoscale variability observed by the SEASAT altimeter. J. Geophys. Res. Ocean. 1983, 88, 4331–4341. [Google Scholar] [CrossRef]
  74. Qiu, B.; Chen, S.; Klein, P.; Ubelmann, C.; Fu, L.L.; Sasaki, H. Reconstructability of Three-Dimensional Upper-Ocean Circulation from SWOT Sea Surface Height Measurements. J. Phys. Oceanogr. 2016, 46, 947–963. [Google Scholar] [CrossRef]
  75. Zhu, C.; Guo, J.; Gao, J.; Liu, X.; Hwang, C.; Yu, S.; Yuan, J.; Ji, B.; Guan, B. Marine gravity determined from multi-satellite GM/ERM altimeter data over the South China Sea: SCSGA V1.0. J. Geod. 2020, 94, 50. [Google Scholar] [CrossRef]
  76. Zhu, C.; Guo, J.; Hwang, C.; Gao, J.; Yuan, J.; Liu, X. How HY-2A/GM altimeter performs in marine gravity derivation: Assessment in the South China Sea. Geophys. J. Int. 2019, 219, 1056–1064. [Google Scholar] [CrossRef]
  77. Guo, J.; Yang, L.; Liu, X.; Chang, X.; Hwang, C. Decadal variation of surface characteristics over Xinjiang, western China, from backscatter coefficients of T/P altimetry: Evidence of climate change. Terr. Atmos. Ocean. Sci. 2013, 24, 565–579. [Google Scholar] [CrossRef] [Green Version]
  78. Guo, J.Y.; Yang, L.; Liu, X.; Hwang, C.; Yang, H. On temporal-spatial distribution of backscatter coefficients over China determined by TOPEX/Poseidon mission. Sci.-China-Earth Sci. 2012, 55, 2068–2083. [Google Scholar] [CrossRef]
  79. Hwang, C.; Guo, J.; Deng, X.; Hsu, H.Y.; Liu, Y. Coastal Gravity Anomalies from Retracked Geosat/GM Altimetry: Improvement, Limitation and the Role of Airborne Gravity Data. J. Geod. 2006, 80, 204–216. [Google Scholar] [CrossRef]
  80. Deng, X.; Featherstone, W.E.; Hwang, C.; Berry, P.A.M. Estimation of Contamination of ERS-2 and POSEIDON Satellite Radar Altimetry Close to the Coasts of Australia. Mar. Geod. 2002, 25, 249–271. [Google Scholar] [CrossRef]
  81. Osareh, F. Bibliometrics, Citation Analysis and Co-Citation Analysis: A Review of Literature I. LIBRI 1996, 46, 149–158. [Google Scholar] [CrossRef]
  82. Chelton, D.B.; Schlax, M.G.; Samelson, R.M. Global observations of nonlinear mesoscale eddies. Prog. Oceanogr. 2011, 91, 167–216. [Google Scholar] [CrossRef]
  83. Zhang, Z.; Wang, W.; Qiu, B. Oceanic mass transport by mesoscale eddies. Science 2014, 345, 322–324. [Google Scholar] [CrossRef]
  84. McGillicuddy, D.J. Mechanisms of Physical-Biological-Biogeochemical Interaction at the Oceanic Mesoscale. Annu. Rev. Mar. Sci. 2016, 8, 125–159. [Google Scholar] [CrossRef] [PubMed] [Green Version]
  85. Pujol, M.I.; Faugère, Y.; Taburet, G.; Dupuy, S.; Pelloquin, C.; Ablain, M.; Picot, N. DUACS DT2014: The new multi-mission altimeter data set reprocessed over 20years. Ocean. Sci. 2016, 12, 1067–1090. [Google Scholar] [CrossRef] [Green Version]
  86. Markus, T.; Neumann, T.; Martino, A.; Abdalati, W.; Brunt, K.; Csatho, B.; Farrell, S.; Fricker, H.; Gardner, A.; Harding, D.; et al. The Ice, Cloud, and land Elevation Satellite-2 (ICESat-2): Science requirements, concept, and implementation. Remote Sens. Environ. 2017, 190, 260–273. [Google Scholar] [CrossRef]
  87. Dee, D.P.; Uppala, S.M.; Simmons, A.J.; Berrisford, P.; Poli, P.; Kobayashi, S.; Andrae, U.; Balmaseda, M.A.; Balsamo, G.; Bauer, P.; et al. The ERA-Interim reanalysis: Configuration and performance of the data assimilation system. Q. J. R. Meteorol. Soc. 2011, 137, 553–597. [Google Scholar] [CrossRef]
  88. Pavlis, N.K.; Holmes, S.A.; Kenyon, S.C.; Factor, J.K. The development and evaluation of the Earth Gravitational Model 2008 (EGM2008). J. Geophys. Res. Solid Earth 2012, 117, B04406. [Google Scholar] [CrossRef] [Green Version]
  89. Rio, M.H.; Guinehut, S.; Larnicol, G. New CNES-CLS09 global mean dynamic topography computed from the combination of GRACE data, altimetry, and in situ measurements. J. Geophys. Res. Ocean. 2011, 116. [Google Scholar] [CrossRef]
  90. Biancamaria, S.; Lettenmaier, D.P.; Pavelsky, T.M. The SWOT Mission and Its Capabilities for Land Hydrology. Surv. Geophys. 2016, 37, 307–337. [Google Scholar] [CrossRef] [Green Version]
  91. Tapley, B.D.; Watkins, M.M.; Ries, J.C.; Davis, G.W.; Eanes, R.J.; Poole, S.R.; Rim, H.J.; Schutz, B.E.; Shum, C.K.; Nerem, R.S.; et al. The Joint Gravity Model 3. J. Geophys. Res. Solid Earth 1996, 101, 28029–28049. [Google Scholar] [CrossRef]
  92. Cartwright, D.E.; Ray, R.D. Oceanic tides from Geosat altimetry. J. Geophys. Res. Ocean. 1990, 95, 3069–3090. [Google Scholar] [CrossRef]
  93. Haxby, W.F.; Weissel, J.K. Evidence for small-scale mantle convection from Seasat altimeter data. J. Geophys. Res. Solid Earth 1986, 91, 3507–3520. [Google Scholar] [CrossRef]
  94. Walsh, E.J.; Jackson, F.C.; Uliana, E.A.; Swift, R.N. Observations on electromagnetic bias in radar altimeter sea surface measurements. J. Geophys. Res. Ocean. 1989, 94, 14575–14584. [Google Scholar] [CrossRef]
  95. Passaro, M.; Nadzir, Z.A.; Quartly, G.D. Improving the precision of sea level data from satellite altimetry with high-frequency and regional sea state bias corrections. Remote Sens. Environ. 2018, 218, 245–254. [Google Scholar] [CrossRef] [Green Version]
  96. Cipollini, P.; Calafat, F.M.; Jevrejeva, S.; Melet, A.; Prandi, P. Monitoring Sea Level in the Coastal Zone with Satellite Altimetry and Tide Gauges. Surv. Geophys. 2017, 38, 33–57. [Google Scholar] [CrossRef] [PubMed] [Green Version]
  97. Horwath, M.; Gutknecht, B.D.; Cazenave, A.; Palanisamy, H.K.; Marti, F.; Marzeion, B.; Paul, F.; Le Bris, R.; Hogg, A.E.; Otosaka, I.; et al. Global sea-level budget and ocean-mass budget, with a focus on advanced data products and uncertainty characterisation. Earth Syst. Sci. Data 2022, 14, 411–447. [Google Scholar] [CrossRef]
  98. Church, J.A.; Clark, P.U.; Cazenave, A.; Gregory, J.M.; Jevrejeva, S.; Levermann, A.; Merrifield, M.A.; Milne, G.A.; Nerem, R.S.; Nunn, P.D.; et al. Sea Level Change. In Climate Change 2013: The Physical Science Basis; Stocker, T., Qin, D., Plattner, G., Tignor, M., Allen, S., Boschung, J., Nauels, A., Xia, Y., Bex, V., Midgley, P., Eds.; United Nations Development Programme: New York, NY, USA, 2014; pp. 1137–1216. [Google Scholar]
  99. Simard, M.; Pinto, N.; Fisher, J.B.; Baccini, A. Mapping forest canopy height globally with spaceborne lidar. J. Geophys. Res. Biogeosci. 2011, 116. [Google Scholar] [CrossRef] [Green Version]
  100. Frappart, F.; Calmant, S.; Cauhope, M.; Seyler, F.; Cazenave, A. Preliminary results of ENVISAT RA-2-derived water levels validation over the Amazon basin. Remote Sens. Environ. 2006, 100, 252–264. [Google Scholar] [CrossRef] [Green Version]
  101. Song, C.; Huang, B.; Ke, L. Modeling and analysis of lake water storage changes on the Tibetan Plateau using multi-mission satellite data. Remote Sens. Environ. 2013, 135, 25–35. [Google Scholar] [CrossRef]
  102. Birkett, C. Contribution of the TOPEX NASA radar altimeter to the global monitoring of large rivers and wetlands. Water Resour. Res. 1998, 34, 1223–1239. [Google Scholar] [CrossRef]
  103. Sun, G.; Ranson, K.J.; Kimes, D.S.; Blair, J.B.; Kovacs, K. Forest vertical structure from GLAS: An evaluation using LVIS and SRTM data. Remote Sens. Environ. 2008, 112, 107–117. [Google Scholar] [CrossRef]
  104. Moholdt, G.; Nuth, C.; Hagen, J.O.; Kohler, J. Recent elevation changes of Svalbard glaciers derived from ICESat laser altimetry. Remote Sens. Environ. 2010, 114, 2756–2767. [Google Scholar] [CrossRef]
  105. Gao, H.; Birkett, C.; Lettenmaier, D.P. Global monitoring of large reservoir storage from satellite remote sensing. Water Resour. Res. 2012, 48. [Google Scholar] [CrossRef] [Green Version]
  106. Jiang, L.; Nielsen, K.; Dinardo, S.; Andersen, O.B.; Bauer-Gottwein, P. Evaluation of Sentinel-3 SRAL SAR altimetry over Chinese rivers. Remote Sens. Environ. 2020, 237, 111546. [Google Scholar] [CrossRef]
  107. Normandin, C.; Frappart, F.; Diepkilé, A.T.; Marieu, V.; Mougin, E.; Blarel, F.; Lubac, B.; Braquet, N.; Ba, A. Evolution of the Performances of Radar Altimetry Missions from ERS-2 to Sentinel-3A over the Inner Niger Delta. Remote Sens. 2018, 10, 833. [Google Scholar] [CrossRef] [Green Version]
  108. Crétaux, J.F.; Bergé-Nguyen, M.; Calmant, S.; Jamangulova, N.; Satylkanov, R.; Lyard, F.; Perosanz, F.; Verron, J.; Samine Montazem, A.; Le Guilcher, G.; et al. Absolute Calibration or Validation of the Altimeters on the Sentinel-3A and the Jason-3 over Lake Issykkul (Kyrgyzstan). Remote Sens. 2018, 10, 1679. [Google Scholar] [CrossRef] [Green Version]
  109. Gao, Q.; Makhoul, E.; Escorihuela, M.J.; Zribi, M.; Quintana Seguí, P.; García, P.; Roca, M. Analysis of Retrackers’ Performances and Water Level Retrieval over the Ebro River Basin Using Sentinel-3. Remote Sens. 2019, 11, 718. [Google Scholar] [CrossRef] [Green Version]
  110. Zhu, L.; Yang, L.; Xu, Y.; Zhang, H.; Wu, Z.; Wang, Z. Independent Validation of Jason-2/3 and HY-2B Microwave Radiometers Using Chinese Coastal GNSS. IEEE Trans. Geosci. Remote Sens. 2021, 60, 1–11. [Google Scholar] [CrossRef]
  111. Yang, L.; Lin, M.; Ma, C.; Mertikas, S.P.; Xu, Y.; Wang, Z.; Mu, B.; Zhou, X. Monitoring the Performance of HY-2B and Jason-2/3 Sea Surface Height via the China Altimetry Calibration Cooperation Plan. IEEE Trans. Geosci. Remote Sens. 2022, 60, 14. [Google Scholar] [CrossRef]
  112. Peral, E.; Rodríguez, E.; Esteban-Fernández, D. Impact of Surface Waves on SWOT’s Projected Ocean Accuracy. Remote Sens. 2015, 7, 14509–14529. [Google Scholar] [CrossRef] [Green Version]
  113. Frasson, R.P.d.M.; Schumann, G.J.P.; Kettner, A.J.; Brakenridge, G.R.; Krajewski, W.F. Will the Surface Water and Ocean Topography (SWOT) Satellite Mission Observe Floods? Geophys. Res. Lett. 2019, 46, 10435–10445. [Google Scholar] [CrossRef] [Green Version]
  114. Wang, J.; Fu, L.L.; Qiu, B.; Menemenlis, D.; Farrar, J.T.; Chao, Y.; Thompson, A.F.; Flexas, M.M. An Observing System Simulation Experiment for the Calibration and Validation of the Surface Water Ocean Topography Sea Surface Height Measurement Using In Situ Platforms. J. Atmos. Ocean. Technol. 2017, 35, 281–297. [Google Scholar] [CrossRef]
  115. Ma, C.; Guo, X.; Zhang, H.; Di, J.; Chen, G. An Investigation of the Influences of SWOT Sampling and Errors on Ocean Eddy Observation. Remote Sens. 2020, 12, 2682. [Google Scholar] [CrossRef]
  116. Zhao, Z. Southward Internal Tides in the Northeastern South China Sea. J. Geophys. Res. Ocean. 2020, 125, e2020JC016554. [Google Scholar] [CrossRef]
  117. Ma, J.; Guo, D.; Zhan, P.; Hoteit, I. Seasonal M2 Internal Tides in the Arabian Sea. Remote Sens. 2021, 13, 2823. [Google Scholar] [CrossRef]
  118. Carrere, L.; Arbic, B.K.; Dushaw, B.; Egbert, G.; Erofeeva, S.; Lyard, F.; Ray, R.D.; Ubelmann, C.; Zaron, E.; Zhao, Z.; et al. Accuracy assessment of global internal-tide models using satellite altimetry. Ocean. Sci. 2021, 17, 147–180. [Google Scholar] [CrossRef]
  119. Zheng, Q.; Xie, L.; Xiong, X.; Hu, X.; Chen, L. Progress in research of submesoscale processes in the South China Sea. Acta Oceanol. Sin. 2020, 39, 1–13. [Google Scholar] [CrossRef]
  120. Han, Z.; Long, D.; Huang, Q.; Li, X.; Zhao, F.; Wang, J. Improving Reservoir Outflow Estimation for Ungauged Basins Using Satellite Observations and a Hydrological Model. Water Resour. Res. 2020, 56, e2020WR027590. [Google Scholar] [CrossRef]
  121. Zhong, R.; Zhao, T.; Chen, X. Hydrological Model Calibration for Dammed Basins Using Satellite Altimetry Information. Water Resour. Res. 2020, 56, e2020WR027442. [Google Scholar] [CrossRef]
  122. Thakur, P.K.; Garg, V.; Kalura, P.; Agrawal, B.; Sharma, V.; Mohapatra, M.; Kalia, M.; Aggarwal, S.P.; Calmant, S.; Ghosh, S.; et al. Water level status of Indian reservoirs: A synoptic view from altimeter observations. Adv. Space Res. 2021, 68, 619–664. [Google Scholar] [CrossRef]
  123. Li, Y.; Gao, H.; Zhao, G.; Tseng, K.H. A high-resolution bathymetry dataset for global reservoirs using multi-source satellite imagery and altimetry. Remote Sens. Environ. 2020, 244, 111831. [Google Scholar] [CrossRef]
  124. Zhan, P.; Song, C.; Wang, J.; Li, W.; Ke, L.; Liu, K.; Chen, T. Recent Abnormal Hydrologic Behavior of Tibetan Lakes Observed by Multi-Mission Altimeters. Remote Sens. 2020, 12, 2986. [Google Scholar] [CrossRef]
  125. Chao, N.; Chen, G.; Wang, Z. Impact of Eastern Tibetan Plateau Glacier Melt on Land Water Storage Change across the Yangtze River Basin. J. Hydrol. Eng. 2020, 25, 05020002. [Google Scholar] [CrossRef]
  126. Kouraev, A.V.; Zakharova, E.A.; Kostianoy, A.G.; Shimaraev, M.N.; Desinov, L.V.; Petrov, E.A.; Hall, N.M.J.; Rémy, F.; Suknev, A.Y. Giant ice rings in southern Baikal: Multi-satellite data help to study ice cover dynamics and eddies under ice. Cryosphere 2021, 15, 4501–4516. [Google Scholar] [CrossRef]
  127. Belter, H.J.; Krumpen, T.; Hendricks, S.; Hoelemann, J.; Janout, M.A.; Ricker, R.; Haas, C. Satellite-based sea ice thickness changes in the Laptev Sea from 2002 to 2017: Comparison to mooring observations. Cryosphere 2020, 14, 2189–2203. [Google Scholar] [CrossRef]
  128. McMillan, M.; Muir, A.; Donlon, C. Brief communication: Ice sheet elevation measurements from the Sentinel-3A and Sentinel-3B tandem phase. Cryosphere 2021, 15, 3129–3134. [Google Scholar] [CrossRef]
  129. Manucharyan, G.E.; Siegelman, L.; Klein, P. A Deep Learning Approach to Spatiotemporal Sea Surface Height Interpolation and Estimation of Deep Currents in Geostrophic Ocean Turbulence. J. Adv. Model. Earth Syst. 2021, 13, e2019MS001965. [Google Scholar] [CrossRef]
  130. Quach, B.; Glaser, Y.; Stopa, J.E.; Mouche, A.A.; Sadowski, P. Deep Learning for Predicting Significant Wave Height From Synthetic Aperture Radar. IEEE Trans. Geosci. Remote Sens. 2021, 59, 1859–1867. [Google Scholar] [CrossRef]
  131. Santana, O.J.; Hernández-Sosa, D.; Martz, J.; Smith, R.N. Neural Network Training for the Detection and Classification of Oceanic Mesoscale Eddies. Remote Sens. 2020, 12, 2625. [Google Scholar] [CrossRef]
  132. Buongiorno Nardelli, B. A Deep Learning Network to Retrieve Ocean Hydrographic Profiles from Combined Satellite and In Situ Measurements. Remote Sens. 2020, 12, 3151. [Google Scholar] [CrossRef]
  133. George, T.M.; Manucharyan, G.E.; Thompson, A.F. Deep learning to infer eddy heat fluxes from sea surface height patterns of mesoscale turbulence. Nat. Commun. 2021, 12, 800. [Google Scholar] [CrossRef]
  134. Choi, J.M.; Kim, W.; Hong, T.T.M.; Park, Y.G. Derivation and Evaluation of Satellite-Based Surface Current. Front. Mar. Sci. 2021, 8, 695780. [Google Scholar] [CrossRef]
  135. Yang, L.; Jin, T.; Gao, X.; Wen, H.; Schöne, T.; Xiao, M.; Huang, H. Sea Level Fusion of Satellite Altimetry and Tide Gauge Data by Deep Learning in the Mediterranean Sea. Remote Sens. 2021, 13, 908. [Google Scholar] [CrossRef]
  136. Sinha, A.; Abernathey, R. Estimating Ocean Surface Currents With Machine Learning. Front. Mar. Sci. 2021, 8, 672477. [Google Scholar] [CrossRef]
  137. Wang, J.; Yu, T.; Deng, F.; Ruan, Z.; Jia, Y. Acquisition of the Wide Swath Significant Wave Height from HY-2C through Deep Learning. Remote Sens. 2021, 13, 4425. [Google Scholar] [CrossRef]
  138. Chen, G.; Tang, J.; Zhao, C.; Wu, S.; Yu, F.; Ma, C.; Xu, Y.; Chen, W.; Zhang, Y.; Liu, J.; et al. Concept Design of the “Guanlan” Science Mission: China’s Novel Contribution to Space Oceanography. Front. Mar. Sci. 2019, 6, 194. [Google Scholar] [CrossRef] [Green Version]
  139. Morrow, R.; Fu, L.L.; Ardhuin, F.; Benkiran, M.; Chapron, B.; Cosme, E.; d’Ovidio, F.; Farrar, J.T.; Gille, S.T.; Lapeyre, G.; et al. Global Observations of Fine-Scale Ocean Surface Topography With the Surface Water and Ocean Topography (SWOT) Mission. Front. Mar. Sci. 2019, 6, 232. [Google Scholar] [CrossRef]
  140. Uematsu, A.; Nakamura, R.; Nakajima, Y.; Yajima, Y. X-band interferometric SAR sensor for the Japanese altimetry mission, COMPIRA. In Proceedings of the 2013 IEEE International Geoscience and Remote Sensing Symposium—IGARSS, Melbourne, Australia, 21–26 July 2013; pp. 2943–2946. [Google Scholar] [CrossRef]
Figure 1. Gantt chart showing the past, present, and future altimetry missions since 1985. The current date of 1 July 2022 is depicted by the dashed gray line. Satellite information was provided by https://space.oscar.wmo.int (accessed on 4 April 2022).
Remotesensing 14 03332 g001
Figure 2. The number of publications based on WoS data from 1970 to 2021: (a) the global annual published paper, citations, and launch year of the T/P series satellite altimeter, and (b) the annual published paper counts for the top five countries.
Remotesensing 14 03332 g002
Figure 3. The categories of publications of satellite altimetry. The pie chart displays the distribution of categories with more than 200 publications on a global scale. The distribution of categories among the top five nations is displayed in the bar graph below. Be aware that one publication may belong to several relevant categories.
Remotesensing 14 03332 g003
Figure 4. The publication journals of satellite altimetry. The total number of documents for each journal is shown by the blue bars. The following is a stack of documents for the top five countries. Be aware that due to the cooperation, the combined documents of the five countries may be more than the total number.
Remotesensing 14 03332 g004
Figure 5. Geographic distribution of the satellite altimetry literature by category of country/region (top) and affiliation (below) based on the WoS data of 1970 to 2021. The bar height indicates the number of documents.
Remotesensing 14 03332 g005
Figure 6. Node diagram of country/region cooperation. The node size indicates the volume of publications for each country. The link line width indicates the strength of the cooperation.
Remotesensing 14 03332 g006
Figure 7. Authors’ production in terms of number of documents (red) and total citations (blue) per year of the document published in that year.
Remotesensing 14 03332 g007
Figure 8. Collaboration network between key authors in satellite altimetry research. The node size and link line width represent the volume of publication and strength of cooperation for each authors, respectively. The node color indicates the publication years.
Remotesensing 14 03332 g008
Figure 9. The co-citation network for the satellite alimetry dataset, inclusive of cluster labels and core references. Figure was created by Citespace with configuration: years per slice to 1, select 10% of the most cited items from each slice and maximum number of selected items per slice to 100. Network: 2426 references and 10,350 co-citation links.
Remotesensing 14 03332 g009
Figure 10. The keywords’ co-occurrence network. To make the figure more readable, we set the limit connections threshold as 20 and presented 140 essential words.
Remotesensing 14 03332 g010
Figure 11. The number of annual publication related to the top 10 categories.
Remotesensing 14 03332 g011
Figure 12. The number of annual publication related to the specific satellite altimetry missions. Note that the “Y-axis” label refers to a collection of specific satellite missions, such as HY-2, which includes HY-2A/B/C.
Remotesensing 14 03332 g012
Table 1. Basic information of the WoS data set in the field of satellite altimetry from 1970 to 2021.
TypeValue/Number
Publications8514
Authors15,750
Countries/Regions137
Affiliations3478
Categories98
Publication Titles1318
Funding Agencies4772
Citing Articles96,196
Citing Articles Without Self-citations88,759
Times Cited237,857
Times Cited Without Self-citations178,079
Average Times Cited per Item27.93
H-Index183
Table 2. Top 10 institutions based on total publications. WoS provided the statistical information.
RankAffiliationNumber
1National Aeronautics Space Administration (NASA)937
2Centre National de La Recherche Scientifique (CNRS)828
3Institut de Recherche Pour Le Developpement (IRD)707
4Chinese Academy of Sciences (CAS)629
5Universite de Toulouse517
6Universite Toulouse III Paul Sabatier498
7Laboratoire d’Etudes en Geophysique et Oceanographie Spatiales (LEGOS)439
8California Institute of Technology (CalTech)409
9University of California System394
10National Oceanic Atmospheric Admin (NOAA)385
Publisher’s Note: MDPI stays neutral with regard to jurisdictional claims in published maps and institutional affiliations.

