Burdens of Breast Cancer and Projections for 2030 Among Women in Asia: Findings from the 2021 Global Burden of Disease Study

 ,
,
Abstract
1. Background
2. Methods
2.1. Data Sources
2.2. SDI
2.3. Data Analysis
2.3.1. Age-Standardized Rate (ASR) and Estimated Annual Percentage Change (EAPC)
2.3.2. Analysis of Cross-Country Inequalities
2.3.3. Age–Period–Cohort Model (APC Model)
2.3.4. ARIMA Model
3. Results
3.1. Overall Trends in Breast Cancer Incidence, Mortality, and DALYs Burden Among Asian Women
3.1.1. Overall Breast Cancer Trends
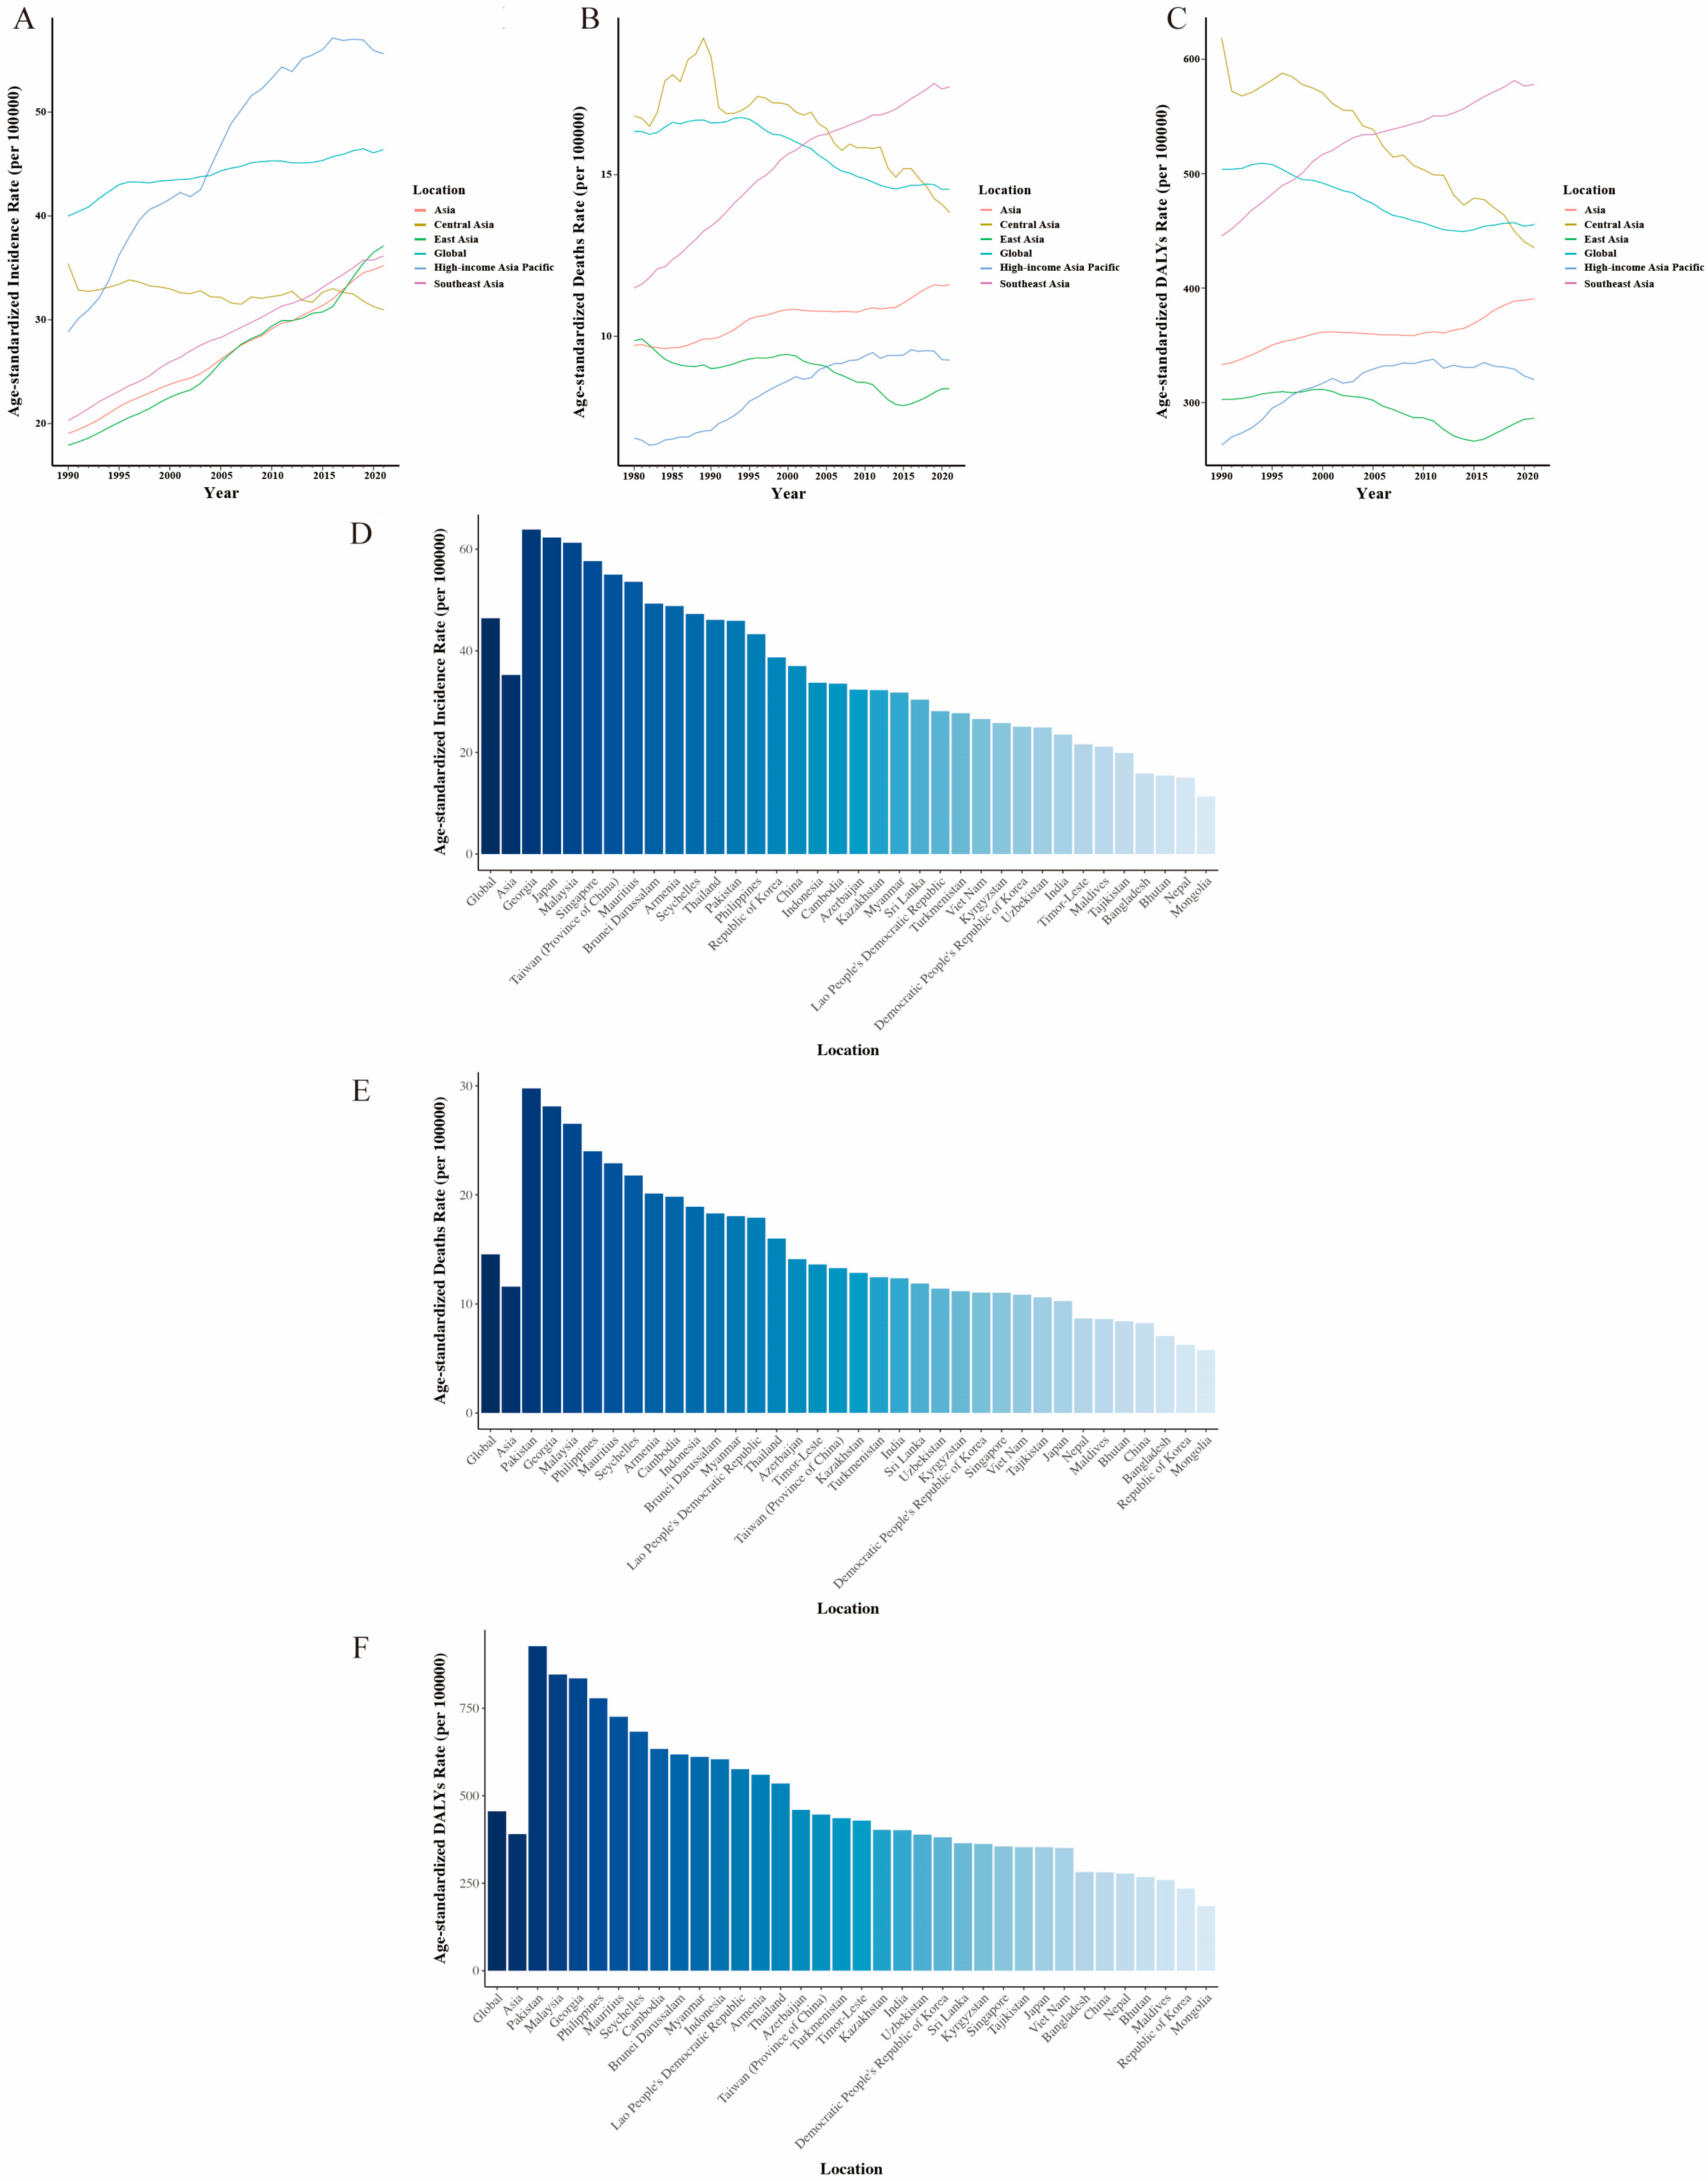
3.1.2. Breast Cancer Trends by Geographic Region
3.1.3. Breast Cancer Trends by Asian Country
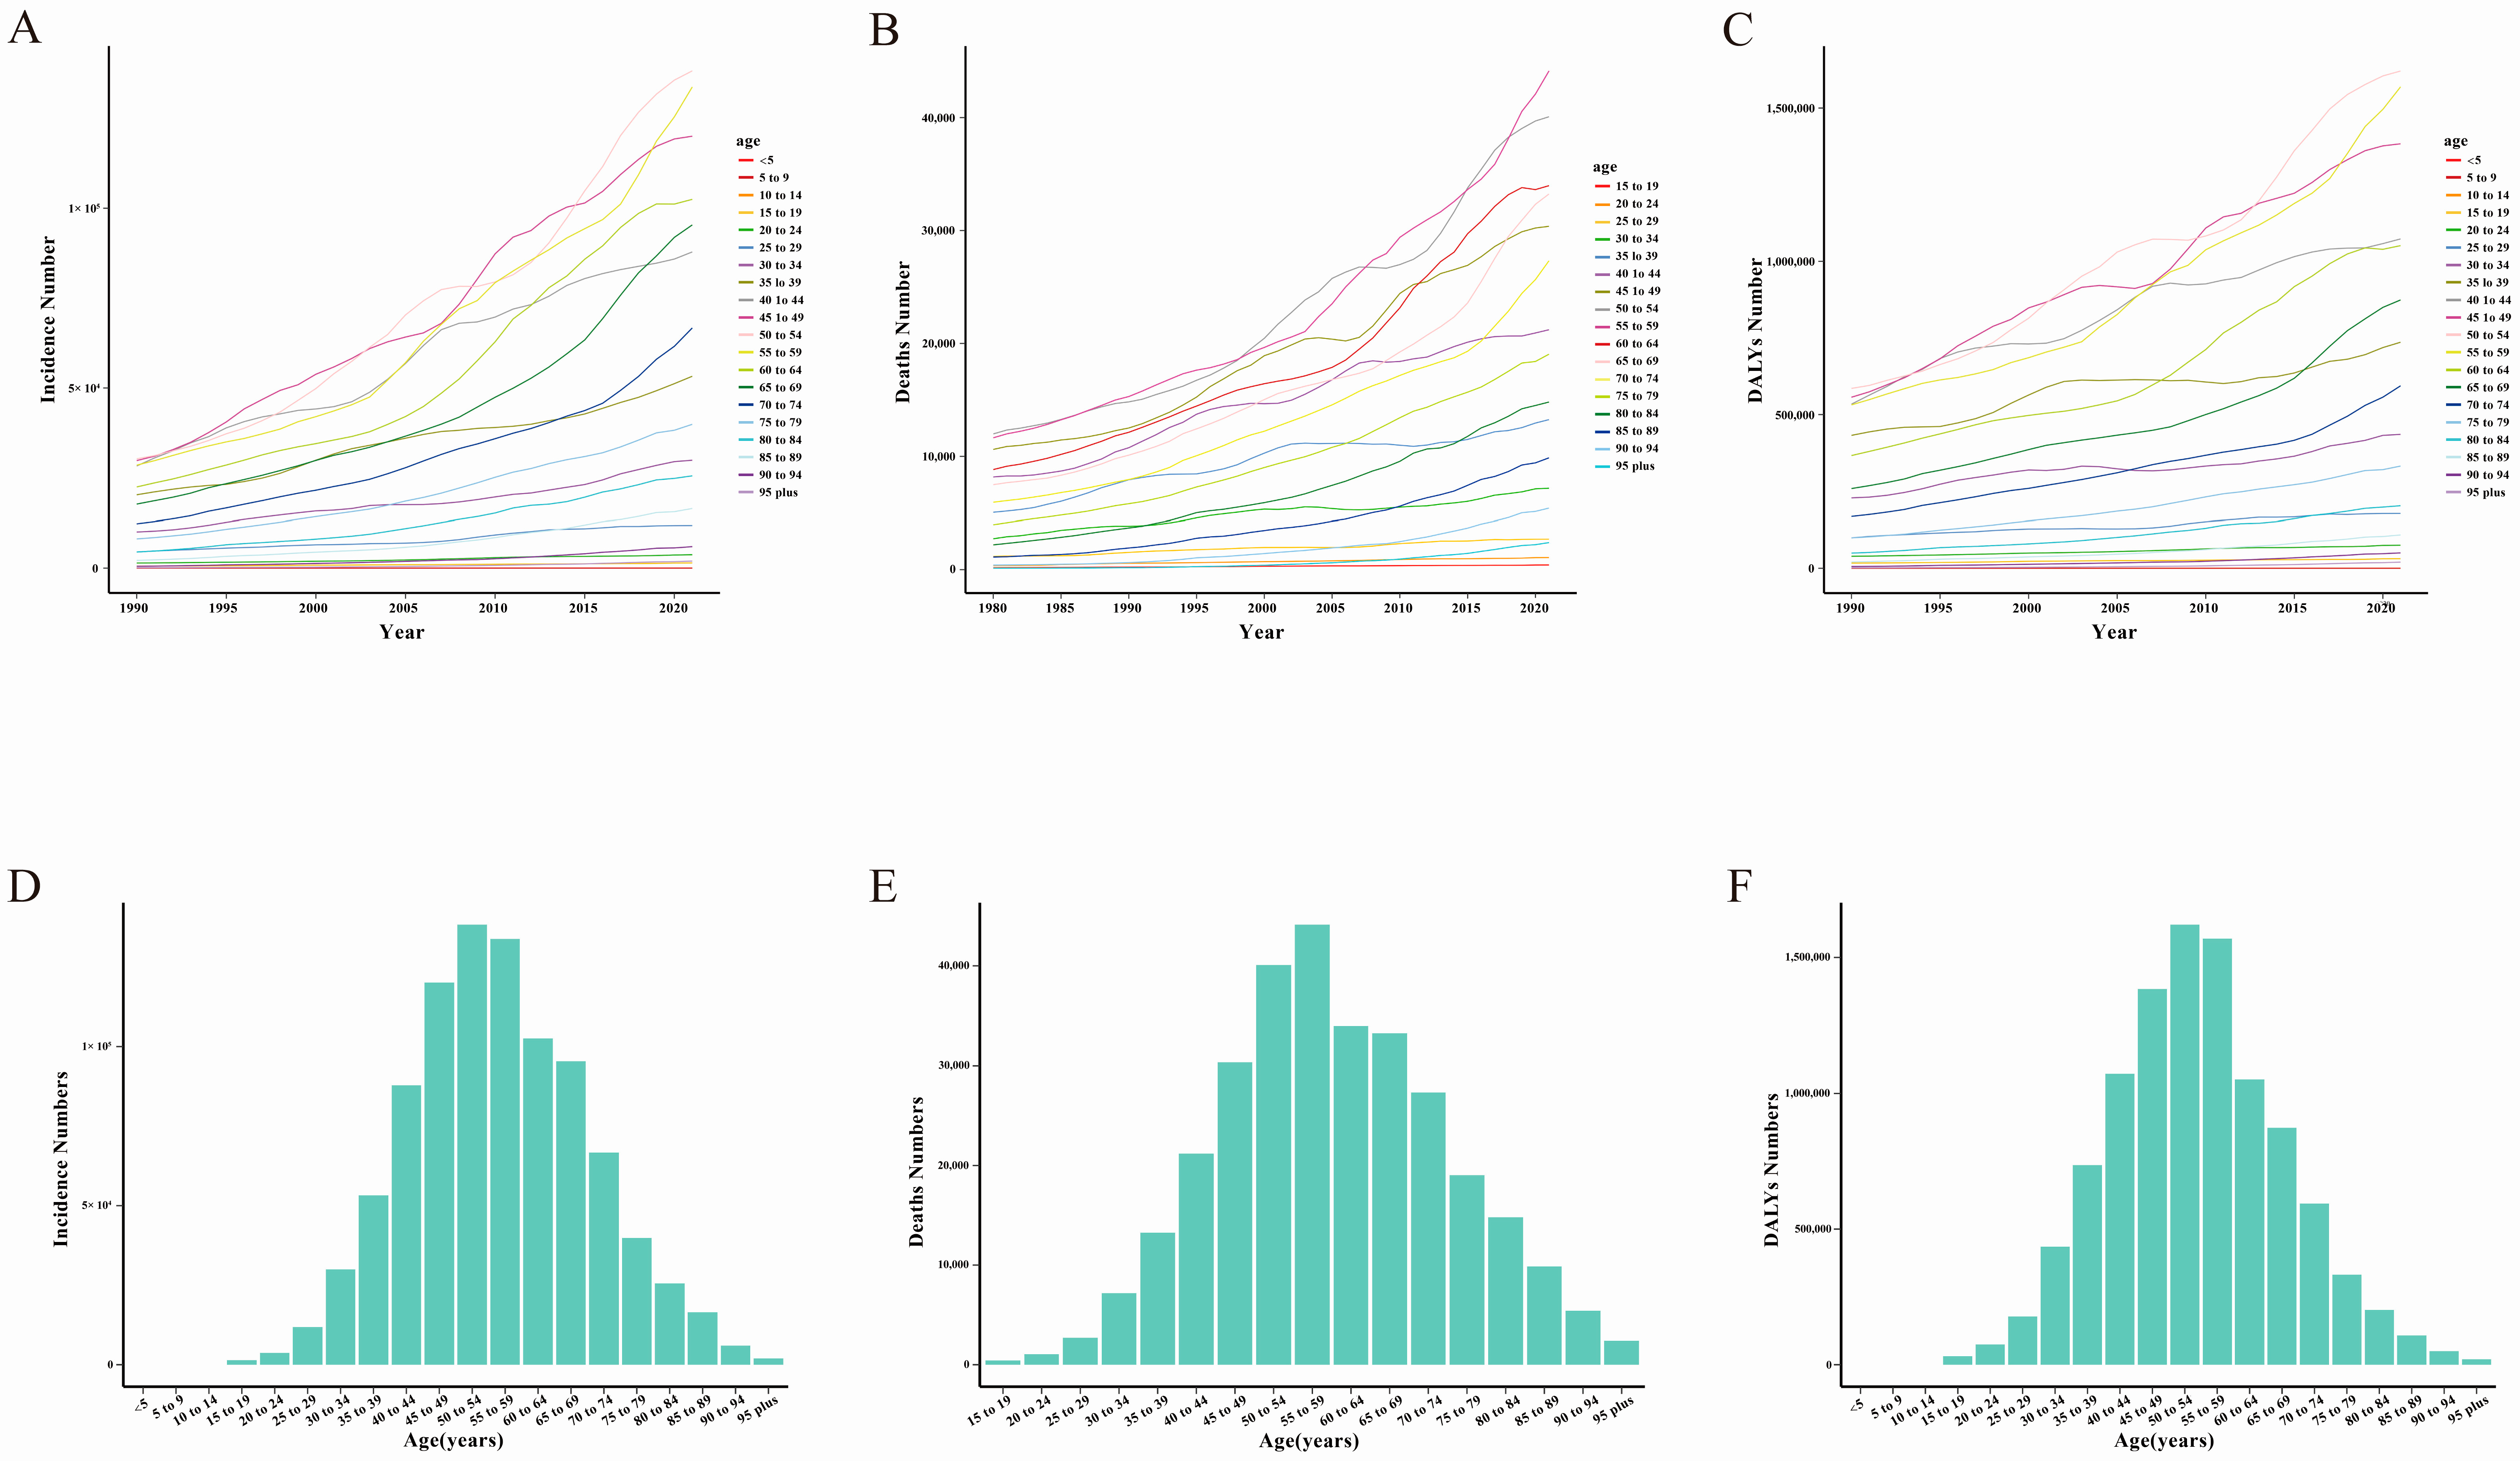
3.2. Age Differences and Corresponding Trends
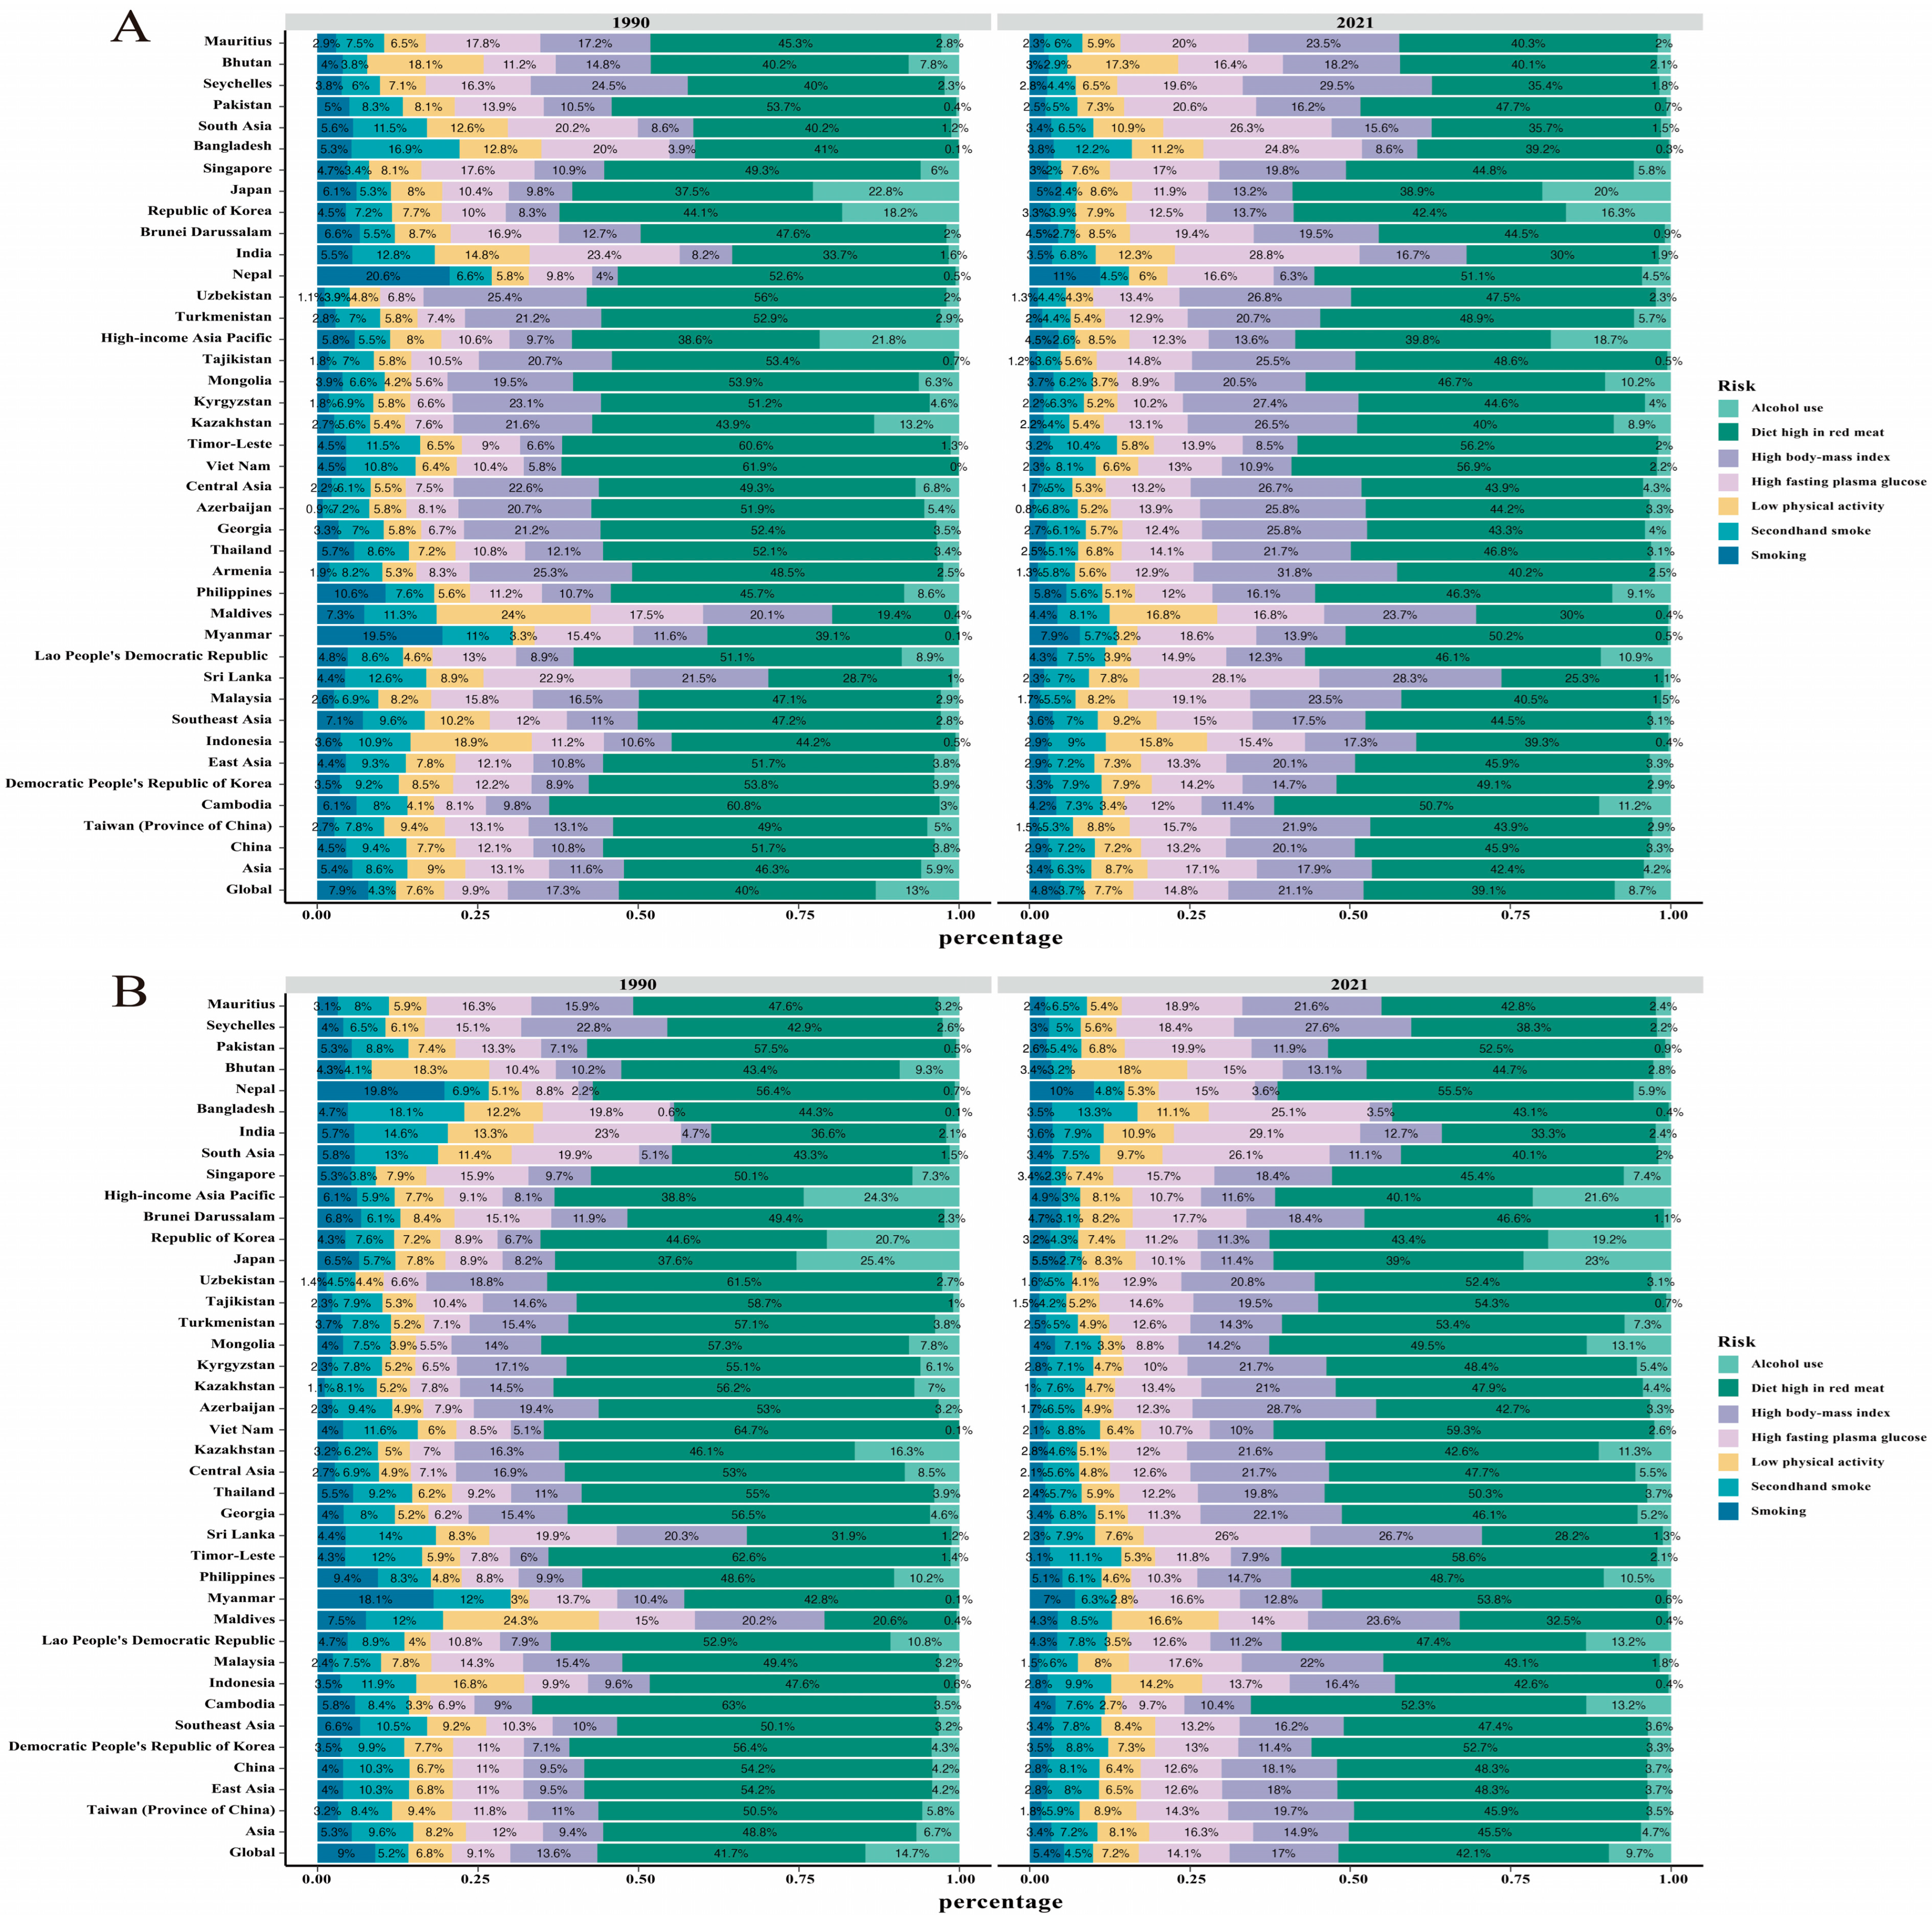
3.3. Breast Cancer Burden in Asia with Reference to Risk Factors
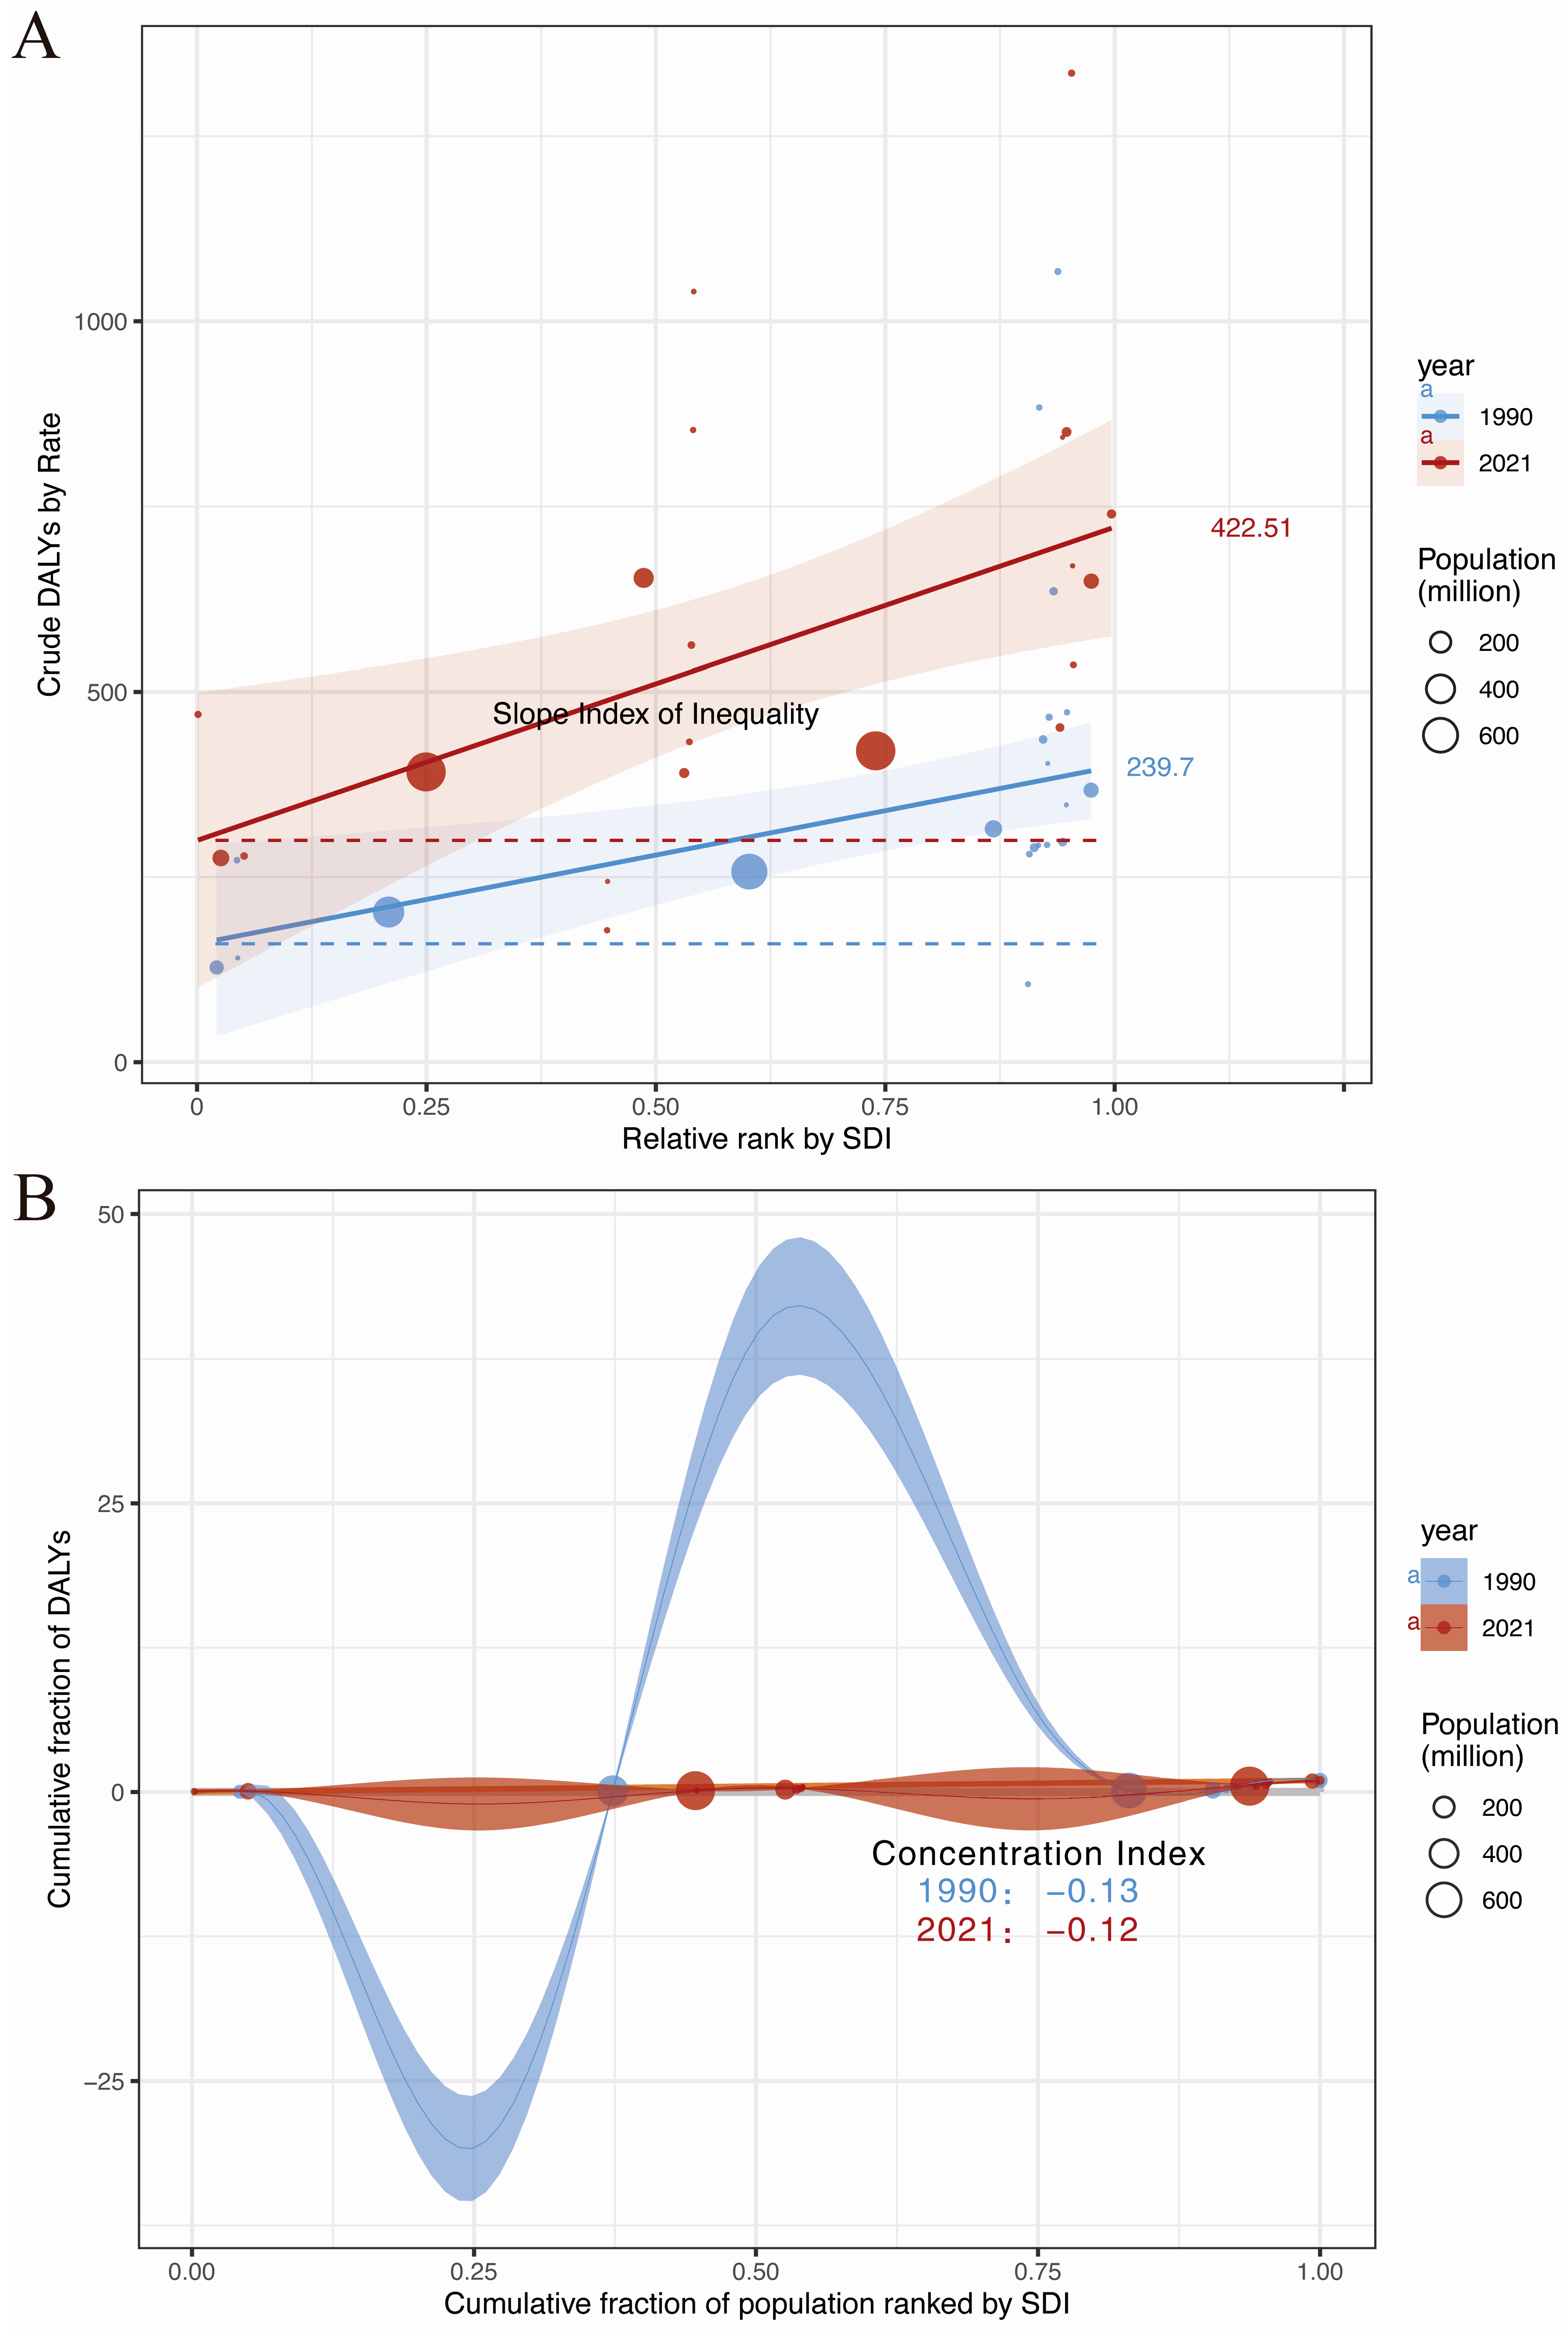
3.4. Breast Cancer Burden Inequalities Between Countries
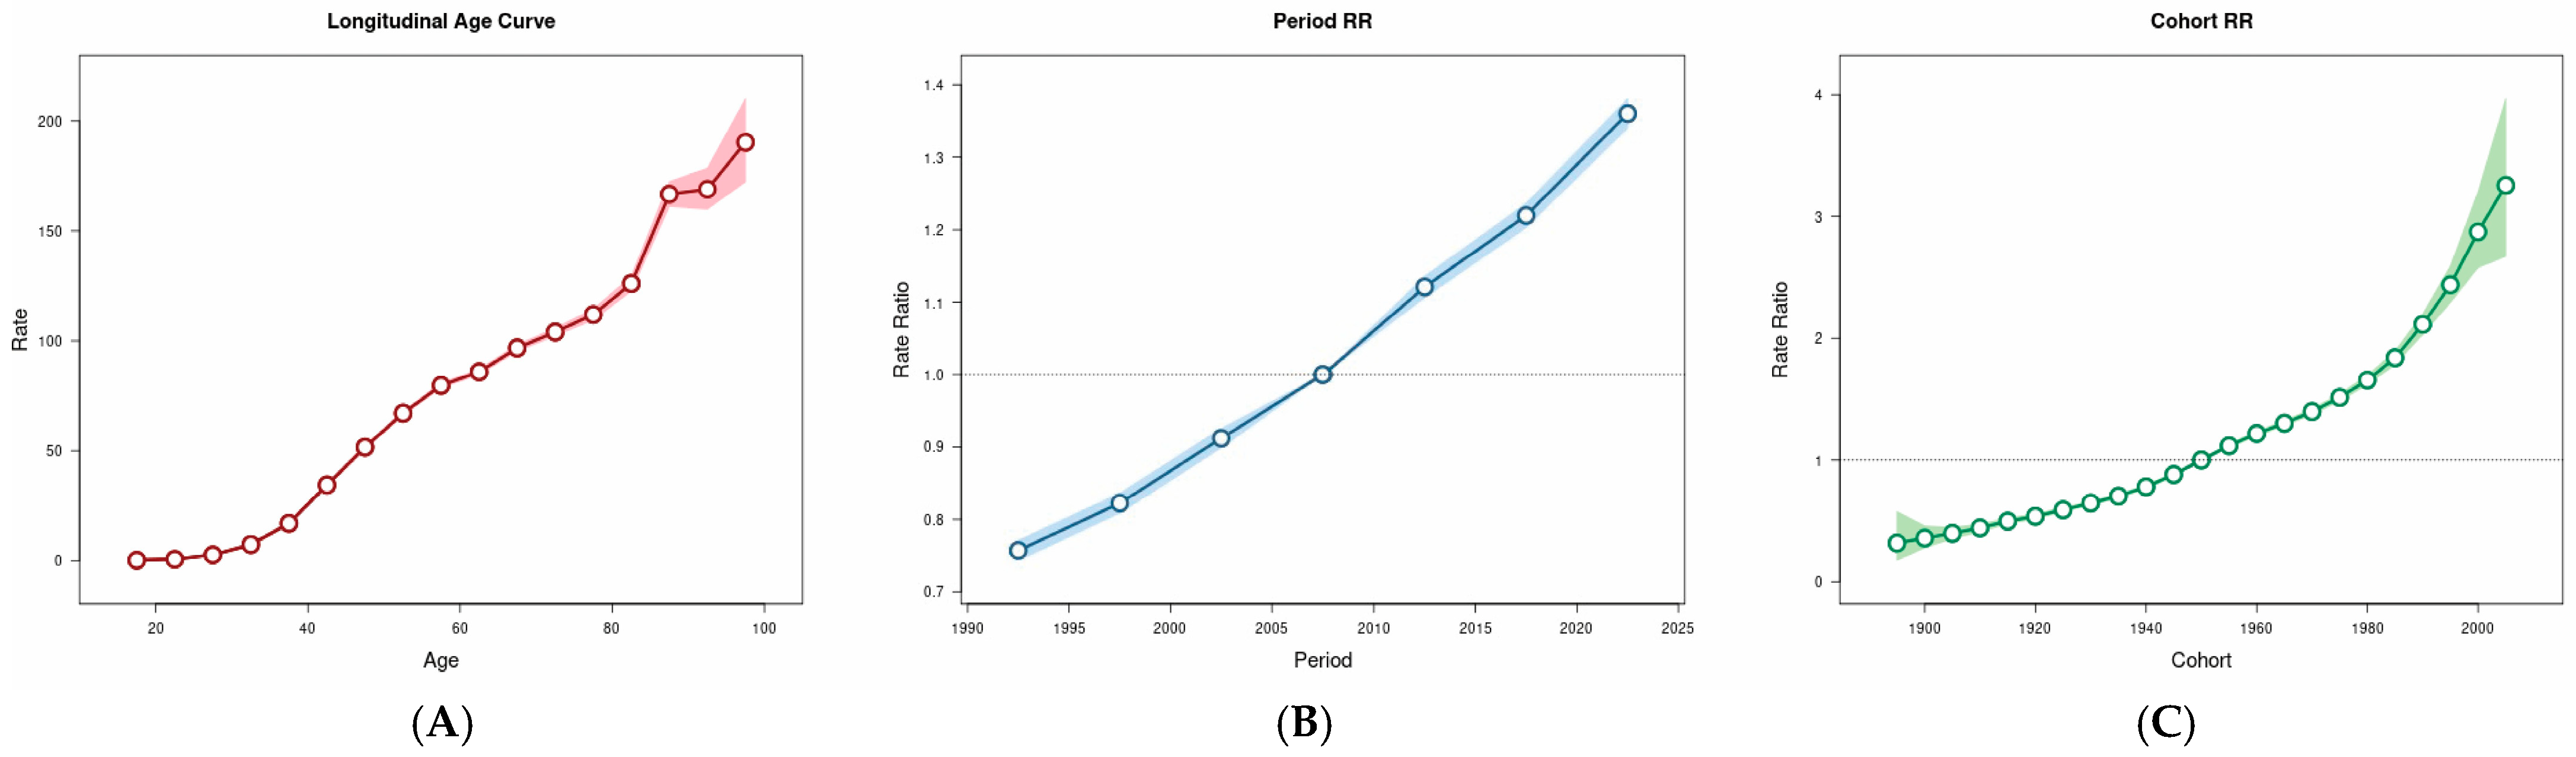
3.5. Age–Period–Cohort Analysis
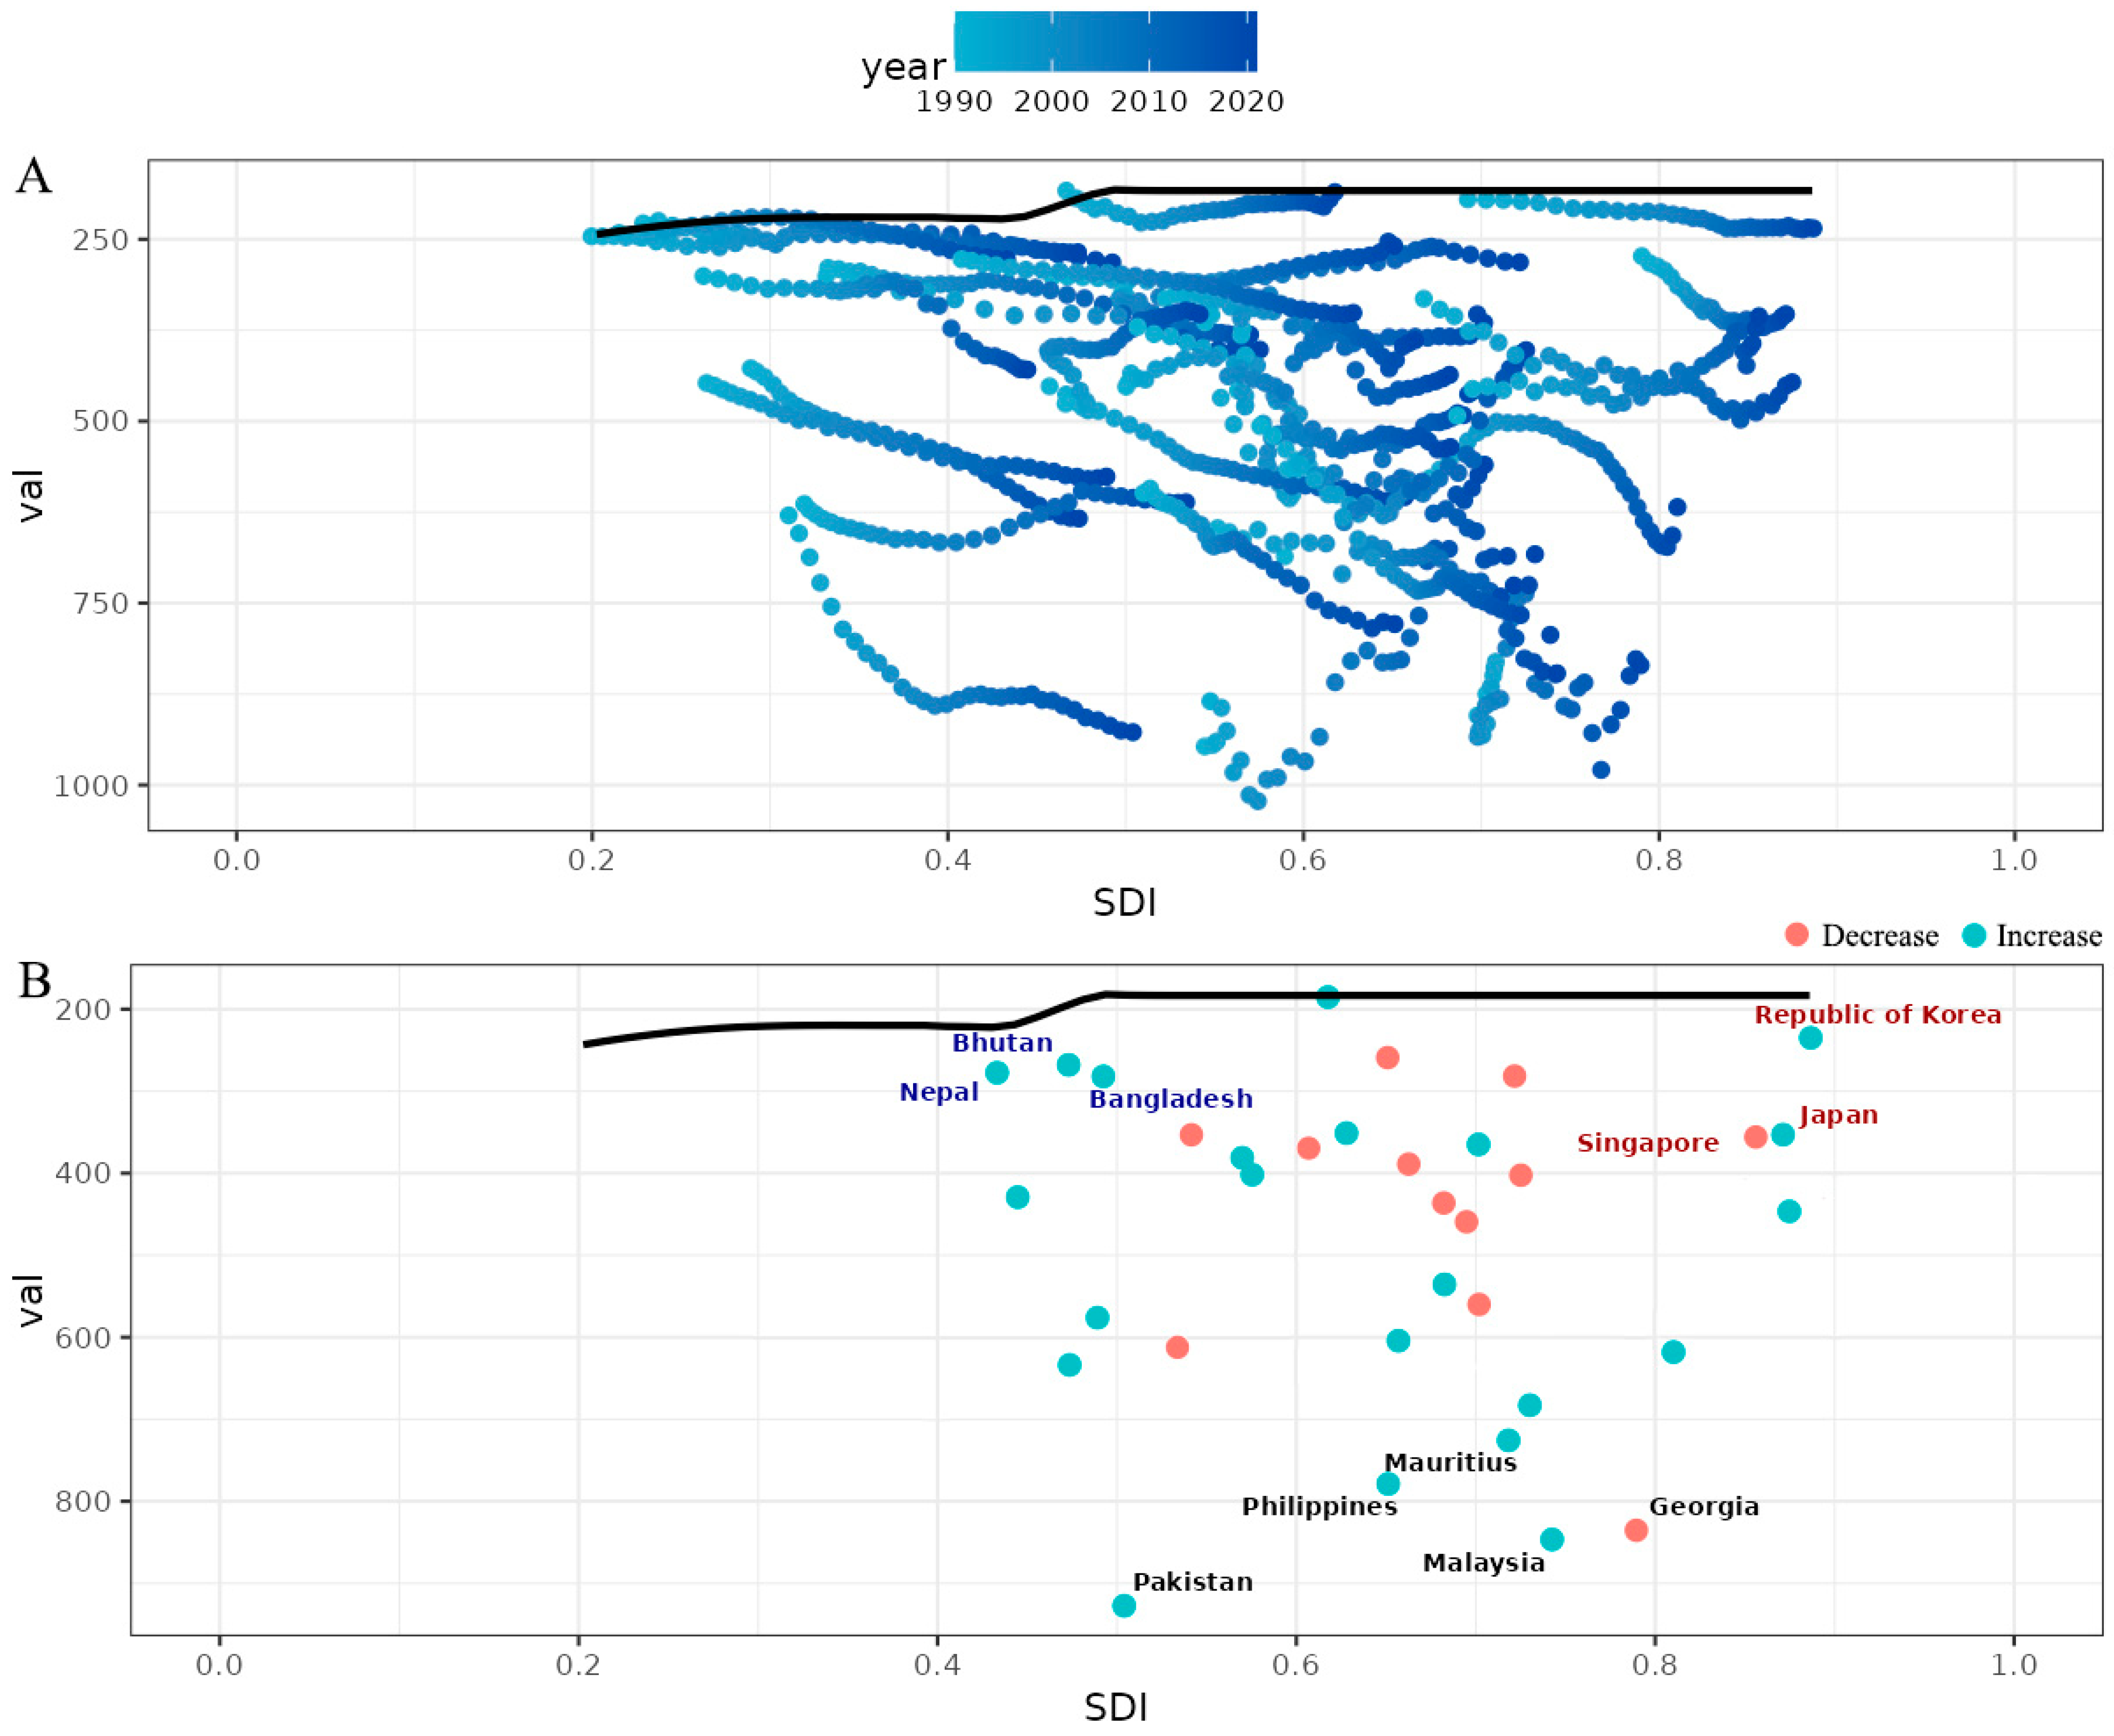
3.6. Frontier Analysis for the Association Between Ideal Breast Cancer DALYs and SDI
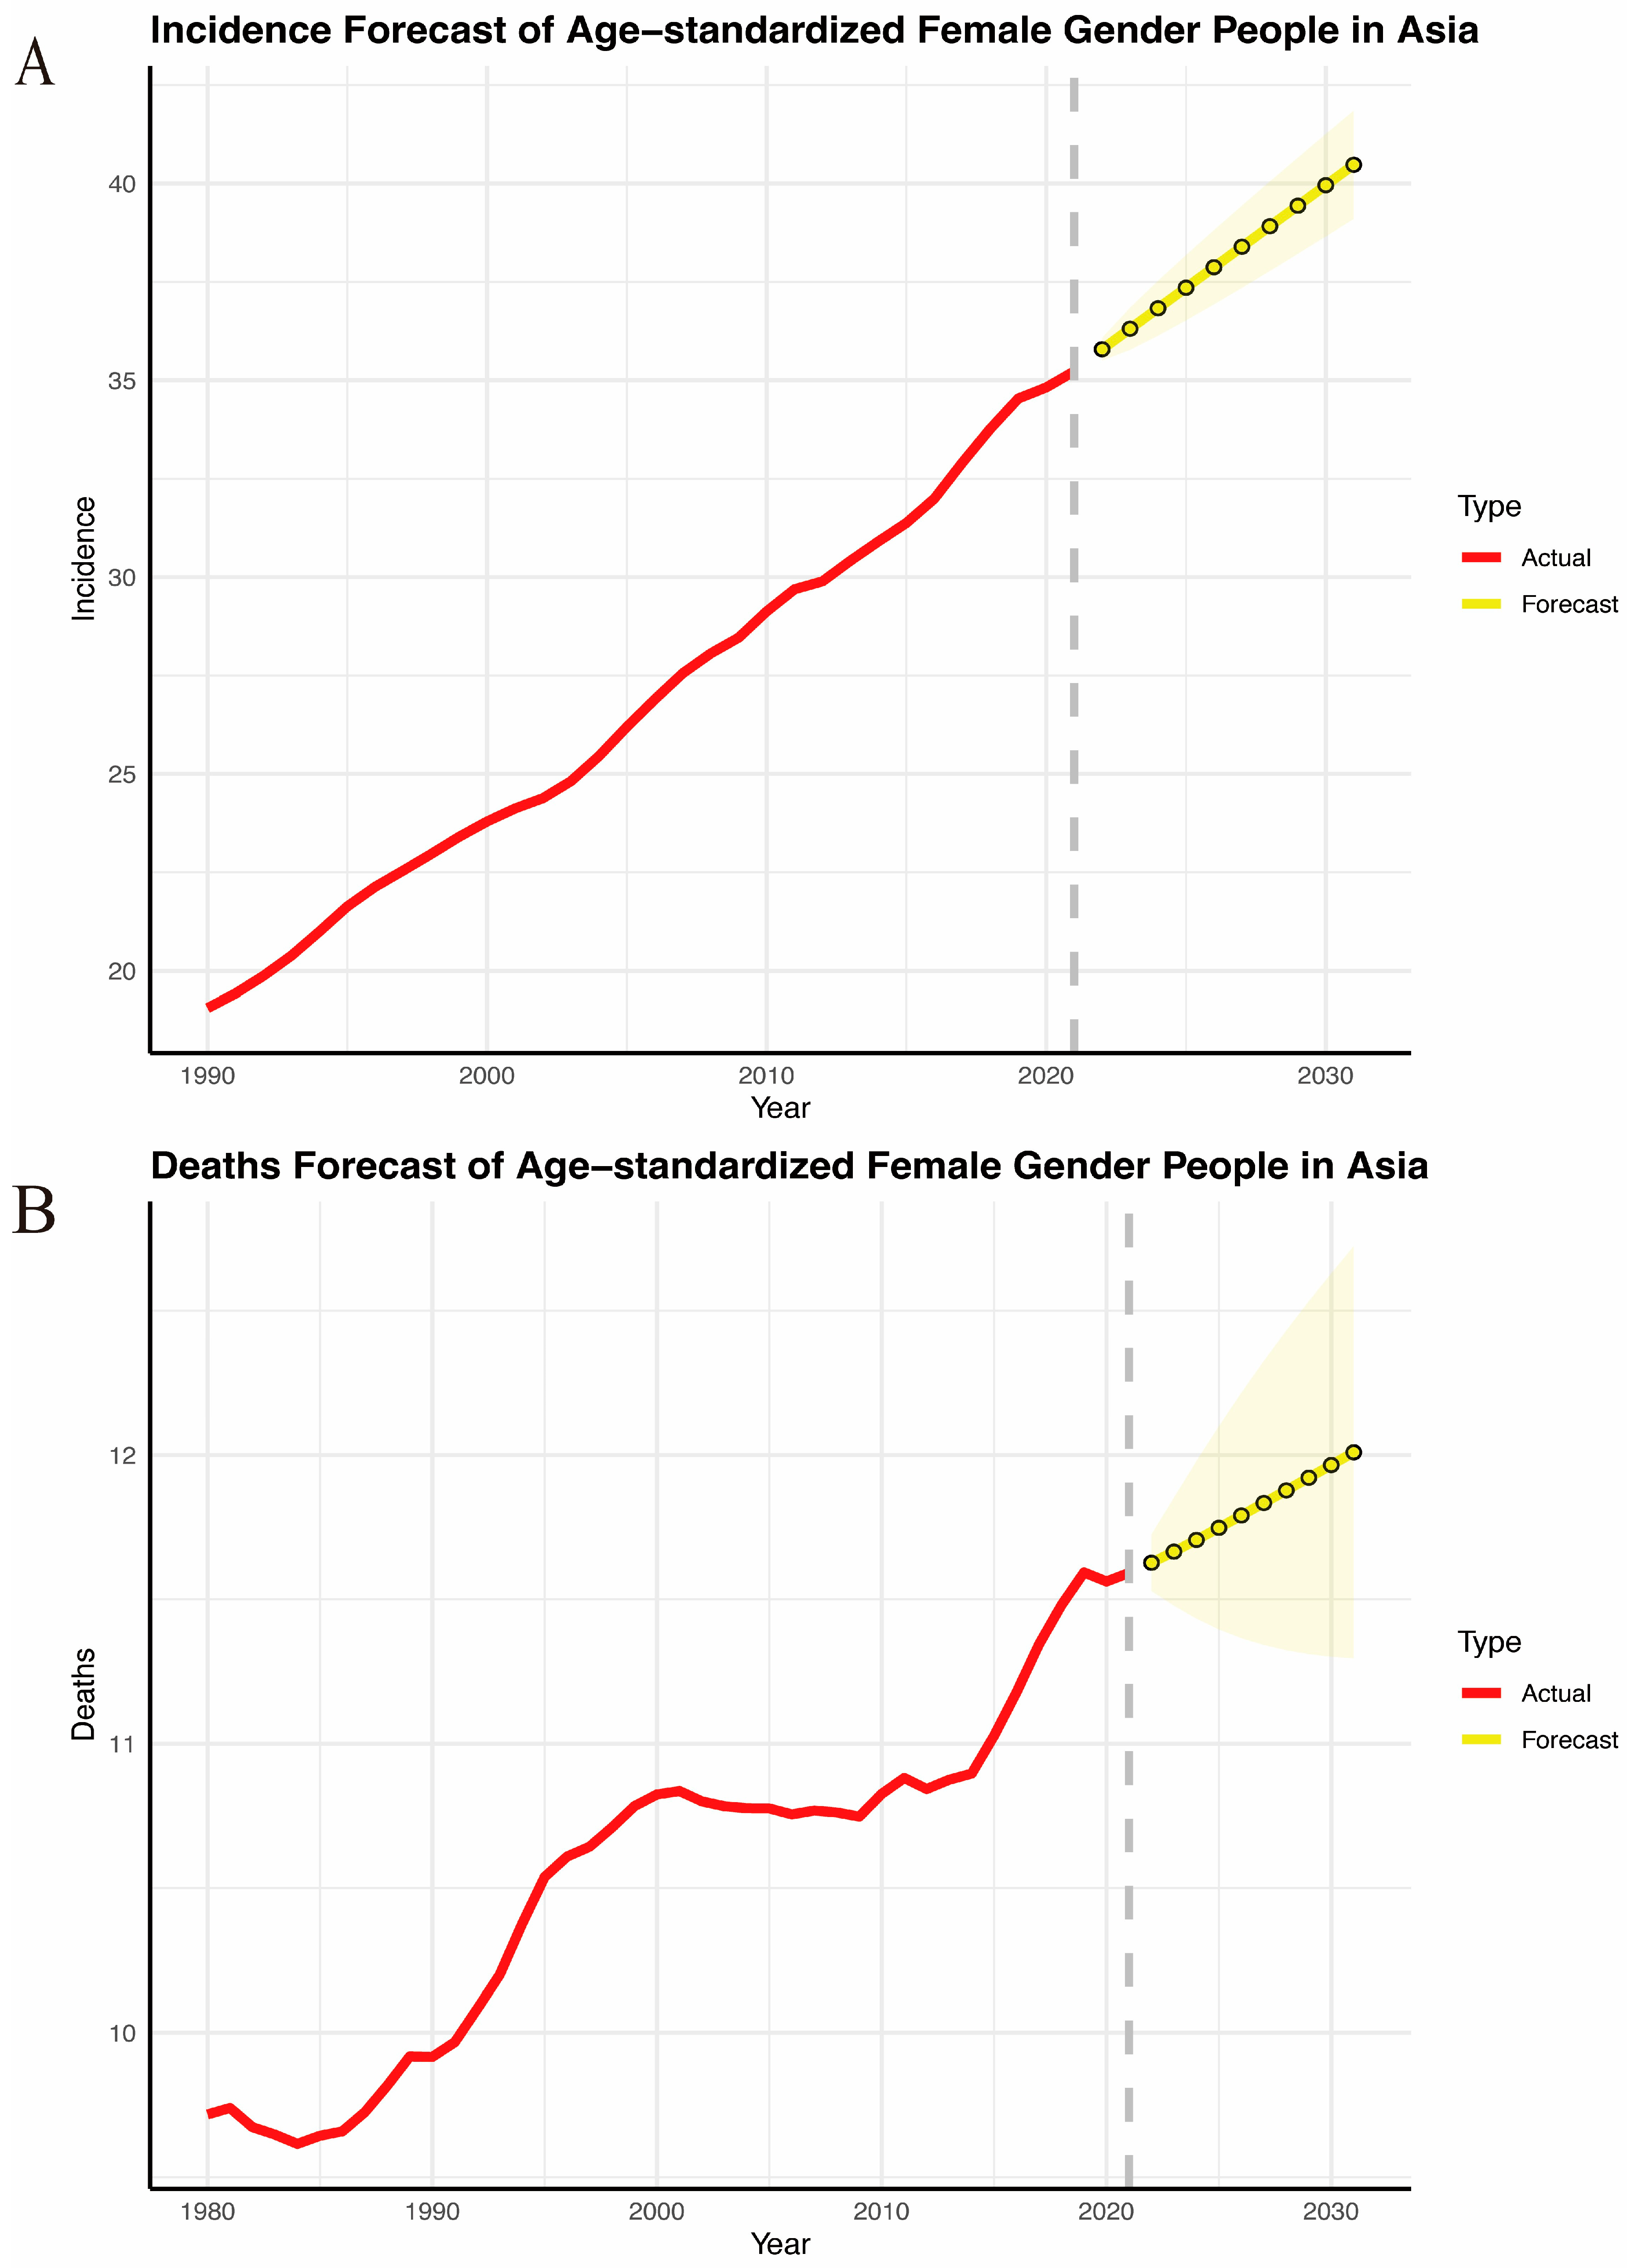
3.7. Projections of Breast Cancer Incidence and Mortality from 2020 to 2031
4. Discussion
5. Conclusions
Supplementary Materials
Author Contributions
Funding
Institutional Review Board Statement
Informed Consent Statement
Data Availability Statement
Acknowledgments
Conflicts of Interest
List of Abbreviations
References
- Ferlay, J.; Soerjomataram, I.; Dikshit, R.; Eser, S.; Mathers, C.; Rebelo, M.; Parkin, D.M.; Forman, D.; Bray, F. Cancer incidence and mortality worldwide: Sources, methods and major patterns in GLOBOCAN 2012. Int. J. Cancer 2015, 136, E359–E386. [Google Scholar] [CrossRef] [PubMed]
- Torre, L.A.; Bray, F.; Siegel, R.L.; Ferlay, J.; Lortet-Tieulent, J.; Jemal, A. Global cancer statistics, 2012. CA Cancer J. Clin. 2015, 65, 87–108. [Google Scholar] [CrossRef]
- Sung, H.; Ferlay, J.; Siegel, R.L.; Laversanne, M.; Soerjomataram, I.; Jemal, A.; Bray, F. Global Cancer Statistics 2020: GLOBOCAN Estimates of Incidence and Mortality Worldwide for 36 Cancers in 185 Countries. CA Cancer J. Clin. 2021, 71, 209–249. [Google Scholar] [CrossRef]
- Jarvandi, S.; Montazeri, A.; Harirchi, I.; Kazemnejad, A. Beliefs and behaviours of Iranian teachers toward early detection of breast cancer and breast self-examination. Public Health 2002, 116, 245–249. [Google Scholar] [CrossRef]
- Harirchi, I.; Ebrahimi, M.; Zamani, N.; Jarvandi, S.; Montazeri, A. Breast cancer in Iran: A review of 903 case records. Public Health 2000, 114, 143–145. [Google Scholar] [CrossRef] [PubMed]
- Kwong, A.; Shin, V.Y.; Ho, J.C.; Kang, E.; Nakamura, S.; Teo, S.-H.; Lee, A.S.G.; Sng, J.-H.; Ginsburg, O.M.; Kurian, A.W.; et al. Comprehensive spectrum of BRCA1 and BRCA2 deleterious mutations in breast cancer in Asian countries. J. Med. Genet. 2016, 53, 15–23. [Google Scholar] [CrossRef]
- Diseases, G.B.D.; Injuries, C. Global burden of 369 diseases and injuries in 204 countries and territories, 1990–2019: A systematic analysis for the Global Burden of Disease Study 2019. Lancet 2020, 396, 1204–1222. [Google Scholar] [CrossRef]
- Tuo, Y.; Li, Y.; Li, Y.; Ma, J.; Yang, X.; Wu, S.; Jin, J.; He, Z. Global, regional, and national burden of thalassemia, 1990–2021: A systematic analysis for the global burden of disease study 2021. EClinicalMedicine 2024, 72, 102619. [Google Scholar] [CrossRef]
- Stevens, G.A.; Alkema, L.; Black, R.E.; Boerma, J.T.; Collins, G.S.; Ezzati, M.; Grove, J.T.; Hogan, D.R.; Hogan, M.C.; Horton, R.; et al. Guidelines for Accurate and Transparent Health Estimates Reporting: The GATHER statement. PLoS Med. 2016, 13, e1002056. [Google Scholar] [CrossRef]
- Mathew, G.; Agha, R.; Grp, S. STROCSS 2021: Strengthening the reporting of cohort, cross-sectional and case-control studies in surgery. Int. J. Surg. 2021, 96, 106165. [Google Scholar] [CrossRef]
- Diseases, G.B.D.; Injuries, C. Global incidence, prevalence, years lived with disability (YLDs), disability-adjusted life-years (DALYs), and healthy life expectancy (HALE) for 371 diseases and injuries in 204 countries and territories and 811 subnational locations, 1990–2021: A systematic analysis for the Global Burden of Disease Study 2021. Lancet 2024, 403, 2133–2161. [Google Scholar] [CrossRef]
- Vosoughi, K.; Stovner, L.J.; Steiner, T.J.; Moradi-Lakeh, M.; Fereshtehnejad, S.M.; Farzadfar, F.; Heydarpour, P.; Malekzadeh, R.; Naghavi, M.; Sahraian, M.A.; et al. The burden of headache disorders in the Eastern Mediterranean Region, 1990–2016: Findings from the Global Burden of Disease study 2016. J. Headache Pain 2019, 20, 40. [Google Scholar] [CrossRef]
- Yang, X.; Zhang, T.; Zhang, X.; Chu, C.; Sang, S. Global burden of lung cancer attributable to ambient fine particulate matter pollution in 204 countries and territories, 1990–2019. Environ. Res. 2022, 204, 112023. [Google Scholar] [CrossRef]
- Yang, X.; Chen, H.; Zhang, T.; Yin, X.; Man, J.; He, Q.; Lu, M. Global, regional, and national burden of blindness and vision loss due to common eye diseases along with its attributable risk factors from 1990 to 2019: A systematic analysis from the global burden of disease study 2019. Aging 2021, 13, 19614–19642. [Google Scholar] [CrossRef] [PubMed]
- Wang, H.; Zhao, S.; Wang, S.; Zheng, Y.; Wang, S.; Chen, H.; Pang, J.; Ma, J.; Yang, X.; Chen, Y. Global magnitude of encephalitis burden and its evolving pattern over the past 30 years. J. Infect. 2022, 84, 777–787. [Google Scholar] [CrossRef] [PubMed]
- Luo, Z.; Jiang, D.; Shan, S.; Zhou, J.; Sun, W.; Wu, J.; Ying, J.; Zhou, L.; Zhu, Y.; Song, P.; et al. Cross-Country Inequalities in Disease Burden and Quality of Care of Stroke, 1990–2021: A Systematic Analysis of the Global Burden of Disease Study 2021. Eur. J. Neurol. 2025, 32, e70050. [Google Scholar] [CrossRef]
- Cao, F.; He, Y.S.; Wang, Y.; Zha, C.K.; Lu, J.M.; Tao, L.M.; Jiang, Z.X.; Pan, H.F. Global burden and cross-country inequalities in autoimmune diseases from 1990 to 2019. Autoimmun. Rev. 2023, 22, 103326. [Google Scholar] [CrossRef] [PubMed]
- Rosenberg, P.S.; Check, D.P.; Anderson, W.F. A web tool for age-period-cohort analysis of cancer incidence and mortality rates. Cancer Epidemiol. Biomark. Prev. 2014, 23, 2296–2302. [Google Scholar] [CrossRef]
- Li, Y.; Zheng, J.; Deng, Y.; Deng, X.; Lou, W.; Wei, B.; Xiang, D.; Hu, J.; Zheng, Y.; Xu, P.; et al. Global Burden of Female Breast Cancer: Age-Period-Cohort Analysis of Incidence Trends From 1990 to 2019 and Forecasts for 2035. Front. Oncol. 2022, 12, 891824. [Google Scholar] [CrossRef]
- Li, Y.; Ning, Y.; Shen, B.; Shi, Y.; Song, N.; Fang, Y.; Ding, X. Temporal trends in prevalence and mortality for chronic kidney disease in China from 1990 to 2019: An analysis of the Global Burden of Disease Study 2019. Clin. Kidney J. 2023, 16, 312–321. [Google Scholar] [CrossRef]
- Anderson, B.O.; Jakesz, R. Breast cancer issues in developing countries: An overview of the Breast Health Global Initiative. World J. Surg. 2008, 32, 2578–2585. [Google Scholar] [CrossRef] [PubMed]
- Hortobagyi, G.N.; de la Garza Salazar, J.; Pritchard, K.; Amadori, D.; Haidinger, R.; Hudis, C.A.; Khaled, H.; Liu, M.-C.; Martin, M.; Namer, M.; et al. The global breast cancer burden: Variations in epidemiology and survival. Clin. Breast Cancer 2005, 6, 391–401. [Google Scholar] [CrossRef] [PubMed]
- Porter, P. “Westernizing” women’s risks? Breast cancer in lower-income countries. N. Engl. J. Med. 2008, 358, 213–216. [Google Scholar] [CrossRef]
- Leong, S.P.L.; Shen, Z.; Liu, T.; Agarwal, G.; Tajima, T.; Paik, N.; Sandelin, K.; Derossis, A.; Cody, H.; Foulkes, W.D. Is breast cancer the same disease in Asian and Western countries? World J. Surg. 2010, 34, 2308–2324. [Google Scholar] [CrossRef]
- Wynder, E.L.; Fujita, Y.; Harris, R.E.; Hirayama, T.; Hiyama, T. Comparative epidemiology of cancer between the United States and Japan. A second look. Cancer 1991, 67, 746–763. [Google Scholar] [CrossRef] [PubMed]
- Unger-Saldana, K. Challenges to the early diagnosis and treatment of breast cancer in developing countries. World J. Clin. Oncol. 2014, 5, 465–477. [Google Scholar] [CrossRef]
- Huo, Q.; Cai, C.; Zhang, Y.; Kong, X.; Jiang, L.; Ma, T.; Zhang, N.; Yang, Q. Delay in diagnosis and treatment of symptomatic breast cancer in China. Ann. Surg. Oncol. 2015, 22, 883–888. [Google Scholar] [CrossRef] [PubMed]
- Richards, M.A.; Westcombe, A.M.; Love, S.B.; Littlejohns, P.; Ramirez, A.J. Influence of delay on survival in patients with breast cancer: A systematic review. Lancet 1999, 353, 1119–1126. [Google Scholar] [CrossRef]
- Ukwenya, A.Y.; Yusufu, L.M.; Nmadu, P.T.; Garba, E.S.; Ahmed, A. Delayed treatment of symptomatic breast cancer: The experience from Kaduna, Nigeria. S. Afr. J. Surg. 2008, 46, 106–110. [Google Scholar]
- Foroozani, E.; Ghiasvand, R.; Mohammadianpanah, M.; Afrashteh, S.; Bastam, D.; Kashefi, F.; Shakarami, S.; Dianatinasab, M. Determinants of delay in diagnosis and end stage at presentation among breast cancer patients in Iran: A multi-center study. Sci. Rep. 2020, 10, 21477. [Google Scholar] [CrossRef]
- Chen, Z.; Yang, J.; Li, S.; Lv, M.; Shen, Y.; Wang, B.; Li, P.; Yi, M.; Zhao, X.; Zhang, L.; et al. Invasive lobular carcinoma of the breast: A special histological type compared with invasive ductal carcinoma. PLoS ONE 2017, 12, e0182397. [Google Scholar] [CrossRef] [PubMed]
- Hutajulu, S.H.; Prabandari, Y.S.; Bintoro, B.S.; Wiranata, J.A.; Widiastuti, M.; Suryani, N.D.; Saptari, R.G.; Taroeno-Hariadi, K.W.; Kurnianda, J.; Purwanto, I.; et al. Delays in the presentation and diagnosis of women with breast cancer in Yogyakarta, Indonesia: A retrospective observational study. PLoS ONE 2022, 17, e0262468. [Google Scholar] [CrossRef]
- Pace, L.E.; Mpunga, T.; Hategekimana, V.; Dusengimana, J.M.V.; Habineza, H.; Bigirimana, J.B.; Mutumbira, C.; Mpanumusingo, E.; Ngiruwera, J.P.; Tapela, N.; et al. Delays in Breast Cancer Presentation and Diagnosis at Two Rural Cancer Referral Centers in Rwanda. Oncologist 2015, 20, 780–788. [Google Scholar] [CrossRef]
- Zhang, H.G.; Wang, G.R.; Zhang, J.N.; Lu, Y.; Jiang, X.L. Patient delay and associated factors among Chinese women with breast cancer A cross-sectional study. Medicine 2019, 98, e17454. [Google Scholar] [CrossRef] [PubMed]
- Mathew, A.; Pandey, M.; Rajan, B. Do younger women with non-metastatic and non-inflammatory breast carcinoma have poor prognosis? World J. Surg. Oncol. 2004, 2, 2. [Google Scholar] [CrossRef] [PubMed]
- Gbenonsi, G.; Boucham, M.; Belrhiti, Z.; Nejjari, C.; Huybrechts, I.; Khalis, M. Health system factors that influence diagnostic and treatment intervals in women with breast cancer in sub-Saharan Africa: A systematic review. BMC Public Health 2021, 21, 1325. [Google Scholar] [CrossRef]
- Brand, N.R.; Qu, L.G.; Chao, A.; Ilbawi, A.M. Delays and Barriers to Cancer Care in Low- and Middle-Income Countries: A Systematic Review. Oncologist 2019, 24, e1371–e1380. [Google Scholar] [CrossRef]
- Schwartz, G.F.; Giuliano, A.E.; Veronesi, U.; Consensus Conference Committee. Proceedings of the consensus conference on the role of sentinel lymph node biopsy in carcinoma of the breast, April 19–22, 2001, Philadelphia, Pennsylvania. Cancer 2002, 94, 2542–2551. [Google Scholar] [CrossRef]
- Edge, S.B.; Niland, J.C.; Bookman, M.A.; Theriault, R.L.; Ottesen, R.; Lepisto, E.; Weeks, J.C. Emergence of sentinel node biopsy in breast cancer as standard-of-care in academic comprehensive cancer centers. J. Natl. Cancer Inst. 2003, 95, 1514–1521. [Google Scholar] [CrossRef]
- Tajima, T. Toward optimized breast cancer care with East/West-linked wisdom. Breast J. 2006, 12, S126–S127. [Google Scholar] [CrossRef]
- Islam, N.; Patel, S.; Brooks-Griffin, Q.; Kemp, P.; Raveis, V.; Riley, L.; Gummi, S.; Nur, P.Q.; Ravenell, J.; Cole, H.; et al. Understanding Barriers and Facilitators to Breast and Cervical Cancer Screening among Muslim Women in New York City: Perspectives from Key Informants. SM J. Community Med. 2017, 3, 1022. [Google Scholar] [PubMed]
- Bedi, M.; Devins, G.M. Cultural considerations for South Asian women with breast cancer. J. Cancer Surviv. 2016, 10, 31–50. [Google Scholar] [CrossRef] [PubMed]
- Flaxman, A.D.; Vahdatpour, A.; James, S.L.; Birnbaum, J.K.; Murray, C.J.; Population Health Metrics Research Consortium. Direct estimation of cause-specific mortality fractions from verbal autopsies: Multisite validation study using clinical diagnostic gold standards. Popul. Health Metr. 2011, 9, 35. [Google Scholar] [CrossRef] [PubMed]
- Mikkelsen, L.; Phillips, D.E.; AbouZahr, C.; Setel, P.W.; de Savigny, D.; Lozano, R.; Lopez, A.D. A global assessment of civil registration and vital statistics systems: Monitoring data quality and progress. Lancet 2015, 386, 1395–1406. [Google Scholar] [CrossRef]

| Incidence (95% UI) | |||||
|---|---|---|---|---|---|
| Location | 1990 | 2021 | EAPC (95% CI) | ||
| Number | Age-Standardized Rate | Number | Age-Standardized Rate | ||
| Indonesia | 12,142.86 (8381.07 to 17,254.81) | 1954.5% (1343.25% to 2758.54%) | 49,021.32 (32,798.52 to 70,414.27) | 3370.56% (2251.37% to 4827.76%) | 164.09% (155.15% to 173.04%) |
| Global | 865,880.71 (824,337.79 to 900,793.7) | 3999.45% (3800.59% to 4160%) | 2,082,737.02 (1,940,351.2 to 2,225,082.58) | 4640.28% (4325.55% to 4956.08%) | 39.93% (35.01% to 44.85%) |
| China | 84,793.22 (68,417.18 to 103,213.48) | 1784.36% (1448.11% to 2165.14%) | 385,837.7 (294,095.4 to 489,009.76) | 3699.83% (2823% to 4694.6%) | 234.34% (226.3% to 242.39%) |
| Malaysia | 1850.72 (1561.32 to 2166.34) | 3249.01% (2745.04% to 3783.5%) | 9383.3 (7852.83 to 11,149.07) | 6124.82% (5133.5% to 7263.09%) | 210.22% (200.51% to 219.94%) |
| Taiwan (Province of China) | 2122.46 (1984.44 to 2270.56) | 2412.15% (2259.17% to 2570.41%) | 10,772.64 (9739.99 to 11,798.99) | 5496.19% (4951.25% to 6021.12%) | 271.93% (233.63% to 310.37%) |
| Viet Nam | 3157.26 (2412.21 to 4128.57) | 1335.19% (1022.74% to 1745.21%) | 15,593.5 (11,666.77 to 21,040.09) | 2658.95% (1996.9% to 3571.58%) | 232.04% (228.05% to 236.03%) |
| Lao People’s Democratic Republic | 211.33 (122.05 to 347.12) | 1703% (1010.69% to 2737.17%) | 813.84 (569.89 to 1120.28) | 2816.51% (1995.77% to 3883.04%) | 174.78% (170.52% to 179.05%) |
| Myanmar | 3409.95 (2284.63 to 4918.5) | 2345.27% (1620.13% to 3317.2%) | 9516.53 (7231.16 to 12,579.91) | 3181.27% (2443.94% to 4194.58%) | 83.68% (76.05% to 91.32%) |
| East Asia | 88,619.9 (72,204.6 to 107,164.47) | 1791.51% (1467.02% to 2159.3%) | 401,075.8 (311,440.05 to 503,565.63) | 3712.02% (2881.8% to 4670.01%) | 234.92% (227.01% to 242.84%) |
| Cambodia | 515.56 (323.82 to 791.76) | 1697.71% (1081.01% to 2574.66%) | 2644.27 (1887.74 to 3563.4) | 3355.16% (2404.93% to 4479.22%) | 225.72% (221.1% to 230.34%) |
| Kazakhstan | 3072.04 (2723.19 to 3437.64) | 3939.47% (3493.28% to 4412.76%) | 3527.27 (2952.58 to 4137.08) | 3224.19% (2699.99% to 3779.88%) | 3% (−17.25% to 23.3%) |
| Democratic People’s Republic of Korea | 1704.23 (1116.39 to 2499.48) | 1608.39% (1058.88% to 2341.26%) | 4465.46 (3014.67 to 6197.05) | 2504.08% (1687.11% to 3485.25%) | 167.04% (156.11% to 177.98%) |
| Sri Lanka | 1086.57 (897.54 to 1309.97) | 1727.39% (1424.46% to 2083.6%) | 4407.79 (2837.9 to 6075.92) | 3038.42% (1955.52% to 4166.43%) | 218.33% (202.95% to 233.74%) |
| Mongolia | 48.69 (38.17 to 61.68) | 798.76% (616.57% to 1021.95%) | 180.63 (140.35 to 224) | 1136.86% (874.4% to 1412.04%) | 107.47% (95.72% to 119.23%) |
| Timor-Leste | 22.76 (13.88 to 34.34) | 1242.4% (796.72% to 1867.62%) | 98.16 (66.31 to 134.13) | 2159.88% (1467.75% to 2971.73%) | 196.89% (174.64% to 219.2%) |
| Southeast Asia | 32,374.19 (27,338.92 to 38,922.22) | 2029.95% (1718.51% to 2416.11%) | 138,058.13 (115,120.95 to 167,272.8) | 3615.01% (3020.23% to 4367.76%) | 183.99% (177.12% to 190.87%) |
| Maldives | 6.59 (3.28 to 11.53) | 1375.44% (766.99% to 2274.42%) | 39.16 (29.59 to 50.24) | 2115.51% (1624.73% to 2677.57%) | 119.29% (90.8% to 147.85%) |
| Philippines | 5261.12 (4687.01 to 5872.97) | 2938.67% (2610.02% to 3300.77%) | 21,322.34 (16,755.57 to 26,651.38) | 4329.55% (3411.05% to 5381.23%) | 117.65% (105.81% to 129.5%) |
| Armenia | 940.98 (878.91 to 1009.78) | 5842.21% (5447.45% to 6268.46%) | 1162.7 (997.47 to 1338.12) | 4883.85% (4211.85% to 5597.81%) | −51.8% (−83.35% to −20.15%) |
| Kyrgyzstan | 537.66 (479.11 to 599.42) | 3111.92% (2764.55% to 3484.54%) | 796.93 (645.47 to 965.1) | 2579.17% (2109.86% to 3122.77%) | −77.58% (−102.18% to −52.91%) |
| Thailand | 4566.96 (3687.53 to 5448.29) | 1983.1% (1611.35% to 2361.79%) | 24,500.44 (18,387.05 to 31,651.67) | 4608.04% (3450.7% to 5993.96%) | 284.56% (257.97% to 311.2%) |
| Central Asia | 9815.88 (9236.58 to 10,314.85) | 3539.24% (3331% to 3722.64%) | 15,355.91 (13,707.25 to 17,195.1) | 3096.86% (2774.83% to 3460.79%) | −18.97% (−26.04% to −11.89%) |
| Republic of Korea | 2563.95 (2218.39 to 3032.28) | 1267.76% (1100.15% to 1499.11%) | 16,111.5 (13,004.46 to 19,081.2) | 3870% (3159.29% to 4600.2%) | 396.83% (361.24% to 432.53%) |
| Georgia | 2033.58 (1813.75 to 2244.41) | 5896.65% (5256.1% to 6493.6%) | 1947.24 (1667.9 to 2257.13) | 6386.47% (5482.06% to 7435.85%) | 35.73% (7.86% to 63.68%) |
| Azerbaijan | 904.59 (751.6 to 1036.51) | 3006.95% (2481.54% to 3447.05%) | 2055.39 (1497.72 to 2669.23) | 3237.07% (2382.18% to 4199.07%) | 36.99% (16.64% to 57.38%) |
| Tajikistan | 368.24 (299.36 to 443.85) | 2344.69% (1898.01% to 2831.83%) | 763.65 (465.14 to 1135.98) | 1990.3% (1257.12% to 2924.83%) | −70.91% (−84.75% to −57.05%) |
| Japan | 28,068.16 (26,425.25 to 29,536.27) | 3237.54% (3052.61% to 3404.01%) | 78,020.96 (67,786.77 to 84,828.31) | 6228.36% (5684.49% to 6649.06%) | 216.24% (192.49% to 240.04%) |
| Nepal | 546.37 (400.45 to 719.37) | 984.98% (713.71% to 1291.67%) | 2082.31 (1493.47 to 2866.08) | 1506.6% (1081.09% to 2086.17%) | 143.49% (120.52% to 166.52%) |
| Singapore | 579.83 (538.13 to 626.86) | 4067.62% (3790.59% to 4386.49%) | 2445.81 (2234.29 to 2659.2) | 5763.29% (5286.2% to 6279.54%) | 156.5% (131.87% to 181.18%) |
| High-income Asia Pacific | 31,234.99 (29,577.64 to 32,777.32) | 2882.9% (2731.28% to 3019.08%) | 96,689.37 (84,849.88 to 104,793.61) | 5562.38% (5048.57% to 5945.23%) | 222.19% (198.57% to 245.85%) |
| Turkmenistan | 275.68 (240.26 to 314.23) | 2335.03% (2034.97% to 2656.77%) | 688.65 (504.42 to 933.63) | 2774.17% (2045.18% to 3745.05%) | 107.77% (58.9% to 156.88%) |
| Bangladesh | 2415.17 (1792.19 to 3347.46) | 843.34% (628.8% to 1154.42%) | 12,911.45 (9662.07 to 16,599.87) | 1589.06% (1191.54% to 2042.41%) | 185.25% (169.37% to 201.16%) |
| Seychelles | 7.57 (6.49 to 8.82) | 2577.61% (2206.99% to 3000.69%) | 28.92 (24.48 to 34.01) | 4723.2% (3988.54% to 5552.07%) | 196.57% (162.46% to 230.78%) |
| Brunei Darussalam | 23.05 (16.87 to 30.39) | 3346.92% (2495.21% to 4428.3%) | 111.09 (85.86 to 137.86) | 4927.3% (3825.9% to 6100.89%) | 180.83% (162.79% to 198.91%) |
| South Asia | 43,743.57 (38,840.26 to 49,290.21) | 1310.65% (1156.87% to 1477.74%) | 205,357.1 (179,412.09 to 235,439.18) | 2462.48% (2151.53% to 2832.02%) | 197.11% (181.25% to 212.99%) |
| Uzbekistan | 1634.42 (1466.66 to 1811.41) | 2430.31% (2182.02% to 2707.2%) | 4233.44 (3450.76 to 5076.11) | 2490.29% (2040.65% to 2986.35%) | 22.54% (−0.17% to 45.3%) |
| India | 33,068.29 (28,439.8 to 38,559.92) | 1210.36% (1033.85% to 1421.85%) | 156,160.16 (131,883.24 to 185,936.55) | 2352.43% (1982.04% to 2804.43%) | 217.69% (196.75% to 238.67%) |
| Pakistan | 7699.25 (6040.58 to 9582.47) | 2646.61% (2066.99% to 3312.7%) | 34,152.67 (24,163.77 to 45,770.5) | 4590.51% (3300.83% to 6076.76%) | 143.55% (126.01% to 161.13%) |
| Mauritius | 88.11 (81.52 to 94.82) | 2023.11% (1872.59% to 2173.82%) | 495.99 (448.3 to 533.48) | 5357.52% (4811.98% to 5782.07%) | 241.69% (202.13% to 281.4%) |
| Bhutan | 14.49 (9.92 to 19.4) | 974.11% (679.96% to 1301.96%) | 50.5 (35 to 70.74) | 1544.16% (1076.73% to 2166.45%) | 144.05% (131.93% to 156.18%) |
| Asia | 221,631.76 (199,674.3 to 247,609.83) | 1905.72% (1719.34% to 2118.09%) | 934,358.23 (837,386.96 to 1,050,748.44) | 3522.78% (3161.77% to 3958.93%) | 199.09% (194.95% to 203.23%) |
| Location | Percentage Change in Age-Standardized Rate, 1990–2021 (per 100,000) | ||
|---|---|---|---|
| Deaths | Incidence | DALYs | |
| Azerbaijan | −16.98% (−38.03% to 6.47%) | 7.65% (−21.54% to 39%) | −19.95% (−41.48% to 2.61%) |
| Georgia | 4.97% (−13.56% to 22.9%) | 8.31% (−10.25% to 28.41%) | −7.64% (−23.93% to 8.84%) |
| Kazakhstan | −38.92% (−50.13% to −25.06%) | −18.16% (−32.86% to 0.48%) | −41.33% (−52.01% to −28.57%) |
| Kyrgyzstan | −36.16% (−47.46% to −20.27%) | −17.12% (−33.81% to 6.06%) | −37.61% (−50.06% to −20.67%) |
| South Asia | 40.82% (19.34% to 66.4%) | 87.88% (60.08% to 121.38%) | 38.67% (18.04% to 63.43%) |
| East Asia | −6.87% (−30.95% to 27.32%) | 107.2% (50.33% to 189.58%) | −5.45% (−30.64% to 31.58%) |
| Mauritius | 96.68% (72.91% to 116.7%) | 164.82% (132.62% to 194.34%) | 99.41% (73.93% to 121.45%) |
| Bangladesh | 22.63% (−14.57% to 84.54%) | 88.42% (29.39% to 188.67%) | 23.63% (−15.39% to 89.02%) |
| China | −8.24% (−33.32% to 27.62%) | 107.35% (49.12% to 193.42%) | −6.67% (−32.59% to 32.16%) |
| Central Asia | −25.82% (−34.07% to −16.89%) | −12.5% (−22.56% to −0.96%) | −29.64% (−38.08% to −20.4%) |
| Democratic People’s Republic of Korea | 15.13% (−24.21% to 70.27%) | 55.69% (2.73% to 134.19%) | 17.35% (−23.56% to 78.05%) |
| Bhutan | 15.67% (−22.78% to 72.53%) | 58.52% (2.86% to 145.13%) | 10.97% (−28.86% to 72.23%) |
| Asia | 16.9% (3.83% to 31.97%) | 84.85% (59.08% to 115.61%) | 17.31% (2.72% to 32.8%) |
| Global | −12.36% (−17.11% to −7.18%) | 16.02% (9.18% to 23.67%) | −9.58% (−15.36% to −3.26%) |
| Japan | 40.04% (30.31% to 46.3%) | 92.38% (76.7% to 108.04%) | 29.22% (23% to 34.37%) |
| India | 44.23% (21.75% to 73.27%) | 94.36% (63.9% to 132.87%) | 38.89% (16.98% to 66.53%) |
| Viet Nam | 29.63% (−7.87% to 81.57%) | 99.14% (35.16% to 183.93%) | 26.5% (−12.01% to 82.73%) |
| Sri Lanka | 10.11% (−31.69% to 60.88%) | 75.9% (7% to 160.35%) | 9.95% (−32.6% to 58.79%) |
| Armenia | −29.26% (−39.4% to −17.01%) | −16.4% (−28.83% to −2.3%) | −40.87% (−49.38% to −31.31%) |
| Nepal | 15.32% (−20.28% to 71.12%) | 52.96% (4.18% to 128.62%) | 12.84% (−23.61% to 74.37%) |
| Thailand | 45.82% (4.55% to 107.5%) | 132.37% (65.97% to 228.45%) | 44.54% (2.58% to 104.64%) |
| Seychelles | 40.89% (13.87% to 73.48%) | 83.24% (45.91% to 129.82%) | 34.72% (8.14% to 68.24%) |
| Pakistan | 48.61% (2.1% to 105.89%) | 73.45% (18.02% to 145.3%) | 47.33% (1.18% to 108.27%) |
| Timor-Leste | 41% (−6.07% to 122.14%) | 73.85% (15.08% to 185.27%) | 42.81% (−7.6% to 136.53%) |
| Taiwan (Province of China) | 40.18% (26.71% to 53.63%) | 127.85% (101.3% to 154.7%) | 34.62% (21.33% to 47.39%) |
| Mongolia | 5.34% (−25.76% to 47.07%) | 42.33% (1.19% to 99.7%) | 1.08% (−28.88% to 38.97%) |
| Southeast Asia | 32.2% (12.19% to 56.32%) | 78.08% (51.59% to 109.68%) | 29.72% (9.2% to 54.69%) |
| Cambodia | 50.59% (−7.58% to 151.12%) | 97.63% (21.55% to 237.98%) | 48.33% (−11.16% to 154.97%) |
| Indonesia | 38.31% (1.64% to 87.58%) | 72.45% (26.4% to 139.38%) | 33.68% (−1.46% to 84.61%) |
| Lao People’s Democratic Republic | 30.85% (−22.13% to 124.46%) | 65.39% (−3.57% to 186.68%) | 28.76% (−25.49% to 127.66%) |
| Malaysia | 32.68% (7.83% to 65.83%) | 88.51% (50.51% to 133.88%) | 29.44% (4.3% to 59.31%) |
| Maldives | −10.69% (−50.56% to 67.08%) | 53.81% (−19.54% to 212.5%) | −13.79% (−56.48% to 85.12%) |
| Republic of Korea | 18.78% (−11.46% to 45.29%) | 205.26% (129.31% to 274.16%) | 20.42% (−8.89% to 48.39%) |
| Myanmar | 5.82% (−31.37% to 62.99%) | 35.65% (−12.61% to 114.99%) | −0.37% (−37.01% to 60.1%) |
| Philippines | 19.26% (−8.77% to 54.57%) | 47.33% (13.1% to 88%) | 30.06% (−1.07% to 67.69%) |
| High-income Asia Pacific | 30.68% (20.3% to 37.75%) | 92.94% (77.77% to 108.41%) | 21.79% (13.52% to 28.45%) |
| Tajikistan | −24.66% (−51.07% to 9.92%) | −15.11% (−46.91% to 27.34%) | −25.82% (−54.4% to 13.01%) |
| Turkmenistan | −8.32% (−31.55% to 23.2%) | 18.81% (−13.55% to 61.89%) | −4.73% (−30.09% to 30.09%) |
| Uzbekistan | −14.89% (−30.08% to 4.69%) | 2.47% (−16.51% to 25.56%) | −14.06% (−29.06% to 4.95%) |
| Singapore | −25.31% (−31.43% to −18%) | 41.69% (26.59% to 59.24%) | −27.74% (−33.66% to −20.73%) |
| Brunei Darussalam | 7.29% (−24.14% to 50.4%) | 47.22% (3.22% to 108.74%) | 5.17% (−26.2% to 49.62%) |
| Deaths (95% UI) | |||||
|---|---|---|---|---|---|
| Location | 1980 | 2021 | EAPC (95% CI) | ||
| Number | Age-Standardized Rate | Number | Age-Standardized Rate | ||
| Timor-Leste | 11.6 (7.16 to 17.51) | 882.24% (546.88% to 1306.85%) | 59.52 (40.68 to 81.51) | 1362.57% (935.87% to 1861.06%) | 106.54% (94.97% to 118.12%) |
| Global | 277,498.86 (261,536.89 to 293,328.4) | 1633.69% (1539.19% to 1722.48%) | 660,925.3 (609,171.34 to 707,181.86) | 1454.99% (1345.14% to 1555.89%) | −39.95% (−45.54% to −34.37%) |
| Kazakhstan | 1310.13 (1154.25 to 1487.8) | 1917.48% (1687.31% to 2179.43%) | 1374.96 (1140.5 to 1602.48) | 1284.55% (1067.48% to 1495.66%) | −93.59% (−117.01% to −70.12%) |
| Singapore | 126.86 (118.25 to 135.38) | 1519.65% (1417.65% to 1623.86%) | 481.65 (434.69 to 522.09) | 1102.01% (1000.65% to 1192.38%) | −72.85% (−84.28% to −61.4%) |
| Viet Nam | 1508.45 (1099.63 to 2046.21) | 775.12% (566.01% to 1048.97%) | 6220.77 (4668.04 to 8248.77) | 1084.85% (817.5% to 1425.45%) | 87.6% (85.46% to 89.75%) |
| Kyrgyzstan | 261.56 (224.23 to 300.11) | 1686.87% (1447.57% to 1933.15%) | 328.55 (268.64 to 392.12) | 1117.45% (918.91% to 1338.24%) | −127.18% (−142.4% to −111.95%) |
| Republic of Korea | 845.64 (637.29 to 1137.23) | 601.06% (454.78% to 799.2%) | 2858.76 (2275.66 to 3450.22) | 625.04% (502.16% to 751.06%) | 41.86% (33.54% to 50.19%) |
| China | 33,812.29 (25,987.93 to 43,763.69) | 993.43% (773.01% to 1270.76%) | 88,106.72 (68,162.64 to 110,341.23) | 823.68% (636.95% to 1033.47%) | −50.65% (−59.52% to −41.77%) |
| East Asia | 34,931.98 (26,977.89 to 45,023.5) | 986.21% (773.75% to 1252.73%) | 92,961.69 (73,229.73 to 115,384.35) | 837.98% (659.5% to 1039.86%) | −43.11% (−51.55% to −34.67%) |
| Mauritius | 53.53 (49.78 to 57.39) | 1660.67% (1548.25% to 1777.18%) | 220.79 (199.62 to 235.25) | 2289.86% (2070.21% to 2436.03%) | 184.07% (151.8% to 216.43%) |
| Tajikistan | 175.17 (130.12 to 227.47) | 1341.88% (1001.76% to 1743.4%) | 374.65 (235.46 to 551.52) | 1060.16% (703.12% to 1505.82%) | −73.13% (−84.46% to −61.78%) |
| Seychelles | 3.35 (2.75 to 3.93) | 1288.5% (1058.7% to 1508.23%) | 13.28 (11.2 to 15.48) | 2177.6% (1841.72% to 2539.19%) | 168.67% (144.21% to 193.19%) |
| Mongolia | 25.87 (18.44 to 35.14) | 491.77% (350.38% to 669.26%) | 84.2 (64.97 to 103.85) | 575.73% (439.33% to 710.15%) | 46.29% (27.77% to 64.85%) |
| Turkmenistan | 127.71 (110.41 to 147.16) | 1321.04% (1142.89% to 1521.67%) | 300.69 (223.56 to 401.87) | 1245.82% (931.73% to 1655.69%) | −26.29% (−55.52% to 3.03%) |
| Taiwan (Province of China) | 393.2 (368.41 to 419.84) | 664.39% (625.47% to 707.09%) | 2817.17 (2538.69 to 3072.85) | 1328.03% (1205.55% to 1441.87%) | 180.9% (158.51% to 203.34%) |
| Uzbekistan | 695.9 (624.59 to 770.24) | 1241.82% (1113.88% to 1376.48%) | 1841.46 (1532.27 to 2209.72) | 1142.23% (953.72% to 1368.86%) | −32.73% (−46.6% to −18.83%) |
| Southeast Asia | 13,021.86 (10,376.24 to 16,349.06) | 1149.53% (931.08% to 1423.94%) | 65,437.37 (54,265.99 to 79,833.65) | 1772.42% (1476.27% to 2151.5%) | 108.44% (100.66% to 116.22%) |
| Democratic People’s Republic of Korea | 726.48 (478.75 to 1084.08) | 914.43% (607.66% to 1363.31%) | 2037.8 (1414.63 to 2733.12) | 1104.25% (768.62% to 1476.72%) | 56.91% (52.67% to 61.16%) |
| Cambodia | 294.12 (175.29 to 465.75) | 1273.07% (783.37% to 1966.24%) | 1493.19 (1073.23 to 1986.48) | 1983.52% (1432.73% to 2611.9%) | 121.47% (116.61% to 126.32%) |
| South Asia | 20,392.37 (17,113.98 to 24,001.36) | 852.23% (715.64% to 1000.55%) | 105,497.03 (92,006.39 to 121,287.14) | 1324.41% (1153.67% to 1528.48%) | 109.39% (101.82% to 116.96%) |
| Indonesia | 4503.83 (2907.43 to 6816.06) | 1039.77% (677.63% to 1578.71%) | 25,686.71 (16,881.86 to 37,378) | 1891.76% (1238.08% to 2728.38%) | 144.53% (129.1% to 159.99%) |
| Asia | 81,979.86 (70,853.04 to 96,019.81) | 971.72% (846.65% to 1122.76%) | 306,494.59 (276,354.3 to 340,676.9) | 1159.18% (1046.6% to 1288.24%) | 44.39% (40.05% to 48.73%) |
| Central Asia | 4010.8 (3792.97 to 4260.45) | 1682.17% (1591.1% to 1786.5%) | 6608.11 (5910.1 to 7374.62) | 1383.16% (1241.38% to 1537.35%) | −53.89% (−64.45% to −43.32%) |
| Armenia | 291.44 (264.05 to 319.23) | 2163.79% (1961.2% to 2365.34%) | 499.58 (437.07 to 580.28) | 2012.56% (1766.33% to 2327.09%) | −0.06% (−37.04% to 37.05%) |
| Brunei Darussalam | 7.97 (5.43 to 11.05) | 1851.72% (1302.29% to 2496.96%) | 38.27 (29.68 to 47.06) | 1830.47% (1432.95% to 2244.45%) | 22.97% (1.99% to 43.99%) |
| Malaysia | 723.51 (577.73 to 919.54) | 1802.31% (1431.05% to 2307.85%) | 3873.77 (3292.24 to 4520.72) | 2653.69% (2254.98% to 3094.57%) | 88.62% (81.43% to 95.82%) |
| India | 15,571.59 (12,570.02 to 19,120.26) | 804.69% (649.6% to 982.93%) | 78,878.68 (66,512.08 to 94,203.94) | 1236.54% (1039.66% to 1476.56%) | 108.25% (97.96% to 118.56%) |
| Bangladesh | 1285.7 (824.54 to 1996.57) | 566.75% (367.9% to 871.99%) | 5572.51 (4201.33 to 7204.89) | 706.56% (533.95% to 908.79%) | 48.05% (38.96% to 57.15%) |
| Japan | 4830.83 (4654.11 to 4967.08) | 686.59% (660.23% to 707.26%) | 16,709.57 (13,790.59 to 18,359.72) | 1026.95% (914.87% to 1087.23%) | 128.85% (118.08% to 139.64%) |
| Nepal | 306.91 (209.94 to 418.18) | 752.45% (526.26% to 1011.57%) | 1125.32 (797.74 to 1561.3) | 865.58% (619.19% to 1203.79%) | 20.49% (4.53% to 36.47%) |
| Bhutan | 6.85 (4.58 to 9.75) | 643.6% (431.94% to 904.27%) | 26.35 (18.5 to 36.04) | 842.81% (598.32% to 1143.9%) | 57.39% (49.71% to 65.09%) |
| Maldives | 3.13 (1.34 to 5.87) | 980.09% (503.33% to 1662.98%) | 14.18 (10.82 to 17.95) | 862.16% (677.13% to 1081.41%) | −20.13% (−41.22% to 1.01%) |
| High-income Asia Pacific | 5811.3 (5521.55 to 6136.36) | 684.59% (649.19% to 722.41%) | 20,088.25 (16,719.24 to 22,018.71) | 926.13% (825.76% to 986.22%) | 103.48% (93.77% to 113.2%) |
| Azerbaijan | 409.6 (346.91 to 482.85) | 1652.79% (1409.42% to 1942.32%) | 863.71 (646.59 to 1112.87) | 1412.37% (1072.58% to 1796.6%) | −41.67% (−50.22% to −33.1%) |
| Myanmar | 1628.61 (1064.77 to 2402.72) | 1468.45% (1002.06% to 2109.49%) | 5256.86 (4038.3 to 7040.74) | 1805.77% (1397.09% to 2379.84%) | 39% (26.98% to 51.04%) |
| Georgia | 713.43 (625.89 to 802.34) | 2224.37% (1958.14% to 2494.54%) | 940.31 (810.32 to 1079.81) | 2811.73% (2415.15% to 3257.84%) | 49.91% (31.25% to 68.61%) |
| Lao People’s Democratic Republic | 127.1 (73.08 to 214.77) | 1327.39% (793.22% to 2153.69%) | 481.74 (339.04 to 670.23) | 1789.92% (1283.61% to 2465.47%) | 90.25% (85.91% to 94.6%) |
| Pakistan | 3221.32 (2279.73 to 4364.56) | 1590.78% (1096.2% to 2136.15%) | 19,894.18 (14,316.08 to 26,527.58) | 2976.42% (2158.15% to 3907.74%) | 162.14% (139.58% to 184.75%) |
| Thailand | 1546.11 (1210.79 to 1889.83) | 1051.75% (821.28% to 1293.59%) | 9036.1 (6777.12 to 11,439.54) | 1597.64% (1200.69% to 2024.31%) | 130.47% (116.45% to 144.51%) |
| Philippines | 2153.98 (1916.17 to 2401.61) | 1860.34% (1659.17% to 2062.09%) | 11,239.95 (8829.03 to 14,035.7) | 2398.4% (1896.87% to 2977.04%) | 53.49% (46.41% to 60.57%) |
| Sri Lanka | 445 (368.86 to 538.51) | 1098.19% (902.01% to 1324.72%) | 1749.24 (1142.55 to 2358.07) | 1186.66% (778.88% to 1599.55%) | 37.88% (28.75% to 47.02%) |
| DALYs (95% UI) | |||||
|---|---|---|---|---|---|
| Location | 1990 | 2021 | EAPC (95% CI) | ||
| Number | Age-Standardized Rate | Number | Age-Standardized Rate | ||
| Myanmar | 92,162.6 (61,697.47 to 133,542.73) | 61,375.16% (41,601.01% to 87,391.65%) | 184,930.73 (137,434.95 to 249,880.71) | 61,148.39% (45,696.91% to 82,468.89%) | −22.4% (−34.08% to −10.71%) |
| Global | 11,036,401.95 (10,434,964.35 to 11,671,316.52) | 50,380.75% (47,590.78% to 53,222.54%) | 20,254,801.61 (18,963,375.54 to 21,574,428.57) | 45,555.95% (42,663.99% to 48,529.8%) | −45.9% (−51.58% to −40.21%) |
| Philippines | 113,044.67 (100,563.65 to 124,430.64) | 59,877.65% (53,150.86% to 66,280.57%) | 389,501.17 (302,649.81 to 491,218.37) | 77,876.81% (60,769.37% to 97,827.51%) | 87.14% (79.78% to 94.5%) |
| East Asia | 1,530,662.9 (1,238,542.99 to 1,864,753.77) | 30,274.63% (24,616.25% to 36,791.43%) | 3,077,415.02 (2,410,862.12 to 3,867,298.92) | 28,625.16% (22,385.77% to 36,040.98%) | −45.78% (−56.76% to −34.79%) |
| High-income Asia Pacific | 282,740.27 (270,991.17 to 295,992.78) | 26,283.3% (25,175.72% to 27,512.98%) | 539,252.33 (480,456.33 to 585,167.58) | 32,010.08% (29,448.68% to 34,412.12%) | 61.62% (45.62% to 77.64%) |
| Turkmenistan | 5497.76 (4790.87 to 6251.72) | 45,792.28% (39,994.95% to 52,040.68%) | 10,917.43 (8083.32 to 14,713.45) | 43,628.34% (32,354.62% to 58,640.53%) | 34.31% (−10.94% to 79.77%) |
| Sri Lanka | 21,547.02 (17,890.12 to 25,782.79) | 33,188.64% (27,568.88% to 39,700.47%) | 52,913.57 (34,230.66 to 72,188.76) | 36,490.28% (23,565.89% to 49,666.51%) | 55.77% (41.5% to 70.06%) |
| Tajikistan | 7578.03 (6063.91 to 9167.29) | 47,603.98% (38,080.31% to 57,592.43%) | 13,958.3 (8412.46 to 21,122.51) | 35,313.18% (22,152.03% to 52,215.84%) | −110.25% (−120.81% to −99.67%) |
| South Asia | 1,106,160.68 (979,672.69 to 1,249,654.8) | 31,491.45% (27,855.72% to 35,557.84%) | 3,710,897.48 (3,235,644.4 to 4,263,863.2) | 43,668.81% (38,058.94% to 50,146.15%) | 96.45% (83.86% to 109.05%) |
| Uzbekistan | 30,719.99 (27,733.86 to 33,696.44) | 45,250.6% (40,693.23% to 49,791.23%) | 66,972.57 (55,330.84 to 80,321.18) | 38,886.25% (32,277.18% to 46,680.48%) | −44.5% (−63.93% to −25.02%) |
| Thailand | 86,975.18 (70,251.2 to 104,180.92) | 37,051.05% (30,083.64% to 44,066.54%) | 285,453.73 (213,281.73 to 364,389.13) | 53,554.61% (40,380.53% to 68,707.48%) | 121.25% (98.41% to 144.13%) |
| China | 1,466,485.56 (1,177,503.3 to 1,798,026.6) | 30,167.57% (24,316.89% to 36,876.26%) | 2,921,096.2 (2,254,510.09 to 3,716,738.57) | 28,154.18% (21,687.06% to 35,810.57%) | −52.15% (−63.9% to −40.39%) |
| Brunei Darussalam | 423.3 (310.19 to 557.77) | 58,767.67% (43,256.2% to 78,588%) | 1427.46 (1101.61 to 1751.85) | 61,807.68% (47,896.34% to 75,667.22%) | 72.46% (45.75% to 99.25%) |
| Armenia | 15,422.1 (14,370.6 to 16,405.17) | 94,695.87% (88,204.38% to 100,770.28%) | 13,247.59 (11,616.82 to 15,194.94) | 55,996.02% (491,77.98% to 64,091.22%) | −174.01% (−206.55% to −141.36%) |
| Japan | 235,044.59 (224,566.71 to 244,515.97) | 27,315.28% (26,171.86% to 28,413.6%) | 425,081.29 (376,703.9 to 462,267.44) | 35,297.26% (32,674.49% to 37,557.83%) | 78.73% (60.78% to 96.71%) |
| Seychelles | 147.24 (125.33 to 171.61) | 50,687.22% (42,879.81% to 59,067.74%) | 420.54 (354.63 to 493.04) | 68,284.69% (57,818.83% to 80,285.99%) | 98.95% (71.07% to 126.91%) |
| Asia | 3,993,737.13 (3,554,041.8 to 4,499,412.85) | 33,306.96% (29,761.04% to 37,431.12%) | 10,335,176.26 (9,280,423.16 to 11,485,399.63) | 39,072.56% (35,105.65% to 43,365.19%) | 38.88% (32.52% to 45.25%) |
| Azerbaijan | 17,484.69 (14,510.46 to 20,075.48) | 57,369.52% (47,351.01% to 65,714.91%) | 29,491.83 (21,841.21 to 38,003.77) | 45,921.5% (34,147.97% to 58,731.71%) | −72.53% (−82.96% to −62.08%) |
| Bangladesh | 67,921.65 (50,342.84 to 93,448.25) | 22,805.47% (16,930.13% to 31,311.93%) | 230,781.71 (172,029.7 to 298,633.45) | 28,194.5% (21,126.94% to 36,353.32%) | 44.32% (30% to 58.65%) |
| Mauritius | 1605.29 (1494.32 to 1738.78) | 36,396.19% (33,865.87% to 39,390.37%) | 6702.16 (6037.52 to 7186.27) | 72,577.38% (65,051.02% to 78,243.15%) | 160.98% (128.32% to 193.74%) |
| Central Asia | 172,576.09 (163,121.53 to 181,554.43) | 61,866.69% (58,413.68% to 65,115.68%) | 218,123.81 (193,868.77 to 245,238.63) | 43,530.89% (38,795.24% to 48,761.36%) | −99.5% (−108.5% to −90.5%) |
| Bhutan | 380.63 (256.51 to 508.63) | 24,143.2% (16,640.68% to 32,179%) | 891.8 (608.66 to 1247.2) | 26,790.65% (18,347.94% to 37,302.32%) | 21.17% (10.91% to 31.45%) |
| Timor-Leste | 593.34 (367.43 to 915.57) | 30,056.41% (18,931.77% to 46,092.84%) | 1975.8 (1342.7 to 2709.39) | 42,922.19% (29,032.86% to 59,028.54%) | 123.86% (100.26% to 147.52%) |
| Republic of Korea | 40,123.37 (35,318.03 to 47,556.34) | 19,512.22% (17,206.33% to 23,161.32%) | 97,660.51 (79,028.92 to 116,208.88) | 23,497.57% (19,219.56% to 27,801.39%) | 68.12% (60.67% to 75.56%) |
| Viet Nam | 66,174.82 (50,516.57 to 86,822.58) | 27,758.82% (21,117.7% to 36,347.48%) | 207,014.67 (154,595.56 to 280,225.74) | 35,114.09% (26,322.98% to 47,212.25%) | 81.92% (77.76% to 86.08%) |
| Georgia | 30,993.45 (27,722.32 to 34,432.93) | 90,450.74% (80,812.06% to 100,310.59%) | 25,077.78 (21,464.47 to 29,112.52) | 83,536.16% (71,255.65% to 97,215.52%) | −2.5% (−26.54% to 21.59%) |
| Taiwan (Province of China) | 29,294.47 (27,473.09 to 31,024.07) | 33,174.87% (31,191.87% to 35,123.86%) | 88,354.87 (80,637.94 to 95,743.26) | 44,660.03% (40,776.4% to 48,263.61%) | 97.16% (77.43% to 116.94%) |
| India | 829,960.28 (711,198.14 to 969,448.51) | 28,929.54% (24,651.3% to 33,879.96%) | 2,706,295.31 (2,287,548.07 to 3,225,998.66) | 40,181.03% (33,932.69% to 47,998.33%) | 106.93% (90.07% to 123.82%) |
| Kazakhstan | 53,688.64 (47,825.39 to 59,859) | 68,583.14% (61,097.51% to 76,521.36%) | 44,122.1 (36,918.78 to 51,609.41) | 40,239.46% (33,742.25% to 47,018.19%) | −131.89% (−164.06% to −99.62%) |
| Cambodia | 13,582.6 (8429.27 to 20,733.35) | 42,725.8% (26,758.85% to 65,226.98%) | 50,872.11 (36,267.04 to 68,945.61) | 63,374.22% (45,315.89% to 85,527.81%) | 125.7% (121.31% to 130.09%) |
| Democratic People’s Republic of Korea | 34,882.88 (22,726.69 to 51,469.25) | 32,478.36% (21,353.19% to 47,823.8%) | 67,963.96 (45,695.19 to 92,799.34) | 38,113.34% (25,671.92% to 52,212.43%) | 65.99% (60.11% to 71.87%) |
| Indonesia | 292,123.5 (201,999.71 to 413,873.59) | 45,203.03% (31,165.87% to 63,995.75%) | 899,965.19 (599,398.97 to 1,302,308.57) | 60,425.17% (40,310.66% to 87,214.57%) | 84.73% (73.58% to 95.89%) |
| Lao People’s Democratic Republic | 5790.43 (3274.38 to 9482.83) | 44,746.84% (25,802.85% to 72,749.7%) | 17,221.49 (12,068.8 to 23,834.25) | 57,614.82% (40,378.53% to 79,828.97%) | 89.16% (82.47% to 95.85%) |
| Malaysia | 38,144.31 (32,071.86 to 45,025.37) | 65,398.77% (54,969.04% to 76,849.95%) | 130,602.74 (109,921.11 to 154,884.53) | 84,650.66% (71,319.05% to 100,147.05%) | 81.2% (67.86% to 94.55%) |
| Mongolia | 1138.98 (883.53 to 1423.75) | 18,323.83% (14,249.06% to 23,049.06%) | 3011.94 (2361.41 to 3696.12) | 18,522.31% (14,419.27% to 22,716.59%) | −21.2% (−38.98% to −3.39%) |
| Nepal | 14,465.44 (10,699.94 to 19,120.04) | 24,592.66% (18,206.96% to 32,178.23%) | 39,306.73 (27,963.31 to 54,509.02) | 27,749.25% (19,869.35% to 38,369.73%) | 43.8% (20.35% to 67.3%) |
| Pakistan | 193,432.67 (152,516.13 to 240,097.03) | 62,943.62% (49,412.35% to 78,277.91%) | 733,621.92 (517,654.81 to 989,920.94) | 92,737.36% (66,590.36% to 123,896.93%) | 87.05% (64.92% to 109.22%) |
| Kyrgyzstan | 10,052.45 (8907.46 to 11,320.52) | 58,135.43% (51,254.32% to 65,776.98%) | 11,324.27 (9173.44 to 13,806.16) | 36,273.41% (29,495.1% to 43,988.34%) | −176.54% (−192.33% to −160.72%) |
| Singapore | 7149.01 (6690.05 to 7637.94) | 49,244.37% (46,112.32% to 52,522.82%) | 15,083.07 (13,862.08 to 16,478.69) | 35,582.85% (32,727.24% to 38,836.61%) | −75.65% (−92.13% to −59.15%) |
| Southeast Asia | 733,104.19 (608,727.57 to 890,815.54) | 44,554.69% (37,050.47% to 54,044.37%) | 2,231,170.6 (1,841,701.79 to 2,734,839.98) | 57,797.87% (47,690.73% to 70,699.18%) | 79% (71.57% to 86.43%) |
| Maldives | 152.7 (74.53 to 270.16) | 30,047.64% (15,939.72% to 50,896.76%) | 484.69 (359.9 to 632.84) | 25,902.61% (19,517.61% to 33,270.75%) | −84.57% (−106.92% to −62.17%) |
Disclaimer/Publisher’s Note: The statements, opinions and data contained in all publications are solely those of the individual author(s) and contributor(s) and not of MDPI and/or the editor(s). MDPI and/or the editor(s) disclaim responsibility for any injury to people or property resulting from any ideas, methods, instructions or products referred to in the content. |
© 2025 by the authors. Licensee MDPI, Basel, Switzerland. This article is an open access article distributed under the terms and conditions of the Creative Commons Attribution (CC BY) license (https://creativecommons.org/licenses/by/4.0/).
Share and Cite
Wang, F.; Liu, S.; Li, J.; Shi, Y.; Geng, Z.; Ji, Y.; Zheng, J. Burdens of Breast Cancer and Projections for 2030 Among Women in Asia: Findings from the 2021 Global Burden of Disease Study. Curr. Oncol. 2025, 32, 267. https://doi.org/10.3390/curroncol32050267
Wang F, Liu S, Li J, Shi Y, Geng Z, Ji Y, Zheng J. Burdens of Breast Cancer and Projections for 2030 Among Women in Asia: Findings from the 2021 Global Burden of Disease Study. Current Oncology. 2025; 32(5):267. https://doi.org/10.3390/curroncol32050267
Chicago/Turabian StyleWang, Feng, Sixuan Liu, Jianwei Li, Yuzhen Shi, Zhaohui Geng, Yajie Ji, and Jie Zheng. 2025. "Burdens of Breast Cancer and Projections for 2030 Among Women in Asia: Findings from the 2021 Global Burden of Disease Study" Current Oncology 32, no. 5: 267. https://doi.org/10.3390/curroncol32050267
APA StyleWang, F., Liu, S., Li, J., Shi, Y., Geng, Z., Ji, Y., & Zheng, J. (2025). Burdens of Breast Cancer and Projections for 2030 Among Women in Asia: Findings from the 2021 Global Burden of Disease Study. Current Oncology, 32(5), 267. https://doi.org/10.3390/curroncol32050267