CT Texture Analysis of Adrenal Pheochromocytomas: A Pilot Study

 ,
,  , ,
, ,  ,
,  , and
, and
Abstract
1. Introduction
2. Materials and Methods
2.1. Patients
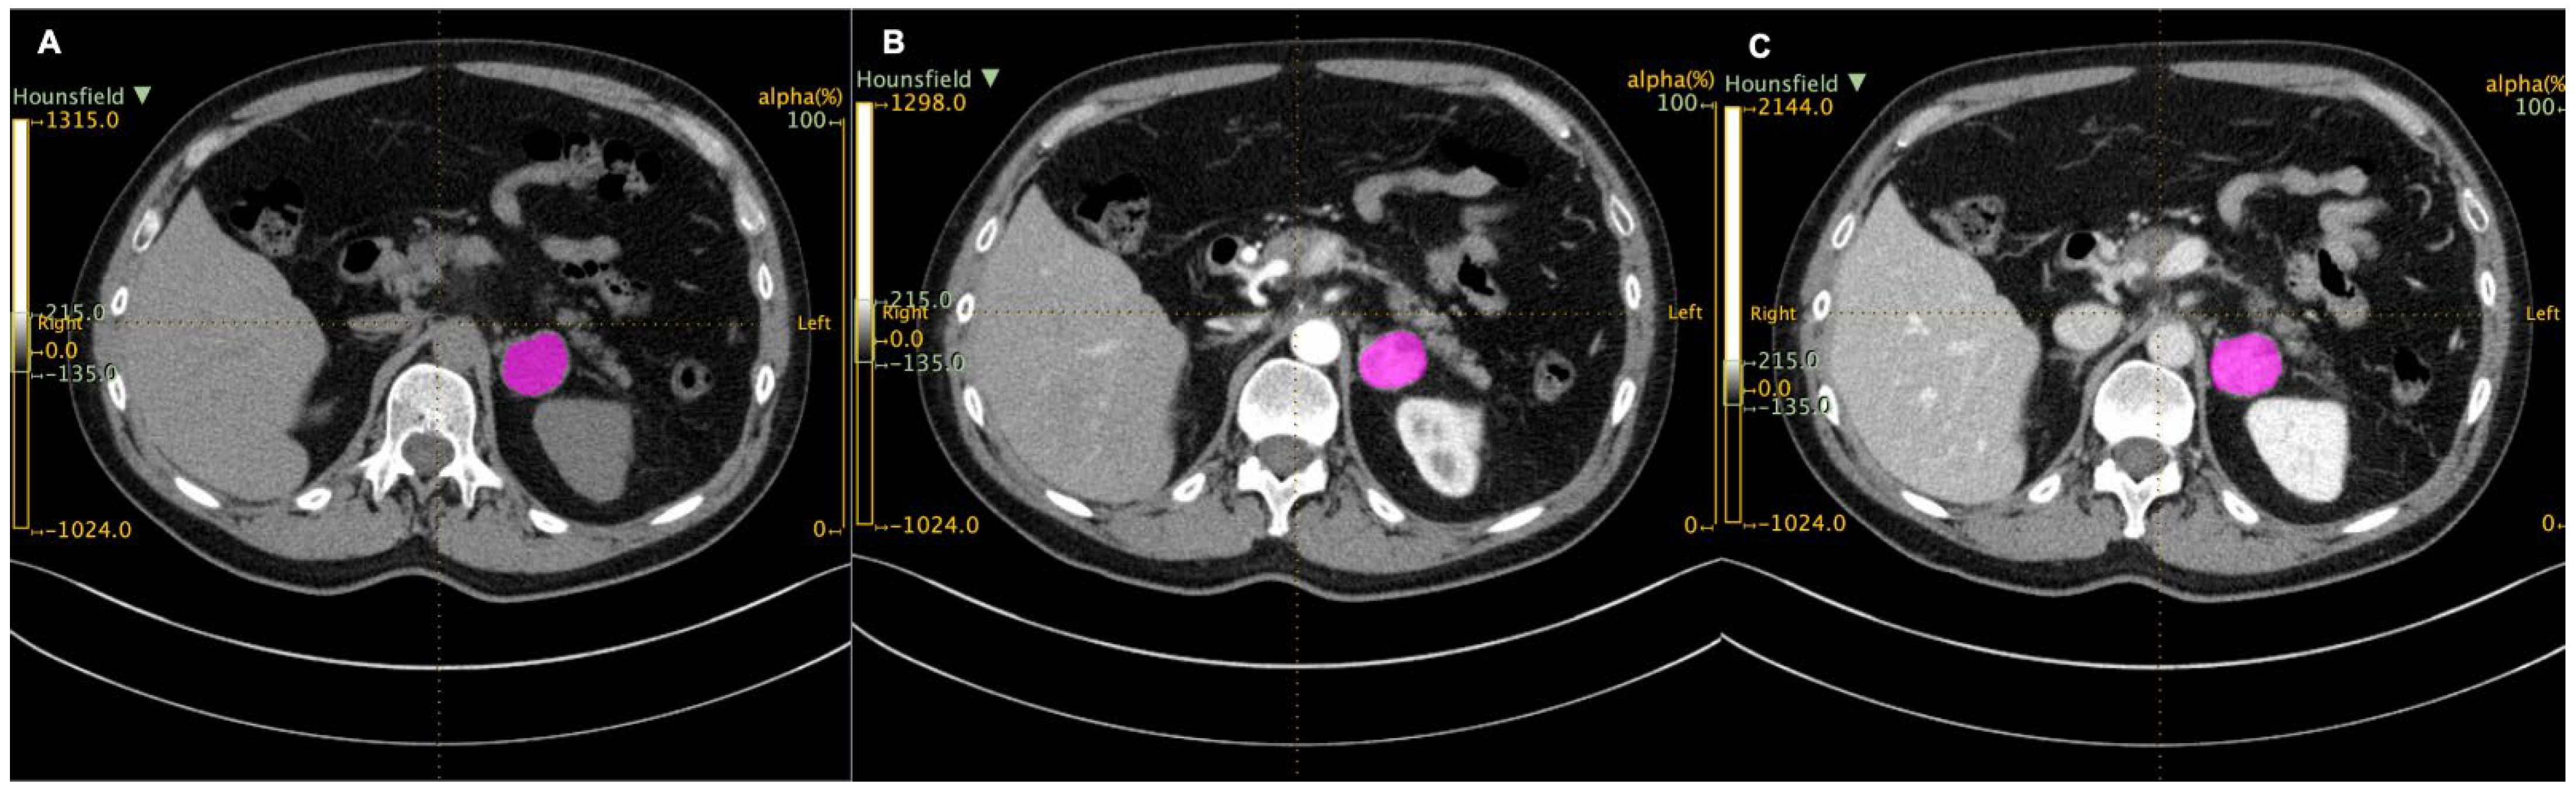
2.2. Image Analysis
2.3. Statistical Analysis
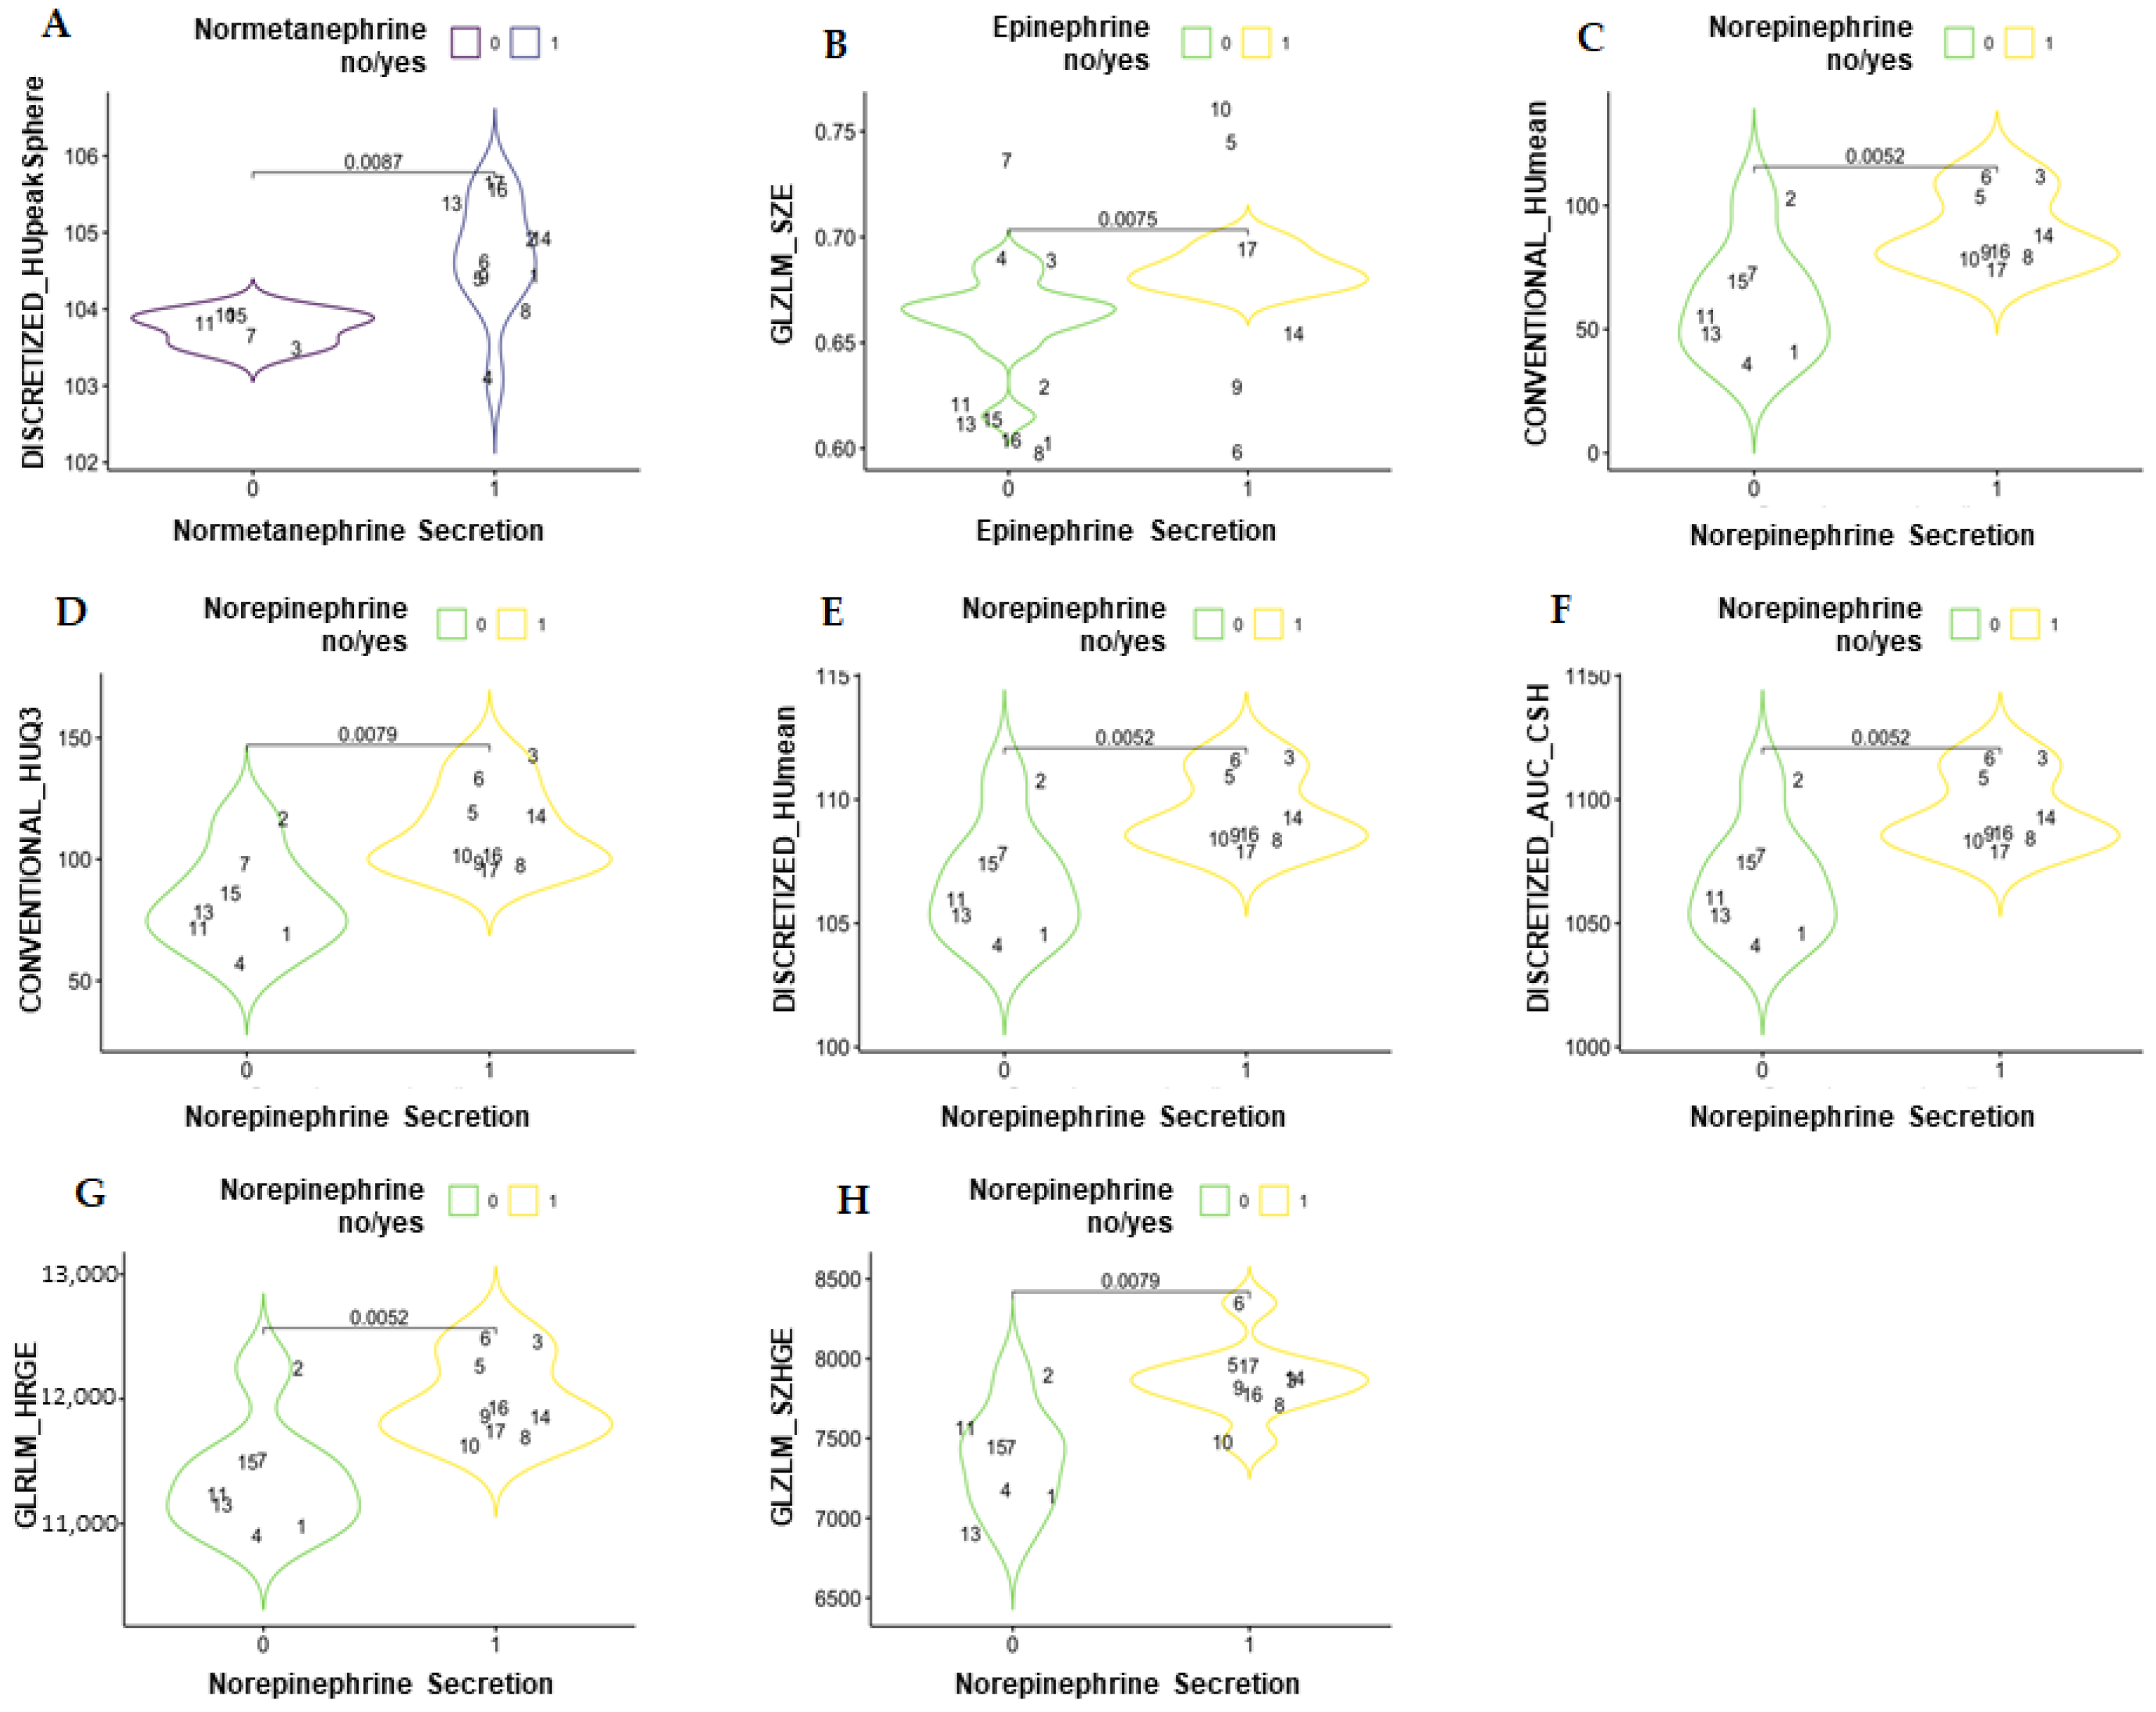
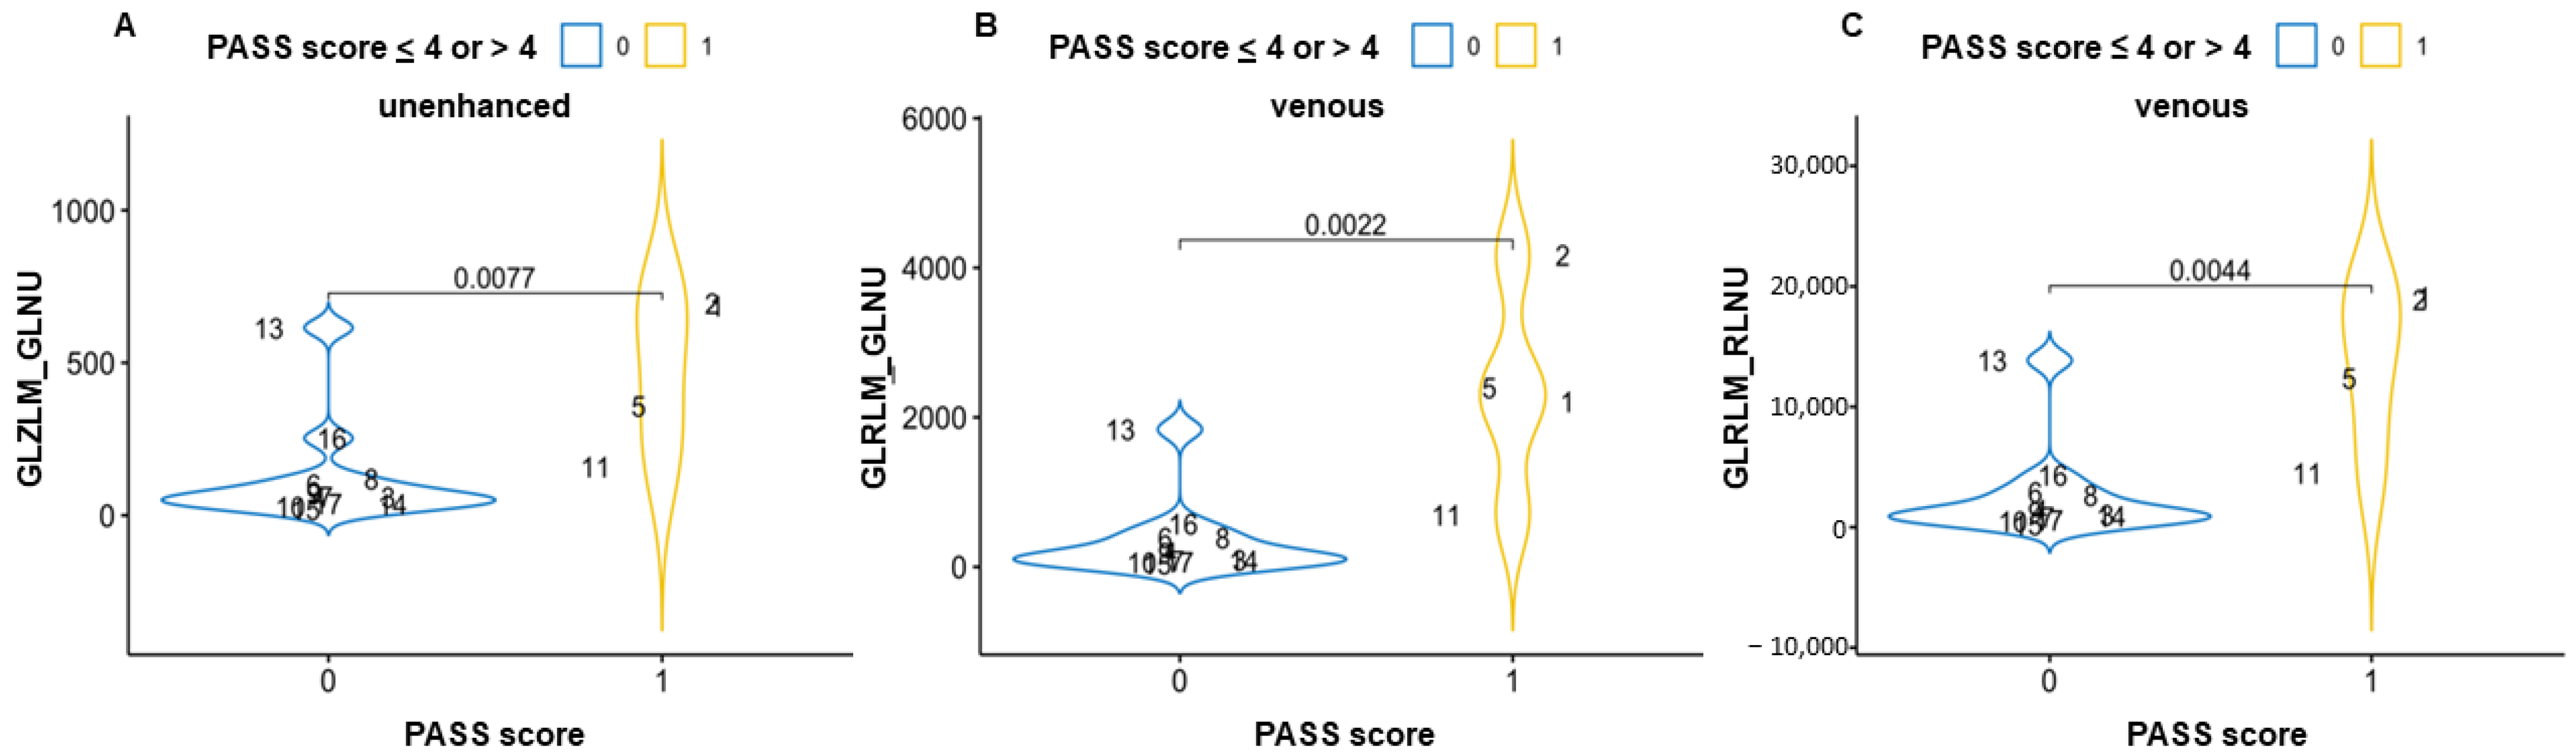
3. Results
4. Discussion
Supplementary Materials
Author Contributions
Funding
Institutional Review Board Statement
Informed Consent Statement
Data Availability Statement
Conflicts of Interest
References
- Lenders, J.W.; Duh, Q.Y.; Eisenhofer, G.; Gimenez-Roqueplo, A.P.; Grebe, S.K.; Murad, M.H.; Naruse, M.; Pacak, K.; Young, W.F., Jr. Pheochromocytoma and paraganglioma: An endocrine society clinical practice guideline. J. Clin. Endocrinol. Metab. 2014, 99, 1915–1942. [Google Scholar] [CrossRef] [PubMed]
- Canu, L.; Van Hemert, J.A.; Kerstens, M.N.; Hartman, R.P.; Khanna, A.; Kraljevic, I.; Kastelan, D.; Badiu, C.; Ambroziak, U.; Tabarin, A.; et al. CT Characteristics of Pheochromocytoma: Relevance for the Evaluation of Adrenal Incidentaloma. J. Clin. Endocrinol. Metab. 2019, 104, 312–318. [Google Scholar] [CrossRef] [PubMed]
- Favier, J.; Amar, L.; Gimenez-Roqueplo, A.P. Paraganglioma and phaeochromocytoma: From genetics to personalized medicine. Nat. Rev. Endocrinol. 2015, 11, 101–111. [Google Scholar] [CrossRef] [PubMed]
- Grasso, M.; Boscaro, M.; Scaroni, C.; Ceccato, F. Secondary Arterial Hypertension: From Routine Clinical Practice to Evidence in Patients with Adrenal Tumor. High Blood Press. Cardiovasc. Prev. 2018, 25, 345–354. [Google Scholar] [CrossRef]
- Deutschbein, T.; Reimondo, G.; Di Dalmazi, G.; Bancos, I.; Patrova, J.; Vassiliadi, D.A.; Nekic, A.B.; Debono, M.; Lardo, P.; Ceccato, F.; et al. Age-dependent and sex-dependent disparity in mortality in patients with adrenal incidentalomas and autonomous cortisol secretion: An international, retrospective, cohort study. Lancet Diabetes Endocrinol. 2022, 10, 499–508. [Google Scholar] [CrossRef]
- Voltan, G.; Boscaro, M.; Armanini, D.; Scaroni, C.; Ceccato, F. A multidisciplinary approach to the management of adrenal incidentaloma. Expert Rev. Endocrinol. Metab. 2021, 16, 201–212. [Google Scholar] [CrossRef]
- Blake, M.A.; Kalra, M.K.; Maher, M.M.; Sahani, D.V.; Sweeney, A.T.; Mueller, P.R.; Hahn, P.F.; Boland, G.W. Pheochromocytoma: An imaging chameleon. Radiographics 2004, 24 (Suppl. 1), S87–S99. [Google Scholar] [CrossRef]
- Thompson, L.D. Pheochromocytoma of the Adrenal gland Scaled Score (PASS) to separate benign from malignant neoplasms: A clinicopathologic and immunophenotypic study of 100 cases. Am. J. Surg. Pathol. 2002, 26, 551–566. [Google Scholar] [CrossRef]
- Chrisoulidou, A.; Kaltsas, G.; Ilias, I.; Grossman, A.B. The diagnosis and management of malignant phaeochromocytoma and paraganglioma. Endocr. Relat. Cancer 2007, 14, 569–585. [Google Scholar] [CrossRef]
- Carrasquillo, J.A.; Chen, C.C.; Jha, A.; Ling, A.; Lin, F.I.; Pryma, D.A.; Pacak, K. Imaging of Pheochromocytoma and Paraganglioma. J. Nucl. Med. 2021, 62, 1033–1042. [Google Scholar] [CrossRef]
- Maurea, S.; Cuocolo, A.; Imbriaco, M.; Pellegrino, T.; Fusari, M.; Cuocolo, R.; Liuzzi, R. Imaging characterization of benign and malignant pheochromocytoma or paraganglioma: Comparison between MIBG uptake and MR signal intensity ratio. Ann. Nucl. Med. 2012, 26, 670–675. [Google Scholar] [CrossRef]
- Lastoria, S.; Maurea, S.; Vergara, E.; Acampa, W.; Varrella, P.; Klain, M.; Muto, P.; Bernardy, J.D.; Salvatore, M. Comparison of labeled MIBG and somatostatin analogs in imaging neuroendocrine tumors. Q. J. Nucl. Med. 1995, 39 (Suppl. 1), 145–149. [Google Scholar]
- Crimì, F.; Quaia, E.; Cabrelle, G.; Zanon, C.; Pepe, A.; Regazzo, D.; Tizianel, I.; Scaroni, C.; Ceccato, F. Diagnostic Accuracy of CT Texture Analysis in Adrenal Masses: A Systematic Review. Int. J. Mol. Sci. 2022, 23, 637. [Google Scholar] [CrossRef]
- Yi, X.; Guan, X.; Zhang, Y.; Liu, L.; Long, X.; Yin, H.; Wang, Z.; Li, X.; Liao, W.; Chen, B.T.; et al. Radiomics improves efficiency for differentiating subclinical pheochromocytoma from lipid-poor adenoma: A predictive, preventive and personalized medical approach in adrenal incidentalomas. EPMA J. 2018, 9, 421–429. [Google Scholar] [CrossRef]
- Raşit Mendi, B.A.; Gülbay, M. A CT Radiomics Analysis of the Adrenal Masses: Can We Discriminate Lipid-Poor Adenomas from the Pheochromocytoma and Malignant Masses? Curr. Med. Imaging 2022. [Google Scholar] [CrossRef]
- Laderian, B.; Ahmed, F.S.; Zhao, B.; Wilkerson, J.; Dercle, L.; Yang, H.; Guo, X.; Pacak, K.; Lee, J.A.; Bates, S.E.; et al. Role of radiomics to differentiate benign from malignant pheochromocytomas and paragangliomas on contrast enhanced CT scans. J. Clin. Oncol. 2019, 37 (Suppl. 15), e14596. [Google Scholar] [CrossRef]
- Nioche, C.; Orlhac, F.; Boughdad, S.; Reuzé, S.; Goya-Outi, J.; Robert, C.; Pellot-Barakat, C.; Soussan, M.; Frouin, F.; Buvat, I.; et al. LIFEx: A Freeware for Radiomic Feature Calculation in Multimodality Imaging to Accelerate Advances in the Characterization of Tumor Heterogeneity. Cancer Res. 2018, 78, 4786–4789. [Google Scholar] [CrossRef]
- Shoemaker, K.; Hobbs, B.P.; Bharath, K.; Ng, C.S.; Baladandayuthapani, V. Tree-based Methods for Characterizing Tumor Density Heterogeneity. Pac. Symp. Biocomput. 2018, 23, 216–227. [Google Scholar]
- Shi, B.; Zhang, G.M.; Xu, M.; Jin, Z.Y.; Sun, H. Distinguishing metastases from benign adrenal masses: What can CT texture analysis do? Acta Radiol. 2019, 60, 1553–1561. [Google Scholar] [CrossRef]
- Ansquer, C.; Drui, D.; Mirallié, E.; Renaudin-Autain, K.; Denis, A.; Gimenez-Roqueplo, A.P.; Leux, C.; Toulgoat, F.; Kraeber-Bodéré, F.; Carlier, T. Usefulness of FDG-PET/CT-Based Radiomics for the Characterization and Genetic Orientation of Pheochromocytomas Before Surgery. Cancers 2020, 12, 2424. [Google Scholar] [CrossRef]
- De Leo, A.; Vara, G.; Paccapelo, A.; Balacchi, C.; Vicennati, V.; Tucci, L.; Pagotto, U.; Selva, S.; Ricci, C.; Alberici, L.; et al. Computerized tomography texture analysis of pheochromocytoma: Relationship with hormonal and histopathological data. J. Endocrinol. Investig. 2022, 45, 1935–1944. [Google Scholar] [CrossRef] [PubMed]
- Ceccato, F.; Tizianel, I.; Voltan, G.; Maggetto, G.; Merante Boschin, I.; Quaia, E.; Crimì, F.; Scaroni, C. Attenuation Value in Adrenal Incidentalomas: A Longitudinal Study. Front. Endocrinol. 2021, 12, 794197. [Google Scholar] [CrossRef] [PubMed]
- Falhammar, H.; Kjellman, M.; Calissendorff, J. Initial clinical presentation and spectrum of pheochromocytoma: A study of 94 cases from a single center. Endocr. Connect. 2018, 7, 186–192. [Google Scholar] [CrossRef] [PubMed]
- Ceccato, F.; Barbot, M.; Scaroni, C.; Boscaro, M. Frequently asked questions and answers (if any) in patients with adrenal incidentaloma. J. Endocrinol. Investig. 2021, 44, 2749–2763. [Google Scholar] [CrossRef]
- De Leo, A.; Mosconi, C.; Zavatta, G.; Tucci, L.; Nanni, C.; Selva, S.; Balacchi, C.; Ceccarelli, C.; Santini, D.; Pantaleo, M.A.; et al. Radiologically defined lipid-poor adrenal adenomas: Histopathological characteristics. J. Endocrinol. Investig. 2020, 43, 1197–1204. [Google Scholar] [CrossRef]
- De Margerie-Mellon, C.; Chassagnon, G. Artificial intelligence: A critical review of applications for lung nodule and lung cancer. Diagn. Interv. Imaging. 2023, 104, 11–17. [Google Scholar] [CrossRef]
- Navin, P.J.; Moynagh, M.R. Optimal and novel imaging of the adrenal glands. Curr. Opin. Endocrinol. Diabetes Obes. 2022, 29, 253–262. [Google Scholar] [CrossRef]


| Case, Gender | Age | Adrenal Size | Genetic Testing | PASS Score | Catecholamine Secretion |
|---|---|---|---|---|---|
| 1, male | 53 | 79 mm | wild type | 5 | MN, NMN |
| 2, male | 41 | 86 mm | wild type | 9 | NMN |
| 3, male | 51 | 33 mm | SDHB mutation | 0 | NA |
| 4, female | 49 | 30 mm | wild type | 1 | MN, NMN |
| 5, male | 28 | 72 mm | wild type | 12 | A, NA, MN, NMN |
| 6, female | 28 | 40 mm | TMEM mutation | 1 | A, NA, MN, NMN, VMA |
| 7, male | 51 | 32 mm | wild type | 2 | NS |
| 8, male | 47 | 54 mm | wild type | 4 | NA, DA, NMN |
| 9, female | 63 | 36 mm | wild type | 0 | A, NA, NMN |
| 10, male | 28 | 30 mm | wild type | 1 | A, DA |
| 11, male | 63 | 38 mm | wild type | 13 | DA |
| 12, male | 51 | 150 mm | wild type | n.a. | A, NA, DA, MN, NMN |
| 13, male | 43 | 80 mm | wild type | 2 | NMN |
| 14, male | 72 | 28 mm | wild type | 0 | A, NA, NMN |
| 15, female | 62 | 19 mm | wild type | 1 | NS |
| 16, male | 30 | 54 mm | SDHB VUS | 1 | NA, NMN, VMA |
| 17, male | 75 | 25 mm | wild type | 1 | A, NA, NMN, VMA |
Disclaimer/Publisher’s Note: The statements, opinions and data contained in all publications are solely those of the individual author(s) and contributor(s) and not of MDPI and/or the editor(s). MDPI and/or the editor(s) disclaim responsibility for any injury to people or property resulting from any ideas, methods, instructions or products referred to in the content. |
© 2023 by the authors. Licensee MDPI, Basel, Switzerland. This article is an open access article distributed under the terms and conditions of the Creative Commons Attribution (CC BY) license (https://creativecommons.org/licenses/by/4.0/).
Share and Cite
Crimì, F.; Agostini, E.; Toniolo, A.; Torresan, F.; Iacobone, M.; Tizianel, I.; Scaroni, C.; Quaia, E.; Campi, C.; Ceccato, F. CT Texture Analysis of Adrenal Pheochromocytomas: A Pilot Study. Curr. Oncol. 2023, 30, 2169-2177. https://doi.org/10.3390/curroncol30020167
Crimì F, Agostini E, Toniolo A, Torresan F, Iacobone M, Tizianel I, Scaroni C, Quaia E, Campi C, Ceccato F. CT Texture Analysis of Adrenal Pheochromocytomas: A Pilot Study. Current Oncology. 2023; 30(2):2169-2177. https://doi.org/10.3390/curroncol30020167
Chicago/Turabian StyleCrimì, Filippo, Elena Agostini, Alessandro Toniolo, Francesca Torresan, Maurizio Iacobone, Irene Tizianel, Carla Scaroni, Emilio Quaia, Cristina Campi, and Filippo Ceccato. 2023. "CT Texture Analysis of Adrenal Pheochromocytomas: A Pilot Study" Current Oncology 30, no. 2: 2169-2177. https://doi.org/10.3390/curroncol30020167
APA StyleCrimì, F., Agostini, E., Toniolo, A., Torresan, F., Iacobone, M., Tizianel, I., Scaroni, C., Quaia, E., Campi, C., & Ceccato, F. (2023). CT Texture Analysis of Adrenal Pheochromocytomas: A Pilot Study. Current Oncology, 30(2), 2169-2177. https://doi.org/10.3390/curroncol30020167