A Deep Learning Workflow for Mass-Forming Intrahepatic Cholangiocarcinoma and Hepatocellular Carcinoma Classification Based on MRI

Abstract
1. Introduction
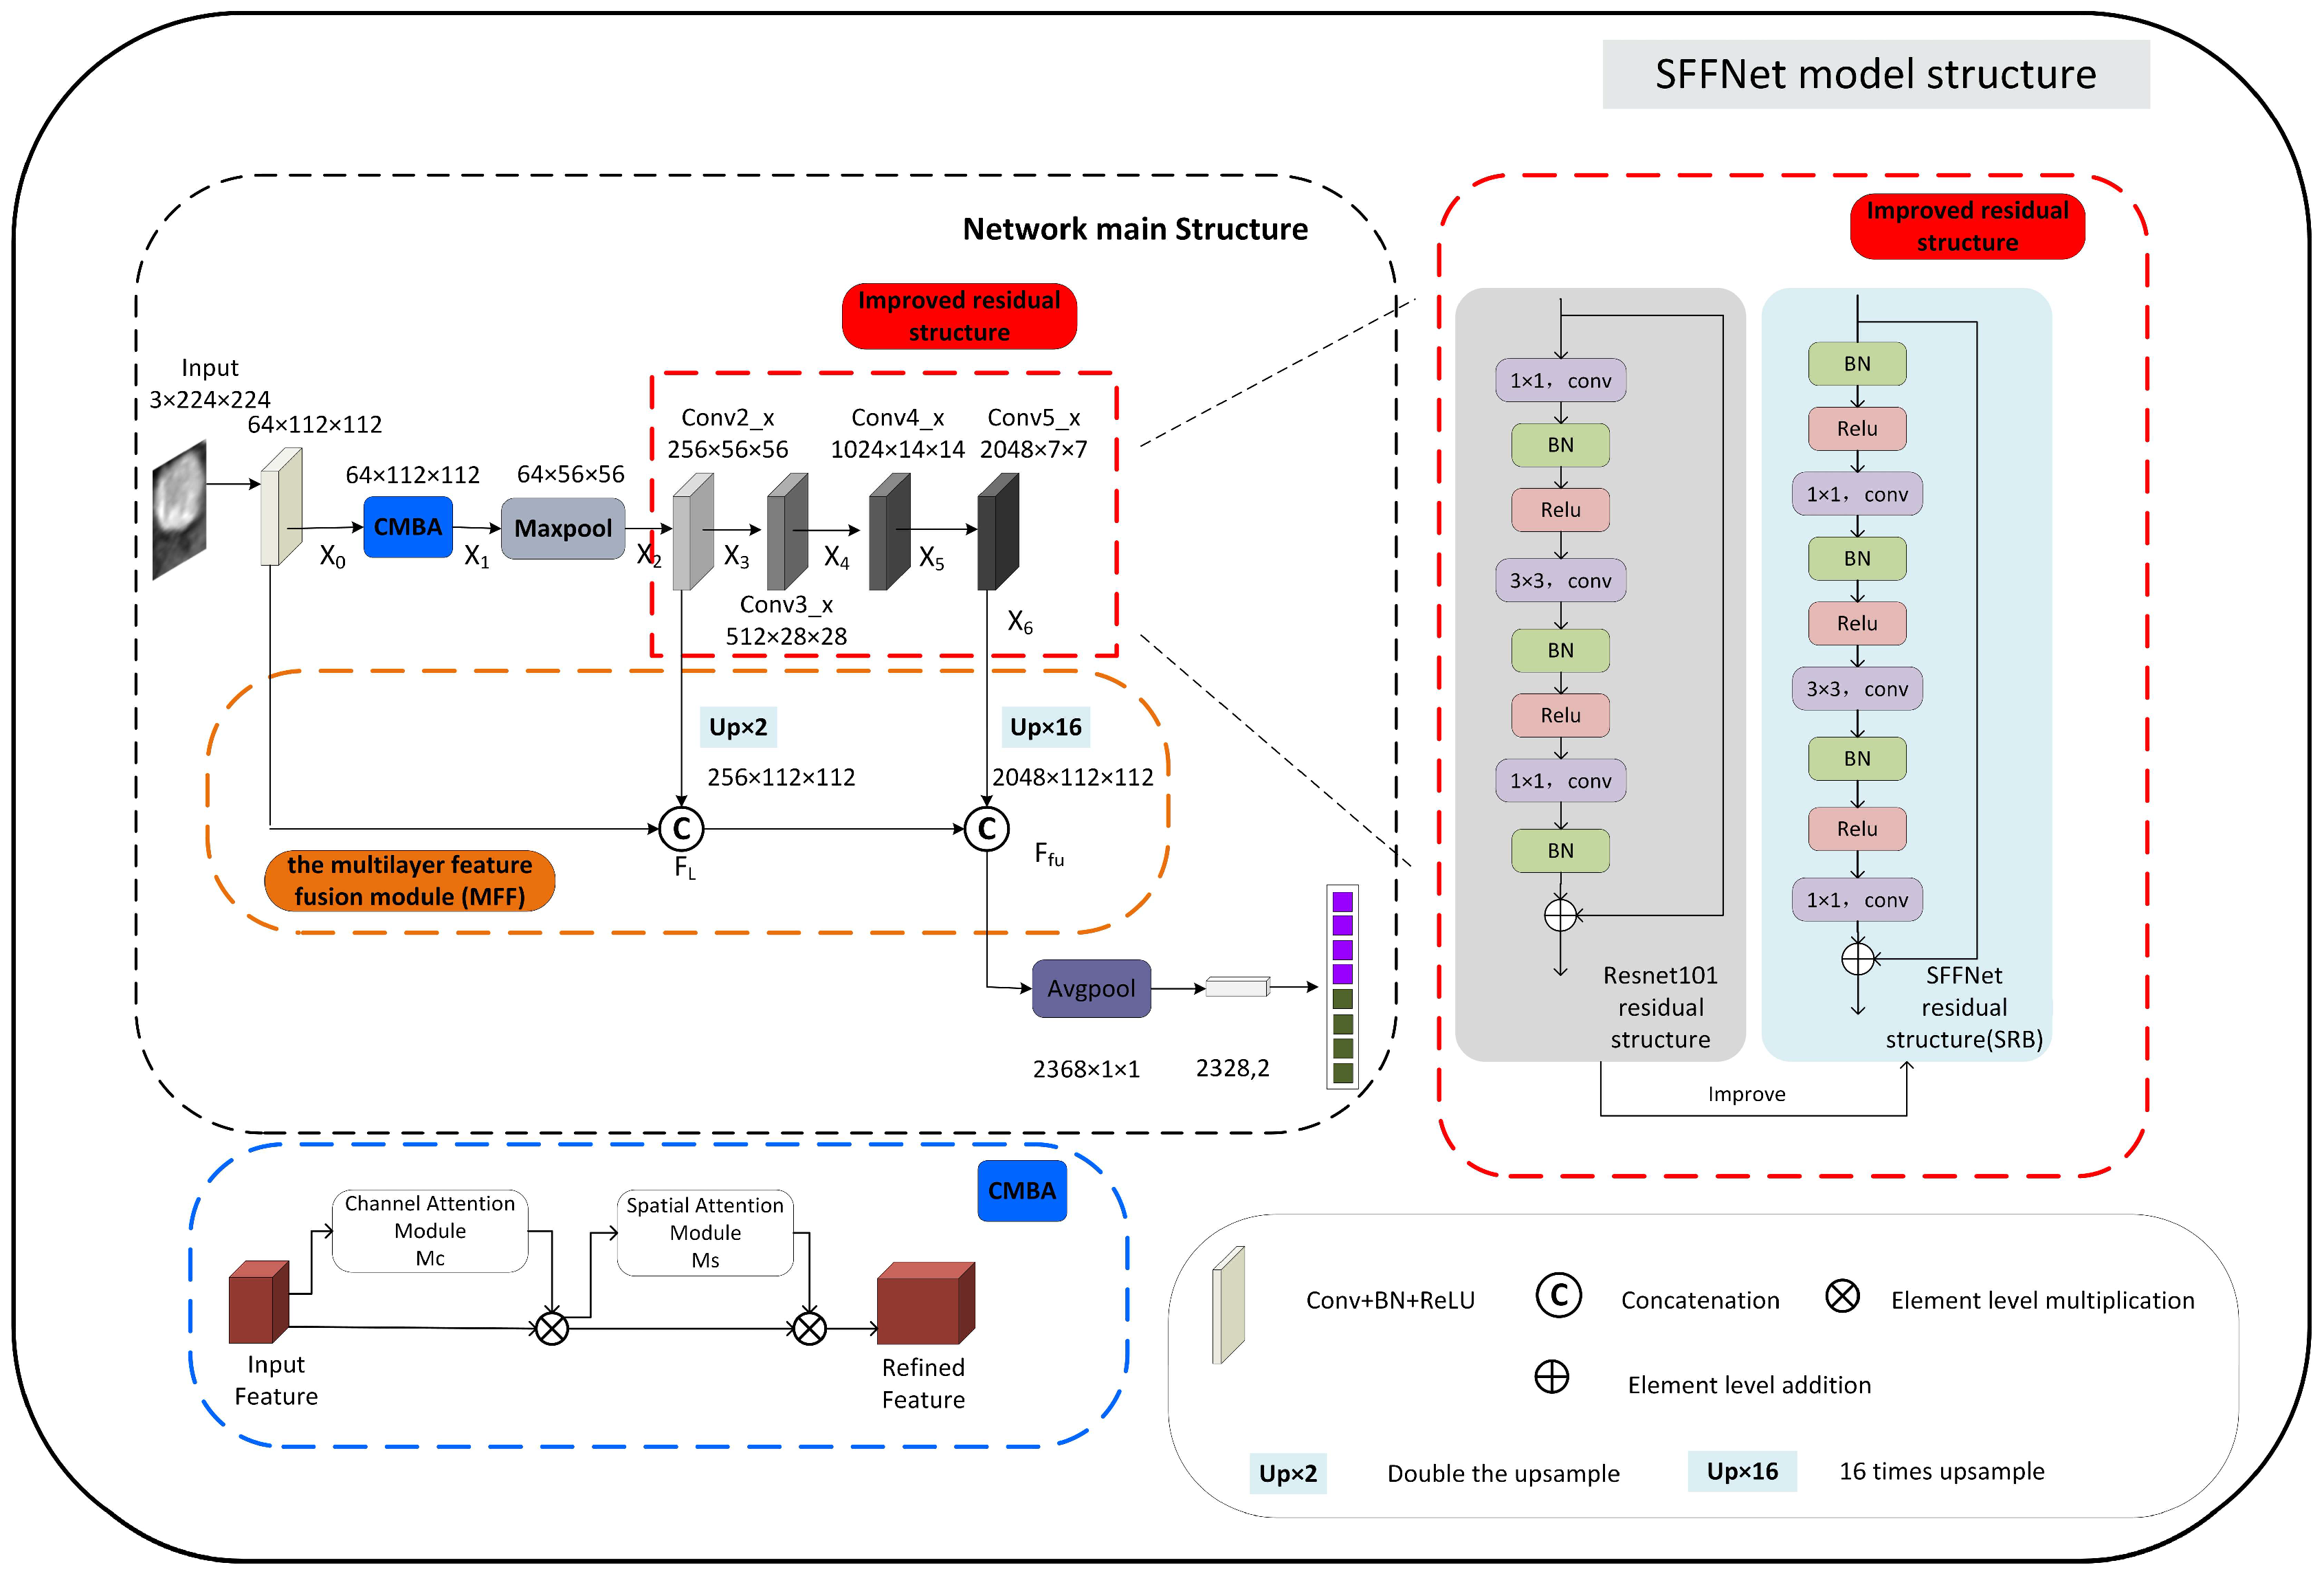
- We apply a deep learning method to MF-ICC/HCC image classification for the first time and propose a new strided feature fusion model, SFFNet. In SFFNet, two new modules, SF and SRB, are proposed. The SF module is used to capture more multi-dimensional features of MF-ICC/HCC and perform effective fusion, so as to construct more judgment fusion features; the SRB module is used to solve the information loss and network performance instability in the process of residual network training. In addition, the SFFNet model also adds a CBAM attention mechanism to capture key information.
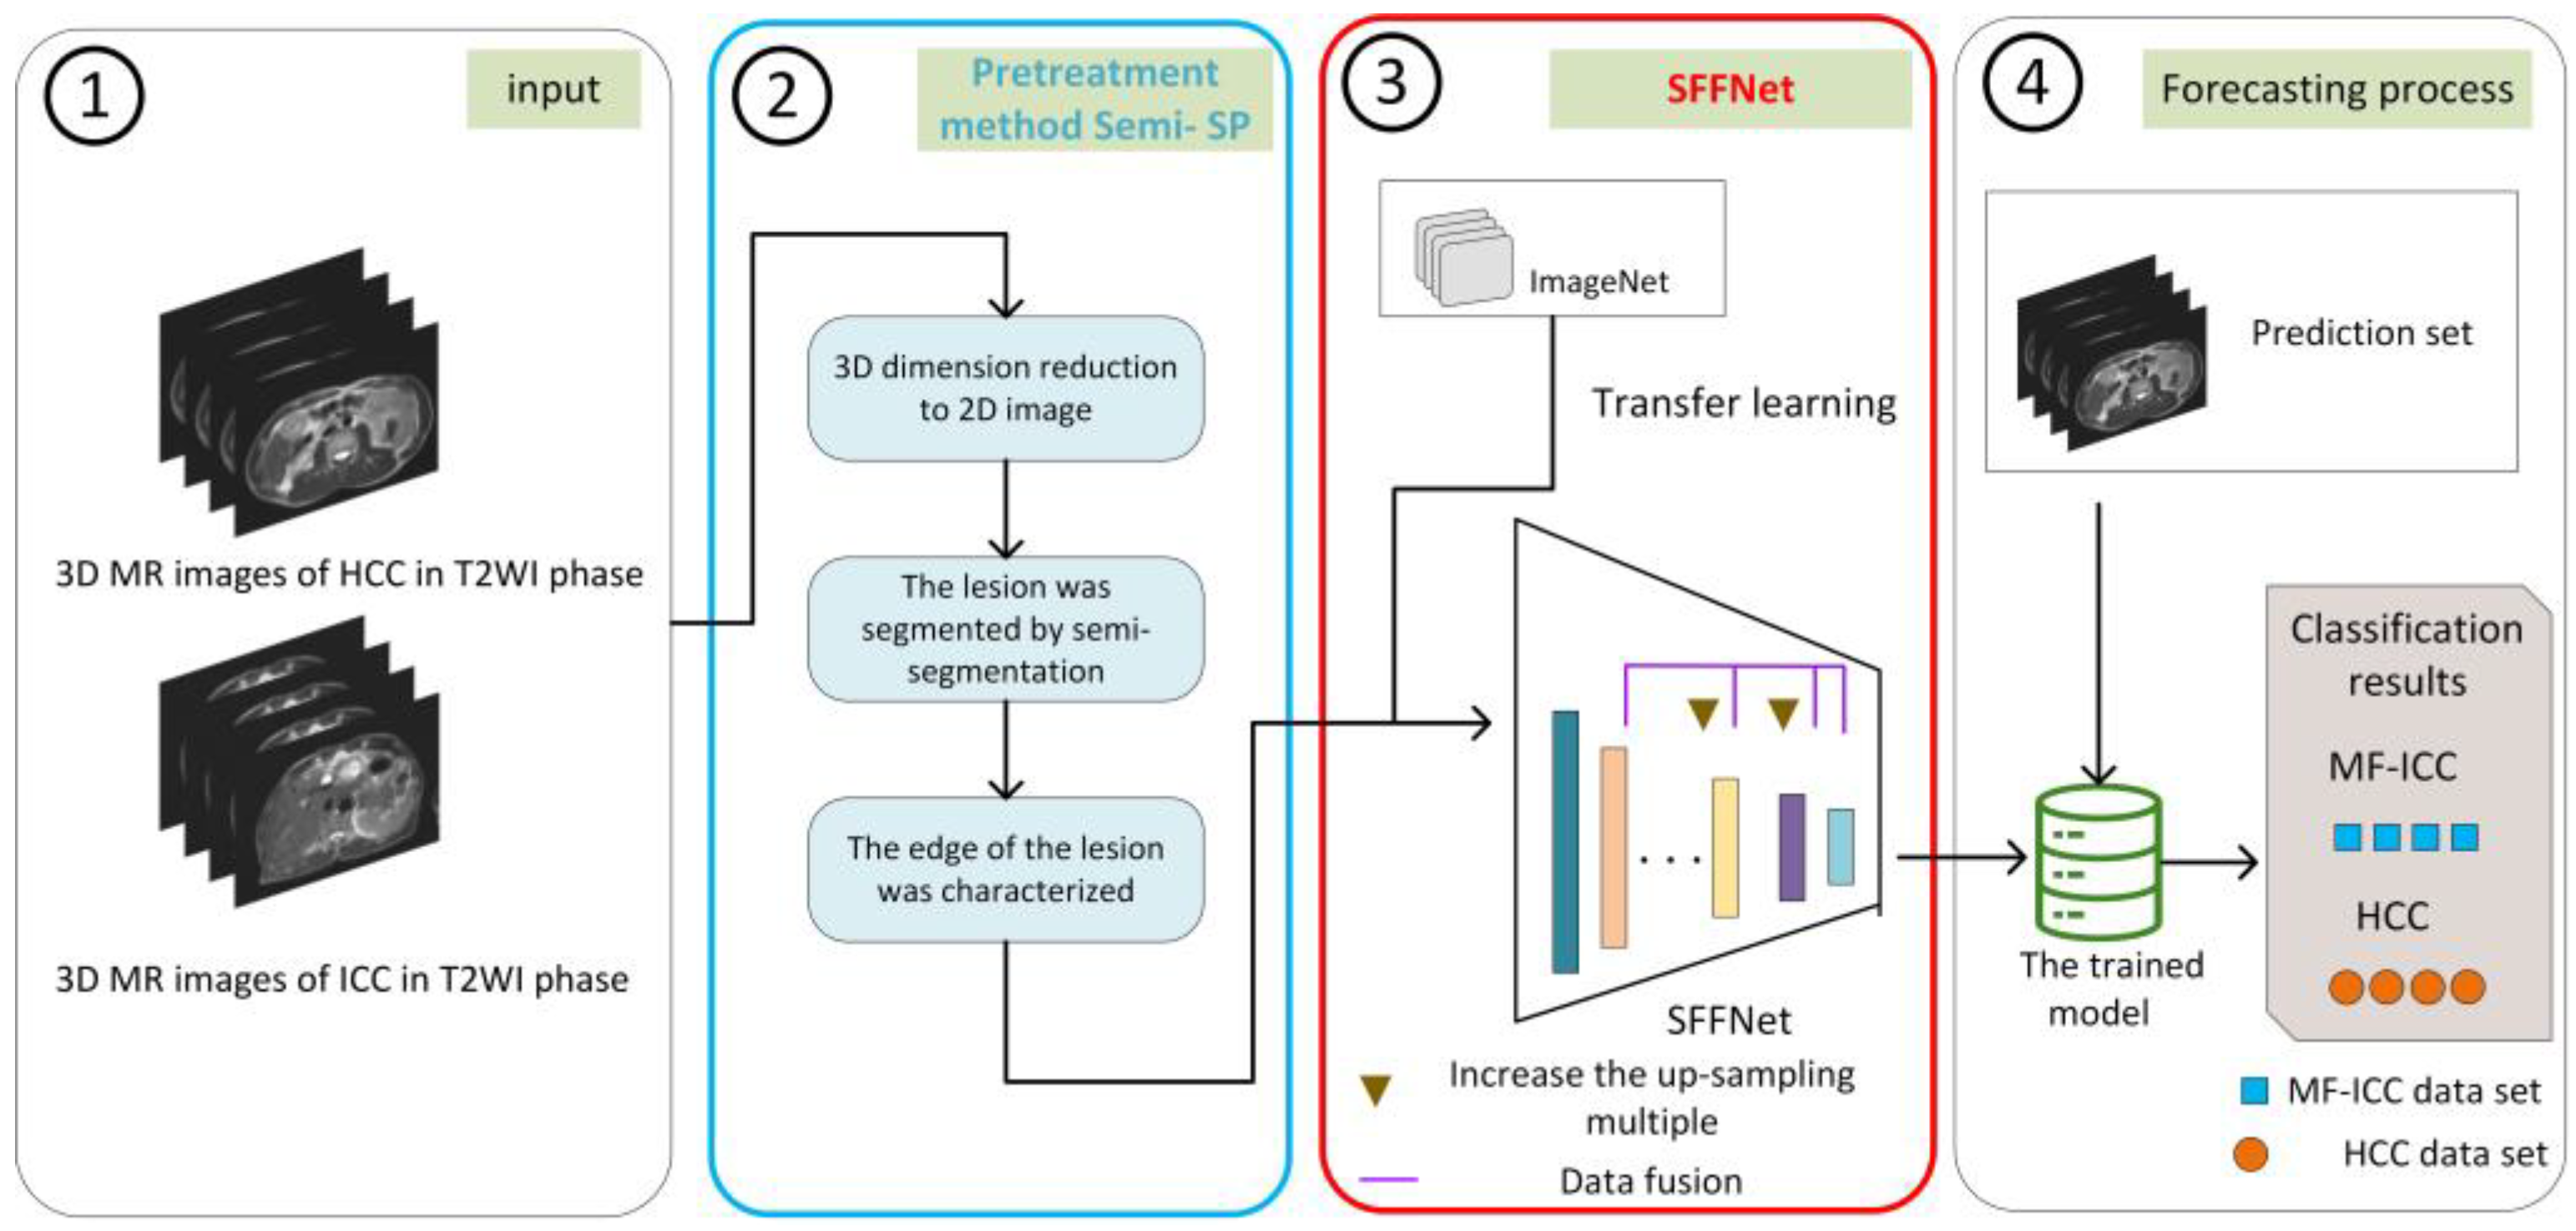
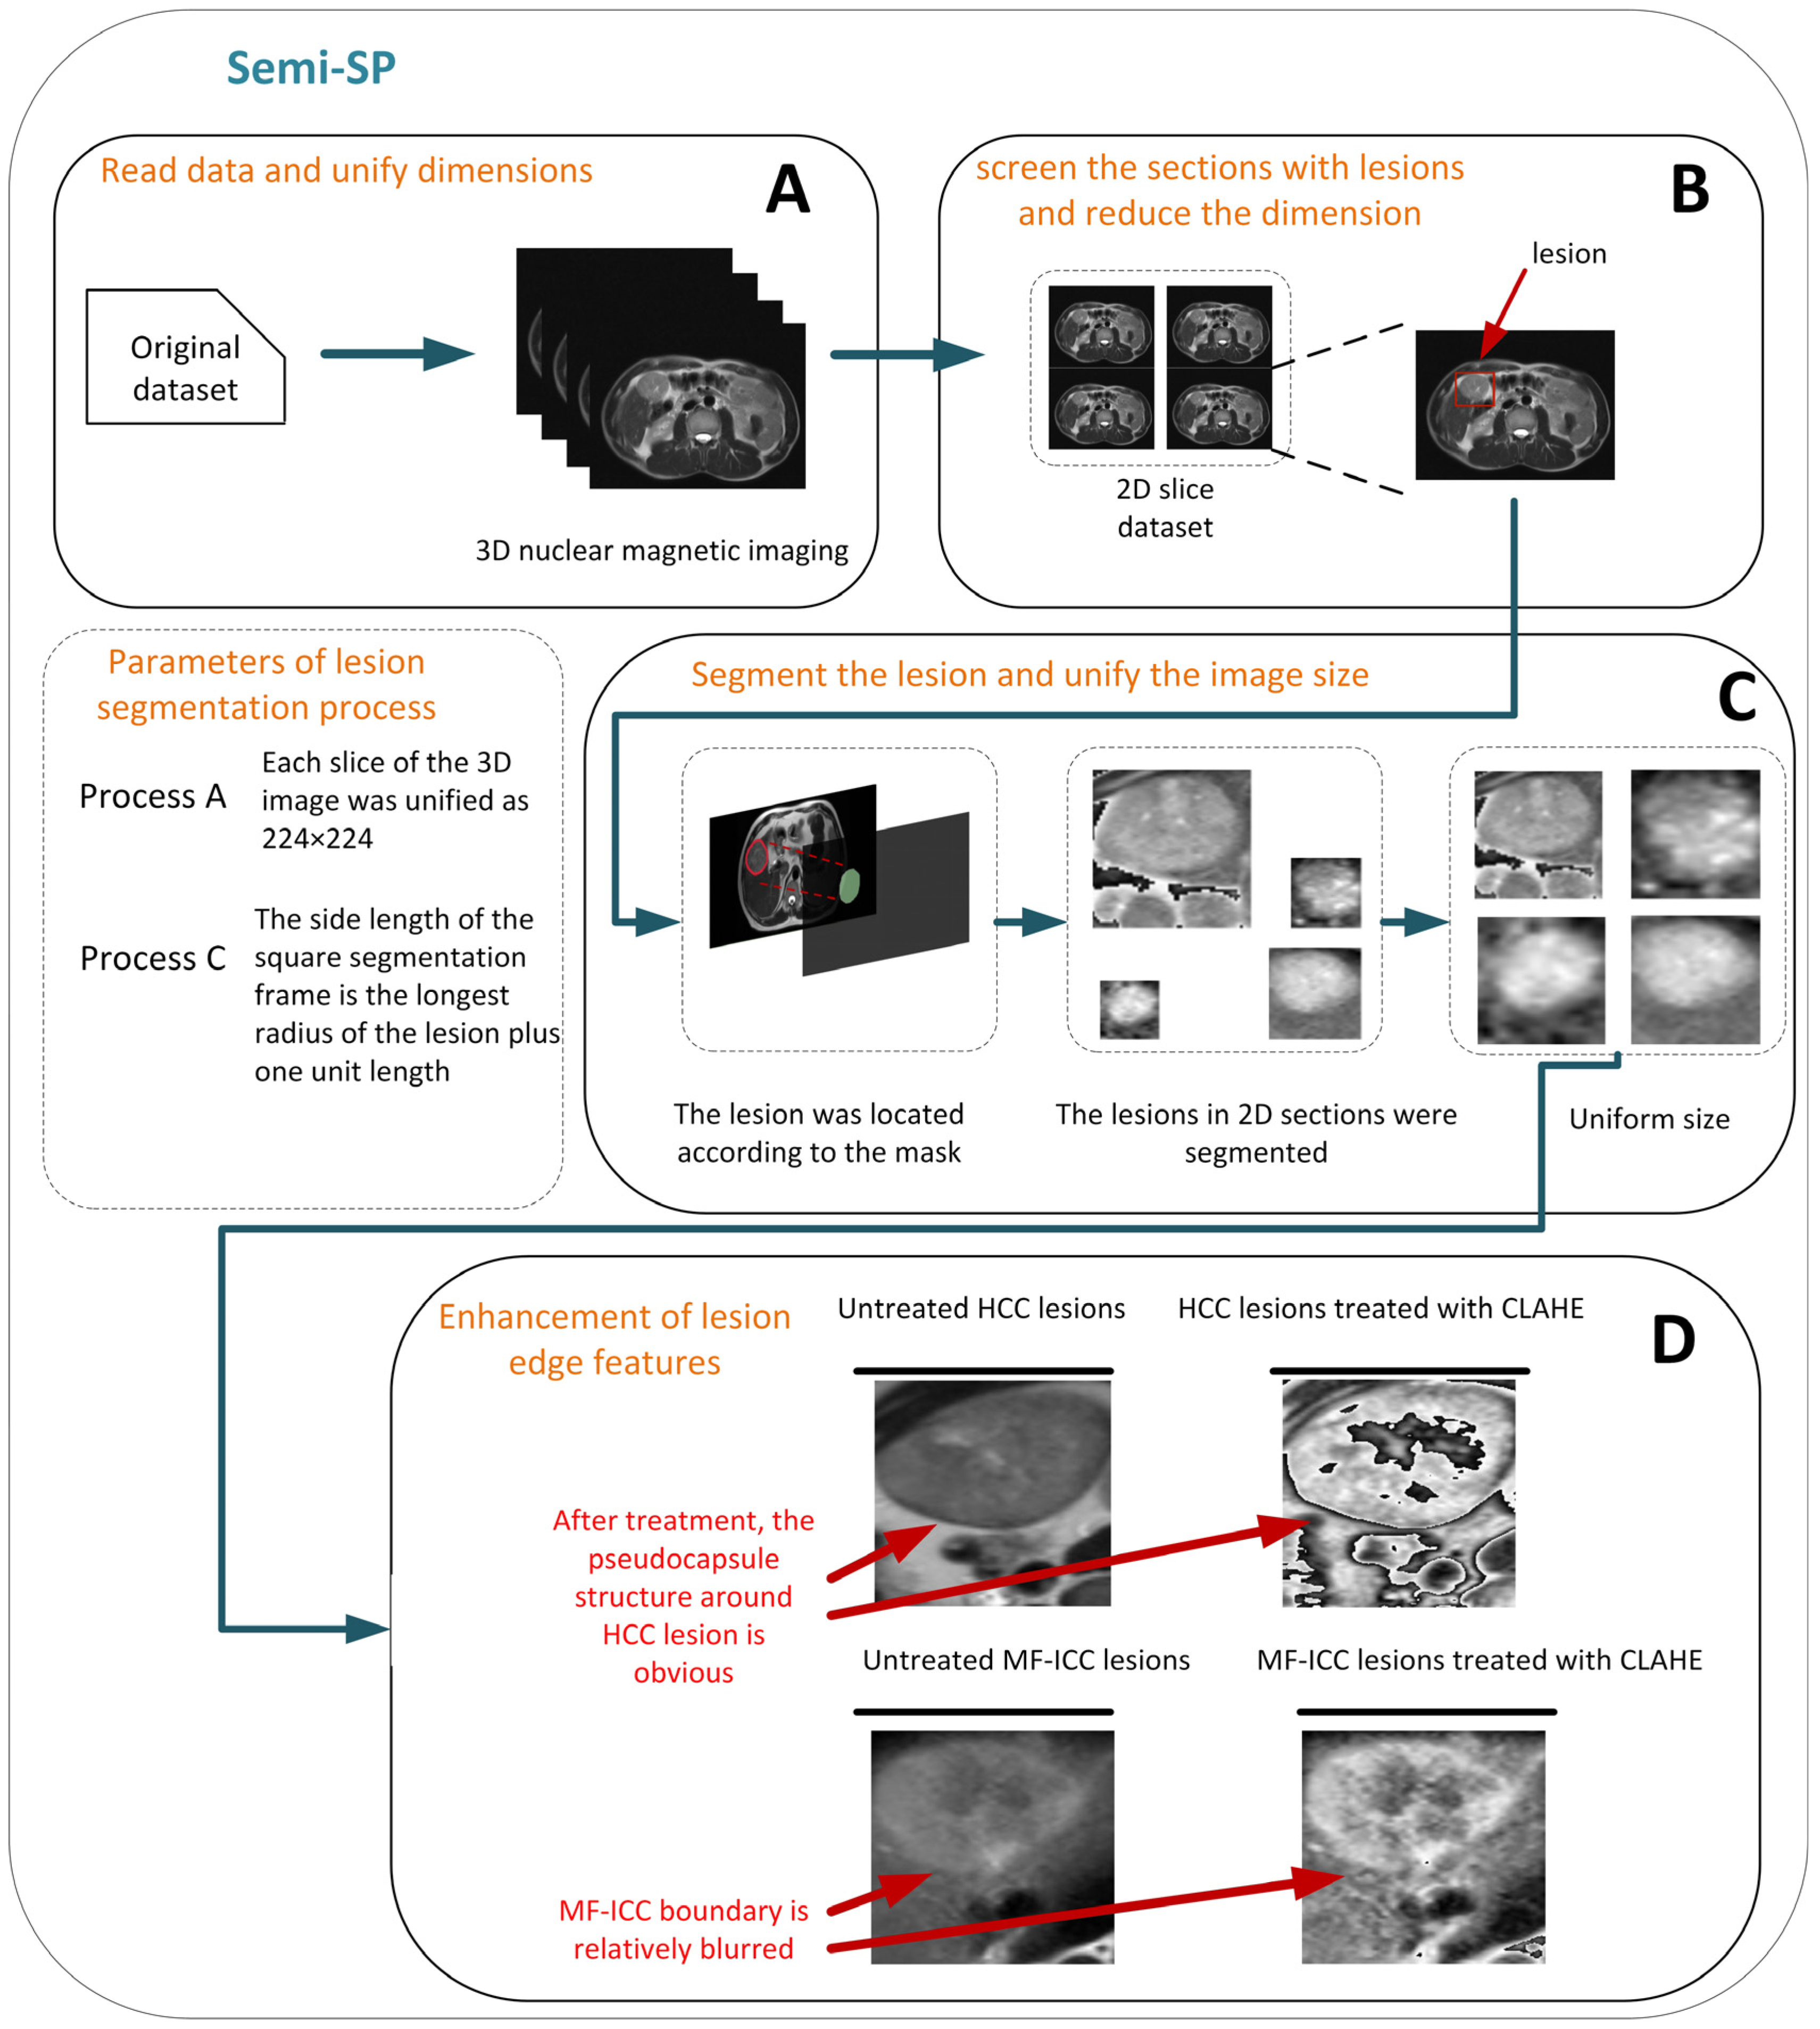
- For T2 weighted imaging (T2WI ) of MF-ICC/HCC, we established a new preprocessing method, Semi-SP, which focuses on the edge information of lesions, which has not received attention in previous studies, and provides qualitative indexes for lesion segmentation.
- The Semi-SP method and SFFNet model proposed in this paper have achieved excellent performance on MR images of 112 MF-ICC/HCC patients in the Second Affiliated Hospital of Kunming Medical University and have obvious advantages in clinical diagnosis compared with other classification models.
2. Materials and Methods
2.1. Patient Selection
2.2. MRI Acquisition Protocol
2.3. Image Processing
2.3.1. Tumor Lesion Outlining
2.3.2. Semi-segmented Preprocessing Method and ROI Selection
2.3.3. Data Augmentation
2.4. Deep Learning Model Construction
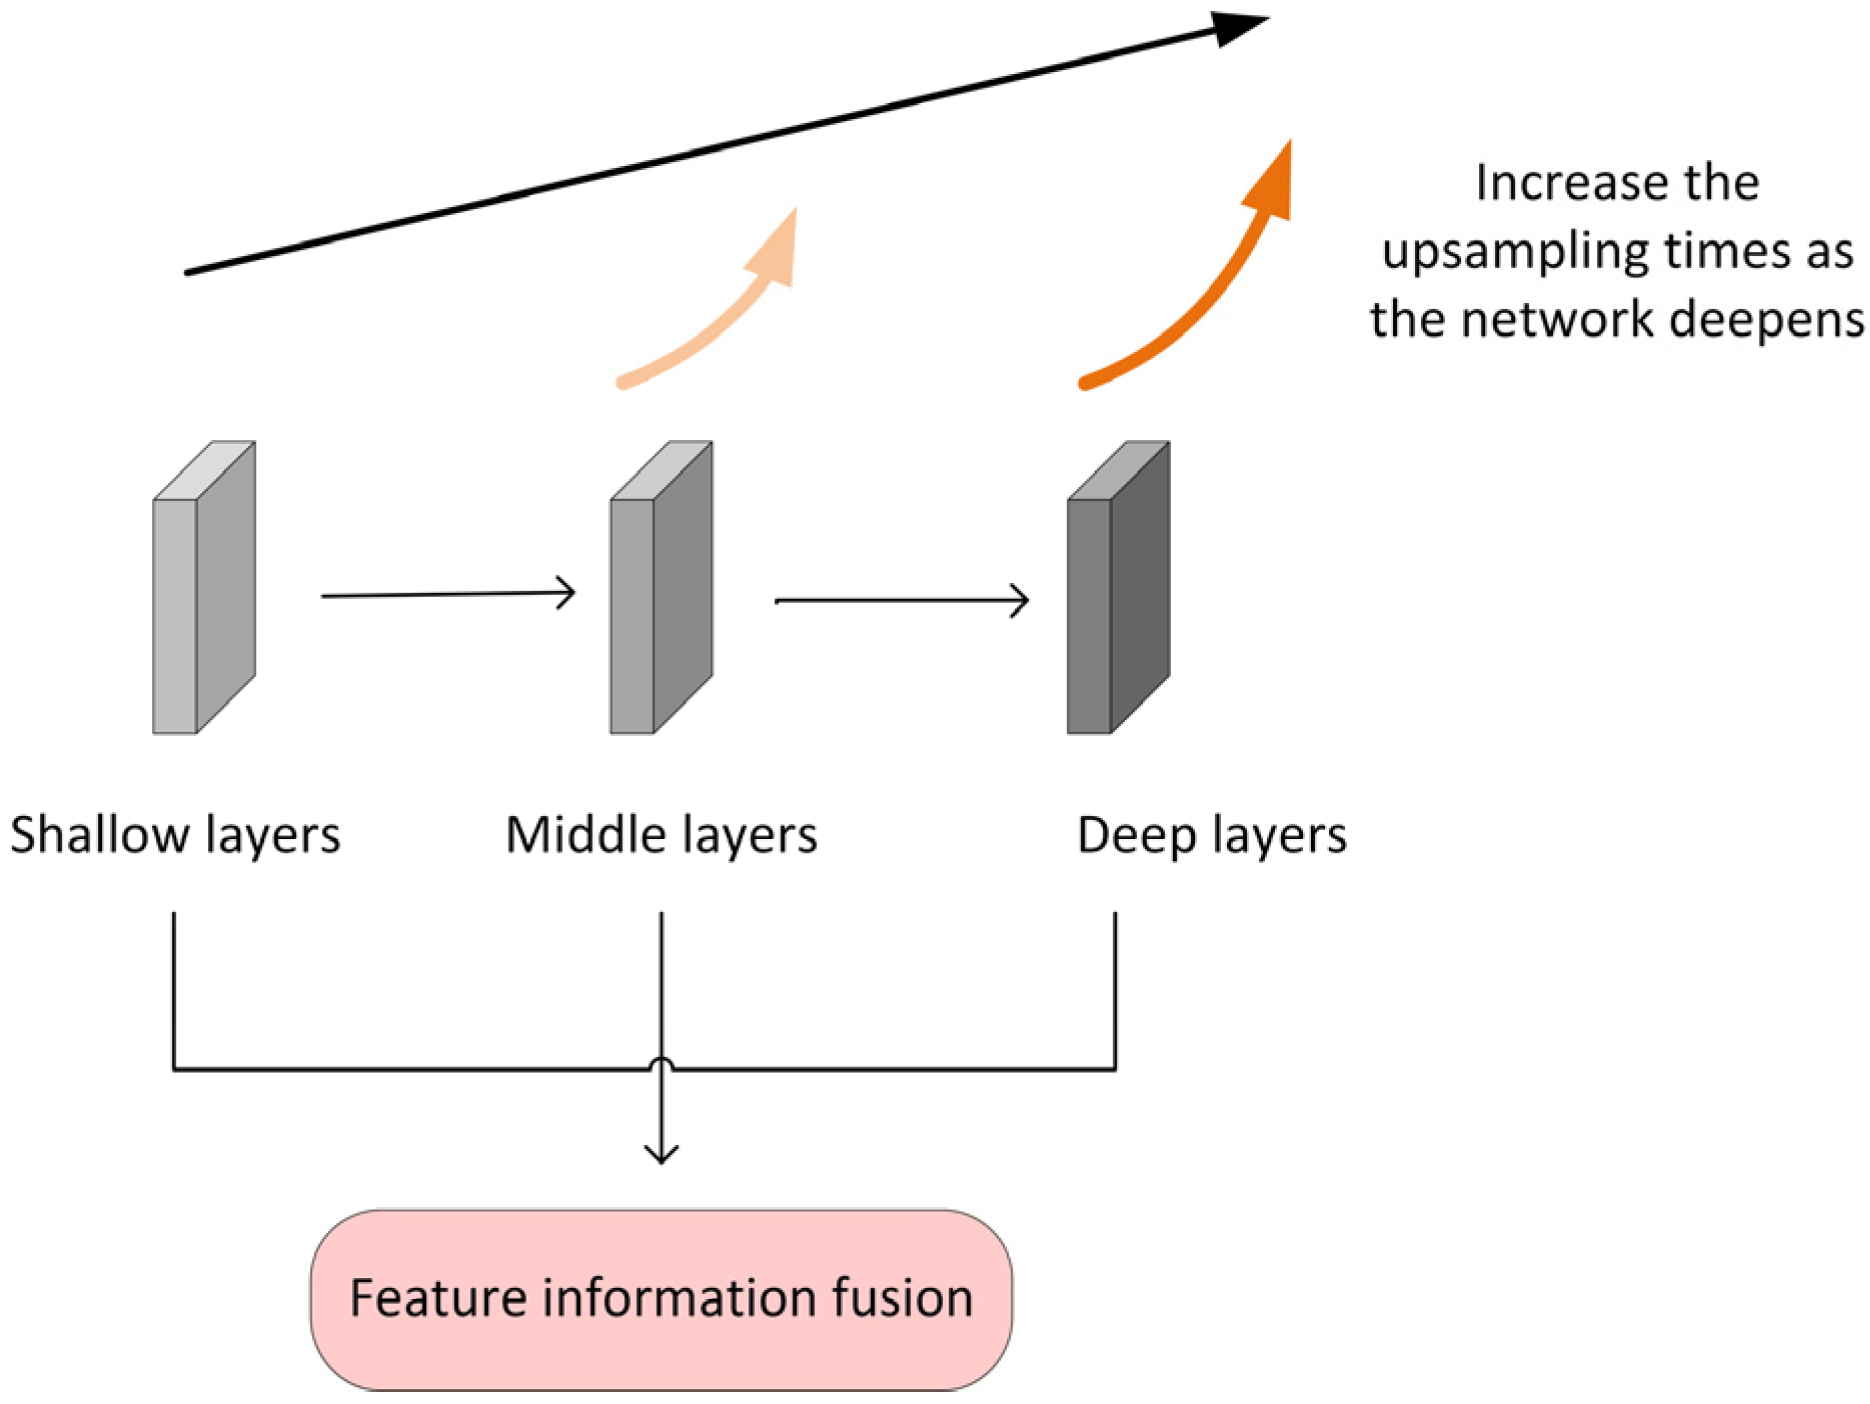
2.4.1. The Multilayer Feature Fusion Module MFF
2.4.2. The Stationary Residual Block SRB
2.4.3. CBAM Attention Mechanism Added
2.4.4. Data Division
2.4.5. Hyperparameter Optimization
3. Results
3.1. Experimental Results of Different Lesion Segmentation Methods
3.2. Ablation Experiment Results
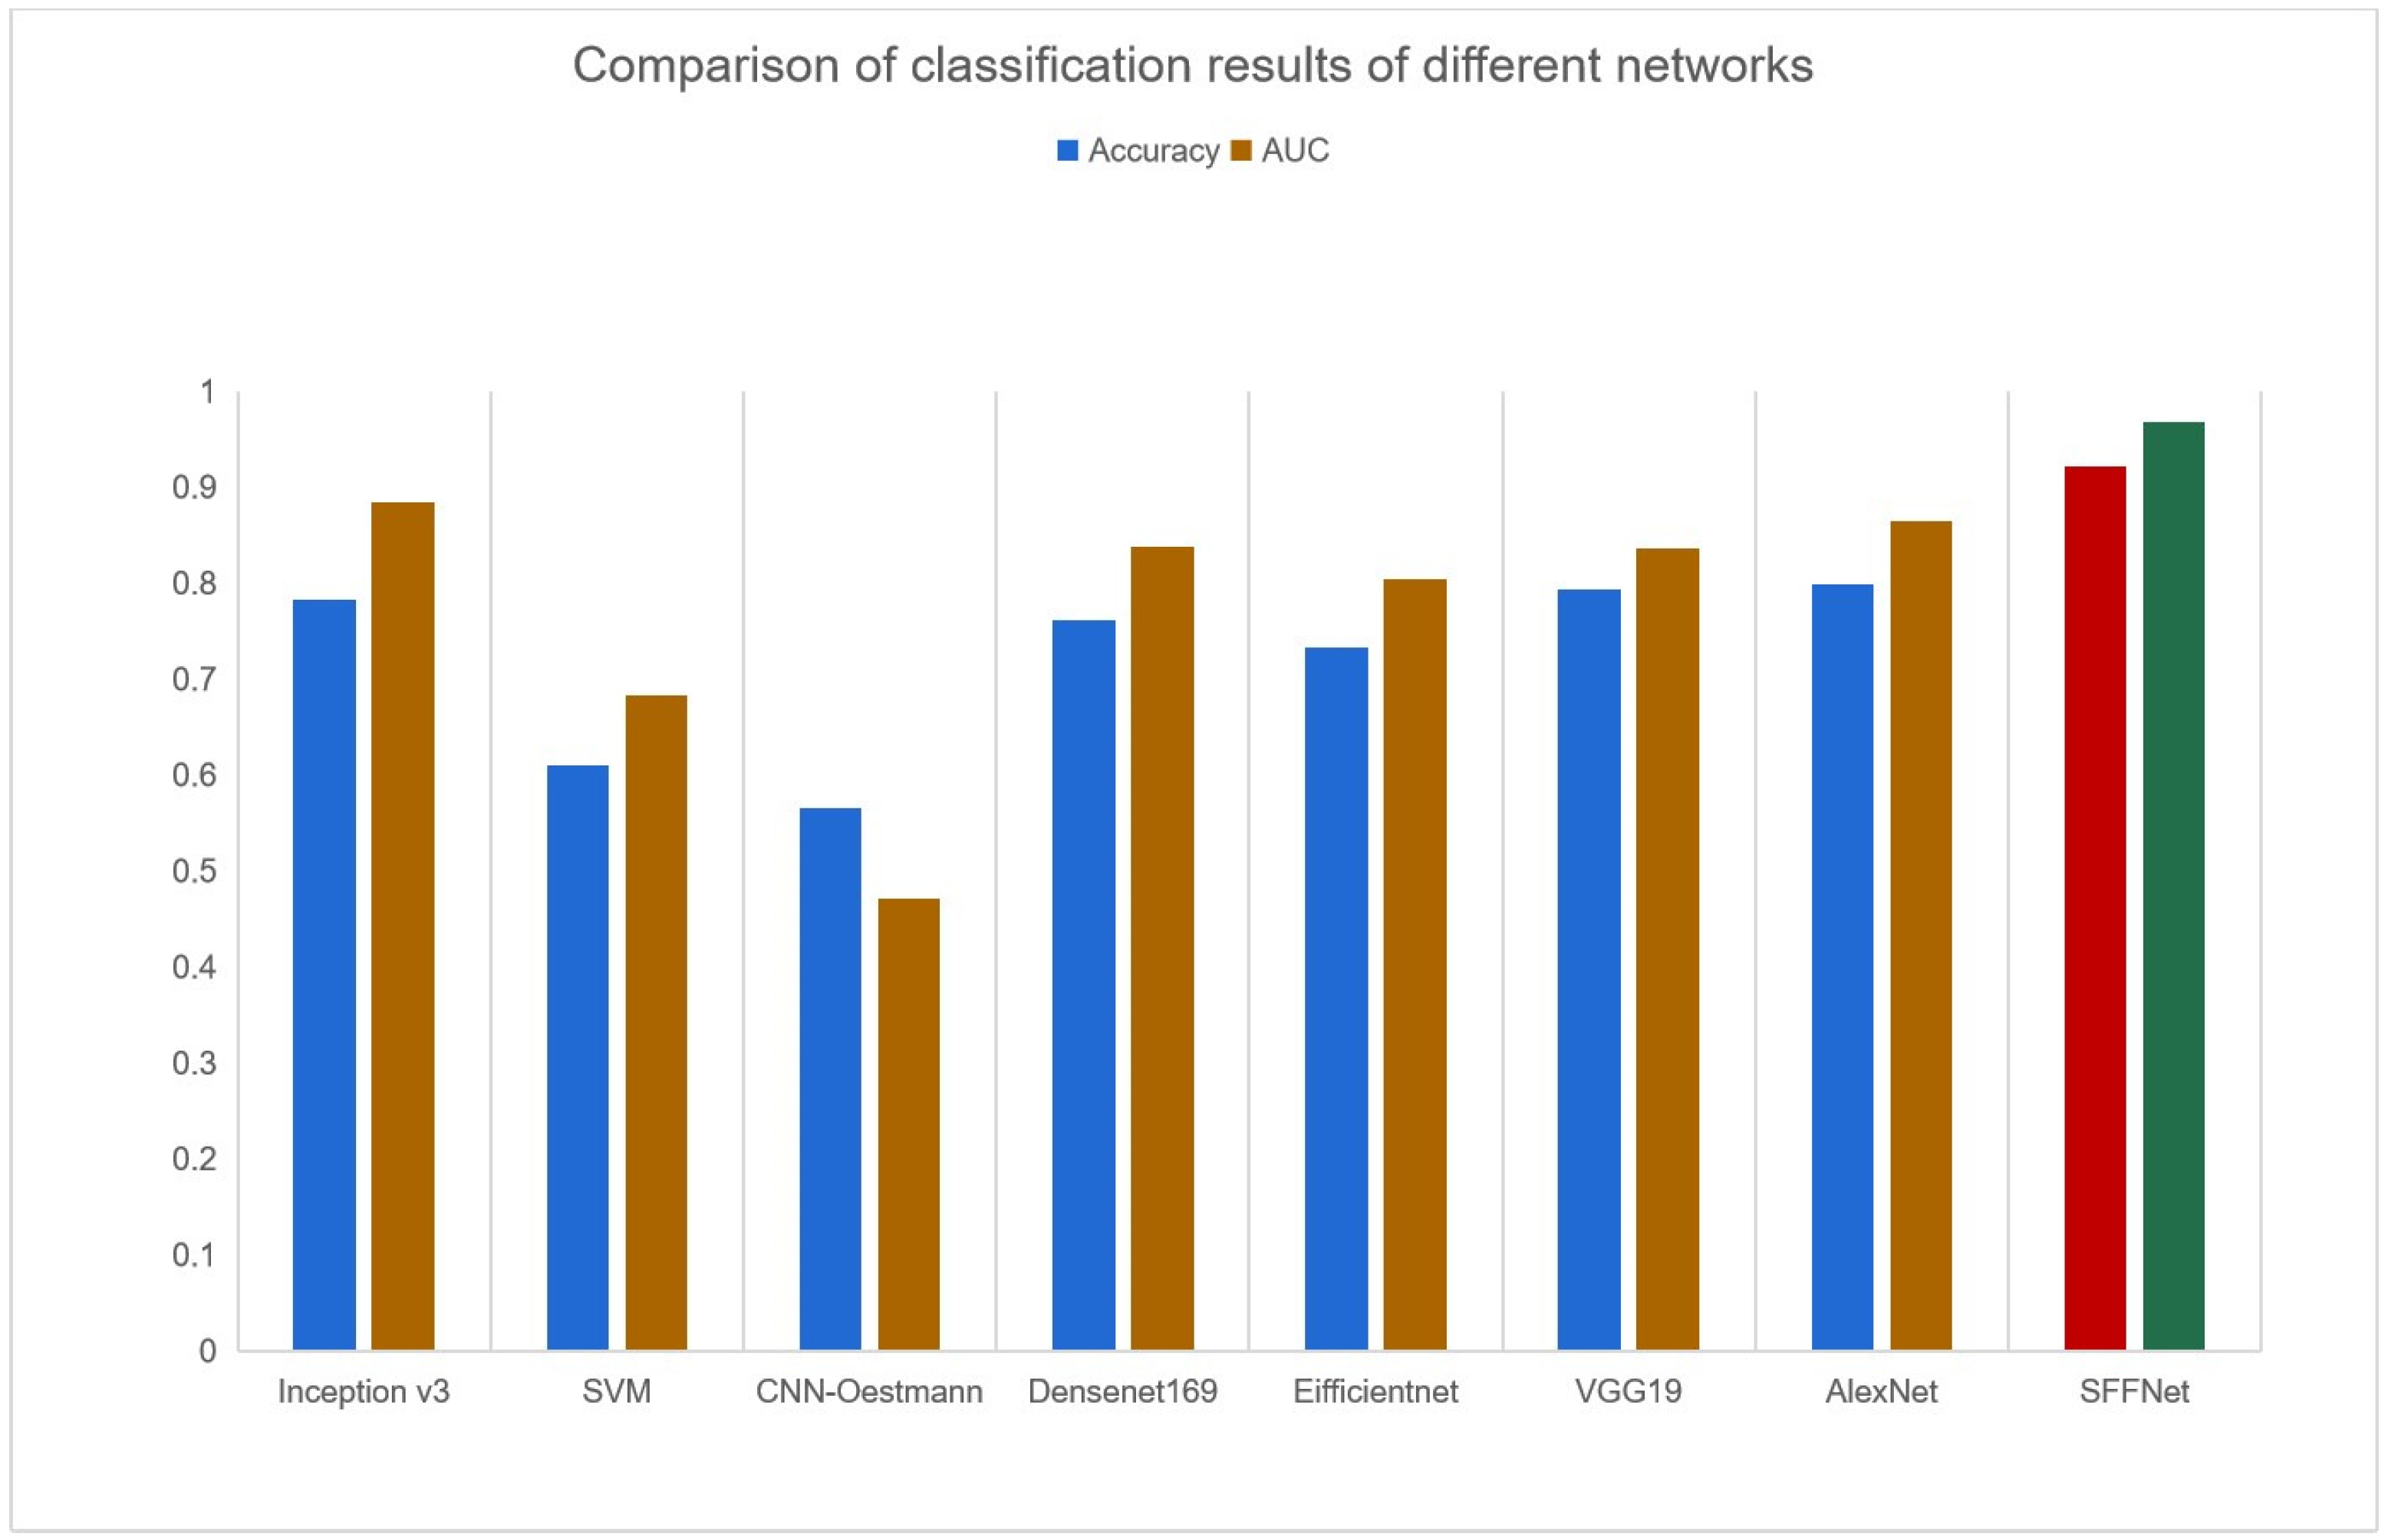
3.3. Model Comparison
4. Discussion
5. Conclusions
Author Contributions
Funding
Institutional Review Board Statement
Informed Consent Statement
Data Availability Statement
Conflicts of Interest
References
- Chen, S.; Zhang, H. Research progress of multimodality MRI in the diagnosis and treatment of intrahepatic mass-forming cholangiocarcinoma. Magn. Reson. Imaging 2022, 13, 158–161. [Google Scholar] [CrossRef]
- Blechacz, B.; Gores, G.J. Cholangiocarcinoma: Advances in pathogenesis, diagnosis, and treatment. Hepatology 2008, 48, 308–321. [Google Scholar] [CrossRef] [PubMed]
- William, C.P.; Palmer, T. Are common factors involved in the pathogenesis of primary liver cancers? A meta-analysisofrsk factorsfor intrahepatic cholangiocarcinoma. J. Hepatol. 2012, 57, 69–76. [Google Scholar] [CrossRef]
- Mattia, G.; Paolo, G.; Fabio, P.; Fabrizio, R.; Sanziana, R.; Julie, A.S.; Vittorio, G. Combined hepatocelular-cholangiocarcinoma: A population-level analysis of an uncommon primary lvertumor. Liver Transpl. 2014, 20, 952–959. [Google Scholar] [CrossRef]
- Forner, A.; Llovet, J.M.; Bruix, J. Hepatocellular carcinoma. Lancet 2012, 379, 1245–1255. [Google Scholar] [CrossRef]
- Zou, X.; Luo, Y.; Li, Z.; Hu, Y.; Li, H.; Tang, H.; Shen, Y.; Hu, D.; Kamel, I.R. Volumetric Apparent Diffusion Coefficient Histogram Analysis in Differentiating Intrahepatic Mass-Forming Cholangiocarcinoma from Hepatocellular Carcinoma. J. Magn. Reson. Imaging 2019, 49, 975–983. [Google Scholar] [CrossRef]
- Zhao, F.; Pang, G.; Li, X.; Yang, S.; Zhong, H. Value of perfusion parameters histogram analysis of triphasic CT in differentiating intrahepatic mass forming cholangiocarcinoma from hepatocellular carcinoma. Sci. Rep. 2021, 11, 23163. [Google Scholar] [CrossRef]
- Wu, H.; Liang, Y.; Wang, Z.; Tan, C.; Yang, R.; Wei, X.; Jiang, X. Optimizing CT and MRI criteria for differentiating intrahepatic mass-forming cholangiocarcinoma and hepatocellular carcinoma. Acta Radiol. 2022, 27, 2841851221113265. [Google Scholar] [CrossRef]
- Zheng, W.J.; Huang, H.J.; She, D.J.; Xiong, M.L.; Chen, X.D.; Lin, X.J.; Cao, D.R. Added-value of ancillary imaging features for differentiating hepatocellular carcinoma from intrahepatic mass-forming cholangiocarcinoma on Gd-BOPTA-enhanced MRI in LI-RADS M. Abdom. Radiol. 2022, 47, 957–968. [Google Scholar] [CrossRef]
- Sato, M.; Tateishi, R.; Yatomi, Y.; Koike, K. Artificial intelligence in the diagnosis and management of hepatocellular carcinoma. J. Gastroenterol. Hepatol. 2021, 36, 551–560. [Google Scholar] [CrossRef]
- Tian, Q.J.; Wu, Y.T.; Ren, X.J.; Razmjooy, N. A new optimized sequential method for lung tumor diagnosis based on deep learning and converged search and rescue algorithm. Biomed. Signal Process. Control 2021, 68, 102761. [Google Scholar] [CrossRef]
- Guo, Z.Q.; Xu, L.N.; Si, Y.J.; Razmjooy, N. Novel computer-aided lung cancer detection based on convolutional neural network-based and feature-based classifiers using metaheuristics. Int. J. Imaging Syst. Technol. 2021, 31, 1954–1969. [Google Scholar] [CrossRef]
- Zhen, S.H.; Cheng, M.; Tao, Y.B.; Wang, Y.F.; Juengpanich, S.; Jiang, Z.Y.; Jiang, Y.K.; Yan, Y.Y.; Lu, W.; Lue, J.M.; et al. Deep learning for accurate diagnosis of liver tumor based on magnetic resonance imaging and clinical data. Front. Oncol. 2020, 10, 680. [Google Scholar] [CrossRef] [PubMed]
- Oestmann, P.M.; Wang, C.J.; Savic, L.J.; Hamm, C.A.; Stark, S.; Schobert, L.; Gebauer, B.; Schlachter, T.; Lin, M.D.; Weinreb, J.C.; et al. Deep learning–assisted differentiation of pathologically proven atypical and typical hepatocellular carcinoma (HCC) versus non-HCC on contrast-enhanced MR of the liver. Eur. Radiol. 2021, 31, 4981–4990. [Google Scholar] [CrossRef]
- Sammon, J.; Fischer, S.; Menezes, R.; Hosseini, N.H.; Lewis, S.; Taouli, B.; Jhaveri, K. MRI features of combined hepatocellular-cholangiocarcinoma versus mass forming intrahepatic cholangiocarcinoma. Cancer Imaging 2018, 18, 8. [Google Scholar] [CrossRef]
- Zhu, Y.; Zhang, J.; Liu, B. The value of MR and CT in the diagnosis of mass-forming intrahepatic cholangiocarcinoma. Mod. Med. Imaging 2022, 31, 130–132. [Google Scholar] [CrossRef]
- Kim, R.; Lee, J.M.; Shin, C.I.; Lee, E.S.; Yoon, J.H.; Joo, J.; Kim, S.H.; Hwang, I.; Han, J.K.; Choi, B.I. Differentiation of intrahepatic mass-forming cholangiocarcinoma from hepatocellular carcinoma on gadoxetic acid-enhanced liver MR imaging. Eur. Radiol. 2016, 26, 1808–1817. [Google Scholar] [CrossRef]
- Feng, Z.; Ye, J. Study on the identifition of hepatocarcinoma and intrahepatic cholangiocarcinama based on T2WI radiomics. Clin. Res. Pract. 2020, 5, 4. [Google Scholar] [CrossRef]
- Wang, Q.; Wang, Z.; Sun, Y.; Zhang, X.; Li, W.; Ge, Y.; Huang, X.; Liu, Y.; Chen, Y. SCCNN: A Diagnosis Method for Hepatocellular Carcinoma and Intrahepatic Cholangiocarcinoma Based on Siamese Cross Contrast Neural Network. IEEE Access 2020, 8, 85271–85283. [Google Scholar] [CrossRef]
- Ponnoprat, D.; Inkeaw, P.; Chaijaruwanich, J.; Traisathit, P.; Sripan, P.; Inmutto, N.; Pongnikorn, D.; Chitapanarux, I. Classification of hepatocellular carcinoma and intrahepatic cholangiocarcinoma based on multi-phase CT scans. Med. Biol. Eng. Comput. 2020, 58, 2497–2515. [Google Scholar] [CrossRef]
- He, K.; Zhang, X.; Ren, S.; Sun, J. Deep Residual Learning for Image Recognition. In Proceedings of the 2016 IEEE Conference on Computer Vision and Pattern Recognition (CVPR), Las Vegas, NV, USA, 27–30 June 2016; pp. 770–778. [Google Scholar]
- Zhao, T.; Wu, X.Q. Pyramind feature attention network for saliency detecion. In Proceedings of the IEEE/CVF Conference on Computer Vision and Pattern Recognition (CVPR), Long Beach, CA, USA, 15–20 June 2019; pp. 3085–3094. [Google Scholar]
- Woo, S.; Park, J.; Lee, J.Y.; Kweon, I. Cbam: Convolutional block attention module. In Proceedings of the European Conference on Computer Vision (ECCV), Munich, Germany, 8–14 September 2018; pp. 3–19. [Google Scholar] [CrossRef]
- Midya, A.; Chakraborty, J.; Pak, L.M.; Zheng, J.; Jarnagin, W.R.; Do, R.K.G.; Simpson, A.L. Deep convolutional neural network for the classification of hepatocellular carcinoma and intrahepatic cholangiocarcinoma. Med. Imaging 2018 Comput. Aided Diagnosis. SPIE 2018, 10575, 501–506. [Google Scholar] [CrossRef]


| Preprocessing Method | Classification Type | Precision | Recall | F1-Score | Accuracy | AUC |
|---|---|---|---|---|---|---|
| Semi-SP | HCC | 0.9078 | 0.9657 | 0.9359 | 0.9226 | 0.9680 |
| MF-ICC | 0.9470 | 0.8621 | 0.9025 | |||
| Split size doubled | HCC | 0.8246 | 0.8529 | 0.8386 | 0.8080 | 0.8930 |
| MF-ICC | 0.7826 | 0.7448 | 0.7633 | |||
| Split size tripled | HCC | 0.6368 | 0.8828 | 0.7399 | 0.7421 | 0.8477 |
| MF-ICC | 0.4179 | 1.0000 | 0.5894 | |||
| Do not segment the lesion | HCC | 1.0000 | 0.0098 | 0.0194 | 0.4212 | 0.6284 |
| MF-ICC | 0.4179 | 1.0000 | 0.5894 | |||
| Only segment lesions | HCC | 0.9150 | 0.8971 | 0.9059 | 0.8911 | 0.9436 |
| MF-ICC | 0.8591 | 0.8828 | 0.8707 |
| Network Model | Classification Type | Precision | Recall | F1-Score | Accuracy | AUC |
|---|---|---|---|---|---|---|
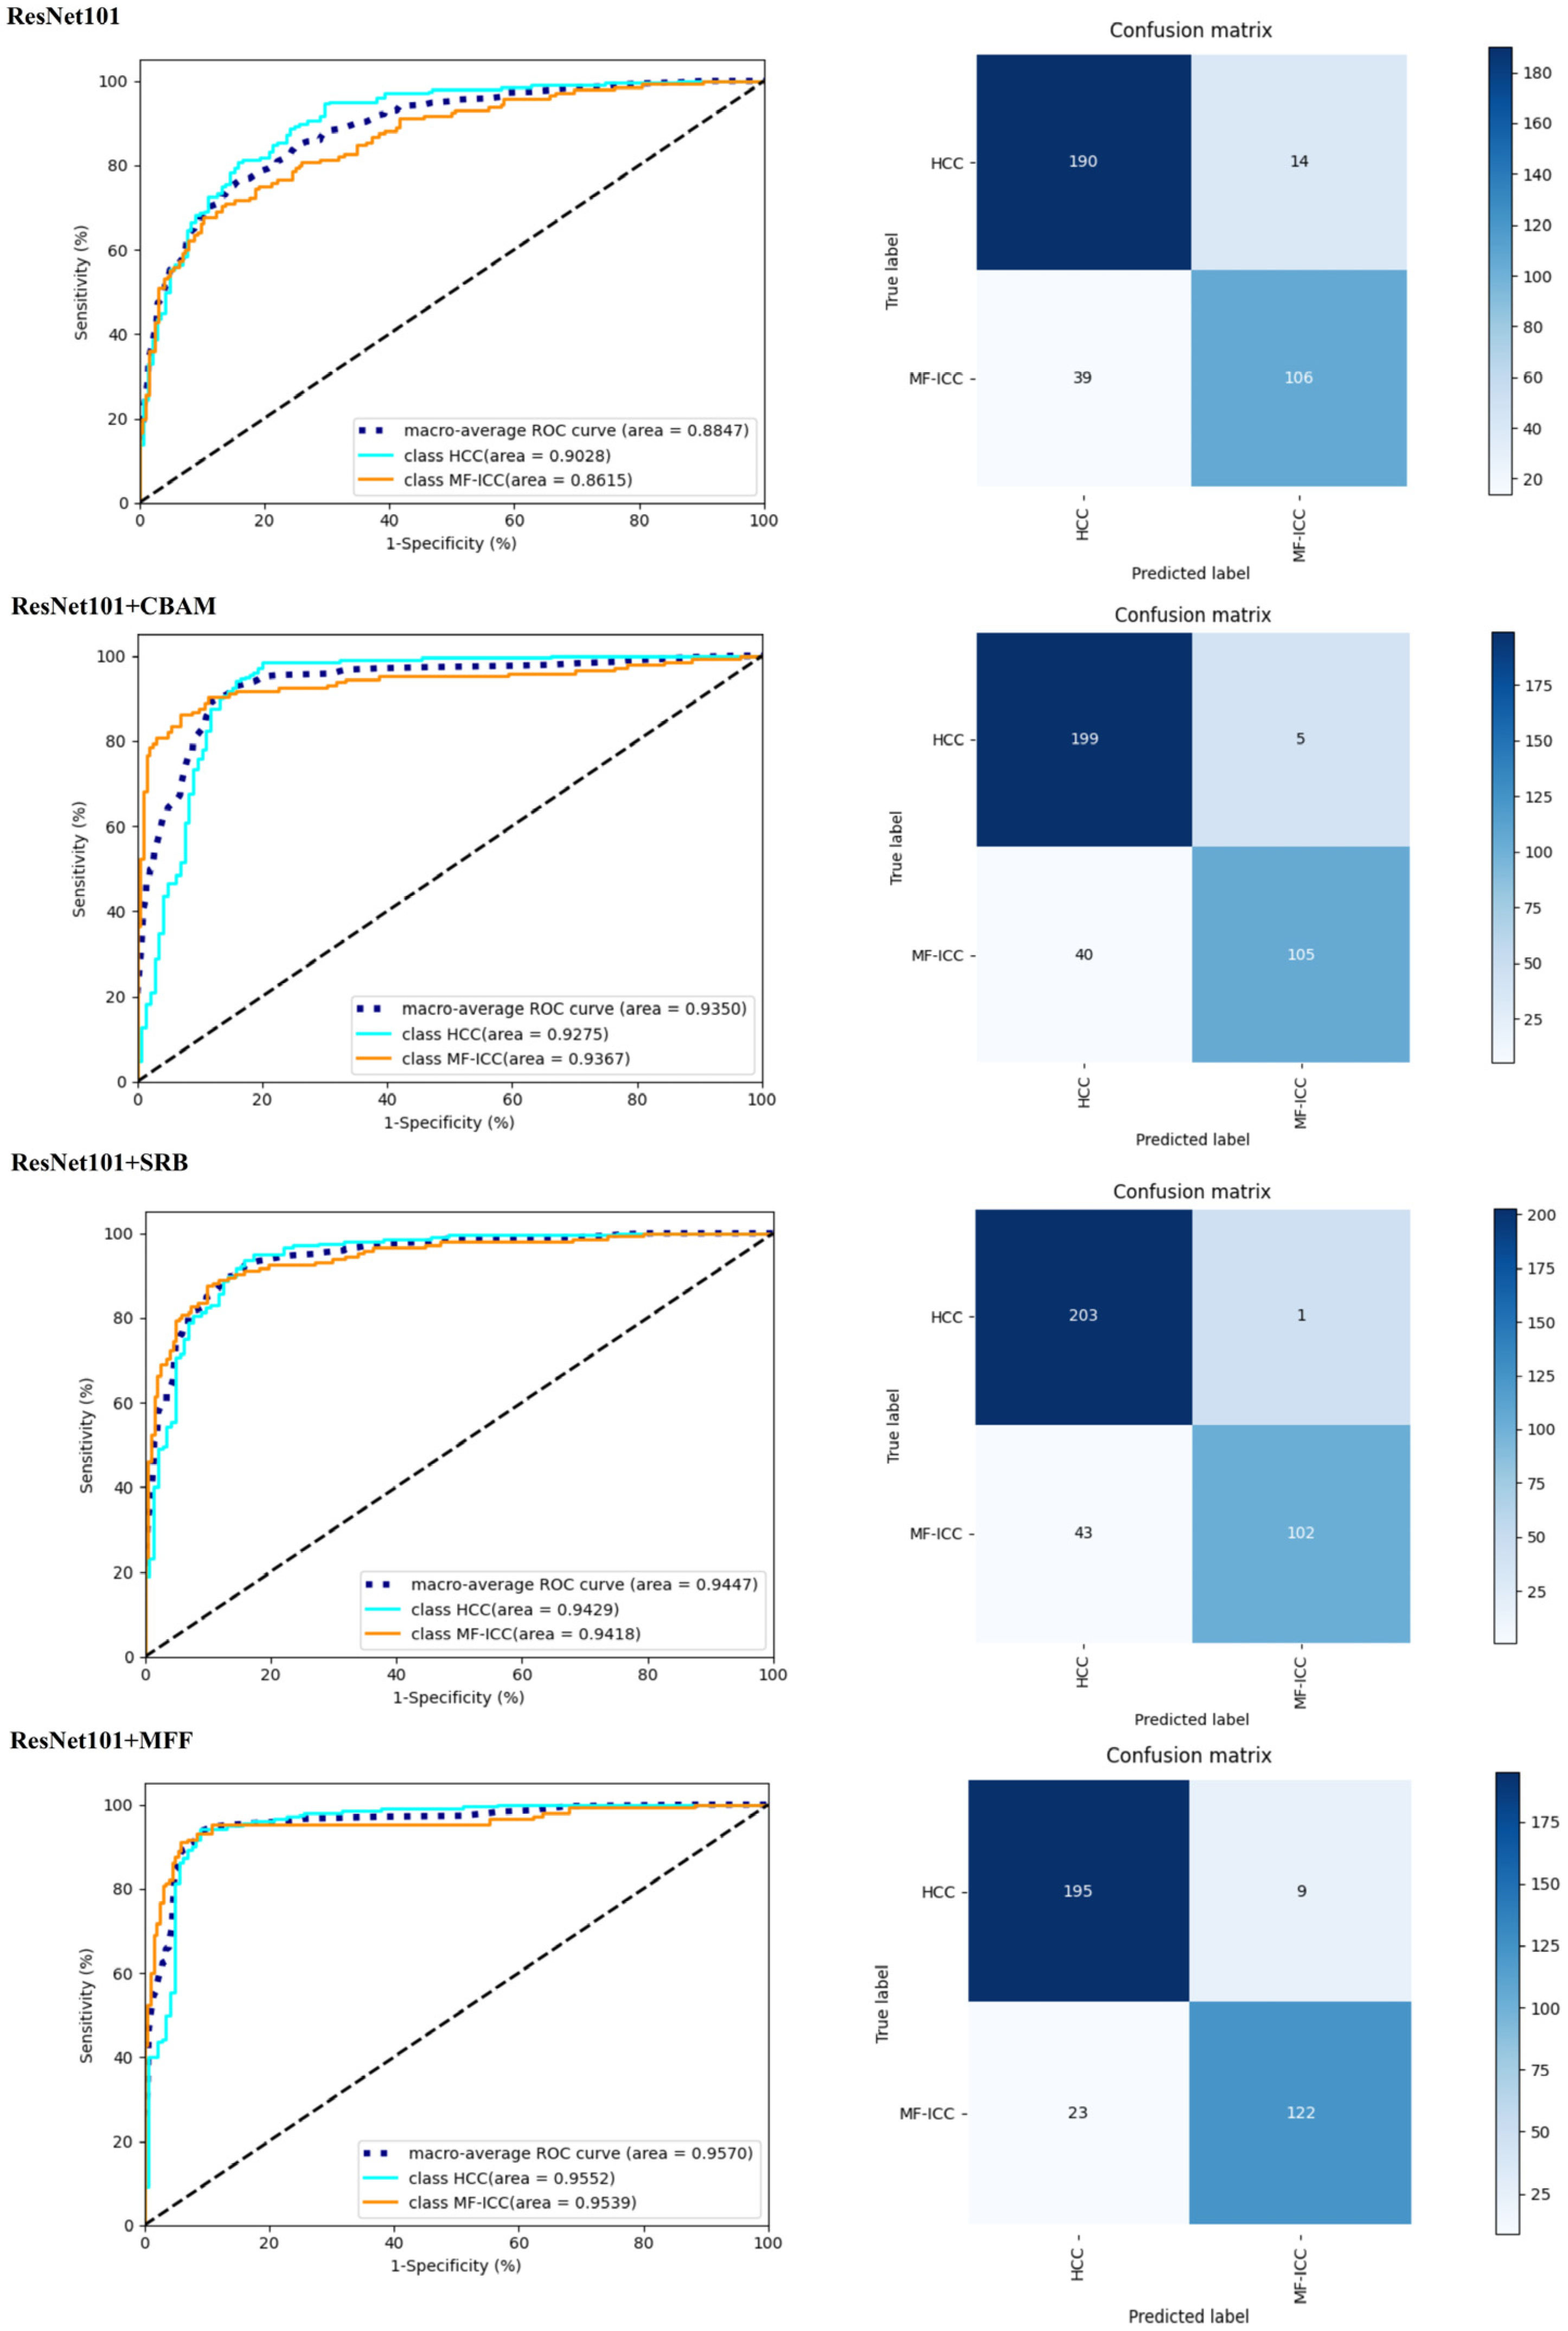
| ResNet101 | HCC | 0.8465 | 0.8922 | 0.8687 | 0.8424 | 0.8847 |
| MF-ICC | 0.8358 | 0.7724 | 0.8029 | |||
| ResNet101+CBAM | HCC | 0.8916 | 0.8873 | 0.8894 | 0.8711 | 0.9350 |
| MF-ICC | 0.8425 | 0.8483 | 0.8454 | |||
| ResNet101+SRB | HCC | 0.9050 | 0.8873 | 0.8960 | 0.8797 | 0.9447 |
| MF-ICC | 0.8456 | 0.8690 | 0.8571 | |||
| ResNet101+MFF | HCC | 0.8739 | 0.9853 | 0.9263 | 0.9083 | 0.9570 |
| MF-ICC | 0.9748 | 0.8000 | 0.8788 | |||
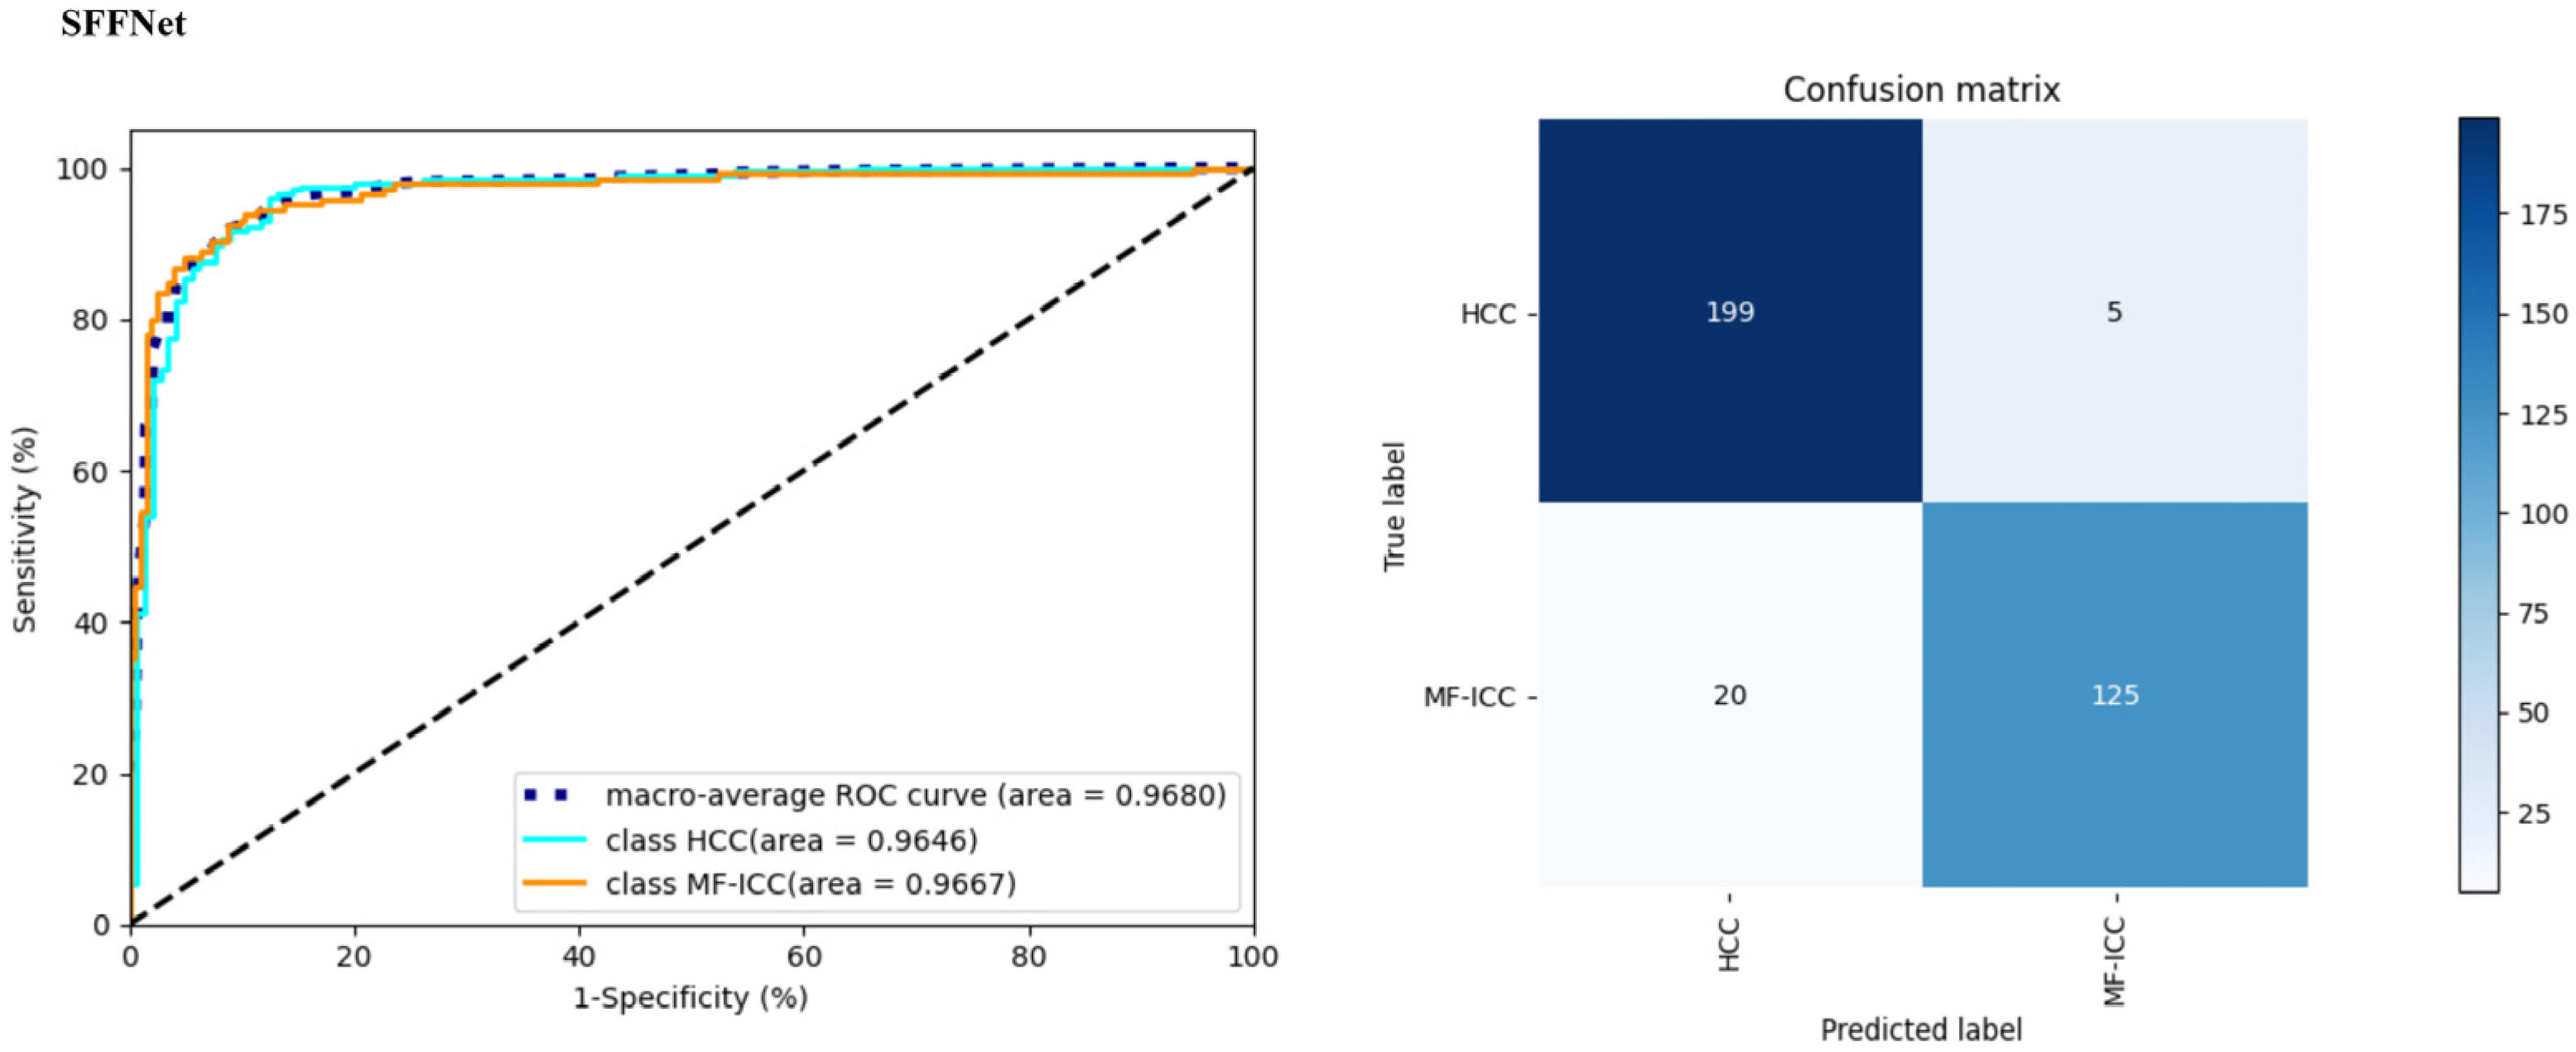
| SFFNet | HCC | 0.9078 | 0.9657 | 0.9359 | 0.9226 | 0.9680 |
| MF-ICC | 0.9470 | 0.8621 | 0.9025 |
| Classification Model | Classification Type | Precision | Recall | F1_score | Accuracy | AUC |
|---|---|---|---|---|---|---|
| SVM | HCC | 0.5909 | 0.8667 | 0.7027 | 0.6099 | 0.6834 |
| MF-ICC | 0.6774 | 0.3182 | 0.4330 | |||
| CNN-Oestmann | HCC | 0.5455 | 0.8000 | 0.6486 | 0.5667 | 0.4717 |
| MF-ICC | 0.6250 | 0.3333 | 0.4348 | |||
| Inception v3 | HCC | 0.8333 | 0.7843 | 0.8081 | 0.7822 | 0.8845 |
| MF-ICC | 0.7197 | 0.7793 | 0.7483 | |||
| Densenet169 | HCC | 0.8363 | 0.7402 | 0.7844 | 0.7622 | 0.8388 |
| MF-ICC | 0.6845 | 0.7931 | 0.7348 | |||
| Eifficientnet | HCC | 0.8171 | 0.7010 | 0.7546 | 0.7335 | 0.8035 |
| MF-ICC | 0.6494 | 0.7793 | 0.7085 | |||
| VGG19 | HCC | 0.7946 | 0.8725 | 0.8318 | 0.7936 | 0.8364 |
| MF-ICC | 0.7920 | 0.6828 | 0.7333 | |||
| AlexNet | HCC | 0.8190 | 0.8431 | 0.8309 | 0.7994 | 0.8657 |
| MF-ICC | 0.7698 | 0.7379 | 0.7535 | |||
| SFFNet | HCC | 0.9078 | 0.9657 | 0.9359 | 0.9226 | 0.9680 |
| MF-ICC | 0.9470 | 0.8621 | 0.9025 |
Disclaimer/Publisher’s Note: The statements, opinions and data contained in all publications are solely those of the individual author(s) and contributor(s) and not of MDPI and/or the editor(s). MDPI and/or the editor(s) disclaim responsibility for any injury to people or property resulting from any ideas, methods, instructions or products referred to in the content. |
© 2022 by the authors. Licensee MDPI, Basel, Switzerland. This article is an open access article distributed under the terms and conditions of the Creative Commons Attribution (CC BY) license (https://creativecommons.org/licenses/by/4.0/).
Share and Cite
Liu, Y.; Wang, B.; Mo, X.; Tang, K.; He, J.; Hao, J. A Deep Learning Workflow for Mass-Forming Intrahepatic Cholangiocarcinoma and Hepatocellular Carcinoma Classification Based on MRI. Curr. Oncol. 2023, 30, 529-544. https://doi.org/10.3390/curroncol30010042
Liu Y, Wang B, Mo X, Tang K, He J, Hao J. A Deep Learning Workflow for Mass-Forming Intrahepatic Cholangiocarcinoma and Hepatocellular Carcinoma Classification Based on MRI. Current Oncology. 2023; 30(1):529-544. https://doi.org/10.3390/curroncol30010042
Chicago/Turabian StyleLiu, Yangling, Bin Wang, Xiao Mo, Kang Tang, Jianfeng He, and Jingang Hao. 2023. "A Deep Learning Workflow for Mass-Forming Intrahepatic Cholangiocarcinoma and Hepatocellular Carcinoma Classification Based on MRI" Current Oncology 30, no. 1: 529-544. https://doi.org/10.3390/curroncol30010042
APA StyleLiu, Y., Wang, B., Mo, X., Tang, K., He, J., & Hao, J. (2023). A Deep Learning Workflow for Mass-Forming Intrahepatic Cholangiocarcinoma and Hepatocellular Carcinoma Classification Based on MRI. Current Oncology, 30(1), 529-544. https://doi.org/10.3390/curroncol30010042