Overdetection of Breast Cancer


Abstract
:1. Introduction
1.1. In Situ Cancers
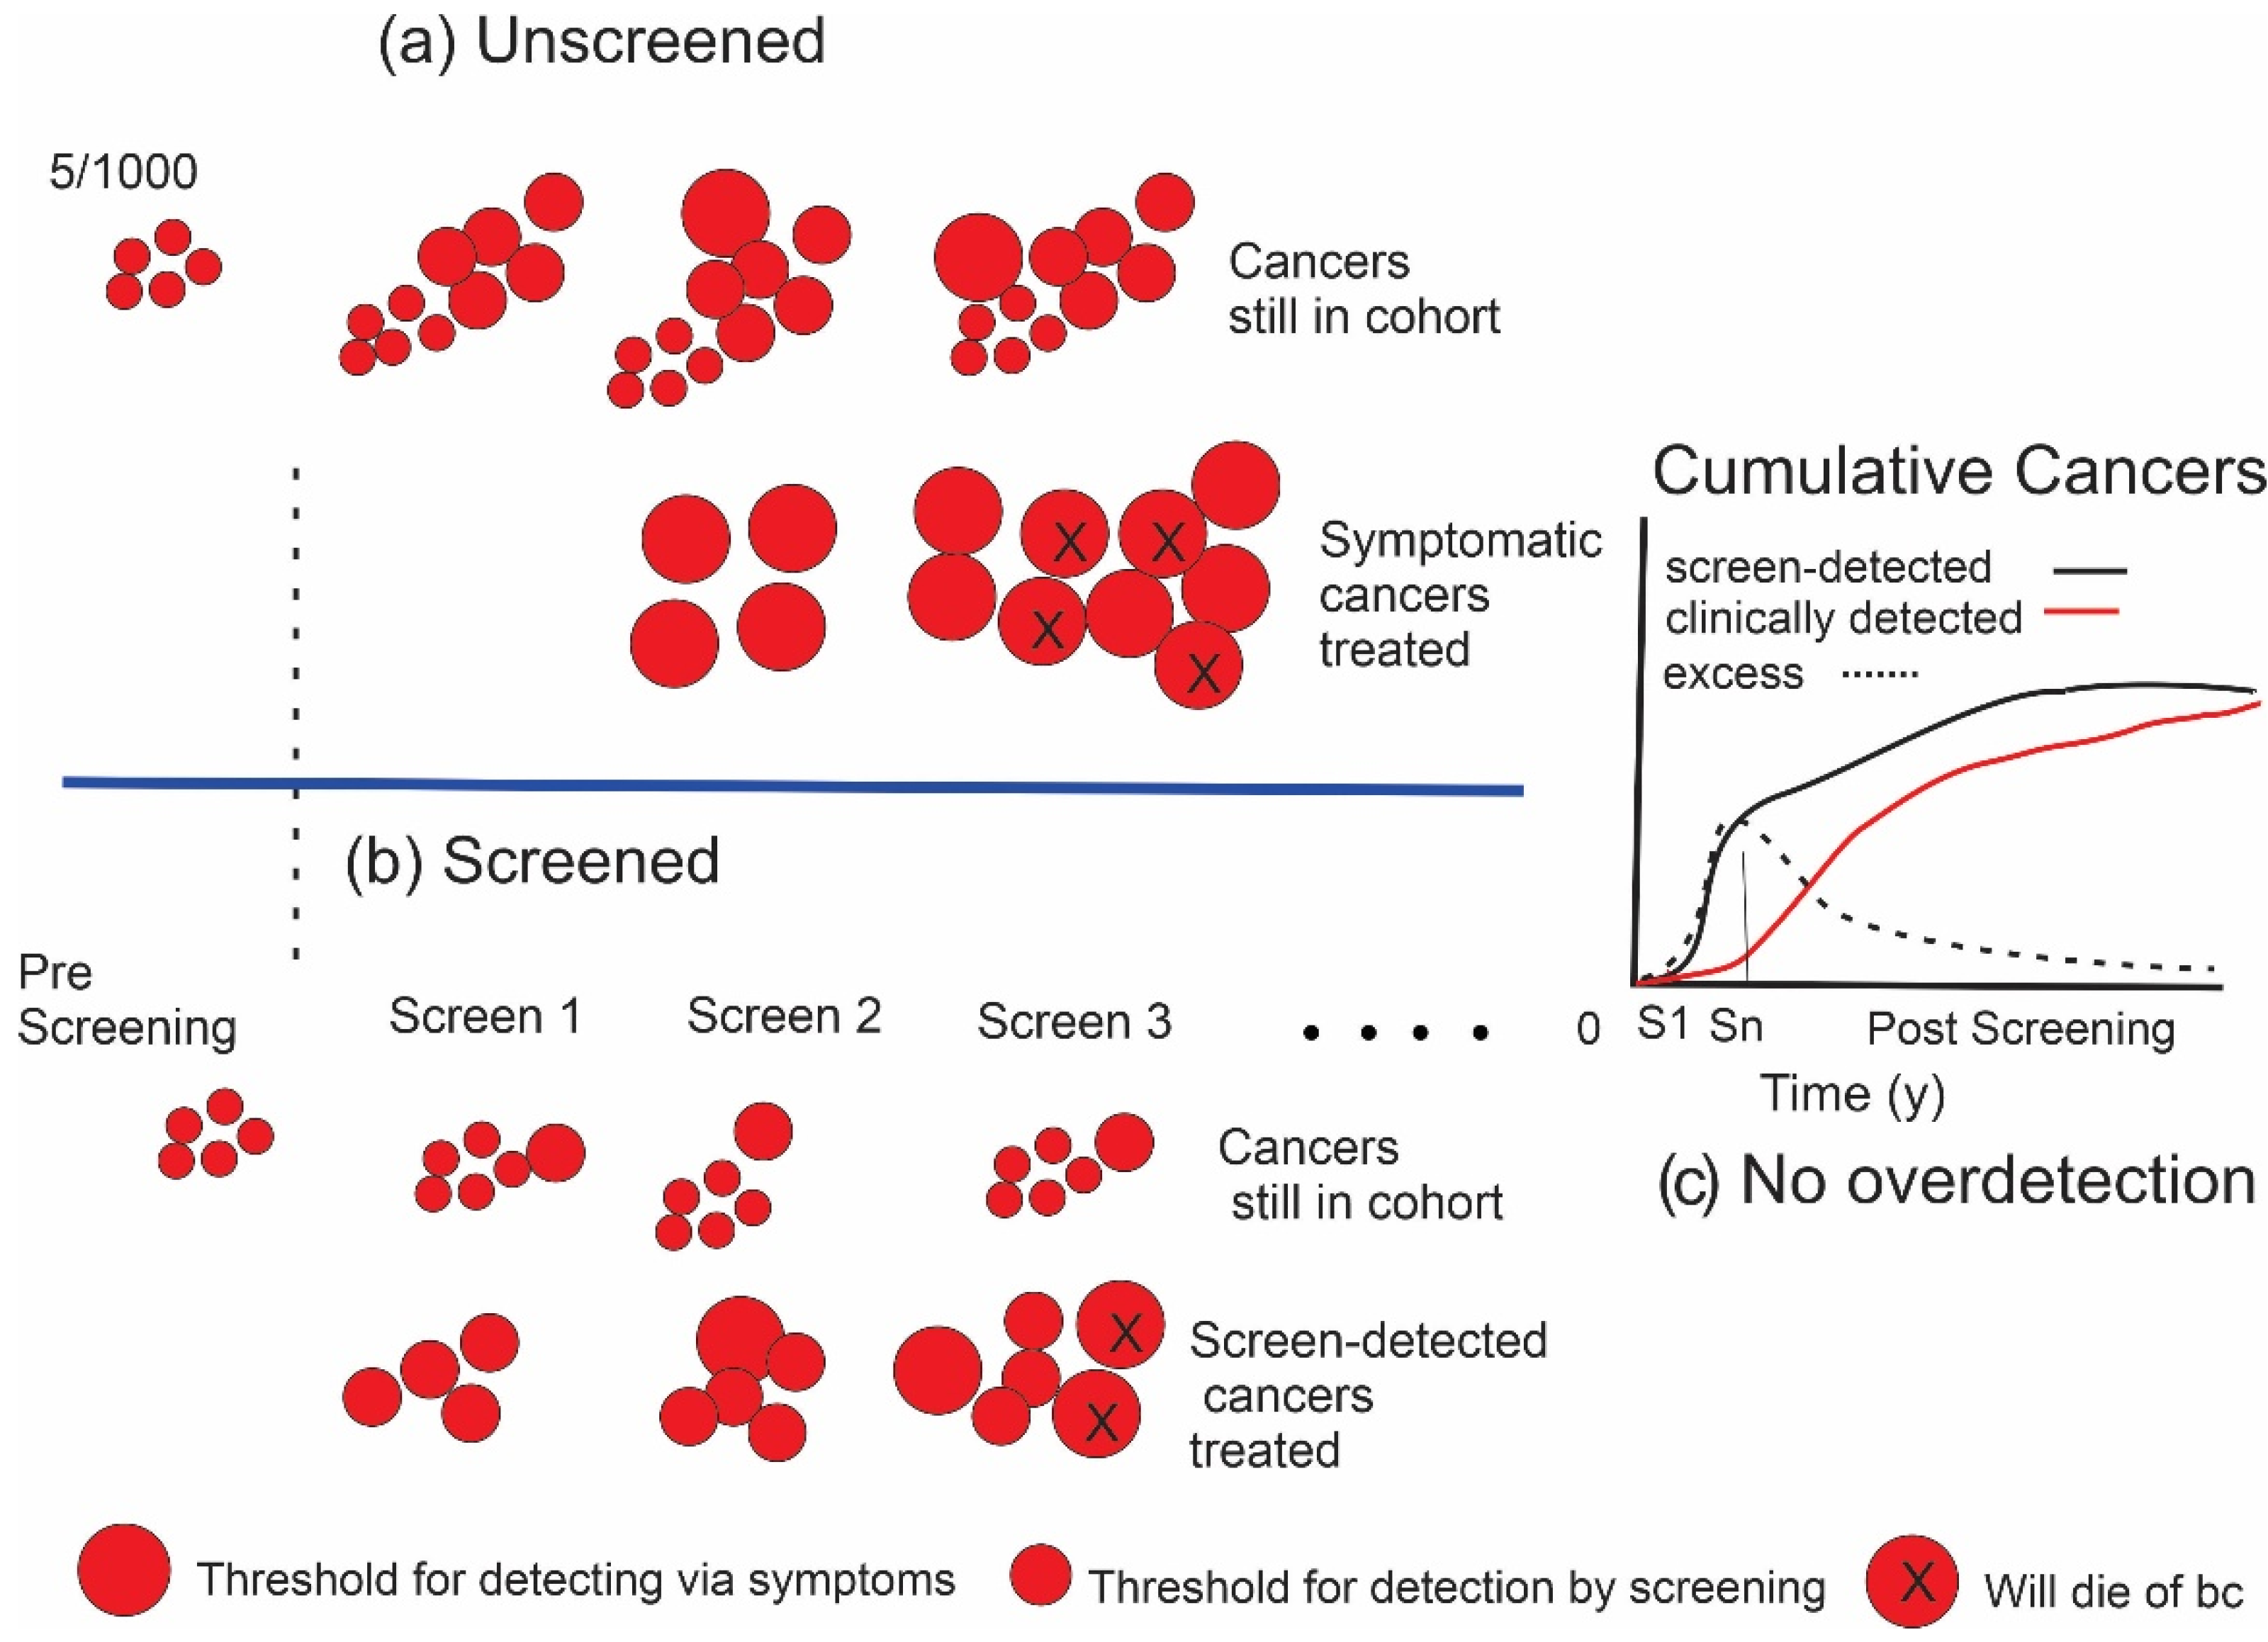
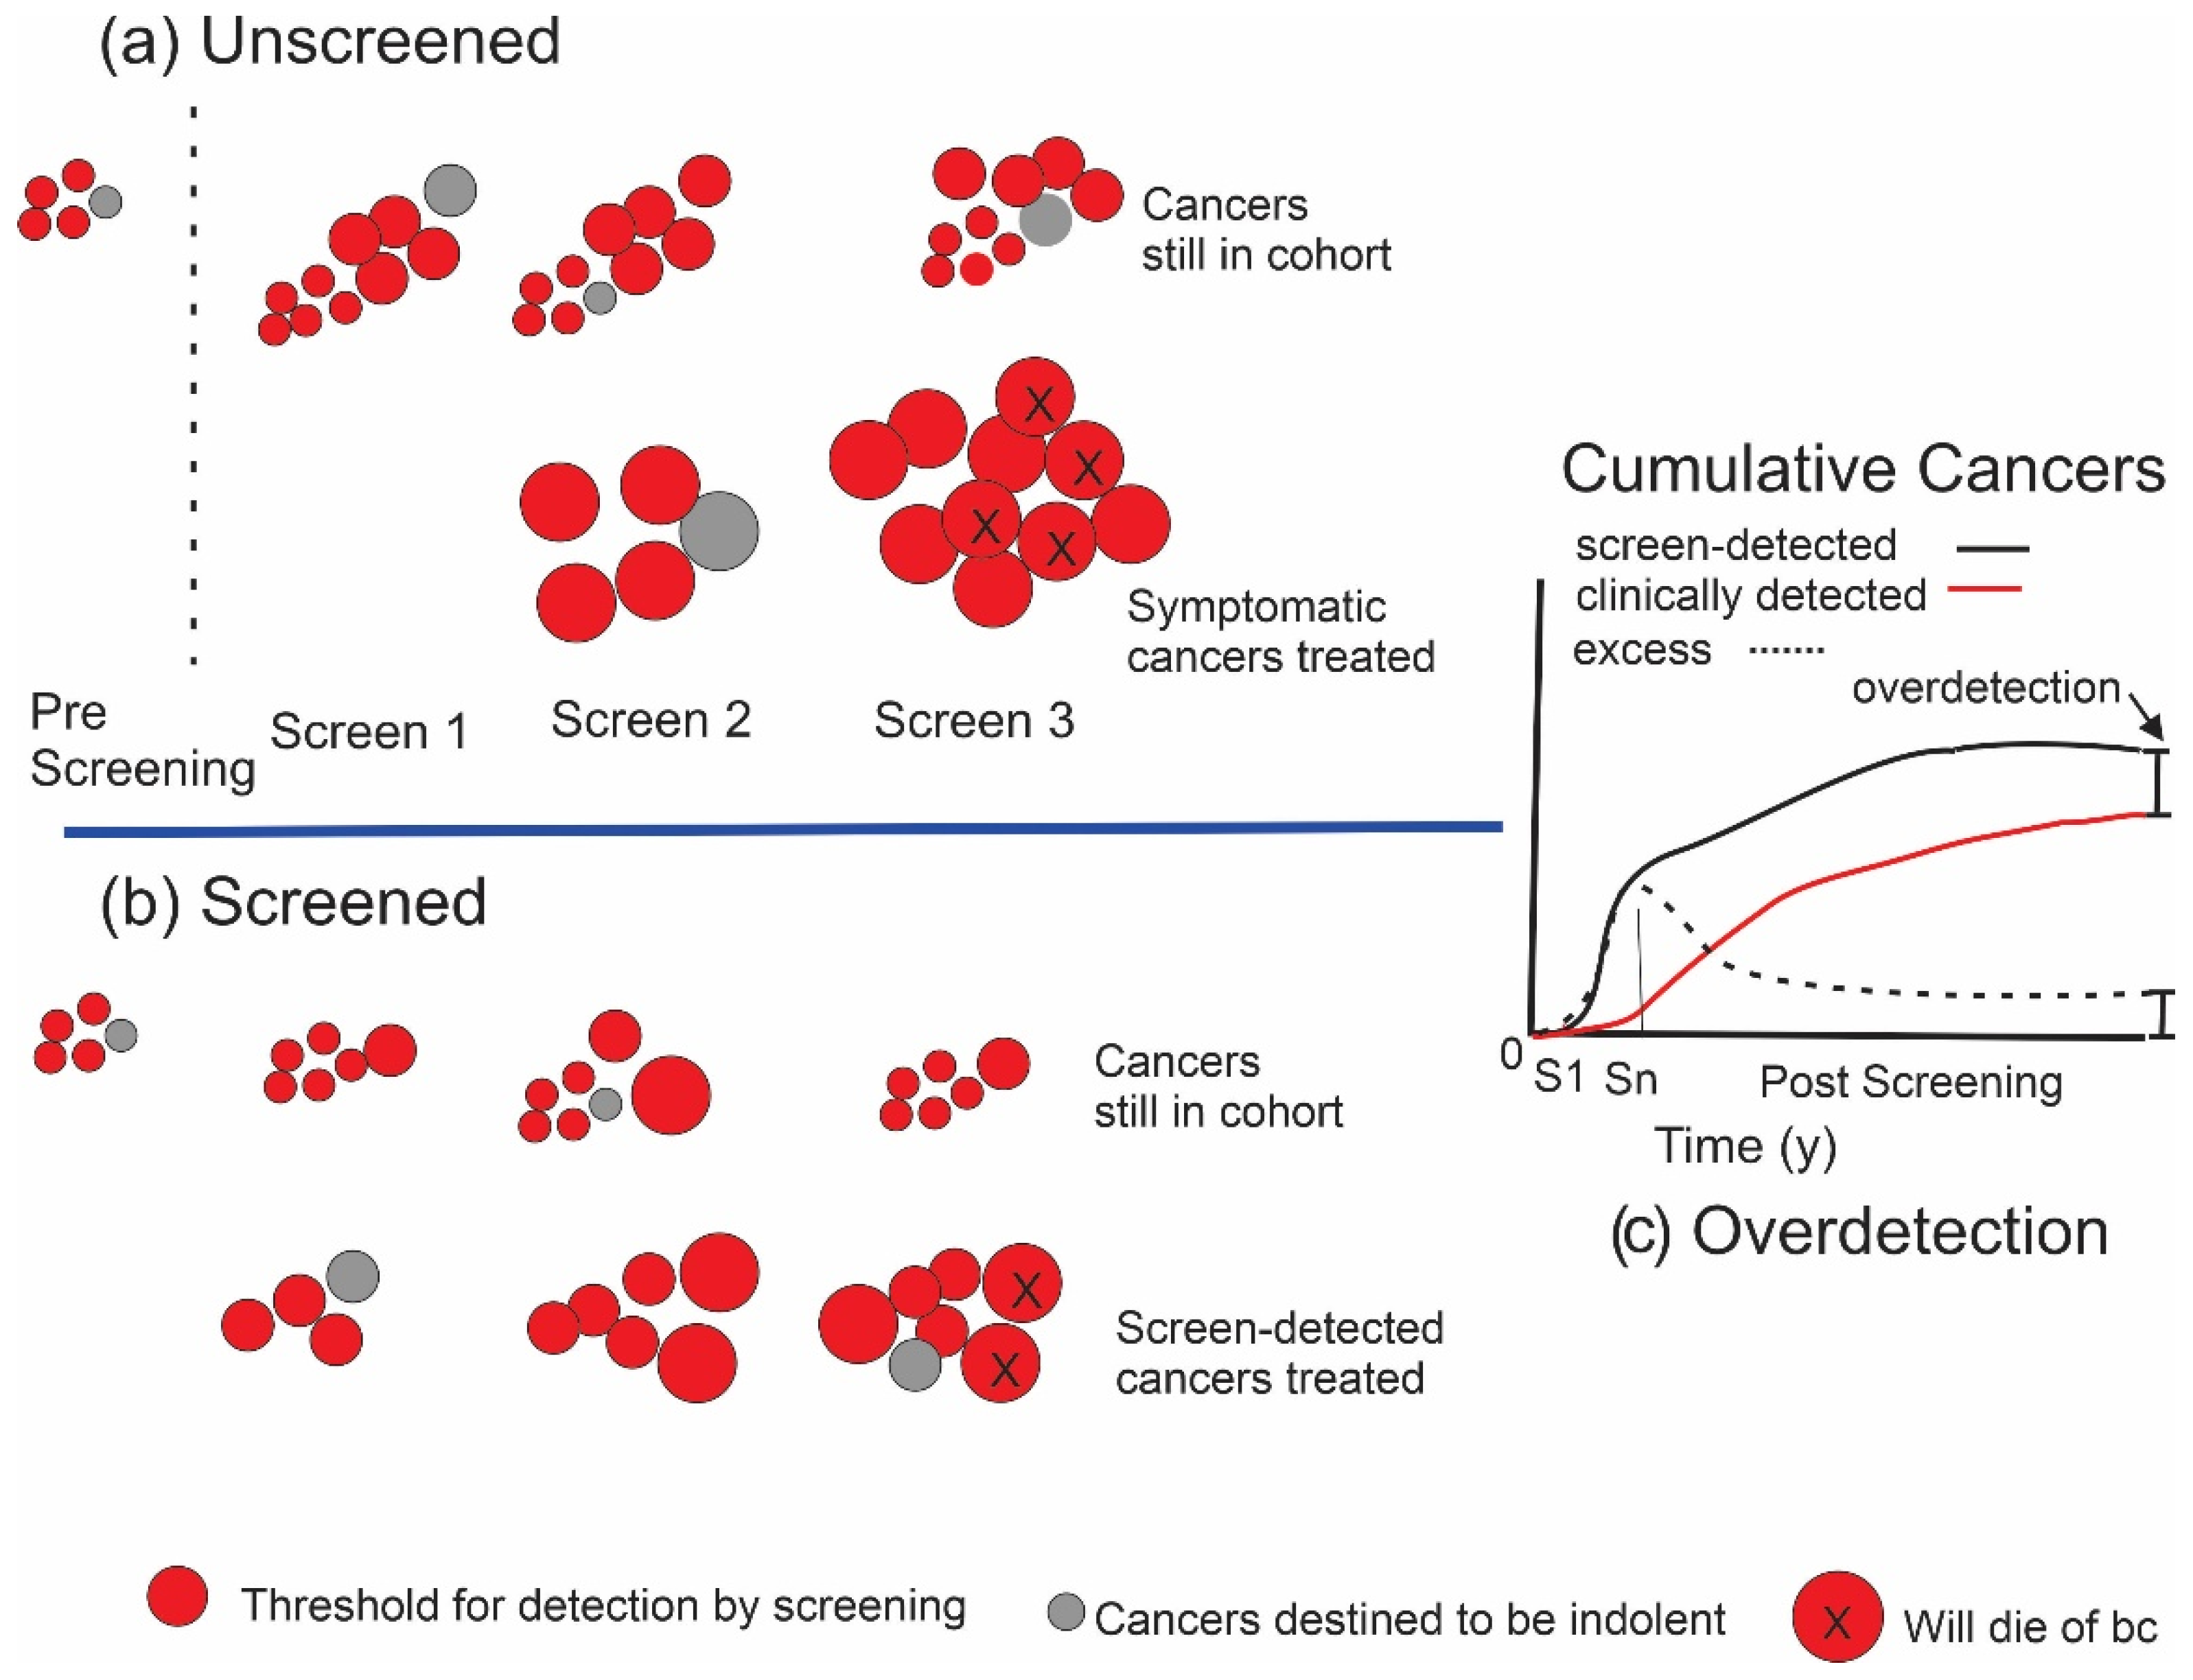
1.2. Estimating the Amount of Overdetection from Screening
1.3. Example–Canadian National Breast Screening Study
2. Materials and Methods
Modelling
3. Results
3.1. CNBSS Findings
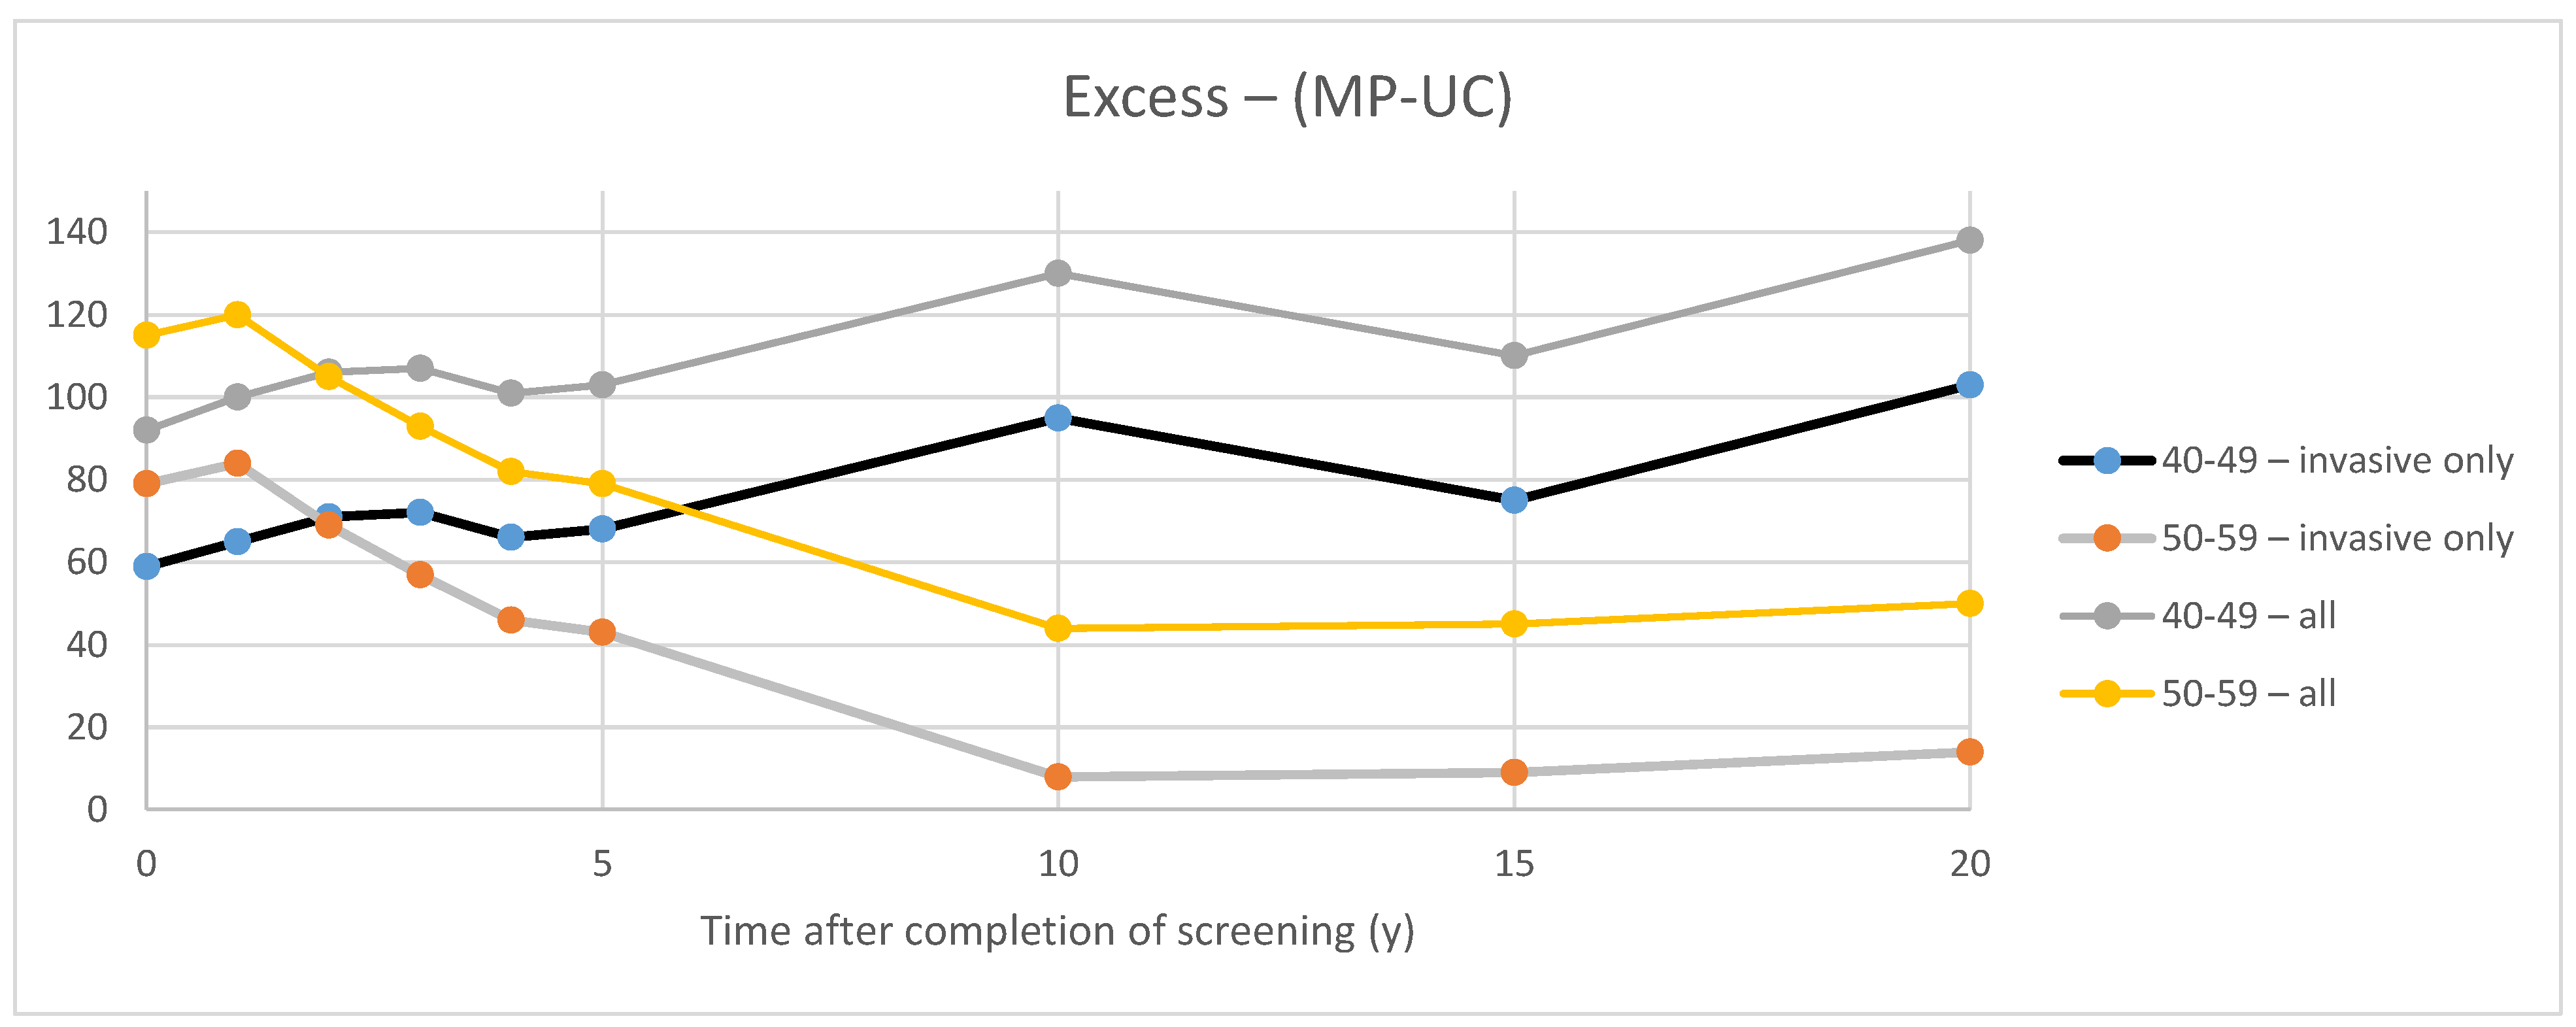
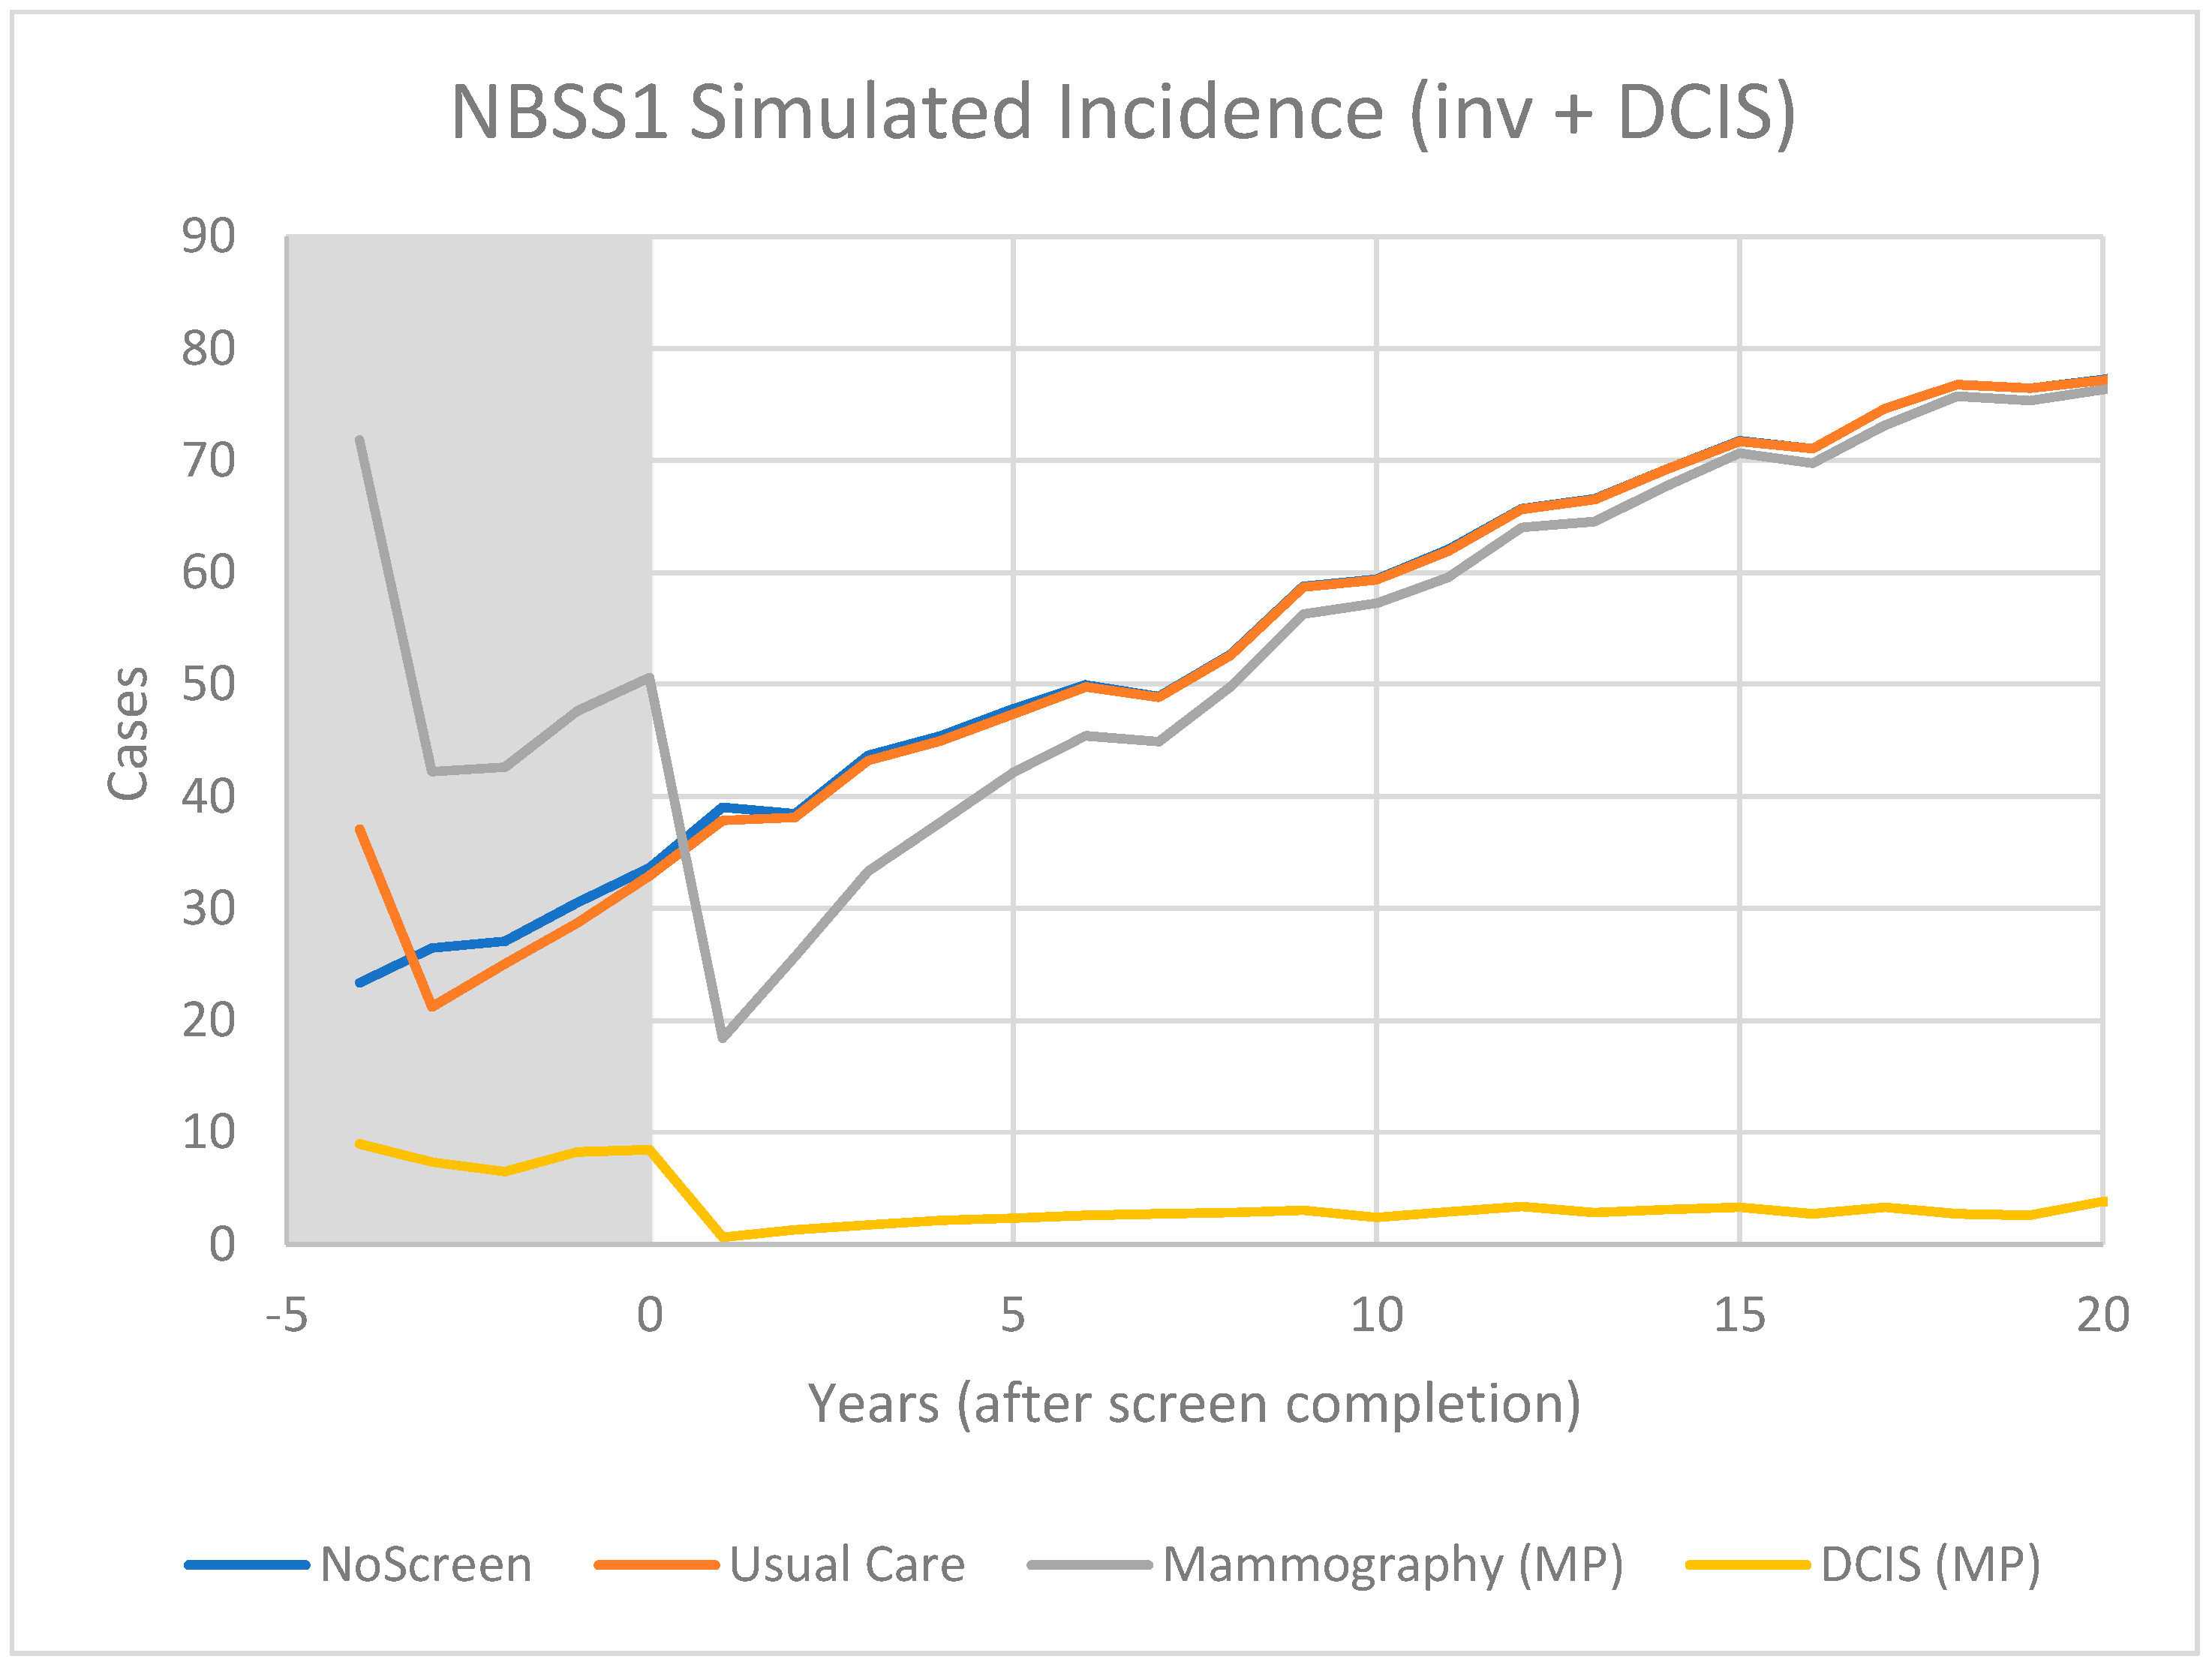
3.2. Modelling
4. Discussion
4.1. Excess of In Situ Cancers
4.2. Model Predictions
4.3. Overtreatment
5. Conclusions
Author Contributions
Funding
Data Availability Statement
Acknowledgments
Conflicts of Interest
References
- Marmot, M.G.; Altman, D.G.; Cameron, D.A.; Dewar, J.A.; Thompson, S.G.; Wilcox, M. The benefits and harms of breast cancer screening: An independent review. Br. J. Cancer 2013, 108, 2205–2240. [Google Scholar] [CrossRef] [PubMed] [Green Version]
- Nelson, H.D.; Pappas, M.; Cantor, A.; Griffin, J.; Daeges, M.; Humphrey, L. Harms of breast cancer screening: Systematic review to update the 2009 U.S. Preventive Services Task Force recommendation. Ann. Int. Med. 2016, 164, 256–267. [Google Scholar] [CrossRef] [PubMed] [Green Version]
- Klarenbach, S.; Sims-Jones, N.; Lewin, G.; Singh, H.; Thériault, G.; Tonelli, M.; Doull, M.; Courage, S.; Garcia, A.J.; Thombs, B.D. Recommendations on screening for breast cancer in women 40–74 years of age who are not at increased risk for breast cancer. CMAJ 2018, 190, E1441–E1451. [Google Scholar] [CrossRef] [Green Version]
- Welch, H.G. Cancer Screening—The good, the bad, and the ugly. JAMA Surg. 2022. [Google Scholar] [CrossRef]
- International Agency for Research on Cancer. Breast Cancer Screening IARC Handbook of Cancer Prevention; International Agency for Research on Cancer: Lyon, France, 2016; Volume 15. [Google Scholar]
- Brodersen, J.; Schwartz, L.M.; Heneghan, C.; O’Sullivan, J.W.; Aronson, J.K.; Woloshin, S. Overdiagnosis: What it is and what it isn’t. BMJ Evid. Based Med. 2018, 23, 1–3. [Google Scholar] [CrossRef] [Green Version]
- Coldman, A.; Phillips, N.; Wilson, C.; Decker, K.; Chiarelli, A.M.; Brisson, J.; Zhang, B.; Payne, J.; Doyle, G.; Ahmad, R. Pan-Canadian Study of Mammography Screening and Mortality from Breast Cancer. JNCI J. Natl. Cancer Inst. 2014, 106, dju261. [Google Scholar] [CrossRef] [PubMed] [Green Version]
- Ryser, M.D.; Lange, J.; Inoue, L.Y.T.; O’Meara, E.S.; Gard, C.; Miglioretti, D.L.; Bulliard, J.L.; Brouwer, A.F.; Hwang, E.S.; Etzioni, R.B. Estimation of Breast Cancer Overdiagnosis in a U.S. Breast Screening Cohort. Ann. Int. Med. 2022, 175, 471–478. [Google Scholar] [CrossRef]
- Glasziou, P.P.; Jones, M.A.; Pathirana, T.; Barratt, A.L.; Bell, K.J. Estimating the magnitude of cancer overdiagnosis in Australia. Med. J. Aust. 2020, 212, 163–168. [Google Scholar] [CrossRef] [Green Version]
- Collins, L.C.; Achacoso, N.; Haque, R.; Nekhlyudov, L.; Fletcher, S.W.; Quesenberry, C.P.; Schnitt, S.J.; Habel, L.A. Risk factors for noninvasive and invasive local recurrence in patients with ductal carcinoma in situ. Breast Cancer Res. Treat. 2013, 139, 453–460. [Google Scholar] [CrossRef] [Green Version]
- Early Breast Cancer Trialists’ Collaborative Group (EBCTCG). Overview of the Randomized Trials of Radiotherapy in Ductal Carcinoma In Situ of the Breast. J. Natl. Cancer Inst. Monogr. 2010, 41, 162–177. [Google Scholar]
- Rakovitch, E.; Nofech-Mozes, S.; Narod, S.A.; Hanna, W.; Thiruchelvam, D.; Saskin, R.; Taylor, C.; Tuck, A.; Sengupta, S.; Elavathil, L.; et al. Can we select individuals with low risk ductal carcinoma in situ (DCIS)? A population-based outcomes analysis. Breast Cancer Res. Treat. 2013, 138, 581–590. [Google Scholar] [CrossRef] [PubMed]
- Solin, L.J.; Gray, R.; Hughes, L.L.; Wood, W.C.; Lowen, M.A.; Badve, S.S.; Baehner, F.L.; Ingle, J.N.; Perez, E.A.; Recht, A.; et al. Surgical excision without radiation for ductal carcinoma in situ of the breast: 12-year results from the ECOG-ACRIN E5194 Study. J. Clin. Oncol. 2015, 33, 3938–3944. [Google Scholar] [CrossRef] [PubMed] [Green Version]
- Moss, S. Overdiagnosis and overtreatment of breast cancer: Overdiagnosis in randomised controlled trials of breast cancer screening. Breast Cancer Res. 2005, 7, 230–234. [Google Scholar] [CrossRef] [PubMed] [Green Version]
- Zahl, P.H.; Jorgensen, K.J.; Gotzsche, P.C. Overestimated lead times in cancer screening has led to substantial underestimation of overdiagnosis. Br. J. Cancer 2013, 109, 2014–2019. [Google Scholar] [CrossRef] [PubMed] [Green Version]
- Bleyer, A.; Welch, H.G. Effect of Three Decades of Screening Mammography on Breast-Cancer Incidence. N. Engl. J. Med. 2012, 367, 1998–2005. [Google Scholar] [CrossRef] [Green Version]
- Kopans, D.B. Arguments against mammography screening continue to be based on faulty science. Oncologist 2014, 19, 107–112. [Google Scholar] [CrossRef] [Green Version]
- Yaffe, M.J.; Pritchard, K.I. Commentary: Overdiagnosing Overdiagnosis. Oncologist 2014, 19, 103–106. [Google Scholar] [CrossRef] [Green Version]
- Puliti, D.; Duffy, S.W.; Miccinesi, G.; de Koning, H.; Lynge, E.; Zappa, M.; Paci, M.; the EUROSCREEN WorkingGroup. Overdiagnosis in mammographic screening for breast cancer in Europe: A literature review. J. Med. Screen. 2012, 19, 42–56. [Google Scholar] [CrossRef]
- Etzioni, R.; Gulati, R. Recognizing the limitations of cancer overdiagnosis studies: A first step towards overcoming them. J. Natl. Cancer Inst. 2016, 108, djv345. [Google Scholar] [CrossRef] [Green Version]
- Baines, C.J.; To, T.; Miller, A.B. Revised estimates of overdiagnosis from the Canadian National Breast Screening Study. Prev. Med. 2016, 90, 66–71. [Google Scholar] [CrossRef]
- Miller, A.B.; Wall, C.; Baines, C.J.; Sun, P.; To, T.; Narod, S.A. Twenty five year followup for breast cancer incidence and mortality of the Canadian National Breast Screening Study: Randomised screening trial. BMJ 2014, 348, g366. [Google Scholar] [CrossRef] [PubMed] [Green Version]
- Miller, A.B.; Baines, C.J.; To, T.; Wall, C. Canadian National Breast Screening Study: 1. Breast cancer detection and death rates among women aged 40 to 49 years. CMAJ 1992, 147, 1459–1476. [Google Scholar] [PubMed]
- Miller, A.B.; Baines, C.J.; To, T.; Wall, C. Canadian National Breast Screening Study: 2. Breast cancer detection and death rates among women aged 50 to 59 years. CMAJ 1992, 147, 1477–1488. [Google Scholar] [PubMed]
- Yong, J.H.E.; Nadeau, C.; Flanagan, W.M.; Coldman, A.J.; Asakawa, K.; Garner, R.; Fitzgerald, N.; Yaffe, M.J.; Miller, A.B. The OncoSim-Breast cancer microsimulation model. Curr. Oncol. 2022, 29, 1619–1633. [Google Scholar] [CrossRef]
- CISNET Wisconsin Model of Breast Cancer. 2013. Available online: https://cisnet.flexkb.net/mp/pub/CISNET_ModelProfile_BREAST_UWISC_001_07232013_58567.pdf (accessed on 27 May 2022).
- Epstein, S.S.; Bertell, R.; Seaman, B. Dangers and unreliability of mammography: Breast examination is a safe, effective, and practical alternative. Int. J. Health Serv. 2001, 31, 605–615. [Google Scholar] [CrossRef] [Green Version]
- Miglioretti, D.L.; Lange, J.; van den Broek, J.J.; Lee, C.I.; van Ravesteyn, N.T.; Ritley, D.; Kerlikowske, K.; Fenton, J.J.; Melnikow, J.; de Koning, H.J.; et al. Radiation-Induced Breast Cancer Incidence and Mortality From Digital Mammography Screening: A Modeling Study. Ann. Int. Med. 2016, 164, 205–214. [Google Scholar] [CrossRef]
- Yaffe, M.J.; Mainprize, J.G. Risk of Radiation-induced Breast Cancer from Mammographic Screening. Radiology 2010, 258, 98–105. [Google Scholar] [CrossRef] [Green Version]
- Hendrick, R.E. Radiation doses and cancer risks from breast imaging studies. Radiology 2010, 257, 246–253. [Google Scholar] [CrossRef] [Green Version]
- Pinder, S.E. Ductal carcinoma in situ (DCIS): Pathological features, differential diagnosis, prognostic factors and specimen evaluation. Mod. Pathol. 2010, 23, S8–S13. [Google Scholar] [CrossRef] [Green Version]
- Yaffe, M.J.; Mainprize, J.G. The Value of All-Cause Mortality as a Metric for Assessing Breast Cancer Screening. J. Natl. Cancer Inst. 2020, djaa025. [Google Scholar] [CrossRef] [Green Version]
- Yaffe, M.J.; Seely, J.E.; Gordon, P.B.; Appavoo, S.; Kopans, D.B. The Randomized trial of mammography screening that was not—A cautionary tale. J. Med. Screen. 2022, 29, 7–11. [Google Scholar] [CrossRef] [PubMed]
- Morrow, M.; Van Zee, K.J.; Solin, L.J.; Houssami, N.; Chavez-MacGregor, M.; Harris, J.R.; Horton, J.; Hwang, S.; Johnson, P.L.; Marinovich, M.L.; et al. Society of Surgical Oncology-American Society for Radiation Oncology-American Society of Clinical Oncology Consensus Guideline on Margins for Breast-Conserving Surgery With Whole-Breast Irradiation in Ductal Carcinoma in Situ. Pract Radiat Oncol. 2016, 6, 287–295. [Google Scholar] [CrossRef] [PubMed] [Green Version]
- Collins, L.C.; Laronga, C.; Wong, J.S. Ductal Carcinoma In Situ: Treatment and Prognosis. Available online: http://www.uptodate.com/contents/ductal-carcinoma-in-situ-treatment-and-prognosis (accessed on 27 May 2022).
- Giannakeas, V.; Sopik, V.; Narod, S.A. Association of a Diagnosis of Ductal Carcinoma In Situ with Death from Breast Cancer. JAMA Netw. Open. 2020, 3, e2017124. [Google Scholar] [CrossRef] [PubMed]
- Paszat, L.; Sutradhar, R.; Zhou, L.; Nofech-Mozes, S.; Rakovitch, E. Including the ductal carcinoma-in-situ (DCIS) score in the development of a multivariable prediction model for recurrence after excision of DCIS. Clin. Breast Cancer 2019, 19, 35–46. [Google Scholar] [CrossRef] [Green Version]
- Rakovitch, E.; Gray, R.; Baehner, F.L.; Sutradhar, R.; Crager, M.; Gu, S.; Nofech-Mozes, S.; Badve, S.S.; Hanna, W.; Hughes, L.L.; et al. Refined estimates of local recurrence risks by DCIS score adjusting for clinicopathological features: A combined analysis of ECOG-ACRIN E5194 and Ontario DCIS cohort studies. Breast Cancer Res. Treat. 2018, 169, 359–369. [Google Scholar] [CrossRef] [Green Version]
- Rakovitch, E.; Sutradhar, R.; Nofech-Mozes, S.; Gu, S.; Fong, C.; Hanna, W.; Paszat, L. 21-Gene Assay and Breast Cancer Mortality in Ductal Carcinoma In Situ. JNCI J. Natl. Cancer Inst. 2021, 113, djaa179. [Google Scholar] [CrossRef]
- Ernster, V.L.; Ballard-Barbash, R.; Barlow, W.E.; Zheng, Y.; Weaver, D.L.; Cutter, G.; Yankaskas, B.C.; Rosenberg, R.; Carney, P.A.; Kerlikowske, K.; et al. Detection of ductal carcinoma in situ in women undergoing screening mammography. J. Natl. Cancer Inst. 2002, 94, 1546–1554. [Google Scholar] [CrossRef] [Green Version]
- Kuhl, C. Abbreviated breast MRI for screening women with dense breast: The EA1141 trial. Br. J. Radiol. 2018, 91, 20170441. [Google Scholar] [CrossRef]
- Pisano, E.D.; Yaffe, M.J. Breast cancer screening: Should tomosynthesis replace digital mammography? JAMA 2014, 311, 2488–2489. [Google Scholar] [CrossRef]
- Rahbar, H.; McDonald, E.S.; Lee, J.G.M.; Partridge, S.C.; Lee, C.I. How Can Advanced Imaging Be Used to Mitigate Potential Breast Cancer Overdiagnosis? Acad. Radiol. 2016, 23, 768–773. [Google Scholar] [CrossRef] [Green Version]
- Tabár, L.; Dean, P.B.; Lee Tucker, F.; Yen, A.M.; Chen, S.L.; Jen, G.H.H.; Wang, J.W.; Smith, R.A.; Duffy, S.W.; Chen, T.H. A new approach to breast cancer terminology based on the anatomic site of tumour origin: The importance of radiologic imaging biomarkers. Eur. J. Radiol. 2022, 149, 110189. [Google Scholar] [CrossRef] [PubMed]
- Hwang, E.S.; Hyslop, T.; Lynch, T.; Frank, E.; Pinto, D.; Basila, D.; Collyar, D.; Bennett, A.; Kaplan, C.; Rosenberg, S.; et al. The COMET (Comparison of Operative versus Monitoring and Endocrine Therapy) trial: A phase III randomised controlled clinical trial for low-risk ductal carcinoma in situ (DCIS). BMJ Open 2019, 9, e026797. [Google Scholar] [CrossRef] [PubMed] [Green Version]
- Sparano, J.A.; Gray, R.J.; Makower, D.F.; Pritchard, K.I.; Albain, K.S.; Hayes, D.F.; Geyer, C.E., Jr.; Dees, E.C.; Goetz, M.P.; Olson, J.A., Jr.; et al. Adjuvant Chemotherapy Guided by a 21-Gene Expression Assay in Breast Cancer. N. Engl. J. Med. 2018, 379, 111–121. [Google Scholar] [CrossRef] [PubMed] [Green Version]
- Harris, L.N.; Ismaila, N.; McShane, L.M.; Andre, F.; Collyar, D.E.; Gonzalez-Angulo, A.M.; Hammond, E.H.; Kuderer, N.M.; Liu, M.C.; Mennel, R.G.; et al. Use of biomarkers to guide decisions on adjuvant systemic therapy for women with early-stage invasive breast cancer: American Society of Clinical Oncology Clinical Practice Guideline. J. Clin. Oncol. 2016, 34, 1134–1150. [Google Scholar] [CrossRef] [Green Version]
- Katz, S.J.; Jagsi, R.; Morrow, M. Reducing Overtreatment of Cancer With Precision Medicine: Just What the Doctor Ordered. JAMA 2018, 319, 1091–1092. [Google Scholar] [CrossRef]
- Allweis, T.M.; Hermann, N.; Berenstein-Molho, R.; Guindy, M. Personalized Screening for Breast Cancer: Rationale, Present Practices, and Future Directions. Ann. Surg. Oncol. 2021, 28, 4306–4317. [Google Scholar] [CrossRef]
- Pashayan, N.; Antoniou, A.C.; Ivanus, U.; Esserman, L.J.; Easton, D.F.; French, D.; Sroczynski, G.; Hall, P.; Cuzick, J.; Evans, D.G.; et al. Personalized early detection and prevention of breast cancer: ENVISION consensus statement. Nat. Rev. Clin. Oncol. 2020, 17, 687–705. [Google Scholar] [CrossRef]
- Román, M.; Sala, M.; Domingo, L.; Posso, M.; Louro, J.; Castells, X. Personalized breast cancer screening strategies: A systematic review and quality assessment. PLoS ONE 2019, 14, e0226352. [Google Scholar] [CrossRef] [Green Version]
- Brooks, J.D.; Nabi, H.H.; Andrulis, I.L.; Antoniou, A.C.; Chiquette, J.; Després, P.; Devilee, P.; Dorval, M.; Droit, A.; Easton, D.F.; et al. Personalized Risk Assessment for Prevention and Early Detection of Breast Cancer: Integration and Implementation (PERSPECTIVE I&I). J. Pers. Med. 2021, 11, 511. [Google Scholar] [CrossRef]
- Mukhtar, R.A.; Wong, J.G.M.; Esserman, L.J. Preventing overdiagnosis and overtreatment: Just the next step in the evolution of breast cancer care. J. Natl. Compr. Cancer Netw. 2015, 13, 737–743. [Google Scholar] [CrossRef]
- Hersch, J.; Barratt, A.; McGeechan, K.; Jansen, J.; Houssami, N.; Dhillon, H.; Jacklyn, G.; Irwig, L.; McCaffery, K. Informing Women About Overdetection in Breast Cancer Screening: Two-Year Outcomes From a Randomized Trial. J. Natl. Cancer Inst. 2021, 113, 1523–1530. [Google Scholar] [CrossRef] [PubMed]
Publisher’s Note: MDPI stays neutral with regard to jurisdictional claims in published maps and institutional affiliations. |
© 2022 by the authors. Licensee MDPI, Basel, Switzerland. This article is an open access article distributed under the terms and conditions of the Creative Commons Attribution (CC BY) license (https://creativecommons.org/licenses/by/4.0/).
Share and Cite
Yaffe, M.J.; Mainprize, J.G. Overdetection of Breast Cancer. Curr. Oncol. 2022, 29, 3894-3910. https://doi.org/10.3390/curroncol29060311
Yaffe MJ, Mainprize JG. Overdetection of Breast Cancer. Current Oncology. 2022; 29(6):3894-3910. https://doi.org/10.3390/curroncol29060311
Chicago/Turabian StyleYaffe, Martin J., and James G. Mainprize. 2022. "Overdetection of Breast Cancer" Current Oncology 29, no. 6: 3894-3910. https://doi.org/10.3390/curroncol29060311
APA StyleYaffe, M. J., & Mainprize, J. G. (2022). Overdetection of Breast Cancer. Current Oncology, 29(6), 3894-3910. https://doi.org/10.3390/curroncol29060311