Brain Metastases among Cancer Patients Diagnosed from 2010–2017 in Canada: Incidence Proportion at Diagnosis and Estimated Lifetime Incidence


Abstract
1. Introduction
2. Materials and Methods
2.1. Data Source
2.2. Study Population
2.3. Inclusion/Exclusion Criteria
2.4. Cancer Selection and Classification
2.5. Data Analysis
2.6. Estimation of Concurrent BM
2.7. Estimation of Expected Lifetime BM
3. Results
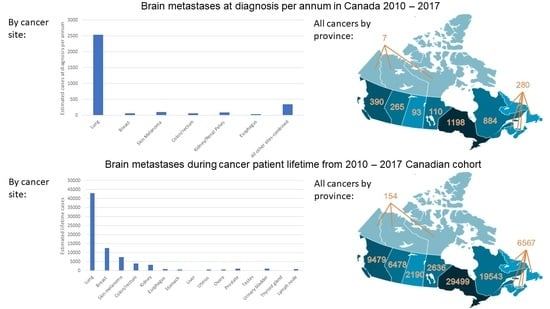
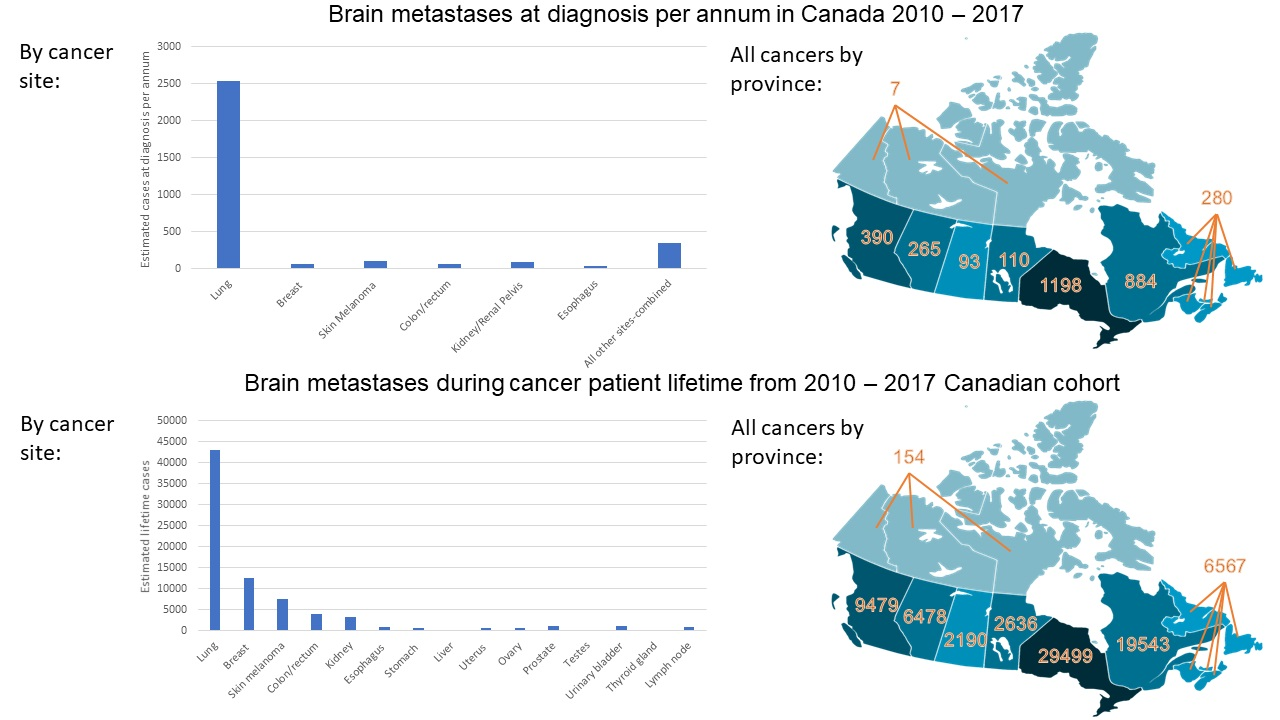
3.1. Concurrent BM
3.2. Lifetime BM
4. Discussion
5. Conclusions
Author Contributions
Funding
Institutional Review Board Statement
Informed Consent Statement
Data Availability Statement
Acknowledgments
Conflicts of Interest
Appendix A

| Cancer | ICD-O-3(Site/Type) |
|---|---|
| Lung | C340-C343, C348–349 |
| Breast | C500-C506, C508–509 |
| Skin melanoma | C440-C449 |
| Colorectal | C180-C189, C199, C209 |
| Kidney/Renal pelvis | C649, C659 |
| Esophagus | C150-C155, C158, C159 |
| Stomach | C160-C166, C168-C169 |
| Liver | C220 |
| Uterus | C540-C543, C548-C549, C559 |
| Ovary | C569 |
| Prostate | C619 |
| Testes | C620-C621, C629 |
| Urinary bladder | C670-C679 |
| Thyroid | C739 |
| Non-Hodgkin lymphoma | 9590–9597, 9670–9719, 9724–9729, 9735, 9737, 9738 9811–9818, 9823, 9827, 9837 all sites except C42.0,.1,.4 |
| Lung: NSCLC | Adenocarcinoma: 8140, 8211, 8230– 8231, 8250–8260, 8323, 8480–8490, 8550–8551, 8570–8574, 8576 Squamous cell carcinoma: 8050–8078 and 8083–8084 Large cell lung carcinoma: 8010–8012, 8014–8031, 8035, 8046, 8310. |
| Lung: SCLC | 8041–8045 |
| Breast: ER−, PR−, HER2− | Collaborative stage site-specific factor 16: 000 |
| Breast: HER2+ | Collaborative stage site-specific factor 16: 001, 101,011, and 111 |
| Breast: ER+, PR+, HER2− | Collaborative stage site-specific factor 16: 110. |
| Authors, Year | Country/Region | Study Time Period | Study Population | Primary Site | Median (IQR) Duration to BM Onset (Months) | IPL (%) |
|---|---|---|---|---|---|---|
| Barnholtz-Sloan et al., 2004 [5] | Detroit, Michigan, USA | 1973–2001 | Patients diagnosed with primary cancer, population-based study with chart review | Lung | ns | 19.92 |
| Breast | ns | 5.08 | ||||
| Melanoma | ns | 6.88 | ||||
| Colorectal | ns | 1.82 | ||||
| Kidney | ns | 6.48 | ||||
| Habbous et al., 2020 [8] | Ontario, Canada | 2010–2019 | Adult Ontario residents with valid health card number diagnosed with primary cancer within the Ontario Cancer Registry | Esophagus | 5.9 (1.1, 13.7) | 5.19 |
| Liver | 12.8 (1.1, 29.4) | 1.02 | ||||
| Non-Hodgkin lymphoma | Nodal: 7.8 (3.5, 13.6) Extranodal: 6.7 (2.2, 13.6) | 1.86 | ||||
| Ovary | 20.5 (13.0, 40.5) | 2.06 | ||||
| Prostate | 21.6 (7.2, 44.8) | 0.66 | ||||
| Testes | 5.6 (1.5, 9.0) | 1.30 | ||||
| Thyroid | 18.1 (5.3, 40.6) | 0.48 | ||||
| Urinary Bladder | 11.0 (4.6, 20.2) | 1.35 | ||||
| Uterus | 14.9 (6.5, 32.3) | 1.30 | ||||
| Stomach | 8.8 (1.3, 19.0) | 2.14 | ||||
| Gonclaves et al., 2016 [15] | Detroit, Michigan, USA | 1973–2011 | Patients diagnosed with nonmetastatic first primary lung cancer in the Metropolitan Detroit Surveillance, Epidemiology, and End Results (SEER) registry | Lung, SCLC | ns | 17.94 |
| Lung, NSCLC | ns | 8.91 | ||||
| Arvold et al., 2012 [16] | Boston, Massachusetts, USA | 1997–2006 | Women with clinical stage I or II invasive breast cancer who received breast conserving therapy | Breast, ER− PR− HER2− | 37.1 (8.9, 58.7) | 5.85 |
| Breast, HER2+ | Luminal-HER2: 55.0 (24.3–102.8) HER2: 34.5 (18.9–107.6) | 5.63 | ||||
| Breast, ER+ PR+ HER2− | Luminal A: 65.7 (27.4–76.7) Luminal B: 63.7 (7.6–106.1) | 1.54 |
| Number of Cases | Cancer Sites | Region/Province | ||||||||
|---|---|---|---|---|---|---|---|---|---|---|
| Eastern Provinces | Quebec * | Ontario | Manitoba | Saskatchewan | Alberta | British Columbia | Territories | Total | ||
| Concurrent BM | Lung | 225 | 735 | 907 | 86 | 74 | 202 | 302 | 6 | 2536 |
| Breast | 5 | 16 | 26 | 2 | 2 | 6 | 8 | 0 | 65 | |
| Skin melanoma | 9 | 11 | 52 | 3 | 2 | 9 | 13 | 0 | 99 | |
| Colorectal | 6 | 14 | 22 | 3 | 2 | 5 | 7 | 0 | 59 | |
| Kidney/Renal Pelvis | 8 | 20 | 31 | 3 | 3 | 8 | 10 | 0 | 83 | |
| Esophagus | 3 | 7 | 14 | 1 | 1 | 3 | 5 | 0 | 34 | |
| All other sites | 25 | 82 | 146 | 12 | 10 | 33 | 44 | 1 | 352 | |
| Total | 280 | 884 | 1198 | 110 | 93 | 265 | 390 | 7 | 3227 | |
| Total Primary Cancers | Lung | 2384 | 7803 | 9625 | 911 | 784 | 2141 | 3209 | 60 | 26,917 |
| Breast | 2258 | 7485 | 12,222 | 994 | 858 | 2901 | 4041 | 59 | 30,818 | |
| Skin melanoma | 1191 | 1450 | 7106 | 459 | 285 | 1189 | 1842 | 11 | 13,533 | |
| Colorectal | 2503 | 6548 | 9898 | 1208 | 969 | 2326 | 3311 | 64 | 26,825 | |
| Kidney/Renal Pelvis | 629 | 1481 | 2358 | 254 | 210 | 584 | 718 | 14 | 6249 | |
| Esophagus | 178 | 420 | 907 | 68 | 56 | 193 | 311 | 6 | 2137 | |
| All other sites | 8136 | 26,483 | 47,078 | 3865 | 3069 | 10,520 | 14,109 | 178 | 113,435 | |
| Total | 17,278 | 51,671 | 89,192 | 7760 | 6230 | 19,853 | 27,540 | 392 | 219,915 | |
| Number of Cases | Cancer Sites | Region/Province | ||||||||
|---|---|---|---|---|---|---|---|---|---|---|
| Eastern Provinces | Quebec * | Ontario | Manitoba | Saskatchewan | Alberta | British Columbia | Territories | Total | ||
| Lifetime BM | Lung | 3799 | 12,435 | 15,338 | 1451 | 1250 | 3412 | 5113 | 96 | 42,895 |
| Breast | 918 | 3042 | 4967 | 404 | 349 | 1179 | 1642 | 24 | 12,524 | |
| Skin melanoma | 656 | 798 | 3911 | 253 | 157 | 654 | 1014 | 6 | 7449 | |
| Colorectal | 364 | 954 | 1441 | 176 | 141 | 339 | 482 | 9 | 3906 | |
| Kidney | 326 | 768 | 1222 | 132 | 109 | 303 | 372 | 7 | 3239 | |
| Esophagus | 74 | 174 | 377 | 28 | 23 | 80 | 129 | 2 | 887 | |
| Stomach | 53 | 150 | 300 | 24 | 20 | 51 | 77 | 1 | 675 | |
| Liver | 10 | 36 | 78 | 5 | 4 | 18 | 33 | 0 | 184 | |
| Uterus | 48 | 136 | 267 | 27 | 18 | 60 | 80 | 1 | 637 | |
| Ovary | 39 | 144 | 200 | 20 | 17 | 46 | 74 | 1 | 541 | |
| Prostate | 96 | 238 | 451 | 37 | 36 | 122 | 160 | 2 | 1142 | |
| Testes | 7 | 23 | 47 | 4 | 4 | 15 | 16 | 0 | 116 | |
| Urinary bladder | 88 | 304 | 435 | 35 | 33 | 96 | 148 | 1 | 1139 | |
| Thyroid gland | 15 | 50 | 119 | 6 | 4 | 19 | 17 | 0 | 229 | |
| Non-Hodgkin lymphoma | 75 | 290 | 346 | 35 | 26 | 86 | 122 | 2 | 982 | |
| Total of 15 sites | 6567 | 19,543 | 29,499 | 2636 | 2190 | 6478 | 9479 | 154 | 76,546 | |
| Total Primary Cancers | Lung | 19,070 | 62,425 | 77,000 | 7285 | 6275 | 17,130 | 25,670 | 480 | 215,335 |
| Breast | 18,065 | 59,880 | 97,775 | 7955 | 6865 | 23,205 | 32,325 | 475 | 246,545 | |
| Skin melanoma | 9530 | 11,600 | 56,845 | 3675 | 2280 | 9510 | 14,735 | 90 | 108,265 | |
| Colorectal | 20,020 | 52,395 | 79,180 | 9665 | 7755 | 18,605 | 26,485 | 510 | 214,615 | |
| Kidney | 5035 | 11,845 | 18,865 | 2035 | 1680 | 4675 | 5745 | 110 | 49,990 | |
| Esophagus | 1425 | 3360 | 7255 | 540 | 445 | 1540 | 2485 | 45 | 17,095 | |
| Stomach | 2460 | 7010 | 14,020 | 1105 | 930 | 2365 | 3580 | 65 | 31,535 | |
| Liver | 985 | 3525 | 7680 | 500 | 375 | 1745 | 3220 | 40 | 18,070 | |
| Uterus | 3715 | 10,495 | 20,530 | 2095 | 1370 | 4600 | 6145 | 75 | 49,025 | |
| Ovary | 1905 | 7010 | 9695 | 985 | 815 | 2215 | 3585 | 40 | 26,250 | |
| Prostate | 14,515 | 36,110 | 68,400 | 5550 | 5445 | 18,415 | 24,295 | 260 | 172,990 | |
| Testes | 520 | 1805 | 3595 | 340 | 280 | 1150 | 1205 | 35 | 8930 | |
| Urinary bladder | 6495 | 22,500 | 32,200 | 2590 | 2455 | 7095 | 10,955 | 100 | 84,390 | |
| Thyroid gland | 3090 | 10,410 | 24,750 | 1180 | 820 | 4010 | 3480 | 55 | 47,795 | |
| Non-Hodgkin lymphoma | 4055 | 15,575 | 18,620 | 1860 | 1415 | 4615 | 6565 | 85 | 52,790 | |
| Total of 15 sites | 110,885 | 315,945 | 536,410 | 47,360 | 39,205 | 120,875 | 170,475 | 2465 | 1,343,620 | |
References
- Chamberlain, M.C.; Baik, C.S.; Gadi, V.K.; Bhatia, S.; Chow, L.Q.M. Systemic Therapy of Brain Metastases: Non–Small Cell Lung Cancer, Breast Cancer, and Melanoma. Neuro-Oncology 2017, 19, i1–i24. [Google Scholar] [CrossRef] [PubMed]
- Saria, M.; Piccioni, D.; Carter, J.; Orosco, H.; Turpin, T.; Kesari, S. Current Perspectives in the Management of Brain Metastases. Clin. J. Oncol. Nurs. 2015, 19, 475–478. [Google Scholar] [CrossRef] [PubMed][Green Version]
- Fox, B.D.; Cheung, V.J.; Patel, A.J.; Suki, D.; Rao, G. Epidemiology of Metastatic Brain Tumors. Neurosurg. Clin. North Am. 2011, 22, 1–6. [Google Scholar] [CrossRef] [PubMed]
- Davis, F.G.; Dolecek, T.A.; McCarthy, B.J.; Villano, J.L. Toward Determining the Lifetime Occurrence of Metastatic Brain Tumors Estimated from 2007 United States Cancer Incidence Data. Neuro-Oncology 2012, 14, 1171–1177. [Google Scholar] [CrossRef]
- Barnholtz-Sloan, J.S.; Sloan, A.E.; Davis, F.G.; Vigneau, F.D.; Lai, P.; Sawaya, R.E. Incidence Proportions of Brain Metastases in Patients Diagnosed (1973 to 2001) in the Metropolitan Detroit Cancer Surveillance System. J. Clin. Oncol. 2004, 22, 2865–2872. [Google Scholar] [CrossRef]
- Smedby, K.E.; Brandt, L.; Bäcklund, M.L.; Blomqvist, P. Brain Metastases Admissions in Sweden between 1987 and 2006. Br. J. Cancer 2009, 101, 1919–1924. [Google Scholar] [CrossRef]
- Villano, J.L.; Durbin, E.B.; Normandeau, C.; Thakkar, J.P.; Moirangthem, V.; Davis, F.G. Incidence of Brain Metastasis at Initial Presentation of Lung Cancer. Neuro-oncology 2015, 17, 122–128. [Google Scholar] [CrossRef]
- Habbous, S.; Forster, K.; Darling, G.; Jerzak, K.; Holloway, C.M.B.; Sahgal, A.; Das, S. Incidence and Real-World Burden of Brain Metastases from Solid Tumors and Hematologic Malignancies in Ontario: A Population-Based Study. Neuro-Oncol. Adv. 2021, 3, vdaa178. [Google Scholar] [CrossRef]
- Kromer, C.; Xu, J.; Ostrom, Q.T.; Gittleman, H.; Kruchko, C.; Sawaya, R.; Barnholtz-Sloan, J.S. Estimating the Annual Frequency of Synchronous Brain Metastasis in the United States 2010–2013: A Population-Based Study. J. Neurooncol. 2017, 134, 55–64. [Google Scholar] [CrossRef]
- Berghoff, A.S.; Schur, S.; Füreder, L.M.; Gatterbauer, B.; Dieckmann, K.; Widhalm, G.; Hainfellner, J.; Zielinski, C.C.; Birner, P.; Bartsch, R.; et al. Descriptive Statistical Analysis of a Real Life Cohort of 2419 Patients with Brain Metastases of Solid Cancers. ESMO Open 2016, 1, e000024. [Google Scholar] [CrossRef]
- Soffietti, R.; Abacioglu, U.; Baumert, B.; Combs, S.E.; Kinhult, S.; Kros, J.M.; Marosi, C.; Metellus, P.; Radbruch, A.; Villa Freixa, S.S.; et al. Diagnosis and Treatment of Brain Metastases from Solid Tumors: Guidelines from the European Association of Neuro-Oncology (EANO). Neuro-Oncology 2017, 19, 162–174. [Google Scholar] [CrossRef] [PubMed]
- Klos, K.J.; O’Neill, B.P. Brain Metastases. Neurologist 2004, 10, 31–46. [Google Scholar] [CrossRef] [PubMed]
- Lowery, F.J.; Yu, D. Brain Metastasis: Unique Challenges and Open Opportunities. Biochim. Biophys. Acta (BBA)—Rev. Cancer 2017, 1867, 49–57. [Google Scholar] [CrossRef]
- Government of Canada, S.C. Canadian Cancer Registry (CCR). Available online: https://www23.statcan.gc.ca/imdb/p2SV.pl?Function=getSurvey&SDDS=3207 (accessed on 1 February 2022).
- Goncalves, P.H.; Peterson, S.L.; Vigneau, F.D.; Shore, R.D.; Quarshie, W.O.; Islam, K.; Schwartz, A.G.; Wozniak, A.J.; Gadgeel, S.M. Risk of Brain Metastases in Patients with Nonmetastatic Lung Cancer: Analysis of the Metropolitan Detroit Surveillance, Epidemiology, and End Results (SEER) Data. Cancer 2016, 122, 1921–1927. [Google Scholar] [CrossRef] [PubMed]
- Arvold, N.D.; Oh, K.S.; Niemierko, A.; Taghian, A.G.; Lin, N.U.; Abi-Raad, R.F.; Sreedhara, M.; Harris, J.R.; Alexander, B.M. Brain Metastases after Breast-Conserving Therapy and Systemic Therapy: Incidence and Characteristics by Biologic Subtype. Breast Cancer Res. Treat. 2012, 136, 153–160. [Google Scholar] [CrossRef]
- Canadian Cancer Statistics 2018; Canadian Cancer Statistics Advisory Committee in collaboration with the Canadian Cancer Society, Statistics Canada and the Public Health Agency of Canada. 2018. Available online: https://www150.statcan.gc.ca/n1/daily-quotidien/180612/dq180612e-eng.htm (accessed on 16 March 2022).
- Schouten, L.J.; Rutten, J.; Huveneers, H.A.M.; Twijnstra, A. Incidence of Brain Metastases in a Cohort of Patients with Carcinoma of the Breast, Colon, Kidney, and Lung and Melanoma. Cancer 2002, 94, 2698–2705. [Google Scholar] [CrossRef]
- Canadian Cancer Statistics 2021; Canadian Cancer Statistics Advisory Committee in collaboration with the Canadian Cancer Society, Statistics Canada and the Public Health Agency of Canada. 2021. Available online: https://www.canada.ca/en/public-health/services/reports-publications/health-promotion-chronic-disease-prevention-canada-research-policy-practice/vol-41-no-11-2021/canadian-cancer-statistics-2021.html (accessed on 16 March 2022).
- Bryan, S.; Masoud, H.; Weir, H.K.; Woods, R.; Lockwood, G.; Smith, L.; Brierley, J.; Gospodarowicz, M.; Badets, N. Cancer in Canada: Stage at Diagnosis. Health Rep. 2018, 29, 21–25. [Google Scholar]
- Cagney, D.N.; Martin, A.M.; Catalano, P.J.; Redig, A.J.; Lin, N.U.; Lee, E.Q.; Wen, P.Y.; Dunn, I.F.; Bi, W.L.; Weiss, S.E.; et al. Incidence and Prognosis of Patients with Brain Metastases at Diagnosis of Systemic Malignancy: A Population-Based Study. Neuro-Oncology 2017, 19, 1511–1521. [Google Scholar] [CrossRef]
- Tabouret, E.; Chinot, O.; Metellus, P.; Tallet, A.; Viens, P.; Gonçalves, A. Recent Trends in Epidemiology of Brain Metastases: An Overview. Anticancer Res. 2012, 32, 4655–4662. [Google Scholar]
- Frisk, G.; Svensson, T.; Bäcklund, L.M.; Lidbrink, E.; Blomqvist, P.; Smedby, K.E. Incidence and Time Trends of Brain Metastases Admissions among Breast Cancer Patients in Sweden. Br. J. Cancer 2012, 106, 1850–1853. [Google Scholar] [CrossRef]
- Lin, N.U.; Bellon, J.R.; Winer, E.P. CNS Metastases in Breast Cancer. J. Clin. Oncol. 2004, 22, 3608–3617. [Google Scholar] [CrossRef] [PubMed]
- Mittendorf, E.A.; Philips, A.V.; Meric-Bernstam, F.; Qiao, N.; Wu, Y.; Harrington, S.; Su, X.; Wang, Y.; Gonzalez-Angulo, A.M.; Akcakanat, A.; et al. PD-L1 Expression in Triple-Negative Breast Cancer. Cancer Immunol. Res. 2014, 2, 361–370. [Google Scholar] [CrossRef] [PubMed]
- Berghoff, A.S.; Preusser, M. New Developments in Brain Metastases. Ther. Adv. Neurol. Disord 2018, 11, 1756286418785502. [Google Scholar] [CrossRef] [PubMed]
- Kim, Y.-J.; Kim, J.-S.; Kim, I.A. Molecular Subtype Predicts Incidence and Prognosis of Brain Metastasis from Breast Cancer in SEER Database. J. Cancer Res. Clin. Oncol. 2018, 144, 1803–1816. [Google Scholar] [CrossRef] [PubMed]
- Hicks, D.G.; Short, S.M.; Prescott, N.L.; Tarr, S.M.; Coleman, K.A.; Yoder, B.J.; Crowe, J.P.; Choueiri, T.K.; Dawson, A.E.; Budd, G.T.; et al. Breast Cancers with Brain Metastases Are More Likely to Be Estrogen Receptor Negative, Express the Basal Cytokeratin CK5/6, and Overexpress HER2 or EGFR. Am. J. Surg. Pathol. 2006, 30, 1097–1104. [Google Scholar] [CrossRef] [PubMed]
- Ernst, D.S.; Petrella, T.; Joshua, A.M.; Hamou, A.; Thabane, M.; Vantyghem, S.; Gwadry-Sridhar, F. Burden of Illness for Metastatic Melanoma in Canada, 2011-2013. Curr. Oncol. 2016, 23, e563–e570. [Google Scholar] [CrossRef]
- Davies, H.; Bignell, G.R.; Cox, C.; Stephens, P.; Edkins, S.; Clegg, S.; Teague, J.; Woffendin, H.; Garnett, M.J.; Bottomley, W.; et al. Mutations of the BRAF Gene in Human Cancer. Nature 2002, 417, 949–954. [Google Scholar] [CrossRef]
- Haueis, S.A.; Kränzlin, P.; Mangana, J.; Cheng, P.F.; Urosevic-Maiwald, M.; Braun, R.P.; Levesque, M.P.; Dummer, R.; Goldinger, S.M. Does the Distribution Pattern of Brain Metastases during BRAF Inhibitor Therapy Reflect Phenotype Switching? Melanoma Res. 2017, 27, 231–237. [Google Scholar] [CrossRef]
- Imafuku, K.; Yoshino, K.; Yamaguchi, K.; Tsuboi, S.; Ohara, K.; Hata, H. Sudden Onset of Brain Metastasis despite the Use of Vemurafenib for Another Metastatic Lesion in Malignant Melanoma Patients. Case Rep. Oncol. 2017, 10, 290–295. [Google Scholar] [CrossRef]
- Ma, Y.; Wang, Q.; Dong, Q.; Zhan, L.; Zhang, J. How to Differentiate Pseudoprogression from True Progression in Cancer Patients Treated with Immunotherapy. Am. J. Cancer Res. 2019, 9, 1546–1553. [Google Scholar]
- Walker, E.V.; Davis, F.G. CBTR founding affiliates Malignant Primary Brain and Other Central Nervous System Tumors Diagnosed in Canada from 2009 to 2013. Neuro-Oncology 2019, 21, 360–369. [Google Scholar] [CrossRef] [PubMed]
- Zakaria, D. An Examination of the NAACCR Method of Assessing Completeness of Case Ascertainment Using the Canadian Cancer Registry. Health Rep. 2013, 24, 3–13. [Google Scholar] [PubMed]
| Cancer Site | Sub-Category/Histology | Number of Primary Cases * | IPc (%) | Brain Metastasis at Diagnosis | |||||
|---|---|---|---|---|---|---|---|---|---|
| Missing | % | No | % | Yes | % | ||||
| Lung | All | 160,525 | 10.40 | 24,805 | 15.45 | 121,600 | 75.75 | 14,120 | 8.80 |
| NSCLC | 104,770 | 9.37 | 11,630 | 11.10 | 84,080 | 80.25 | 9060 | 8.65 | |
| SCLC | 16,620 | 13.39 | 1725 | 10.38 | 12,900 | 77.62 | 1995 | 12.00 | |
| Breast | All | 193,970 | 0.24 | 29,485 | 15.20 | 164,085 | 84.59 | 400 | 0.21 |
| ER− PR− HER2− | 12,945 | 0.50 | 70 | 0.54 | 12,810 | 98.96 | 65 | 0.50 | |
| HER2+ | 19,325 | 0.49 | 115 | 0.60 | 19,115 | 98.91 | 95 | 0.49 | |
| ER+ PR+ HER2− | 86,185 | 0.10 | 570 | 0.66 | 85,530 | 99.24 | 85 | 0.10 | |
| Skin melanoma | 98,080 | 0.28 | 69,145 | 70.50 | 28,665 | 29.23 | 270 | 0.28 | |
| Colorectal | 168,610 | 0.20 | 34,120 | 20.24 | 134,150 | 79.56 | 340 | 0.20 | |
| Kidney/Renal Pelvis | 39,590 | 0.39 | 27,905 | 70.48 | 11,530 | 29.12 | 155 | 0.39 | |
| Esophagus | 14,145 | 0.39 | 10,665 | 75.40 | 3425 | 24.21 | 55 | 0.39 | |
| All other sites | 721,470 | 0.09 | 453,760 | 62.89 | 267,070 | 37.02 | 640 | 0.09 | |
| Total | 1,396,390 | 2.14 | 649,885 | 46.54 | 730,525 | 52.32 | 15,980 | 1.14 | |
| Province/Territories | Lung (%) | Breast (%) | Skin Melanoma (%) | Colorectal (%) | Kidney/Renal Pelvis (%) | Esophagus (%) | All other Sites-Combined (%) |
|---|---|---|---|---|---|---|---|
| Alberta | 0.00 | 0.00 | 0.00 | 0.00 | 0.00 | 0.00 | 0.00 |
| British Columbia | 15.82 | 3.06 | 100.00 | 25.62 | 100.00 | 100.00 | 80.76 |
| Manitoba | 2.54 | 1.19 | 8.84 | 2.38 | 4.91 | 1.85 | 26.33 |
| New Brunswick | 6.02 | 1.18 | 100.00 | 5.77 | 100.00 | 100.00 | 75.23 |
| Newfoundland and Labrador | 2.99 | 1.23 | 10.15 | 17.21 | 2.59 | 18.18 | 23.03 |
| Nova Scotia | 2.47 | 2.04 | 4.00 | 3.89 | 2.18 | 2.24 | 25.38 |
| Ontario | 15.41 | 21.08 | 86.88 | 23.71 | 100.00 | 100.00 | 78.34 |
| Prince Edward Island | 7.34 | 3.07 | 3.68 | 4.63 | 4.17 | 15.00 | 23.97 |
| Quebec | 100.00 | 100.00 | 100.00 | 100.00 | 100.00 | 100.00 | 100.00 |
| Saskatchewan | 4.22 | 2.04 | 7.89 | 3.03 | 2.68 | 3.37 | 25.66 |
| Territories | 10.42 | 8.42 | 55.56 | 11.76 | 45.45 | 66.67 | 50.35 |
| Cancer Site | Sub-Category/Histology | Total Number of Primary Cancer Cases ** | IPR from Selected Provinces (95%CI) | Estimated Concurrent BM Incidence Cases from IPR | Average Annual Estimates of Concurrent BM |
|---|---|---|---|---|---|
| Lung | All | 215,335 | 9.42 (9.16–9.68) 1 | 20,285 | 2536 |
| NSCLC | 136,725 | 9.55 (9.34–9.76) 2 | 13,057 | 1632 | |
| SCLC | 22,270 | 13.21 (12.62–13.80) 3 | 2921 | 365 | |
| Breast | All | 246,545 | 0.21 (0.17–0.24) 4 | 518 | 65 |
| ER− PR− HER2− * | 12,945 | 0.50 (0.38–0.62) 5 | 65 | 8 | |
| HER2+ * | 19,325 | 0.49 (0.39–0.59) 5 | 95 | 12 | |
| ER+ PR+ HER2− * | 86,185 | 0.10 (0.08–0.12) 5 | 86 | 11 | |
| Skin melanoma | 108,265 | 0.73 (0.61–0.84) 6 | 790 | 99 | |
| Colorectal | 214,615 | 0.22 (0.18–0.26) 7 | 472 | 59 | |
| Kidney/Renal Pelvis | 49,984 | 1.33 (1.12–1.54) 8 | 665 | 83 | |
| Esophagus | 17,110 | 1.58 (1.15–2.02) 9 | 270 | 34 | |
| All other sites-combined | 907,505 | 0.31 (0.28–0.34) 10 | 2813 | 352 | |
| Total (from all sites) | 1,759,360 | 1.47 | 25,813 | 3227 | |
| Cancer Site | Sub-Category/Histology | Total Number of Primary Cancer Cases ** | IPL (Table A2) | Estimated Lifetime BM Incidence Cases From IPL |
|---|---|---|---|---|
| Lung | All | 215,335 | 19.92 | 42,895 |
| NSCLC | 136,725 | 8.91 | 12,262 | |
| SCLC | 22,270 | 17.95 | 3997 | |
| Breast | All | 246,545 | 5.08 | 12,524 |
| ER− PR− HER2− * | 12,945 | 5.85 | 757 | |
| HER2+ * | 19,325 | 5.63 | 1088 | |
| ER+ PR+ HER2− * | 86,185 | 1.54 | 1327 | |
| Skin melanoma | 108,265 | 6.88 | 7449 | |
| Colorectal | 214,615 | 1.82 | 3906 | |
| Kidney | 49,984 | 6.48 | 3239 | |
| Esophagus | 17,110 | 5.19 | 887 | |
| Stomach | 31,535 | 2.14 | 675 | |
| Liver | 18,070 | 1.02 | 184 | |
| Uterus | 49,025 | 1.30 | 637 | |
| Ovary | 26,250 | 2.06 | 541 | |
| Prostate | 172,990 | 0.66 | 1142 | |
| Testes | 8930 | 1.30 | 116 | |
| Urinary bladder | 84,390 | 1.35 | 1139 | |
| Thyroid gland | 47,795 | 0.48 | 229 | |
| Non-Hodgkin lymphoma | 52,790 | 1.86 | 982 | |
| Total of 15 sites | 1,343,620 | 5.70 | 76,546 | |
Publisher’s Note: MDPI stays neutral with regard to jurisdictional claims in published maps and institutional affiliations. |
© 2022 by the authors. Licensee MDPI, Basel, Switzerland. This article is an open access article distributed under the terms and conditions of the Creative Commons Attribution (CC BY) license (https://creativecommons.org/licenses/by/4.0/).
Share and Cite
Liu, J.L.; Walker, E.V.; Paudel, Y.R.; Davis, F.G.; Yuan, Y. Brain Metastases among Cancer Patients Diagnosed from 2010–2017 in Canada: Incidence Proportion at Diagnosis and Estimated Lifetime Incidence. Curr. Oncol. 2022, 29, 2091-2105. https://doi.org/10.3390/curroncol29030169
Liu JL, Walker EV, Paudel YR, Davis FG, Yuan Y. Brain Metastases among Cancer Patients Diagnosed from 2010–2017 in Canada: Incidence Proportion at Diagnosis and Estimated Lifetime Incidence. Current Oncology. 2022; 29(3):2091-2105. https://doi.org/10.3390/curroncol29030169
Chicago/Turabian StyleLiu, Jiaqi L., Emily V. Walker, Yuba Raj Paudel, Faith G. Davis, and Yan Yuan. 2022. "Brain Metastases among Cancer Patients Diagnosed from 2010–2017 in Canada: Incidence Proportion at Diagnosis and Estimated Lifetime Incidence" Current Oncology 29, no. 3: 2091-2105. https://doi.org/10.3390/curroncol29030169
APA StyleLiu, J. L., Walker, E. V., Paudel, Y. R., Davis, F. G., & Yuan, Y. (2022). Brain Metastases among Cancer Patients Diagnosed from 2010–2017 in Canada: Incidence Proportion at Diagnosis and Estimated Lifetime Incidence. Current Oncology, 29(3), 2091-2105. https://doi.org/10.3390/curroncol29030169