Application of Intravoxel Incoherent Motion in the Evaluation of Hepatocellular Carcinoma after Transarterial Chemoembolization

 , ,
, ,
Abstract
1. Introduction
2. Materials and Methods
2.1. Patient Demographics
2.2. MR Examinations
2.3. TACE Treatment
2.4. Reference Standard
2.5. Postprocessing IVIM Images
2.6. Statistical Analyses
3. Results
3.1. Intraclass Correlation Coefficients (ICCs) between the Two Readers
3.2. Differences in IVIM Parameters between the Three Tissues
3.3. Parametric Diagnostic Capabilities among Different Tissues
4. Discussion
5. Conclusions
Author Contributions
Funding
Institutional Review Board Statement
Informed Consent Statement
Data Availability Statement
Acknowledgments
Conflicts of Interest
References
- Global Burden of Disease Liver Cancer Collaboration; Akinyemiju, T.; Abera, S.; Ahmed, M.; Alam, N.; Alemayohu, M.A.; Allen, C.; Al-Raddadi, R.; Alvis-Guzman, N.; Amoako, Y. The Burden of Primary Liver Cancer and Underlying Etiologies From 1990 to 2015 at the Global, Regional, and National Level: Results From the Global Burden of Disease Study 2015. JAMA Oncol. 2017, 3, 1683–1691. [Google Scholar] [CrossRef] [PubMed]
- Cha, C.; Fong, Y.; Jarnagin, W.R.; Blumgart, L.H.; DeMatteo, R.P. Predictors and Patterns of Recurrence after Resection of Hepatocellular Carcinoma. J. Am. Coll. Surg. 2003, 197, 753–758. [Google Scholar] [CrossRef] [PubMed]
- Kumar, A.M.; Fredman, E.T.; Coppa, C.; El-Gazzaz, G.; Aucejo, F.N.; Abdel-Wahab, M. Patterns of Cancer Recurrence in Localized Resected Hepatocellular Carcinoma. Hepatobiliary Pancreat Dis. Int. 2015, 14, 269–275. [Google Scholar] [CrossRef]
- Tabrizian, P.; Jibara, G.; Shrager, B.; Schwartz, M.; Roayaie, S. Recurrence of Hepatocellular Cancer after Resection: Patterns, Treatments, and Prognosis. Ann. Surg. 2015, 261, 947–955. [Google Scholar] [CrossRef]
- Allemani, C.; Matsuda, T.; Di Carlo, V.; Harewood, R.; Matz, M.; Niksic, M.; Bonaventure, A.; Valkov, M.; Johnson, C.J.; Esteve, J.; et al. Global Surveillance of Trends in Cancer Survival 2000-14 (CONCORD-3): Analysis of individual records for 37 513 025 patients diagnosed with one of 18 cancers from 322 population-based registries in 71 countries. Lancet 2018, 391, 1023–1075. [Google Scholar] [CrossRef]
- Llovet, J.M.; Bruix, J. Systematic review of randomized trials for unresectable hepatocellular carcinoma: Chemoembolization improves survival. Hepatology 2003, 37, 429–442. [Google Scholar] [CrossRef]
- Ronot, M.; Cauchy, F.; Gregoli, B.; Breguet, R.; Allaham, W.; Paradis, V.; Soubrane, O.; Vilgrain, V. Sequential transarterial chemoembolization and portal vein embolization before resection is a valid oncological strategy for unilobar hepatocellular carcinoma regardless of the tumor burden. HPB 2016, 18, 684–690. [Google Scholar] [CrossRef]
- Breunig, I.M.; Shaya, F.T.; Hanna, N.; Seal, B.; Chirikov, V.V.; Daniel Mullins, C. Transarterial chemoembolization treatment: Association between multiple treatments, cumulative expenditures, and survival. Value Health 2013, 16, 760–768. [Google Scholar] [CrossRef]
- Le Bihan, D.; Breton, E.; Lallemand, D.; Aubin, M.L.; Vignaud, J.; Laval-Jeantet, M. Separation of diffusion and perfusion in intravoxel incoherent motion MR imaging. Radiology 1988, 168, 497–505. [Google Scholar] [CrossRef]
- He, N.; Li, Z.; Li, X.; Dai, W.; Peng, C.; Wu, Y.; Huang, H.; Liang, J. Intravoxel Incoherent Motion Diffusion-Weighted Imaging Used to Detect Prostate Cancer and Stratify Tumor Grade: A Meta-Analysis. Front. Oncol. 2020, 10, 1623. [Google Scholar] [CrossRef]
- Liu, C.; Liang, C.; Liu, Z.; Zhang, S.; Huang, B. Intravoxel incoherent motion (IVIM) in evaluation of breast lesions: Comparison with conventional DWI. Eur. J. Radiol. 2013, 82, e782–e789. [Google Scholar] [CrossRef] [PubMed]
- Liang, J.; Zeng, S.; Li, Z.; Kong, Y.; Meng, T.; Zhou, C.; Chen, J.; Wu, Y.; He, N. Intravoxel Incoherent Motion Diffusion-Weighted Imaging for Quantitative Differentiation of Breast Tumors: A Meta-Analysis. Front. Oncol. 2020, 10, 585486. [Google Scholar] [CrossRef] [PubMed]
- Ichikawa, S.; Motosugi, U.; Ichikawa, T.; Sano, K.; Morisaka, H.; Araki, T. Intravoxel incoherent motion imaging of focal hepatic lesions. J. Magn. Reson. Imaging 2013, 37, 1371–1376. [Google Scholar] [CrossRef] [PubMed]
- Luo, M.; Zhang, L.; Jiang, X.H.; Zhang, W.D. Intravoxel Incoherent Motion Diffusion-weighted Imaging: Evaluation of the Differentiation of Solid Hepatic Lesions. Transl. Oncol. 2017, 10, 831–838. [Google Scholar] [CrossRef]
- Woo, S.; Lee, J.M.; Yoon, J.H.; Joo, I.; Han, J.K.; Choi, B.I. Intravoxel incoherent motion diffusion-weighted MR imaging of hepatocellular carcinoma: Correlation with enhancement degree and histologic grade. Radiology 2014, 270, 758–767. [Google Scholar] [CrossRef]
- Department of Medical Administration, National Health Commission of the People’s Republic of China. Guidelines for diagnosis and treatment of primary liver cancer in China (2019 edition). Zhonghua Gan Zang Bing Za Zhi 2020, 28, 112–128. [Google Scholar] [CrossRef]
- Chernyak, V.; Fowler, K.J.; Kamaya, A.; Kielar, A.Z.; Elsayes, K.M.; Bashir, M.R.; Kono, Y.; Do, R.K.; Mitchell, D.G.; Singal, A.G.; et al. Liver Imaging Reporting and Data System (LI-RADS) Version 2018: Imaging of Hepatocellular Carcinoma in At-Risk Patients. Radiology 2018, 289, 816–830. [Google Scholar] [CrossRef]
- Nolden, M.; Zelzer, S.; Seitel, A.; Wald, D.; Muller, M.; Franz, A.M.; Maleike, D.; Fangerau, M.; Baumhauer, M.; Maier-Hein, L.; et al. The Medical Imaging Interaction Toolkit: Challenges and advances: 10 years of open-source development. Int. J. Comput. Assist. Radiol. Surg. 2013, 8, 607–620. [Google Scholar] [CrossRef]
- Erstad, D.J.; Tanabe, K.K. Prognostic and Therapeutic Implications of Microvascular Invasion in Hepatocellular Carcinoma. Ann. Surg. Oncol. 2019, 26, 1474–1493. [Google Scholar] [CrossRef]
- Le Bihan, D.; Breton, E.; Lallemand, D.; Grenier, P.; Cabanis, E.; Laval-Jeantet, M. MR imaging of intravoxel incoherent motions: Application to diffusion and perfusion in neurologic disorders. Radiology 1986, 161, 401–407. [Google Scholar] [CrossRef]
- Park, Y.S.; Lee, C.H.; Kim, J.H.; Kim, I.S.; Kiefer, B.; Seo, T.S.; Kim, K.A.; Park, C.M. Using intravoxel incoherent motion (IVIM) MR imaging to predict lipiodol uptake in patients with hepatocellular carcinoma following transcatheter arterial chemoembolization: A preliminary result. Magn. Reson. Imaging 2014, 32, 638–646. [Google Scholar] [CrossRef] [PubMed]
- Shirota, N.; Saito, K.; Sugimoto, K.; Takara, K.; Moriyasu, F.; Tokuuye, K. Intravoxel incoherent motion MRI as a biomarker of sorafenib treatment for advanced hepatocellular carcinoma: A pilot study. Cancer Imaging 2016, 16, 1. [Google Scholar] [CrossRef] [PubMed]
- Lewin, M.; Fartoux, L.; Vignaud, A.; Arrive, L.; Menu, Y.; Rosmorduc, O. The diffusion-weighted imaging perfusion fraction f is a potential marker of sorafenib treatment in advanced hepatocellular carcinoma: A pilot study. Eur. Radiol. 2011, 21, 281–290. [Google Scholar] [CrossRef] [PubMed]
- Wu, L.; Xu, P.; Rao, S.; Yang, L.; Chen, C.; Liu, H.; Fu, C.; Zeng, M. ADCtotal ratio and D ratio derived from intravoxel incoherent motion early after TACE are independent predictors for survival in hepatocellular carcinoma. J. Magn. Reson. Imaging 2017, 46, 820–830. [Google Scholar] [CrossRef] [PubMed]
- Kim, S.W.; Joo, I.; Kim, H.C.; Ahn, S.J.; Kang, H.J.; Jeon, S.K.; Lee, J.M. LI-RADS treatment response categorization on gadoxetic acid-enhanced MRI: Diagnostic performance compared to mRECIST and added value of ancillary features. Eur. Radiol. 2020, 30, 2861–2870. [Google Scholar] [CrossRef]
- Bae, J.S.; Lee, J.M.; Yoon, J.H.; Kang, H.J.; Jeon, S.K.; Joo, I.; Lee, K.B.; Kim, H. Evaluation of LI-RADS Version 2018 Treatment Response Algorithm for Hepatocellular Carcinoma in Liver Transplant Candidates: Intraindividual Comparison between CT and Hepatobiliary Agent-enhanced MRI. Radiology 2021, 299, 336–345. [Google Scholar] [CrossRef]
- Yoon, J.; Lee, S.; Shin, J.; Kim, S.S.; Kim, G.M.; Won, J.Y. LI-RADS Version 2018 Treatment Response Algorithm: Diagnostic Performance after Transarterial Radioembolization for Hepatocellular Carcinoma. Korean J. Radiol. 2021, 22, 1279–1288. [Google Scholar] [CrossRef]
- Chaudhry, M.; McGinty, K.A.; Mervak, B.; Lerebours, R.; Li, C.; Shropshire, E.; Ronald, J.; Commander, L.; Hertel, J.; Luo, S.; et al. The LI-RADS Version 2018 MRI Treatment Response Algorithm: Evaluation of Ablated Hepatocellular Carcinoma. Radiology 2020, 294, 320–326. [Google Scholar] [CrossRef]
- Granito, A.; Facciorusso, A.; Sacco, R.; Bartalena, L.; Mosconi, C.; Cea, U.V.; Cappelli, A.; Antonino, M.; Modestino, F.; Brandi, N.; et al. TRANS-TACE: Prognostic Role of the Transient Hypertransaminasemia after Conventional Chemoembolization for Hepatocellular Carcinoma. J. Pers. Med. 2021, 11, 1041. [Google Scholar] [CrossRef]
- Navin, P.J.; Venkatesh, S.K. Hepatocellular Carcinoma: State of the Art Imaging and Recent Advances. J. Clin. Transl. Hepatol. 2019, 7, 72–85. [Google Scholar] [CrossRef]
- Gurney-Champion, O.J.; Froeling, M.; Klaassen, R.; Runge, J.H.; Bel, A.; van Laarhoven, H.W.; Stoker, J.; Nederveen, A.J. Minimizing the Acquisition Time for Intravoxel Incoherent Motion Magnetic Resonance Imaging Acquisitions in the Liver and Pancreas. Investig. Radiol. 2016, 51, 211–220. [Google Scholar] [CrossRef] [PubMed]


| Sequence | Orientation | TR (ms) | TE (ms) | FOV (mm) | Slice Thickness (mm) |
|---|---|---|---|---|---|
| T2 -weighted HASTE | Axial | 1000 | 95 | 380 × 380 | 6 |
| T1 -weighted FLASH | Axial | 6.91 | 2.39 | 380 × 380 | 3 |
| Diffusion-weighted imaging | Axial | 4100 | 58 | 380 × 380 | 6 |
| IVIM-DWI | Axial | 4900 | 54 | 380 × 380 | 3 |
| Radial VIBE | Axial | 3.57 | 1.69 | 380 × 380 | 5 |
| Characteristics | N |
|---|---|
| Sex | |
| Women | 9 |
| Men | 41 |
| Age (y) | 54 ± 10 |
| Etiology of HCC | |
| Hepatitis B virus | 40 |
| Cryptogenic | 8 |
| Hepatitis C virus | 2 |
| Alcoholism | 1 |
| Cirrhotic | |
| Yes | 41 |
| No | 9 |
| Child-Pugh class * | |
| Child-Pugh A | 41 |
| Child-Pugh B | 8 |
| AFP # | |
| Normal | 11 |
| Abnormal | 35 |
| Number of HCC lesions per patient | |
| Multiple | 15 |
| Single | 35 |
| Number of ROIs | |
| ROIs of the tumor active area | 67 |
| ROIs of the tumor necrotic area | 38 |
| ROIs of the adjacent normal hepatic parenchyma | 67 |
| Parameters | TAA (95%CI) | ANHP (95%CI) | TNA (95%CI) |
|---|---|---|---|
| f | 0.850 (0.766–0.905) | 0.826 (0.732–0.889) | 0.869 (0.762–0.930) |
| D | 0.901 (0.844–0.938) | 0.870 (0.796–0.918) | 0.960 (0.925–0.979) |
| D* | 0.892 (0.830–0.933) | 0.865 (0.789–0.915) | 0.770 (0.599–0.873) |
| Parameters | TAA (n = 67) | TNA (n = 38) | ANHP (n = 67) | p |
|---|---|---|---|---|
| f (%) | 25.96 ± 12.58 *& | 7.41 ± 3.72 # | 13.88 ± 3.78 | <0.05 |
| D (10−3 mm2/s) | 0.91 ± 0.18 *& | 1.56 ± 0.41 # | 1.10 ± 0.20 | <0.05 |
| D* (10−3 mm2/s) | 64.66 ± 46.42 & | 40.04 ± 43.66 # | 77.52 ± 46.32 | <0.05 |
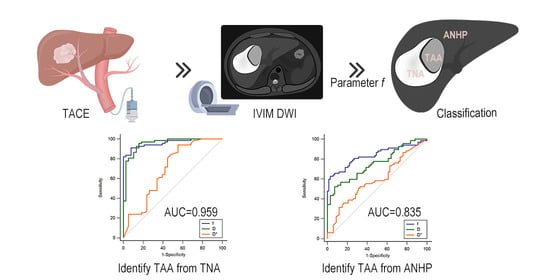
| . | Parameter | AUC (95%CI) | Youden Index | Sensitivity | Specificity | Threshold Value |
|---|---|---|---|---|---|---|
| TAA and ANHP | f | 0.835 (0.761–0.894) | 0.5970 | 62.69% | 97.01% | 19.81% |
| D | 0.753 (0.671–0.823) | 0.4478 | 52.24% | 92.54% | 0.91 (×10−3 mm2/s) | |
| D* | 0.591 (0.503–0.675) | 0.1940 | 31.34% | 88.06% | 27.32 (×10−3 mm2/s) | |
| TAA and TNA | f | 0.959 (0.902–0.988) | 0.8315 | 91.04% | 92.11% | 12.32% |
| D | 0.955 (0.896–0.986) | 0.7973 | 95.52% | 84.21% | 1.19 (×10−3 mm2/s) | |
| D* | 0.692 (0.594–0.778) | 0.3877 | 94.03% | 44.74% | 15.90 (×10−3 mm2/s) |
Publisher’s Note: MDPI stays neutral with regard to jurisdictional claims in published maps and institutional affiliations. |
© 2022 by the authors. Licensee MDPI, Basel, Switzerland. This article is an open access article distributed under the terms and conditions of the Creative Commons Attribution (CC BY) license (https://creativecommons.org/licenses/by/4.0/).
Share and Cite
Yue, X.; Lu, Y.; Jiang, Q.; Dong, X.; Kan, X.; Wu, J.; Kong, X.; Han, P.; Yu, J.; Li, Q. Application of Intravoxel Incoherent Motion in the Evaluation of Hepatocellular Carcinoma after Transarterial Chemoembolization. Curr. Oncol. 2022, 29, 9855-9866. https://doi.org/10.3390/curroncol29120774
Yue X, Lu Y, Jiang Q, Dong X, Kan X, Wu J, Kong X, Han P, Yu J, Li Q. Application of Intravoxel Incoherent Motion in the Evaluation of Hepatocellular Carcinoma after Transarterial Chemoembolization. Current Oncology. 2022; 29(12):9855-9866. https://doi.org/10.3390/curroncol29120774
Chicago/Turabian StyleYue, Xiaofei, Yuting Lu, Qiqi Jiang, Xiangjun Dong, Xuefeng Kan, Jiawei Wu, Xiangchuang Kong, Ping Han, Jie Yu, and Qian Li. 2022. "Application of Intravoxel Incoherent Motion in the Evaluation of Hepatocellular Carcinoma after Transarterial Chemoembolization" Current Oncology 29, no. 12: 9855-9866. https://doi.org/10.3390/curroncol29120774
APA StyleYue, X., Lu, Y., Jiang, Q., Dong, X., Kan, X., Wu, J., Kong, X., Han, P., Yu, J., & Li, Q. (2022). Application of Intravoxel Incoherent Motion in the Evaluation of Hepatocellular Carcinoma after Transarterial Chemoembolization. Current Oncology, 29(12), 9855-9866. https://doi.org/10.3390/curroncol29120774