Using Real-World Data to Determine Health System Costs of Ontario Women Screened for Breast Cancer
Abstract
1. Introduction
2. Materials and Methods
2.1. Study Design
2.2. Study Cohort
2.3. Data Sources
2.4. Statistical and Costing Analysis
2.5. Sensitivity Analysis
3. Results
3.1. Demographics
3.2. Costs
3.3. Sensitivity Analysis
4. Discussion
Supplementary Materials
Author Contributions
Funding
Institutional Review Board Statement
Informed Consent Statement
Data Availability Statement
Conflicts of Interest
References
- Chiarelli, A.M.; Blackmore, K.M.; Mirea, L.; Done, S.J.; Majpruz, V.; Weerasinghe, A.; Rabeneck, L.; Muradali, D. Annual vs Biennial Screening: Diagnostic Accuracy among Concurrent Cohorts within the Ontario Breast Screening Program. JNCI J. Natl. Cancer Inst. 2019, 112, 400–409. [Google Scholar] [CrossRef] [PubMed]
- Integrated Cancer Management System. Available online: https://data.ontario.ca/dataset/integrated-cancer-management-system-icms (accessed on 20 October 2022).
- Annual Demographic Estimates: Canada, Provinces and Territories 2019. Available online: https://www150.statcan.gc.ca/n1/en/pub/91-215-x/91-215-x2019001-eng.pdf?st=vwLirEL3 (accessed on 16 September 2022).
- Mittmann, N.; Stout, N.K.; Tosteson, A.N.A.; Trentham-Dietz, A.; Alagoz, O.; Yaffe, M.J. Cost-Effectiveness of Mammography from a Publicly Funded Health Care System Perspective. CMAJ Open 2018, 6, E77–E86. [Google Scholar] [CrossRef] [PubMed]
- Mittmann, N.; Stout, N.K.; Lee, P.; Tosteson, A.N.A.; Trentham-Dietz, A.; Alagoz, O.; Yaffe, M.J. Total Cost-Effectiveness of Mammography Screening Strategies. Health Rep. 2015, 26, 16–25. [Google Scholar] [PubMed]
- Brooks, J.; Nabi, H.; Andrulis, I.; Antoniou, A.; Chiquette, J.; Després, P.; Devilee, P.; Dorval, M.; Droit, A.; Easton, D.; et al. Personalized Risk Assessment for Prevention and Early Detection of Breast Cancer: Integration and Implementation (PERSPECTIVE I&I). J. Pers. Med. 2021, 11, 511. [Google Scholar] [PubMed]
- Ontario Schedule of Benefits. Available online: https://www.health.gov.on.ca/en/pro/programs/ohip/sob/physserv/sob_master.pdf (accessed on 20 October 2022).
- Deyo, R.A.; Cherkin, D.C.; Ciol, M.A. Adapting a Clinical Comorbidity Index for Use with ICD-9-CM Administrative Databases. J. Clin. Epidemiol. 1992, 45, 613–619. [Google Scholar] [CrossRef]
- Guidelines on Person- Level Costing Using Administrative Databases in Ontario. Available online: https://tspace.library.utoronto.ca/bitstream/1807/87373/1/Wodchis%20et%20al_2013_Guidelines%20on%20Person-Level%20Costing.pdf (accessed on 16 September 2022).
- Pataky, R.; Ismail, Z.; Coldman, A.J.; Elwood, M.; Gelmon, K.; Hedden, L.; Hislop, G.; Kan, L.; McCoy, B.; Olivotto, I.A.; et al. Cost-Effectiveness of Annual versus Biennial Screening Mammography for Women with High Mammographic Breast Density. J. Med. Screen. 2014, 21, 180–188. [Google Scholar] [CrossRef] [PubMed]
- Sankatsing, V.D.V.; Juraniec, K.; Grimm, S.E.; Joore, M.A.; Pijnappel, R.M.; de Koning, H.J.; van Ravesteyn, N.T. Cost-Effectiveness of Digital Breast Tomosynthesis in Population-Based Breast Cancer Screening: A Probabilistic Sensitivity Analysis. Radiology 2020, 297, 40–48. [Google Scholar] [CrossRef] [PubMed]
- Trentham-Dietz, A.; Kerlikowske, K.; Stout, N.K.; Miglioretti, D.L.; Schechter, C.B.; Ergun, M.A.; van den Broek, J.J.; Alagoz, O.; Sprague, B.L.; van Ravesteyn, N.T.; et al. Tailoring Breast Cancer Screening Intervals by Breast Density and Risk for Women Aged 50 Years or Older: Collaborative Modeling of Screening Outcomes. Ann. Intern. Med. 2016, 165, 700–712. [Google Scholar] [CrossRef] [PubMed]
- Stout, N.K.; Lee, S.J.; Schechter, C.B.; Kerlikowske, K.; Alagoz, O.; Berry, D.; Buist, D.S.M.; Cevik, M.; Chisholm, G.; de Koning, H.J.; et al. Benefits, Harms, and Costs for Breast Cancer Screening after US Implementation of Digital Mammography. JNCI J. Natl. Cancer Inst. 2014, 106, dju092. [Google Scholar] [CrossRef] [PubMed]


| Baseline Characteristics | Variable Value | Negative OBSP Screening | Positive OBSP Screening | Negative Non–OBSP Screening | Positive Non–OBSP Screening | Total |
|---|---|---|---|---|---|---|
| Number of eligible women | Sample Size | N = 1,144,442 | N = 195,695 | N = 163,031 | N = 43,218 | N = 1,546,386 |
| Year of index screening | 2013 | 405,948 (35.5%) | 51,722 (26.4%) | 61,382 (37.7%) | 14,085 (32.6%) | 533,137 (34.5%) |
| 2014 | 316,093 (27.6%) | 42,092 (21.5%) | 43,641 (26.8%) | 8799 (20.4%) | 410,625 (26.6%) | |
| 2015 | 129,525 (11.3%) | 25,569 (13.1%) | 24,154 (14.8%) | 6171 (14.3%) | 185,419 (12.0%) | |
| 2016 | 86,676 (7.6%) | 20,810 (10.6%) | 13,073 (8.0%) | 4638 (10.7%) | 125,197 (8.1%) | |
| 2017 | 77,028 (6.7%) | 19,445 (9.9%) | 8811 (5.4%) | 3592 (8.3%) | 108,876 (7.0%) | |
| 2018 | 67,118 (5.9%) | 18,265 (9.3%) | 6562 (4.0%) | 3211 (7.4%) | 95,156 (6.2%) | |
| 2019 | 62,054 (5.4%) | 17,792 (9.1%) | 5408 (3.3%) | 2722 (6.3%) | 87,976 (5.7%) | |
| Age at screening (years) | Mean (SD) | 59.7 (7.0) | 58.0 (7.0) | 59.3 (7.5) | 57.7 (7.6) | 59.4 (7.1) |
| Median (Q1–Q3) | 59 (53–65) | 56 (52–63) | 58 (52–65) | 56 (51–64) | 59 (53–65) | |
| Min–Max | 49–74 | 49–74 | 49–74 | 49–74 | 49–74 | |
| Screen age group (years) | 49–54 | 342,716 (29.9%) | 81,698 (41.7%) | 56,012 (34.4%) | 19,182 (44.4%) | 499,608 (32.3%) |
| 55–59 | 253,115 (22.1%) | 39,452 (20.2%) | 32,879 (20.2%) | 7850 (18.2%) | 333,296 (21.6%) | |
| 60–64 | 227,587 (19.9%) | 31,825 (16.3%) | 28,132 (17.3%) | 6382 (14.8%) | 293,926 (19.0%) | |
| 65–69 | 198,094 (17.3%) | 27,138 (13.9%) | 25,591 (15.7%) | 5433 (12.6%) | 256,256 (16.6%) | |
| 70–74 | 122,930 (10.7%) | 15,582 (8.0%) | 20,417 (12.5%) | 4371 (10.1%) | 163,300 (10.6%) | |
| Rural | Missing Data | 1050 (0.1%) | 222 (0.1%) | 178 (0.1%) | 55 (0.1%) | 1505 (0.1%) |
| N | 998,812 (87.3%) | 174,970 (89.4%) | 146,545 (89.9%) | 39,798 (92.1%) | 1,360,125 (88.0%) | |
| Y | 144,580 (12.6%) | 20,503 (10.5%) | 16,308 (10.0%) | 3365 (7.8%) | 184,756 (11.9%) | |
| Neighbourhood income quintile | Missing Data | 2534 (0.2%) | 433 (0.2%) | 315 (0.2%) | 107 (0.2%) | 3389 (0.2%) |
| 1 (low) | 193,266 (16.9%) | 34,872 (17.8%) | 28,849 (17.7%) | 8305 (19.2%) | 265,292 (17.2%) | |
| 2 | 220,907 (19.3%) | 38,027 (19.4%) | 32,702 (20.1%) | 8616 (19.9%) | 300,252 (19.4%) | |
| 3 | 230,514 (20.1%) | 39,089 (20.0%) | 32,844 (20.1%) | 8458 (19.6%) | 310,905 (20.1%) | |
| 4 | 239,721 (20.9%) | 40,453 (20.7%) | 34,068 (20.9%) | 8624 (20.0%) | 322,866 (20.9%) | |
| 5 (high) | 257,500 (22.5%) | 42,821 (21.9%) | 34,253 (21.0%) | 9108 (21.1%) | 343,682 (22.2%) | |
| Charlson Comorbidity | 0 | 459,506 (40.2%) | 78,935 (40.3%) | 63,739 (39.1%) | 17,562 (40.6%) | 619,742 (40.1%) |
| 1 | 54,514 (4.8%) | 9073 (4.6%) | 7703 (4.7%) | 1991 (4.6%) | 73,281 (4.7%) | |
| 2+ | 29,438 (2.6%) | 9789 (5.0%) | 4344 (2.7%) | 2383 (5.5%) | 45,954 (3.0%) | |
| No hospitalization | 600,984 (52.5%) | 97,898 (50.0%) | 87,245 (53.5%) | 21,282 (49.2%) | 807,409 (52.2%) | |
| Episode follow–up (months) | Mean (SD) | 7.9 (0.6) | 7.7 (1.4) | 7.9 (0.7) | 7.6 (1.5) | 7.9 (0.8) |
| Median (Q1–Q3) | 8 (8–8) | 8 (8–8) | 8 (8–8) | 8 (8–8) | 8 (8–8) | |
| Min–Max | 0–8 | 0–8 | 0–8 | 0–8 | 0–8 | |
| Censoring reasons | Death | 1218 (0.1%) | 493 (0.3%) | 220 (0.1%) | 135 (0.3%) | 2066 (0.1%) |
| 75th birthday | 11,661 (1.0%) | 1340 (0.7%) | 2488 (1.5%) | 505 (1.2%) | 15,994 (1.0%) | |
| Breast cancer diagnosis (except DCIS) | 11 (0.0%) | 7732 (4.0%) | 13 (0.0%) | 1854 (4.3%) | 9610 (0.6%) | |
| Breast implants | 6 (0.0%) | * 1–5 | 22 (0.0%) | * 33–37 | 66 (0.0%) | |
| Mastectomy | 15 (0.0%) | * 318–322 | 8 (0.0%) | * 89–93 | 434 (0.0%) | |
| End of episode | 1,126,298 (98.4%) | 184,644 (94.4%) | 159,413 (97.8%) | 40,337 (93.3%) | 1,510,692 (97.7%) | |
| End of OHIP eligibility | 501 (0.0%) | 112 (0.1%) | 114 (0.1%) | 26 (0.1%) | 753 (0.0%) | |
| LTC admission | 4732 (0.4%) | 1051 (0.5%) | 753 (0.5%) | 235 (0.5%) | 6771 (0.4%) |
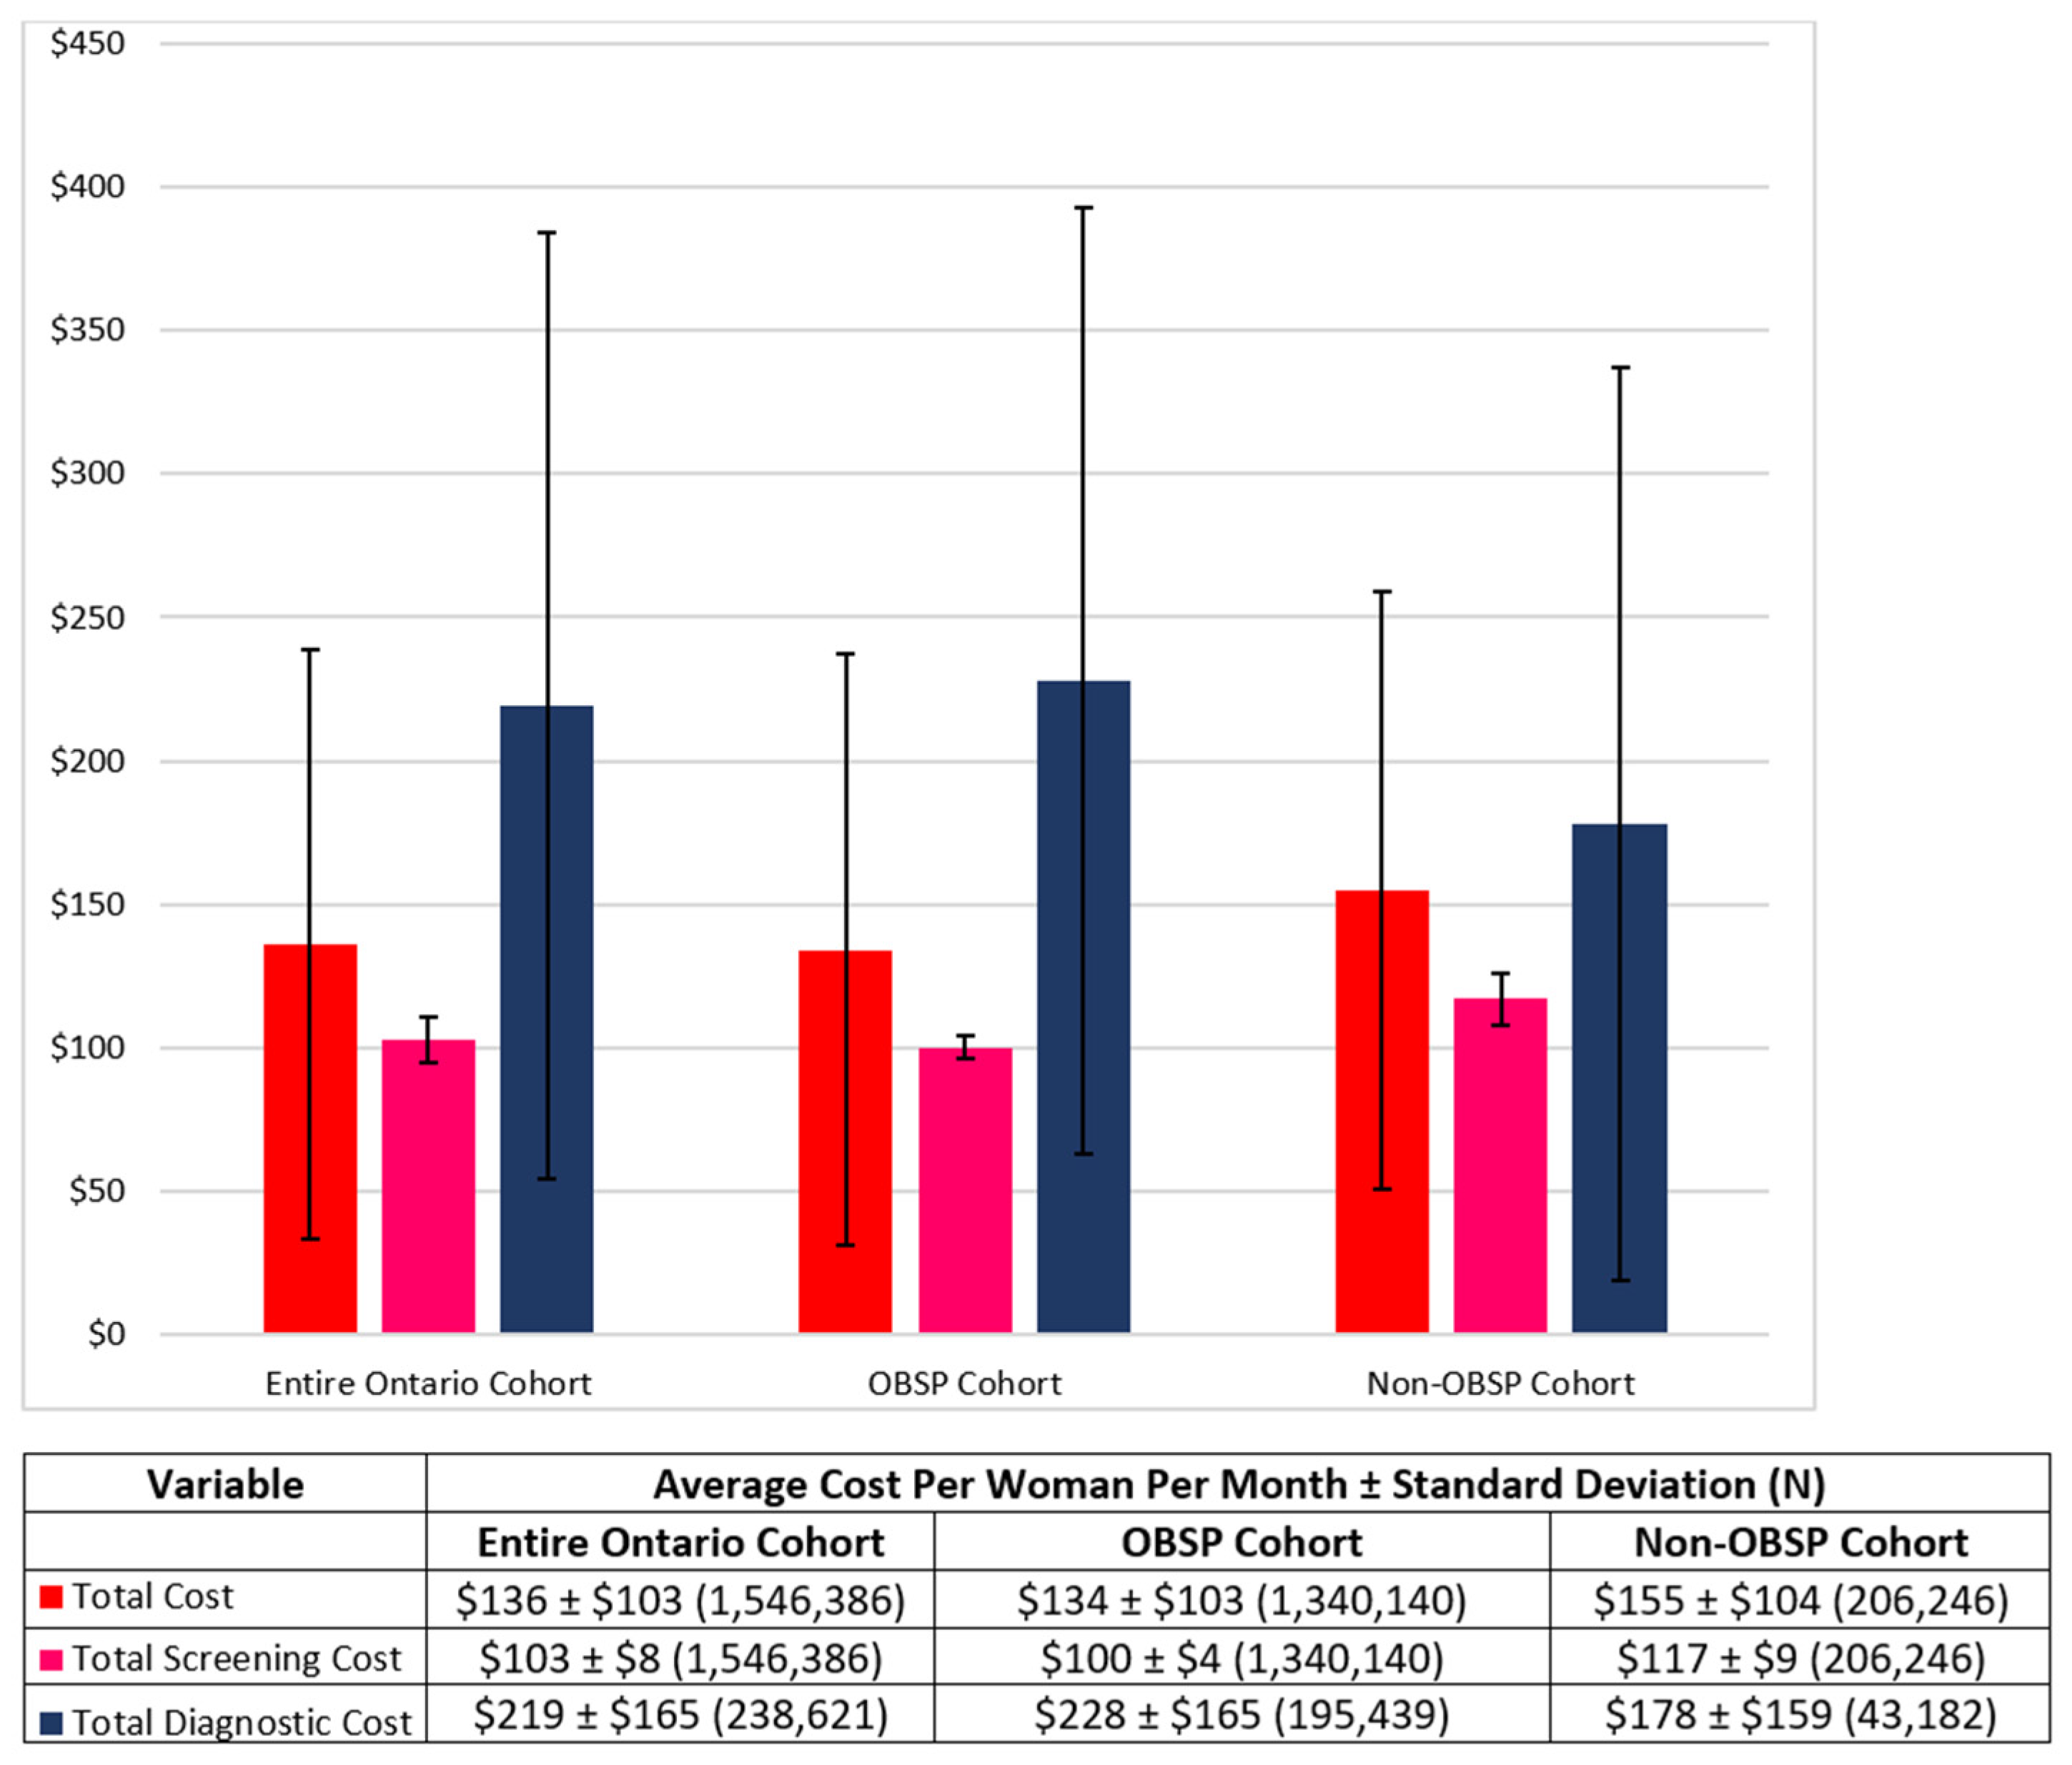
| OBSP (Average Cost per Woman ± Standard Deviation (N)) | Non-OBSP (Average Cost per Woman ± Standard Deviation (N)) | |
|---|---|---|
| Screening Costs | ||
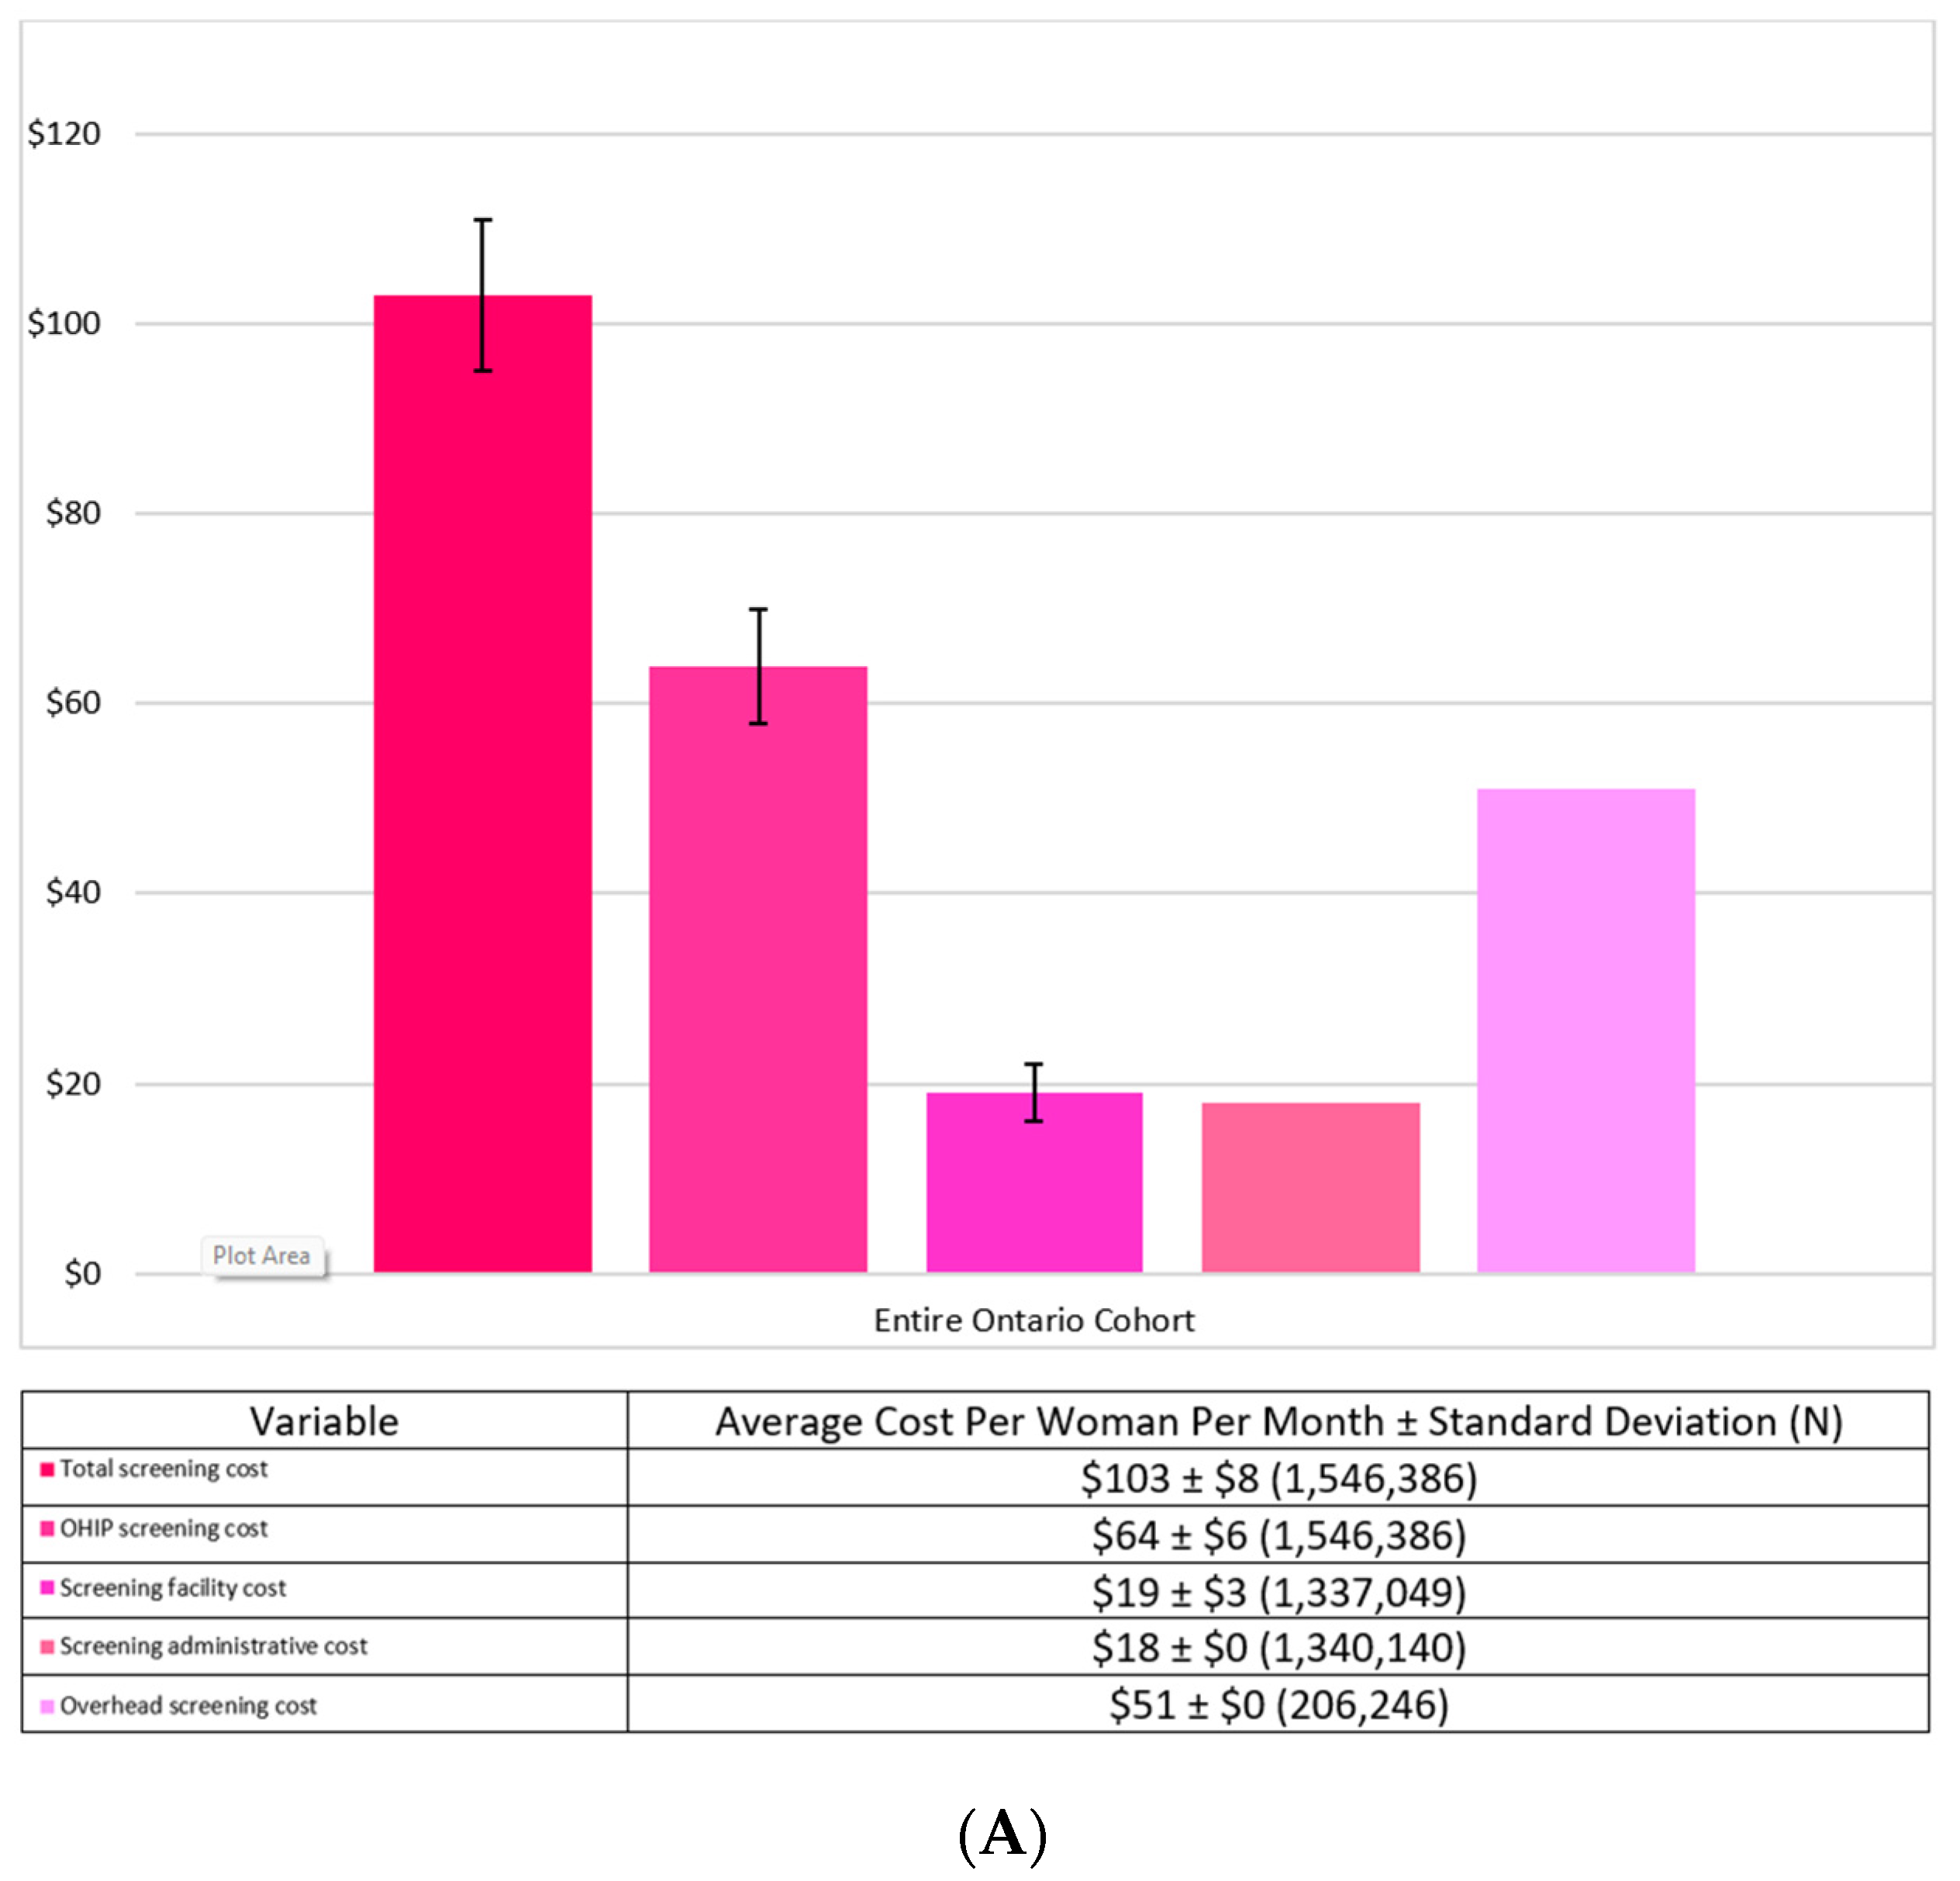
| Total screening cost | $100 ± $4 (1,340,140) | $117 ± $9 (206,246) |
| Screening cost | $64 ± $5 (1,340,140) | $66 ± $9 (206,246) |
| Screening facility cost | $19 ± $3 (1,337,049) | N/A |
| Screening administrative cost | $18 ± $0 (1,340,140) | N/A |
| Overhead screening cost | N/A | $51 ± $0 (206,246) |
| Diagnostic Costs | ||
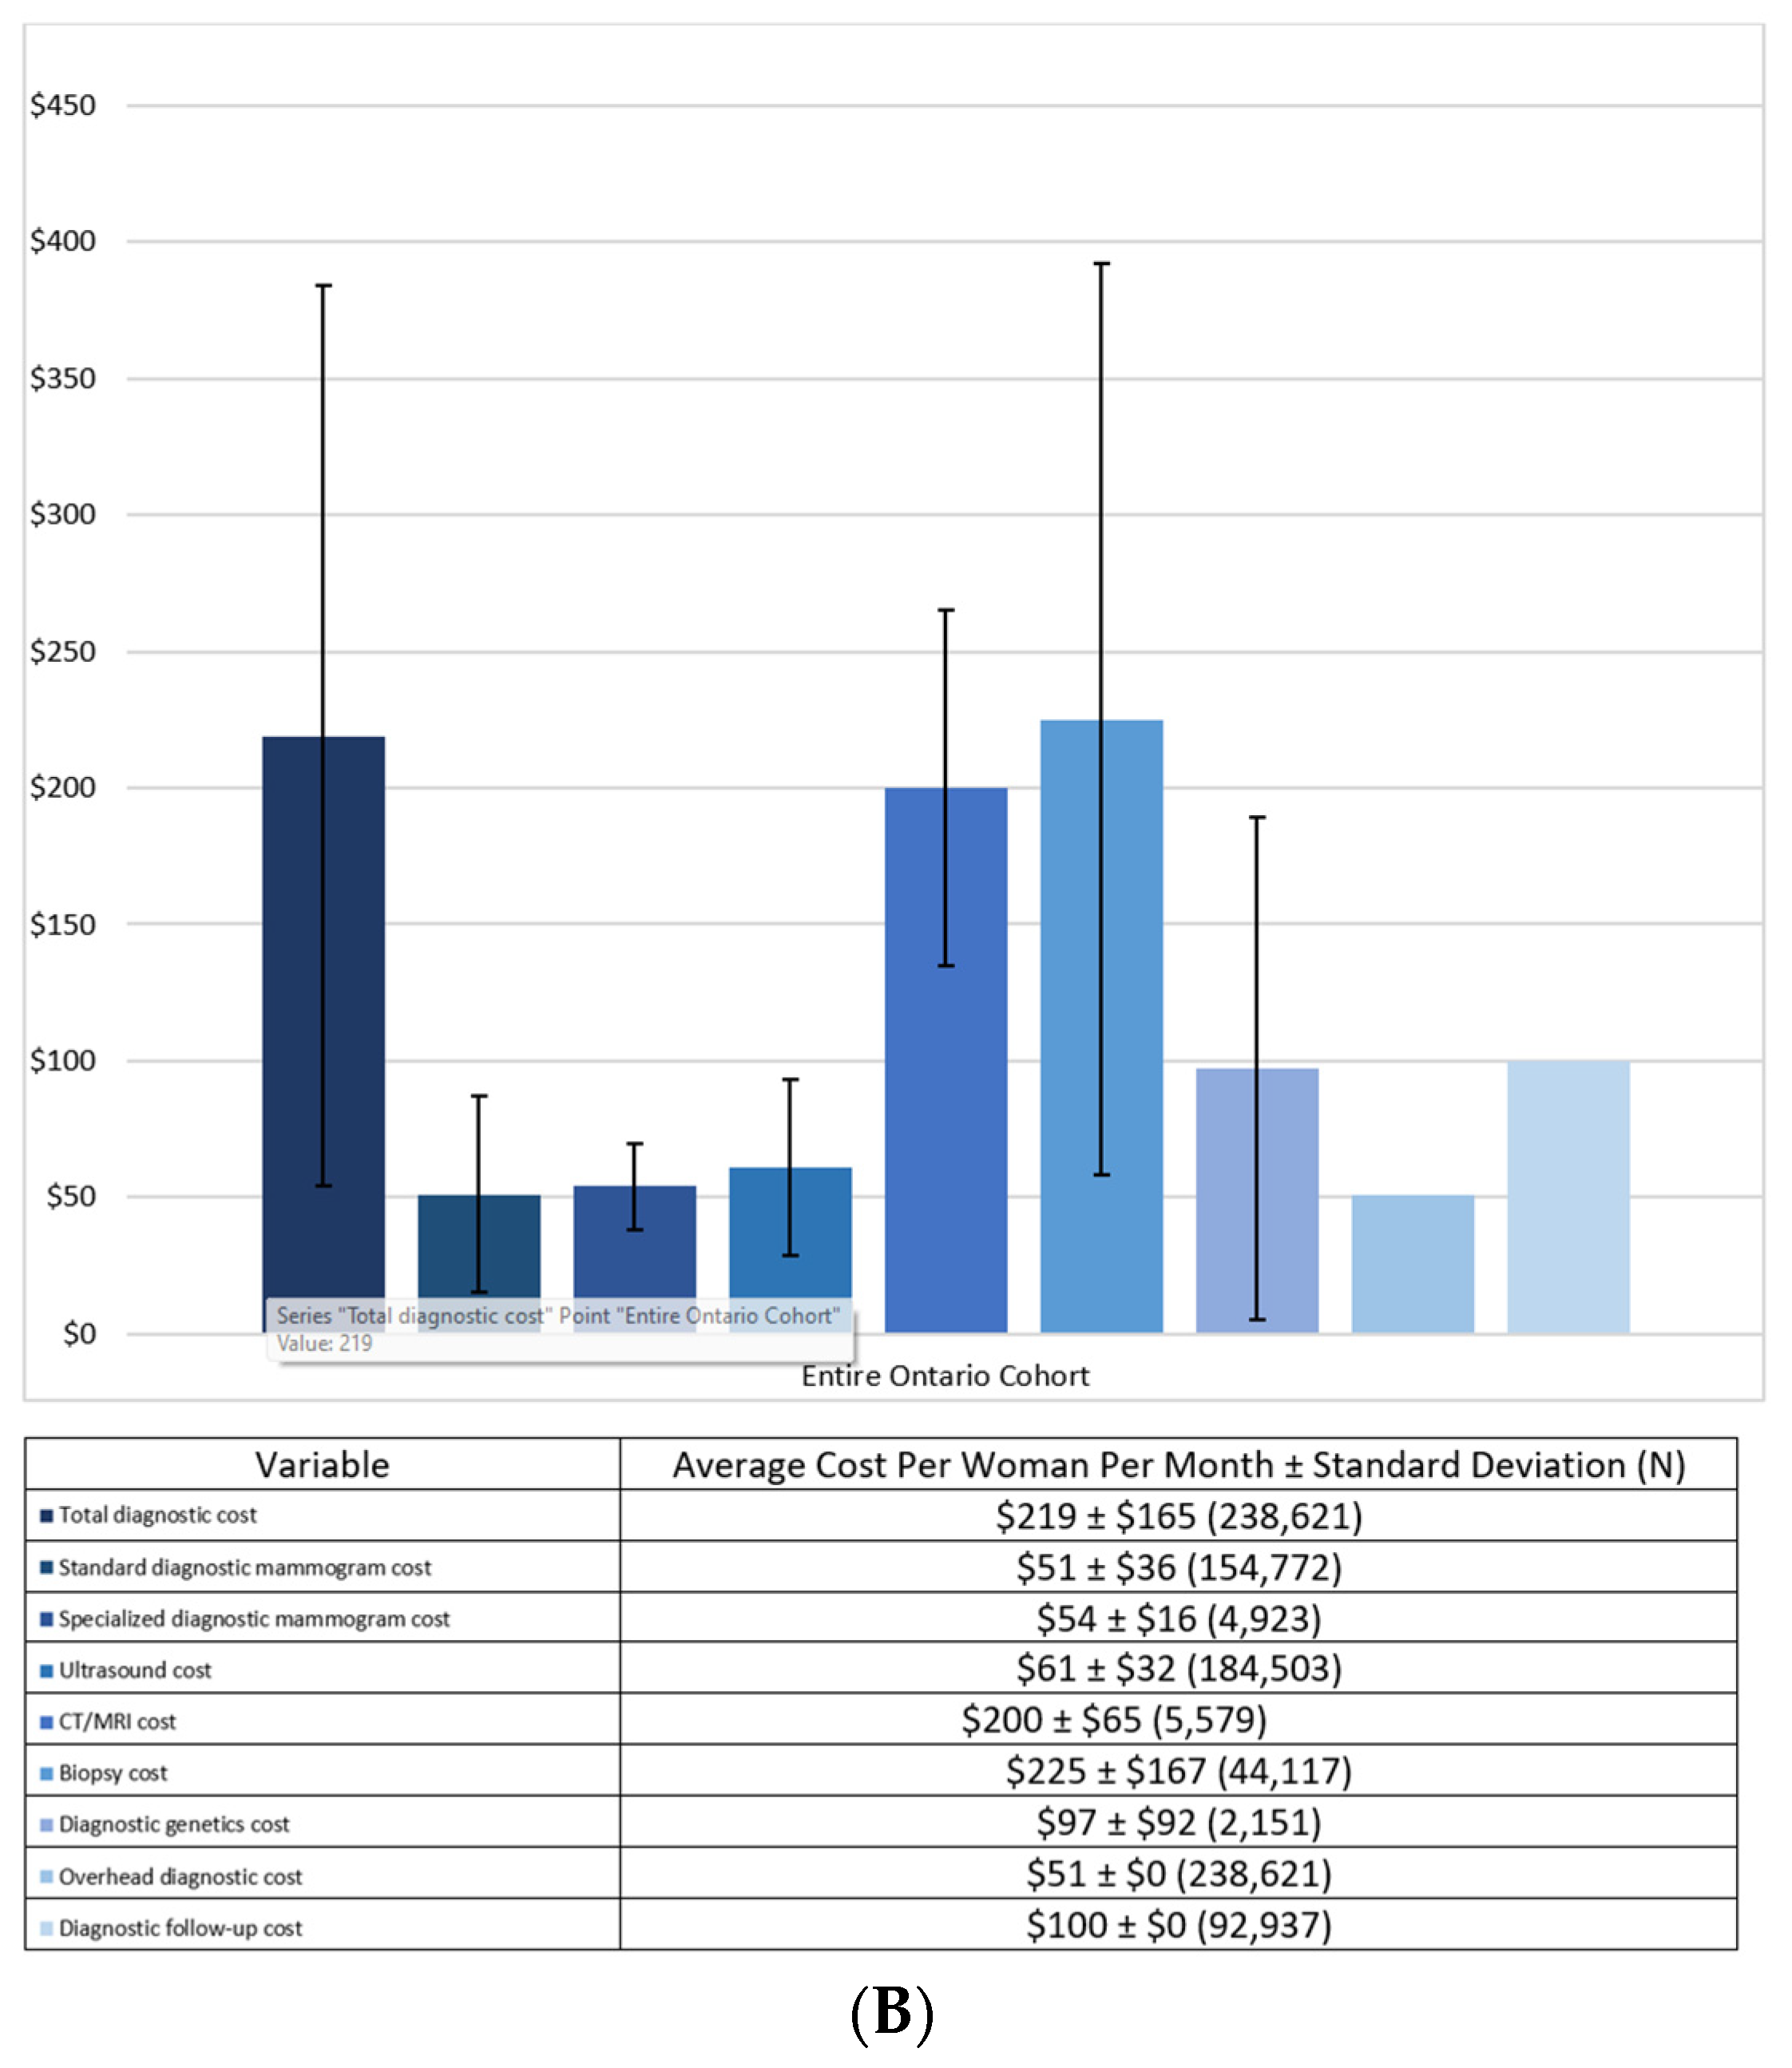
| Total diagnostic cost | $228 ± $165 (195,439) | $178 ± $159 (43,182) |
| Standard diagnostic mammogram cost | $51 ± $36 (137,010) | $50 ± $38 (17,762) |
| Specialized diagnostic mammogram cost | $54 ± $16 (4529) | $56 ± $19 (394) |
| Ultrasound cost | $60 ± $31 (148,525) | $67 ± $32 (35,978) |
| CT/MRI cost | $198 ± $63 (3368) | $203 ± $67 (2211) |
| Biopsy cost | $224 ± $165 (36,985) | $233 ± $173 (7132) |
| Diagnostic genetics cost | $100 ± $95 (1640) | $89 ± $80 (511) |
| Overhead diagnostic cost | $51 ± $0 (195,439) | $51 ± $0 (43,182) |
| Diagnostic follow-up cost | $100 ± $0 (92,937) | N/A |
Publisher’s Note: MDPI stays neutral with regard to jurisdictional claims in published maps and institutional affiliations. |
© 2022 by the authors. Licensee MDPI, Basel, Switzerland. This article is an open access article distributed under the terms and conditions of the Creative Commons Attribution (CC BY) license (https://creativecommons.org/licenses/by/4.0/).
Share and Cite
Mittmann, N.; Seung, S.J.; Diong, C.; Gatley, J.M.; Wolfson, M.; Guertin, M.-H.; Pashayan, N.; Simard, J.; Chiarelli, A.M. Using Real-World Data to Determine Health System Costs of Ontario Women Screened for Breast Cancer. Curr. Oncol. 2022, 29, 8330-8339. https://doi.org/10.3390/curroncol29110657
Mittmann N, Seung SJ, Diong C, Gatley JM, Wolfson M, Guertin M-H, Pashayan N, Simard J, Chiarelli AM. Using Real-World Data to Determine Health System Costs of Ontario Women Screened for Breast Cancer. Current Oncology. 2022; 29(11):8330-8339. https://doi.org/10.3390/curroncol29110657
Chicago/Turabian StyleMittmann, Nicole, Soo Jin Seung, Christina Diong, Jodi M. Gatley, Michael Wolfson, Marie-Hélène Guertin, Nora Pashayan, Jacques Simard, and Anna M. Chiarelli. 2022. "Using Real-World Data to Determine Health System Costs of Ontario Women Screened for Breast Cancer" Current Oncology 29, no. 11: 8330-8339. https://doi.org/10.3390/curroncol29110657
APA StyleMittmann, N., Seung, S. J., Diong, C., Gatley, J. M., Wolfson, M., Guertin, M.-H., Pashayan, N., Simard, J., & Chiarelli, A. M. (2022). Using Real-World Data to Determine Health System Costs of Ontario Women Screened for Breast Cancer. Current Oncology, 29(11), 8330-8339. https://doi.org/10.3390/curroncol29110657


