A Case Report on Longitudinal Collection of Tumour Biopsies for Gene Expression-Based Tumour Microenvironment Analysis from Pancreatic Cancer Patients Treated with Endoscopic Ultrasound Guided Radiofrequency Ablation

 ,
,  , ,
, ,  and
and 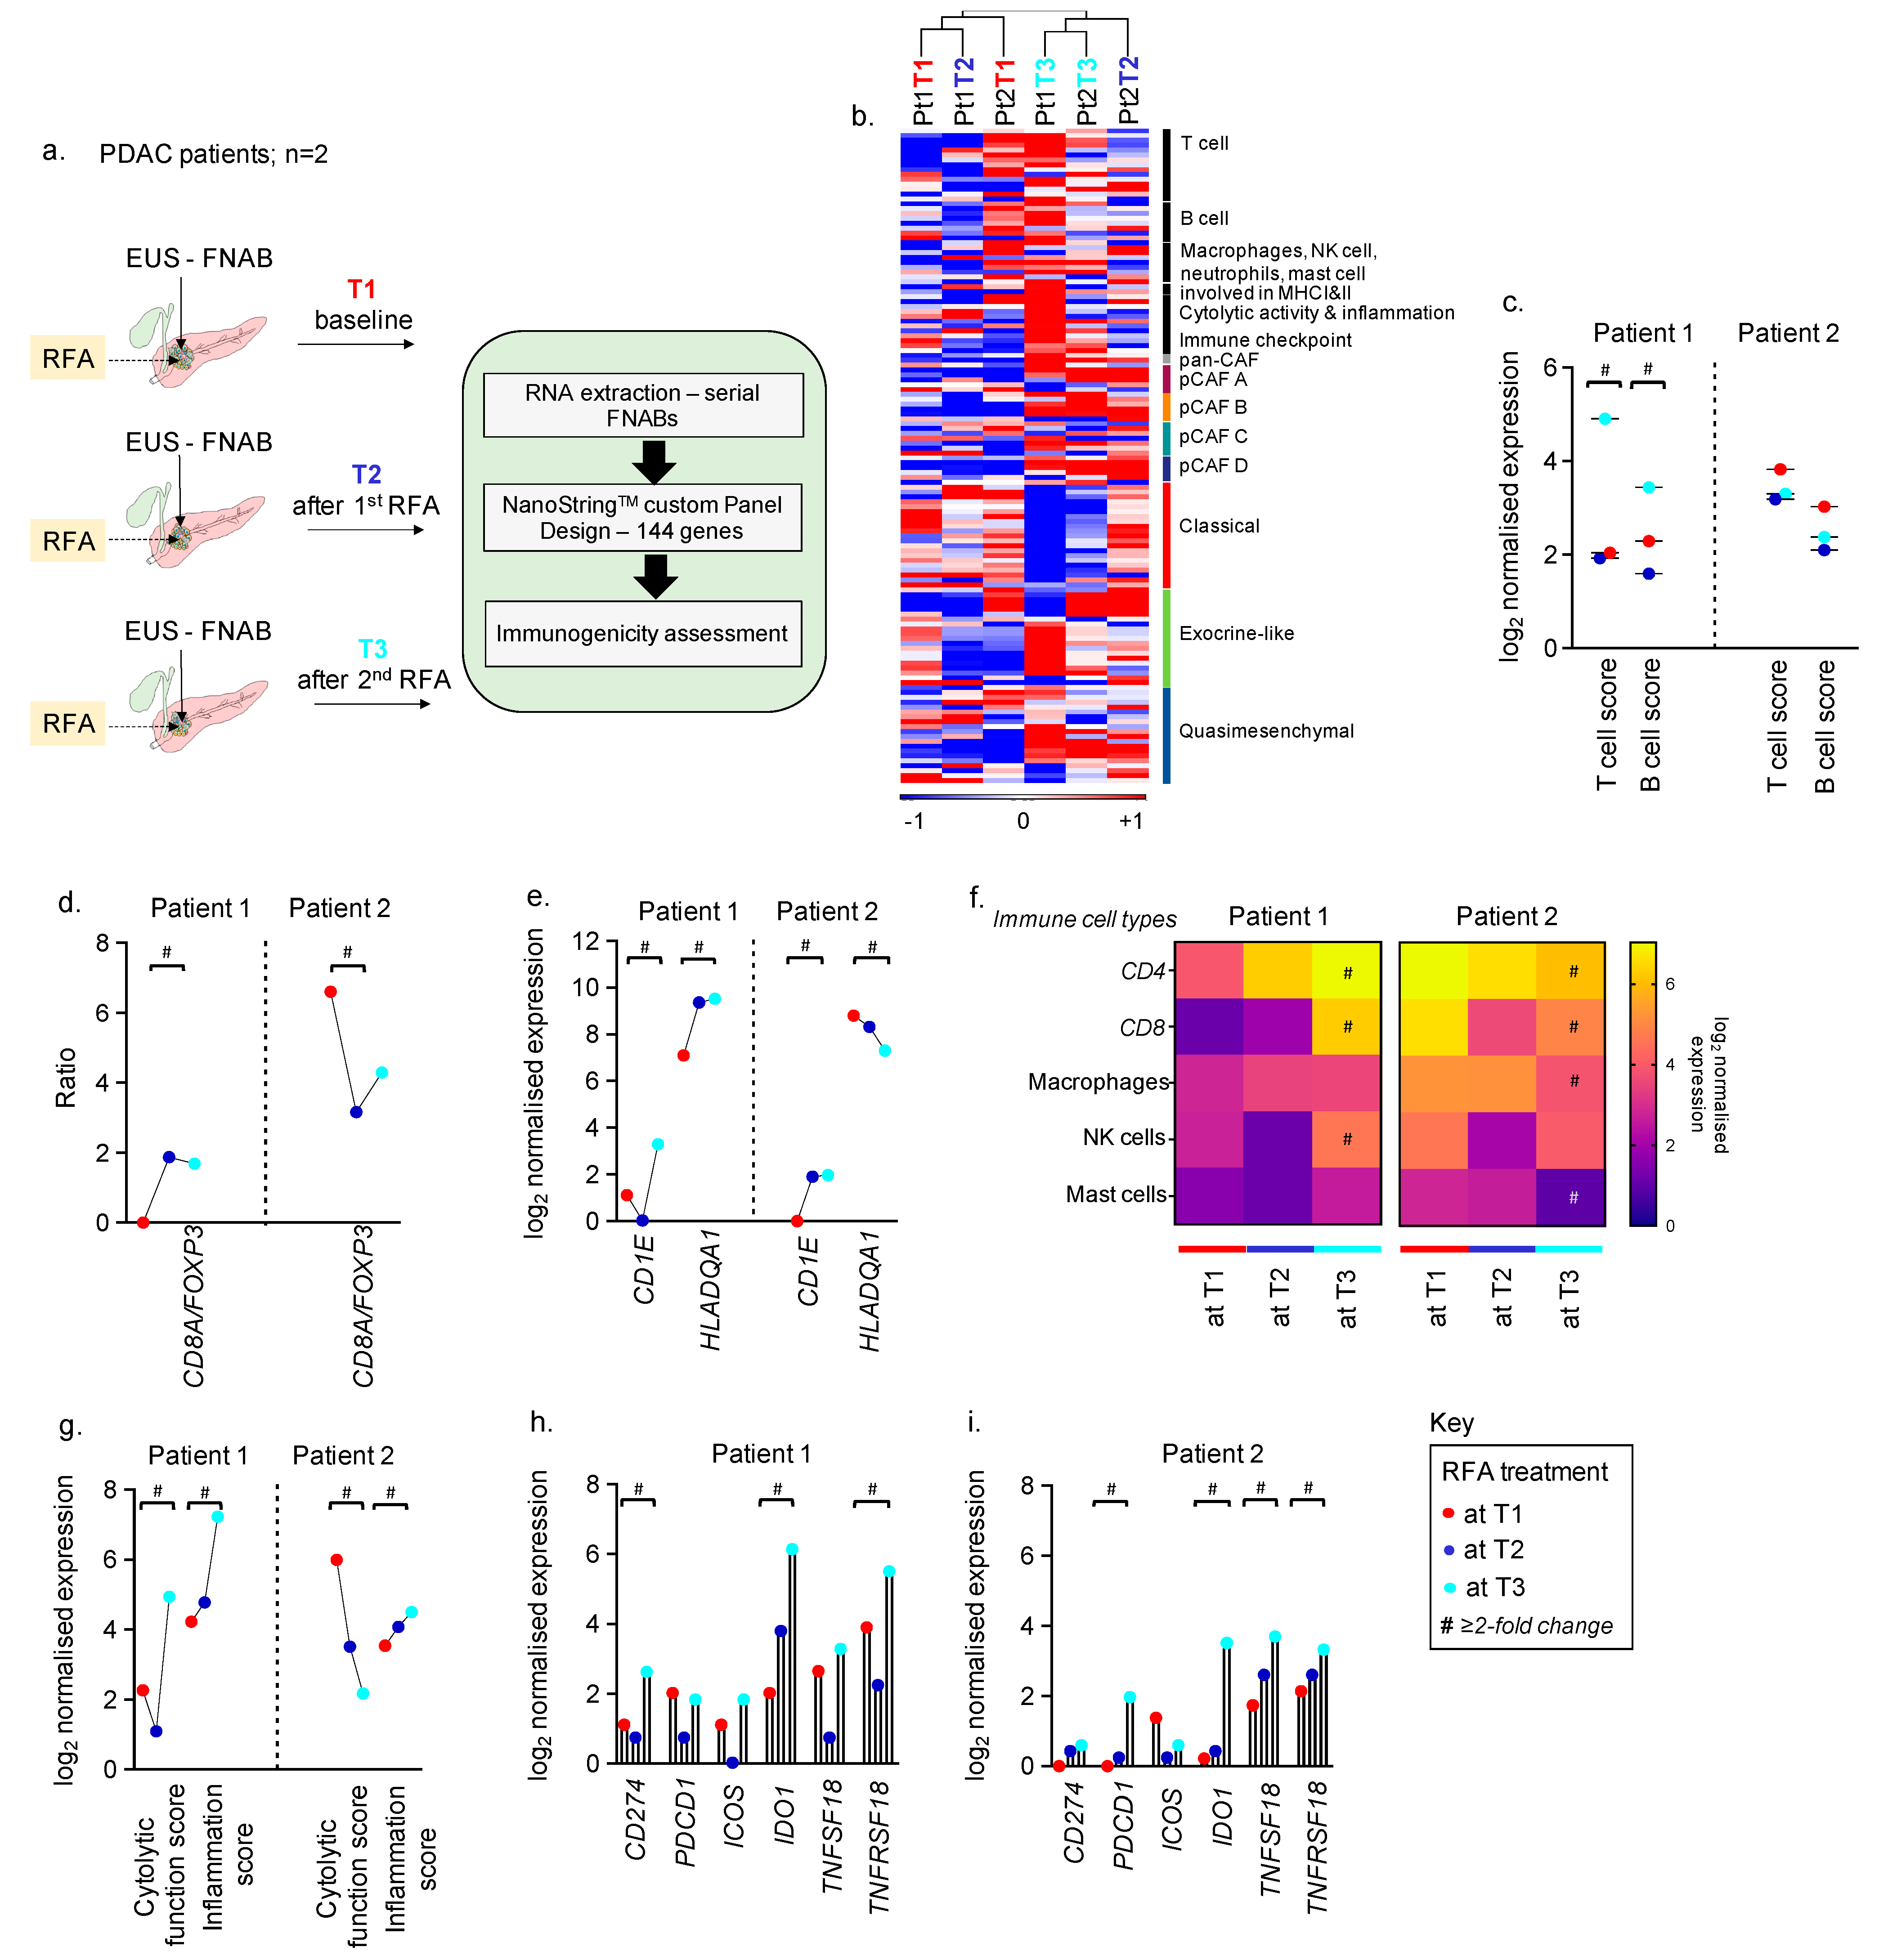
Abstract
1. Introduction
2. Methods
2.1. Study Design
2.2. Endoscopic-Ultrasound Guided Radiofrequency Ablation
2.3. Nucleic Acid Extractions from FNABs
2.4. Transcriptomic profiling on NanoStringTM nCounter
2.5. Gene Scores and Subtypes
2.6. Isolation of Patient-Derived Cancer-Associated Fibroblasts from EUS-FNABs
2.7. Statistics
3. Results
3.1. Feasibility of Collecting Longitudinal EUS FNABS to Study Immune Microenvironment of RFA-Treated Patients
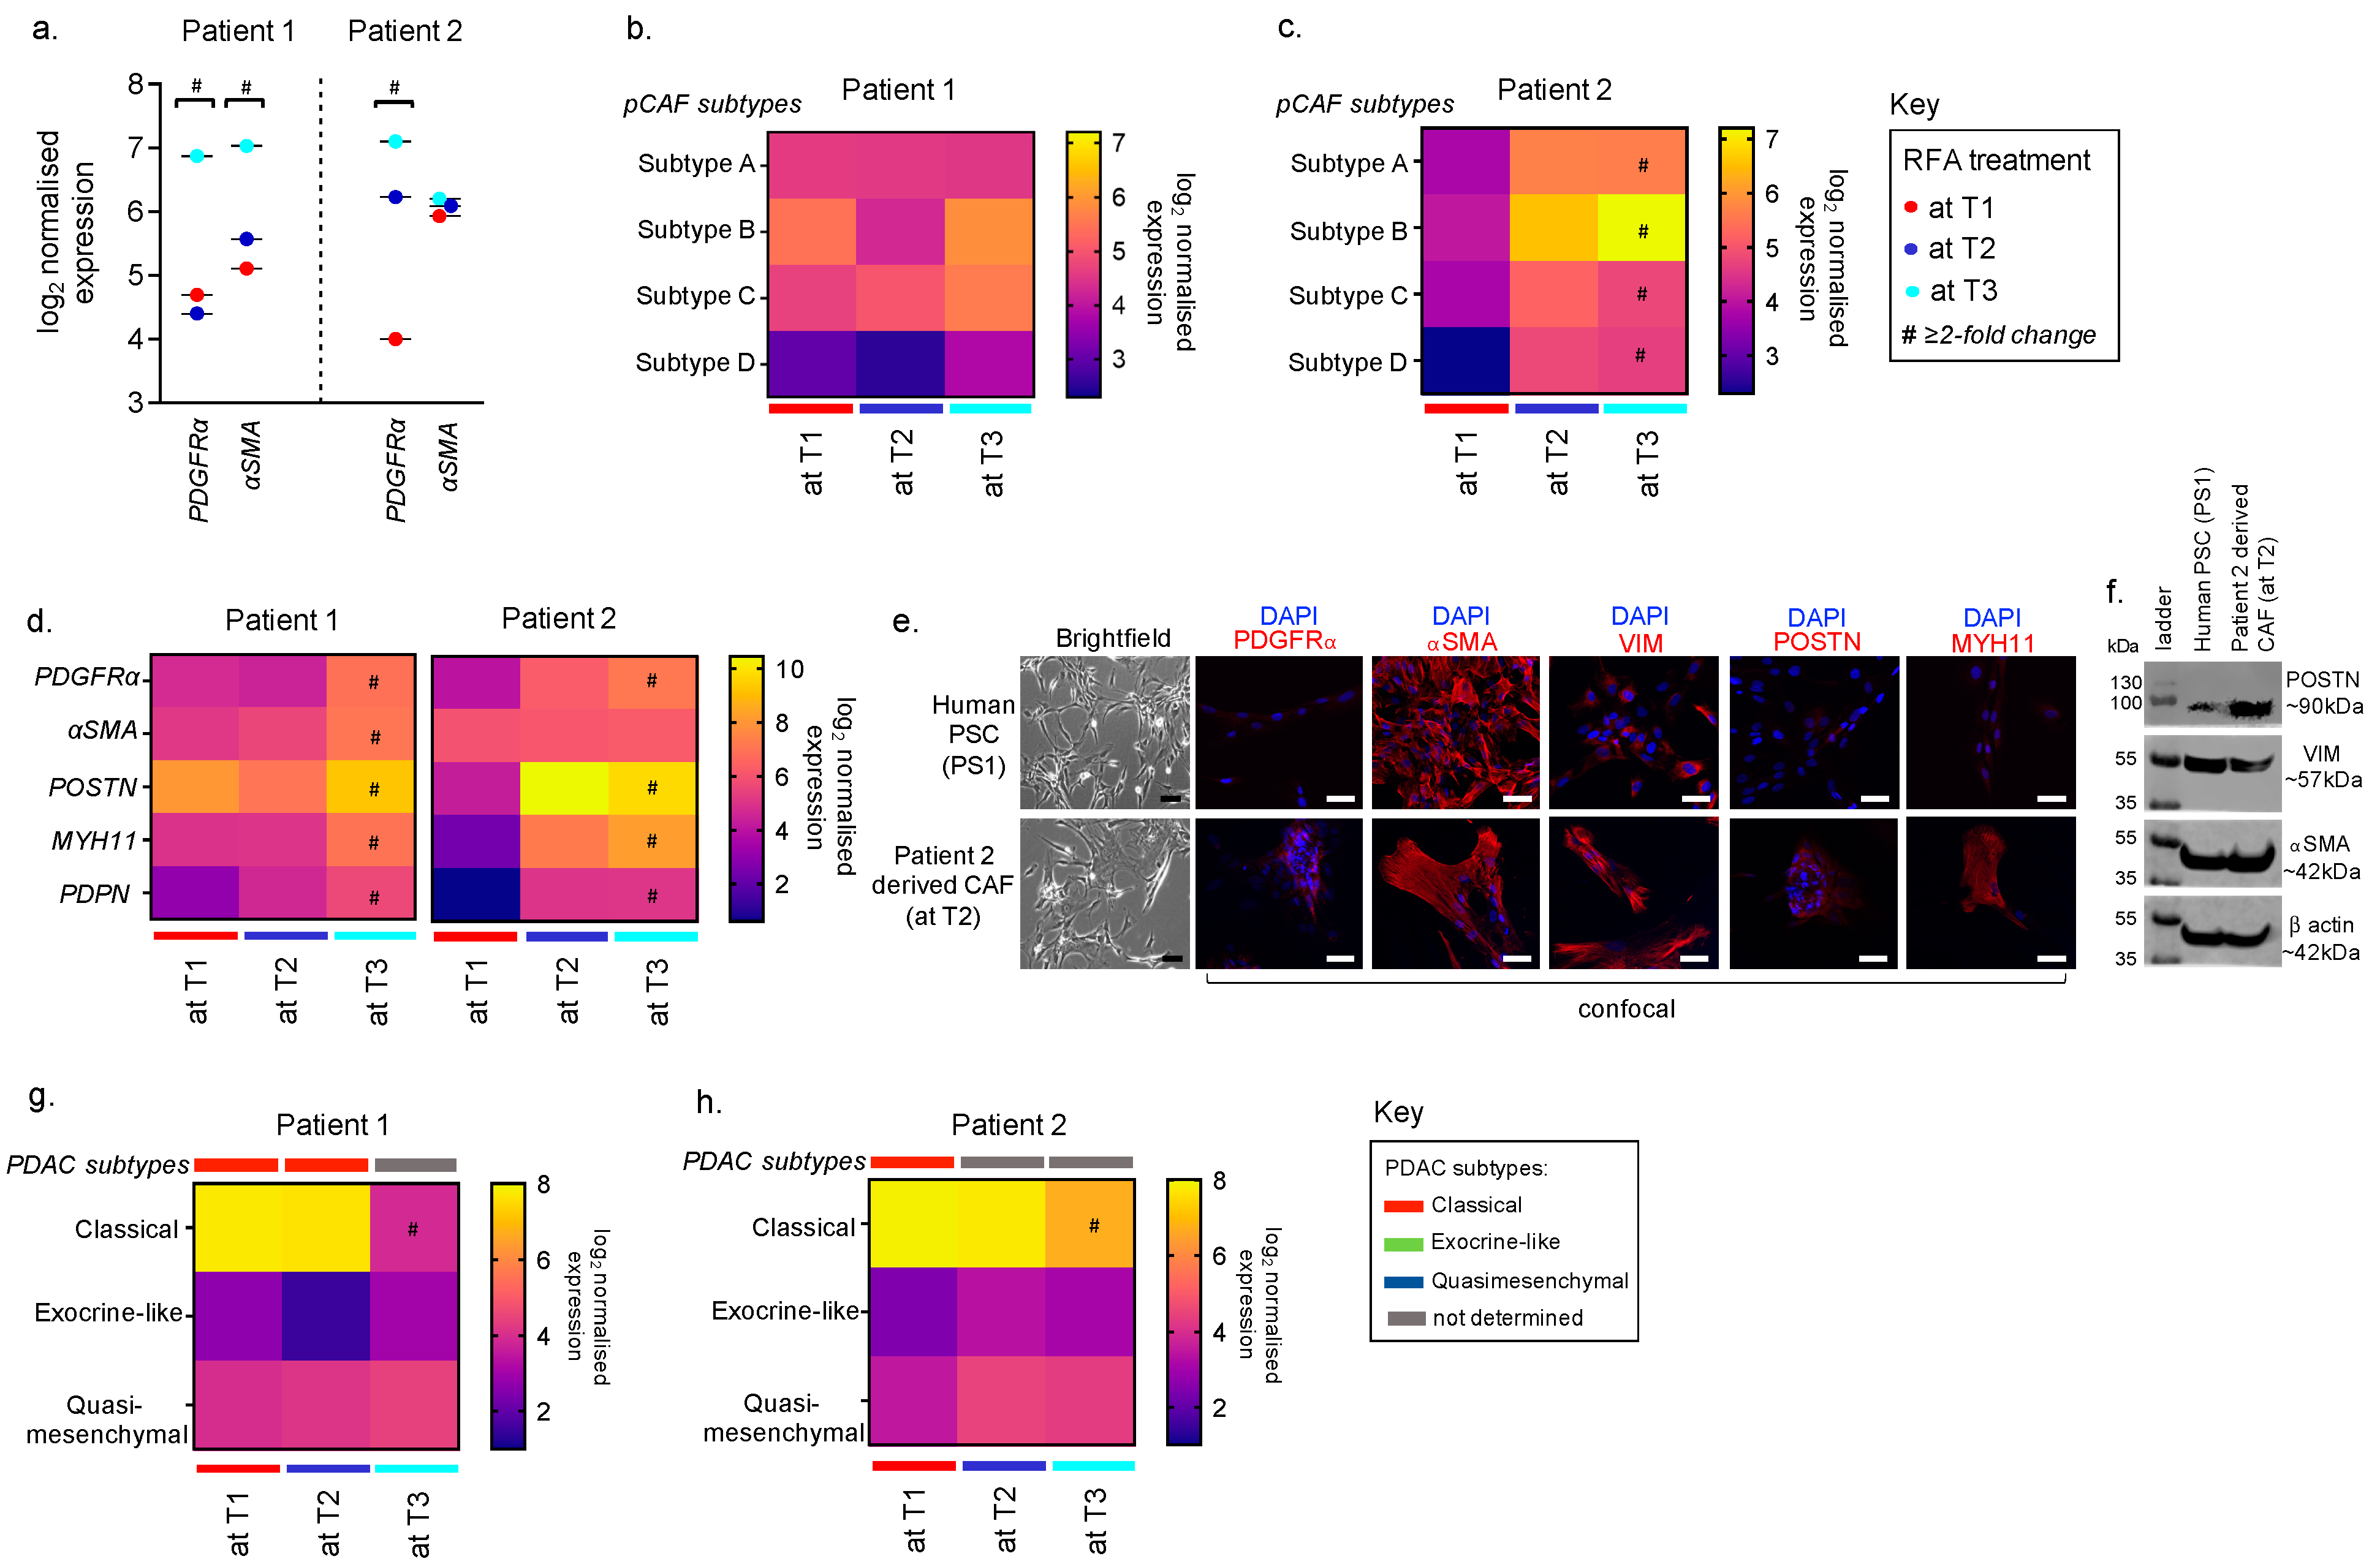
3.2. Feasibility of using FNABs to Evaluate the Tumour Stroma in RFA-Treated PDACs
3.3. Feasibility of Using FNABs to Study Cancer Subtypes in RFA-Treated PDACs
4. Conclusions
Supplementary Materials
Author Contributions
Funding
Institutional Review Board Statement
Informed Consent Statement
Data Availability Statement
Acknowledgments
Conflicts of Interest
Disclosures
References
- Ansari, D.; Tingstedt, B.; Andersson, B.; Holmquist, F.; Sturesson, C.; Williamsson, C.; Sasor, A.; Borg, D.; Bauden, M.; Andersson, R. Pancreatic cancer: Yesterday, today and tomorrow. Future Oncol. 2016, 12, 1929–1946. [Google Scholar] [CrossRef] [PubMed]
- Kocher, H.M. Pancreatic cancer—Symptoms, diagnosis and treatment. BMJ Best Pract. 2020. Available online: https://bestpractice.bmj.com/topics/en-us/265 (accessed on 1 July 2022).
- Gillen, S.; Schuster, T.; Meyer Zum Büschenfelde, C.; Friess, H.; Kleeff, J. Preoperative/neoadjuvant therapy in pancreatic cancer: A systematic review and meta-analysis of response and resection percentages. PLoS Med. 2010, 7, e1000267. [Google Scholar] [CrossRef] [PubMed]
- Sohal, D.P.S.; Kennedy, E.B.; Khorana, A.; Copur, M.S.; Crane, C.H.; Garrido-Laguna, I.; Krishnamurthi, S.; Moravek, C.; O’Reilly, E.M.; Philip, P.A.; et al. Metastatic Pancreatic Cancer: ASCO Clinical Practice Guideline Update. J Clin. Oncol. 2018, 36, 2545. [Google Scholar] [CrossRef] [PubMed]
- Balaban, E.P.; Mangu, P.B.; Khorana, A.A. Locally advanced, unresectable pancreatic cancer: American society of clinical oncology clinical practice guideline. J. Clin. Oncol. 2016, 34, 2654–2667. [Google Scholar] [CrossRef]
- Pai, M.; Habib, N.; Senturk, H.; Lakhtakia, S.; Reddy, N.; Cicinnati, V.R.; Kaba, I.; Beckebaum, S.; Drymousis, P.; Kahaleh, M.; et al. Endoscopic ultrasound guided radiofrequency ablation, for pancreatic cystic neoplasms and neuroendocrine tumors. World J. Gastrointest. Surg. 2015, 7, 52–59. [Google Scholar] [CrossRef]
- Lee, D.H.; Lee, J.M.; Lee, J.Y.; Kim, S.H.; Yoon, J.H.; Kim, Y.J.; Han, J.K.; Choi, B.I. Radiofrequency ablation of hepatocellular carcinoma as first-line treatment: Long-term results and prognostic factors in 162 patients with cirrhosis. Radiology 2014, 270, 900–909. [Google Scholar] [CrossRef]
- Scopelliti, F.; Pea, A.; Conigliaro, R.; Butturini, G.; Frigerio, I.; Regi, P.; Giardino, A.; Bertani, H.; Paini, M.; Pederzoli, P. Technique, safety, and feasibility of EUS-guided radiofrequency ablation in unresectable pancreatic cancer. Surg. Endosc. 2018, 32, 4022–4028. [Google Scholar] [CrossRef]
- Girelli, R.; Frigerio, I.; Giardino, A.; Regi, P.; Gobbo, S.; Malleo, G.; Salvia, R.; Bassi, C. Results of 100 pancreatic radiofrequency ablations in the context of a multimodal strategy for stage III ductal adenocarcinoma. Langenbecks Arch. Surg. 2013, 398, 63–69. [Google Scholar] [CrossRef]
- Evrard, S.; Menetrier-Caux, C.; Biota, C.; Neaud, V.; Mathoulin-Pélissier, S.; Blay, J.Y.; Rosenbaum, J. Cytokines pattern after surgical radiofrequency ablation of liver colorectal metastases. Gastroenterol. Clin. Biol. 2007, 31, 141–145. [Google Scholar] [CrossRef]
- Haen, S.P.; Pereira, P.L.; Salih, H.R.; Rammensee, H.G.; Gouttefangeas, C. More than just tumor destruction: Immunomodulation by thermal ablation of cancer. Clin. Dev. Immunol. 2011, 2011, 160250. [Google Scholar] [CrossRef]
- den Brok, M.H.; Sutmuller, R.P.; Nierkens, S.; Bennink, E.J.; Frielink, C.; Toonen, L.W.; Boerman, O.C.; Figdor, C.G.; Ruers, T.J.; Adema, G.J. Efficient loading of dendritic cells following cryo and radiofrequency ablation in combination with immune modulation induces anti-tumour immunity. Br. J. Cancer 2006, 95, 896–905. [Google Scholar] [CrossRef] [PubMed]
- Dromi, S.A.; Walsh, M.P.; Herby, S.; Traughber, B.; Xie, J.; Sharma, K.V.; Sekhar, K.P.; Luk, A.; Liewehr, D.J.; Dreher, M.R.; et al. Radiofrequency ablation induces antigen-presenting cell infiltration and amplification of weak tumor-induced immunity. Radiology 2009, 251, 58–66. [Google Scholar] [CrossRef] [PubMed]
- Zerbini, A.; Pilli, M.; Penna, A.; Pelosi, G.; Schianchi, C.; Molinari, A.; Schivazappa, S.; Zibera, C.; Fagnoni, F.F.; Ferrari, C.; et al. Radiofrequency thermal ablation of hepatocellular carcinoma liver nodules can activate and enhance tumor-specific T-cell responses. Cancer Res. 2006, 66, 1139–1146. [Google Scholar] [CrossRef] [PubMed]
- Napoletano, C.; Taurino, F.; Biffoni, M.; De Majo, A.; Coscarella, G.; Bellati, F.; Rahimi, H.; Pauselli, S.; Pellicciotta, I.; Burchell, J.M.; et al. RFA strongly modulates the immune system and anti-tumor immune responses in metastatic liver patients. Int. J. Oncol. 2008, 32, 481–490. [Google Scholar] [CrossRef]
- Kieffer, Y.; Hocine, H.R.; Gentric, G.; Pelon, F.; Bernard, C.; Bourachot, B.; Lameiras, S.; Albergante, L.; Bonneau, C.; Guyard, A.; et al. Single-Cell Analysis Reveals Fibroblast Clusters Linked to Immunotherapy Resistance in Cancer. Cancer Discov. 2020, 10, 1330–1351. [Google Scholar] [CrossRef] [PubMed]
- Sahai, E.; Astsaturov, I.; Cukierman, E.; DeNardo, D.G.; Egeblad, M.; Evans, R.M.; Fearon, D.; Greten, F.R.; Hingorani, S.R.; Hunter, T.; et al. A framework for advancing our understanding of cancer-associated fibroblasts. Nat. Rev. Cancer 2020, 20, 174–186. [Google Scholar] [CrossRef]
- Neuzillet, C.; Tijeras-Raballand, A.; Ragulan, C.; Cros, J.; Patil, Y.; Martinet, M.; Erkan, M.; Kleeff, J.; Wilson, J.; Apte, M.; et al. Inter- and intra-tumoural heterogeneity in cancer-associated fibroblasts of human pancreatic ductal adenocarcinoma. J. Pathol. 2019, 248, 51–65. [Google Scholar] [CrossRef]
- Biffi, G.; Oni, T.E.; Spielman, B.; Hao, Y.; Elyada, E.; Park, Y.; Preall, J.; Tuveson, D.A. IL1-Induced JAK/STAT Signaling Is Antagonized by TGFβ to Shape CAF Heterogeneity in Pancreatic Ductal Adenocarcinoma. Cancer Discov. 2019, 9, 282–301. [Google Scholar] [CrossRef]
- Elyada, E.; Bolisetty, M.; Laise, P.; Flynn, W.F.; Courtois, E.T.; Burkhart, R.A.; Teinor, J.A.; Belleau, P.; Biffi, G.; Lucito, M.S.; et al. Cross-Species Single-Cell Analysis of Pancreatic Ductal Adenocarcinoma Reveals Antigen-Presenting Cancer-Associated Fibroblasts. Cancer Discov. 2019, 9, 1102–1123. [Google Scholar] [CrossRef]
- Ene-Obong, A.; Clear, A.J.; Watt, J.; Wang, J.; Fatah, R.; Riches, J.C.; Marshall, J.F.; Chin-Aleong, J.; Chelala, C.; Gribben, J.G.; et al. Activated pancreatic stellate cells sequester CD8+ T cells to reduce their infiltration of the juxtatumoral compartment of pancreatic ductal adenocarcinoma. Gastroenterology 2013, 145, 1121–1132. [Google Scholar] [CrossRef]
- Watt, J.; Kocher, H.M. The desmoplastic stroma of pancreatic cancer is a barrier to immune cell infiltration. Oncoimmunology 2013, 2, e26788. [Google Scholar] [CrossRef] [PubMed]
- Collisson, E.A.; Sadanandam, A.; Olson, P.; Gibb, W.J.; Truitt, M.; Gu, S.; Cooc, J.; Weinkle, J.; Kim, G.E.; Jakkula, L.; et al. Subtypes of pancreatic ductal adenocarcinoma and their differing responses to therapy. Nat. Med. 2011, 17, 500–503. [Google Scholar] [CrossRef]
- Bailey, P.; Chang, D.K.; Nones, K.; Johns, A.L.; Patch, A.M.; Gingras, M.C.; Miller, D.K.; Christ, A.N.; Bruxner, T.J.; Quinn, M.C.; et al. Genomic analyses identify molecular subtypes of pancreatic cancer. Nature 2016, 531, 47–52. [Google Scholar] [CrossRef] [PubMed]
- Moffitt, R.A.; Marayati, R.; Flate, E.L.; Volmar, K.E.; Loeza, S.G.; Hoadley, K.A.; Rashid, N.U.; Williams, L.A.; Eaton, S.C.; Chung, A.H.; et al. Virtual microdissection identifies distinct tumor- and stroma-specific subtypes of pancreatic ductal adenocarcinoma. Nat. Genet. 2015, 47, 1168–1178. [Google Scholar] [CrossRef] [PubMed]
- Corsiero, E.; Delvecchio, F.R.; Bombardieri, M.; Pitzalis, C. B cells in the formation of tertiary lymphoid organs in autoimmunity, transplantation and tumorigenesis. Curr. Opin. Immunol. 2019, 57, 46–52. [Google Scholar] [CrossRef]
- Gunderson, A.J.; Rajamanickam, V.; Bui, C.; Bernard, B.; Pucilowska, J.; Ballesteros-Merino, C.; Schmidt, M.; McCarty, K.; Philips, M.; Piening, B.; et al. Germinal center reactions in tertiary lymphoid structures associate with neoantigen burden, humoral immunity and long-term survivorship in pancreatic cancer. Oncoimmunology 2021, 10, 1900635. [Google Scholar] [CrossRef]
- Fincham, R.E.A.; Delvecchio, F.R.; Goulart, M.R.; Yeong, J.P.S.; Kocher, H.M. Natural killer cells in pancreatic cancer stroma. World J. Gastroenterol. 2021, 27, 3483–3501. [Google Scholar] [CrossRef]
- Cho, J.H.; Jang, S.I.; Lee, D.K. Recent developments in endoscopic ultrasound-guided radiofrequency ablation for pancreatic lesions. Int. J. Gastrointest. Interv. 2020, 9, 170–176. [Google Scholar] [CrossRef]
- Ragulan, C.; Eason, K.; Fontana, E.; Nyamundanda, G.; Tarazona, N.; Patil, Y.; Poudel, P.; Lawlor, R.T.; Del Rio, M.; Koo, S.L.; et al. Analytical Validation of Multiplex Biomarker Assay to Stratify Colorectal Cancer into Molecular Subtypes. Sci. Rep. 2019, 9, 7665. [Google Scholar] [CrossRef]
- Forero, A.; Ozarkar, S.; Li, H.; Lee, C.H.; Hemann, E.A.; Nadjsombati, M.S.; Hendricks, M.R.; So, L.; Green, R.; Roy, C.N.; et al. Differential Activation of the Transcription Factor IRF1 Underlies the Distinct Immune Responses Elicited by Type I and Type III Interferons. Immunity 2019, 51, 451–464.e6. [Google Scholar] [CrossRef]
- Fulkerson, P.C.; Zimmermann, N.; Hassman, L.M.; Finkelman, F.D.; Rothenberg, M.E. Pulmonary chemokine expression is coordinately regulated by STAT1, STAT6, and IFN-gamma. J. Immunol. 2004, 173, 7565–7574. [Google Scholar] [CrossRef] [PubMed]
- Weng, N.; Araki, Y.P.; Subedi, K. The molecular basis of the memory T cell response: Differential gene expression and its epigenetic regulation. Nat. Rev. Immunol. 2012, 12, 306–315. [Google Scholar] [CrossRef] [PubMed]
- Newman, A.M.; Liu, C.L.; Green, M.R.; Gentles, A.J.; Feng, W.; Xu, Y.; Hoang, C.D.; Diehn, M.; Alizadeh, A.A. Robust enumeration of cell subsets from tissue expression profiles. Nat. Methods 2015, 12, 453–457. [Google Scholar] [CrossRef]
- Szabo, P.A.; Levitin, H.M.; Miron, M.; Snyder, M.E.; Senda, T.; Yuan, J.; Cheng, Y.L.; Bush, E.C.; Dogra, P.; Thapa, P.; et al. Single-cell transcriptomics of human T cells reveals tissue and activation signatures in health and disease. Nat. Commun. 2019, 10, 4706. [Google Scholar] [CrossRef] [PubMed]
- Zheng, C.; Zheng, L.; Yoo, J.K.; Guo, H.; Zhang, Y.; Guo, X.; Kang, B.; Hu, R.; Huang, J.Y.; Zhang, Q.; et al. Landscape of Infiltrating T Cells in Liver Cancer Revealed by Single-Cell Sequencing. Cell. 2017, 169, 1342–1356.e16. [Google Scholar] [CrossRef]
- Hoshida, Y. Nearest template prediction: A single-sample-based flexible class prediction with confidence assessment. PLoS ONE 2010, 5, e15543. [Google Scholar] [CrossRef]
- Bachem, M.G.; Schneider, E.; Gross, H.; Weidenbach, H.; Schmid, R.M.; Menke, A.; Siech, M.; Beger, H.; Grünert, A.; Adler, G. Identification, culture, and characterization of pancreatic stellate cells in rats and humans. Gastroenterology 1998, 115, 421–432. [Google Scholar] [CrossRef]
- Apte, M.V.; Haber, P.S.; Applegate, T.L.; Norton, I.D.; McCaughan, G.W.; Korsten, M.A.; Pirola, R.C.; Wilson, J.S. Periacinar stellate shaped cells in rat pancreas: Identification, isolation, and culture. Gut 1998, 43, 128–133. [Google Scholar] [CrossRef]
- Asano, Y.; Kashiwagi, S.; Goto, W.; Kurata, K.; Noda, S.; Takashima, T.; Onoda, N.; Tanaka, S.; Ohsawa, M.; Hirakawa, K. Tumour-infiltrating CD8 to FOXP3 lymphocyte ratio in predicting treatment responses to neoadjuvant chemotherapy of aggressive breast cancer. Br. J. Surg. 2016, 103, 845–854. [Google Scholar] [CrossRef]
- Goto, W.; Kashiwagi, S.; Asano, Y.; Takada, K.; Takahashi, K.; Hatano, T.; Takashima, T.; Tomita, S.; Motomura, H.; Ohsawa, M.; et al. Predictive value of improvement in the immune tumour microenvironment in patients with breast cancer treated with neoadjuvant chemotherapy. ESMO Open 2018, 3, e000305. [Google Scholar] [CrossRef]
- Suzuki, H.; Chikazawa, N.; Tasaka, T.; Wada, J.; Yamasaki, A.; Kitaura, Y.; Sozaki, M.; Tanaka, M.; Onishi, H.; Morisaki, T.; et al. Intratumoral CD8(+) T/FOXP3 (+) cell ratio is a predictive marker for survival in patients with colorectal cancer. Cancer Immunol. Immunother. 2010, 59, 653–661. [Google Scholar] [CrossRef] [PubMed]
- Blumberg, R.S.; Gerdes, D.; Chott, A.; Porcelli, S.A.; Balk, S.P. Structure and function of the CD1 family of MHC-like cell surface proteins. Immunol. Rev. 1995, 147, 5–29. [Google Scholar] [CrossRef]
- Angenieux, C.; Salamero, J.; Fricker, D.; Cazenave, J.P.; Goud, B.; Hanau, D.; de La Salle, H. Characterization of CD1e, a third type of CD1 molecule expressed in dendritic cells. J. Biol. Chem. 2000, 275, 37757–37764. [Google Scholar] [CrossRef]
- Majumder, P.; Gomez, J.A.; Boss, J.M. The human major histocompatibility complex class II HLA-DRB1 and HLA-DQA1 genes are separated by a CTCF-binding enhancer-blocking element. J. Biol. Chem. 2006, 281, 18435–18443. [Google Scholar] [CrossRef]
- Overman, M.J.; McDermott, R.; Leach, J.L.; Lonardi, S.; Lenz, H.J.; Morse, M.A.; Desai, J.; Hill, A.; Axelson, M.; Moss, R.A.; et al. Nivolumab in patients with metastatic DNA mismatch repair-deficient or microsatellite instability-high colorectal cancer (CheckMate 142): An open-label, multicentre, phase 2 study. Lancet Oncol. 2017, 18, 1182–1191. [Google Scholar] [CrossRef]
- Hodi, F.S.; Chiarion-Sileni, V.; Gonzalez, R.; Grob, J.J.; Rutkowski, P.; Cowey, C.L.; Lao, C.D.; Schadendorf, D.; Wagstaff, J.; Dummer, R.; et al. Nivolumab plus ipilimumab or nivolumab alone versus ipilimumab alone in advanced melanoma (CheckMate 067): 4-year outcomes of a multicentre, randomised, phase 3 trial. Lancet Oncol. 2018, 19, 1480–1492. [Google Scholar] [CrossRef]
- Larkin, J.; Chiarion-Sileni, V.; Gonzalez, R.; Grob, J.J.; Rutkowski, P.; Lao, C.D.; Cowey, C.L.; Schadendorf, D.; Wagstaff, J.; Dummer, R.; et al. Five-Year Survival with Combined Nivolumab and Ipilimumab in Advanced Melanoma. N. Engl. J. Med. 2019, 381, 1535–1546. [Google Scholar] [CrossRef] [PubMed]
- Livraghi, T.; Goldberg, S.N.; Lazzaroni, S.; Meloni, F.; Ierace, T.; Solbiati, L.; Gazelle, G.S. Hepatocellular carcinoma: Radio-frequency ablation of medium and large lesions. Radiology 2000, 214, 761–768. [Google Scholar] [CrossRef]
- Li, N.F.; Kocher, H.M.; Salako, M.A.; Obermueller, E.; Sandle, J.; Balkwill, F. A novel function of colony-stimulating factor 1 receptor in hTERT immortalization of human epithelial cells. Oncogene 2009, 28, 773–780. [Google Scholar] [CrossRef]
- Froeling, F.E.; Mirza, T.A.; Feakins, R.M.; Seedhar, A.; Elia, G.; Hart, I.R.; Kocher, H.M. Organotypic Culture Model of Pancreatic Cancer Demonstrates that Stromal Cells Modulate E-Cadherin, β-Catenin, and Ezrin Expression in Tumor Cells. Am. J. Pathol. 2009, 175, 636. [Google Scholar] [CrossRef]


Publisher’s Note: MDPI stays neutral with regard to jurisdictional claims in published maps and institutional affiliations. |
© 2022 by the authors. Licensee MDPI, Basel, Switzerland. This article is an open access article distributed under the terms and conditions of the Creative Commons Attribution (CC BY) license (https://creativecommons.org/licenses/by/4.0/).
Share and Cite
Lawrence, P.V.; Desai, K.; Wadsworth, C.; Mangal, N.; Kocher, H.M.; Habib, N.; Sadanandam, A.; Sodergren, M.H. A Case Report on Longitudinal Collection of Tumour Biopsies for Gene Expression-Based Tumour Microenvironment Analysis from Pancreatic Cancer Patients Treated with Endoscopic Ultrasound Guided Radiofrequency Ablation. Curr. Oncol. 2022, 29, 6754-6763. https://doi.org/10.3390/curroncol29100531
Lawrence PV, Desai K, Wadsworth C, Mangal N, Kocher HM, Habib N, Sadanandam A, Sodergren MH. A Case Report on Longitudinal Collection of Tumour Biopsies for Gene Expression-Based Tumour Microenvironment Analysis from Pancreatic Cancer Patients Treated with Endoscopic Ultrasound Guided Radiofrequency Ablation. Current Oncology. 2022; 29(10):6754-6763. https://doi.org/10.3390/curroncol29100531
Chicago/Turabian StyleLawrence, Patrick V., Krisha Desai, Christopher Wadsworth, Nagina Mangal, Hemant M. Kocher, Nagy Habib, Anguraj Sadanandam, and Mikael H. Sodergren. 2022. "A Case Report on Longitudinal Collection of Tumour Biopsies for Gene Expression-Based Tumour Microenvironment Analysis from Pancreatic Cancer Patients Treated with Endoscopic Ultrasound Guided Radiofrequency Ablation" Current Oncology 29, no. 10: 6754-6763. https://doi.org/10.3390/curroncol29100531
APA StyleLawrence, P. V., Desai, K., Wadsworth, C., Mangal, N., Kocher, H. M., Habib, N., Sadanandam, A., & Sodergren, M. H. (2022). A Case Report on Longitudinal Collection of Tumour Biopsies for Gene Expression-Based Tumour Microenvironment Analysis from Pancreatic Cancer Patients Treated with Endoscopic Ultrasound Guided Radiofrequency Ablation. Current Oncology, 29(10), 6754-6763. https://doi.org/10.3390/curroncol29100531