Body Composition as a Predictor of Toxicity and Prognosis in Patients with Diffuse Large B-Cell Lymphoma Receiving R-CHOP Immunochemotherapy

Abstract
1. Introduction
2. Materials and Methods
2.1. Participants
2.2. Toxicity Grading and Follow-Up
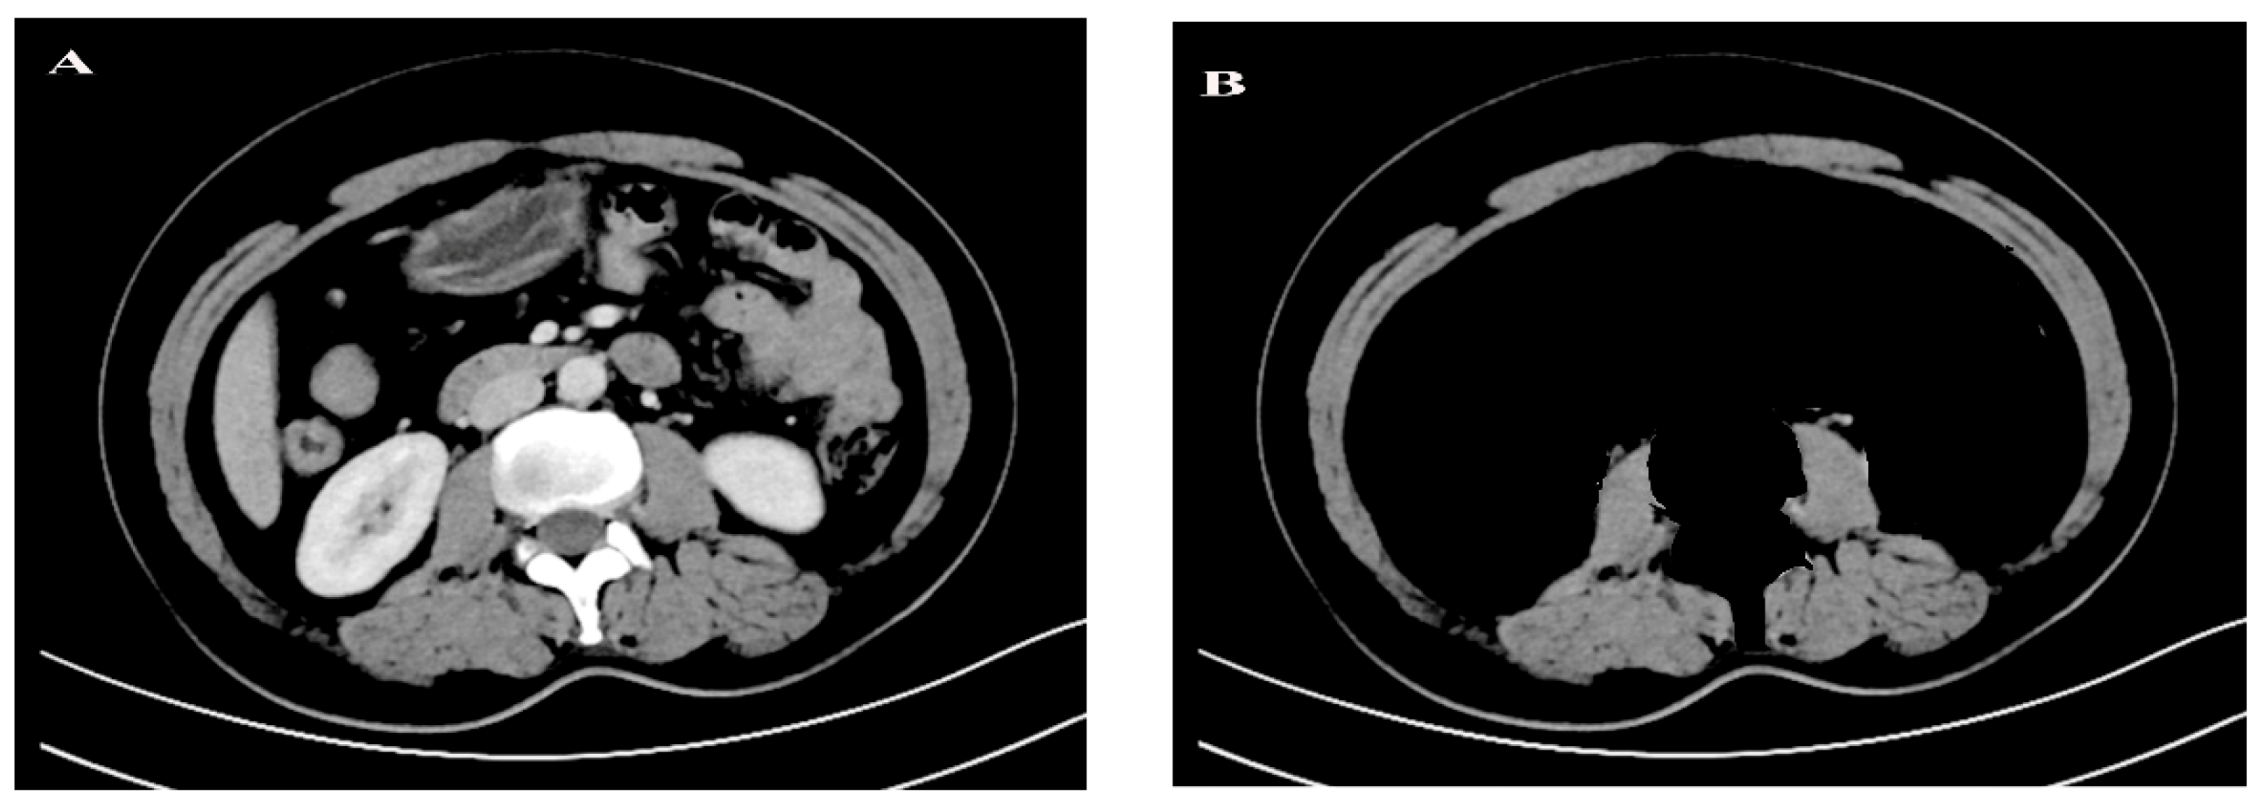
2.3. CT-Based Body Composition Analysis
2.4. Statistical Analysis
3. Results
3.1. Baseline Characteristics
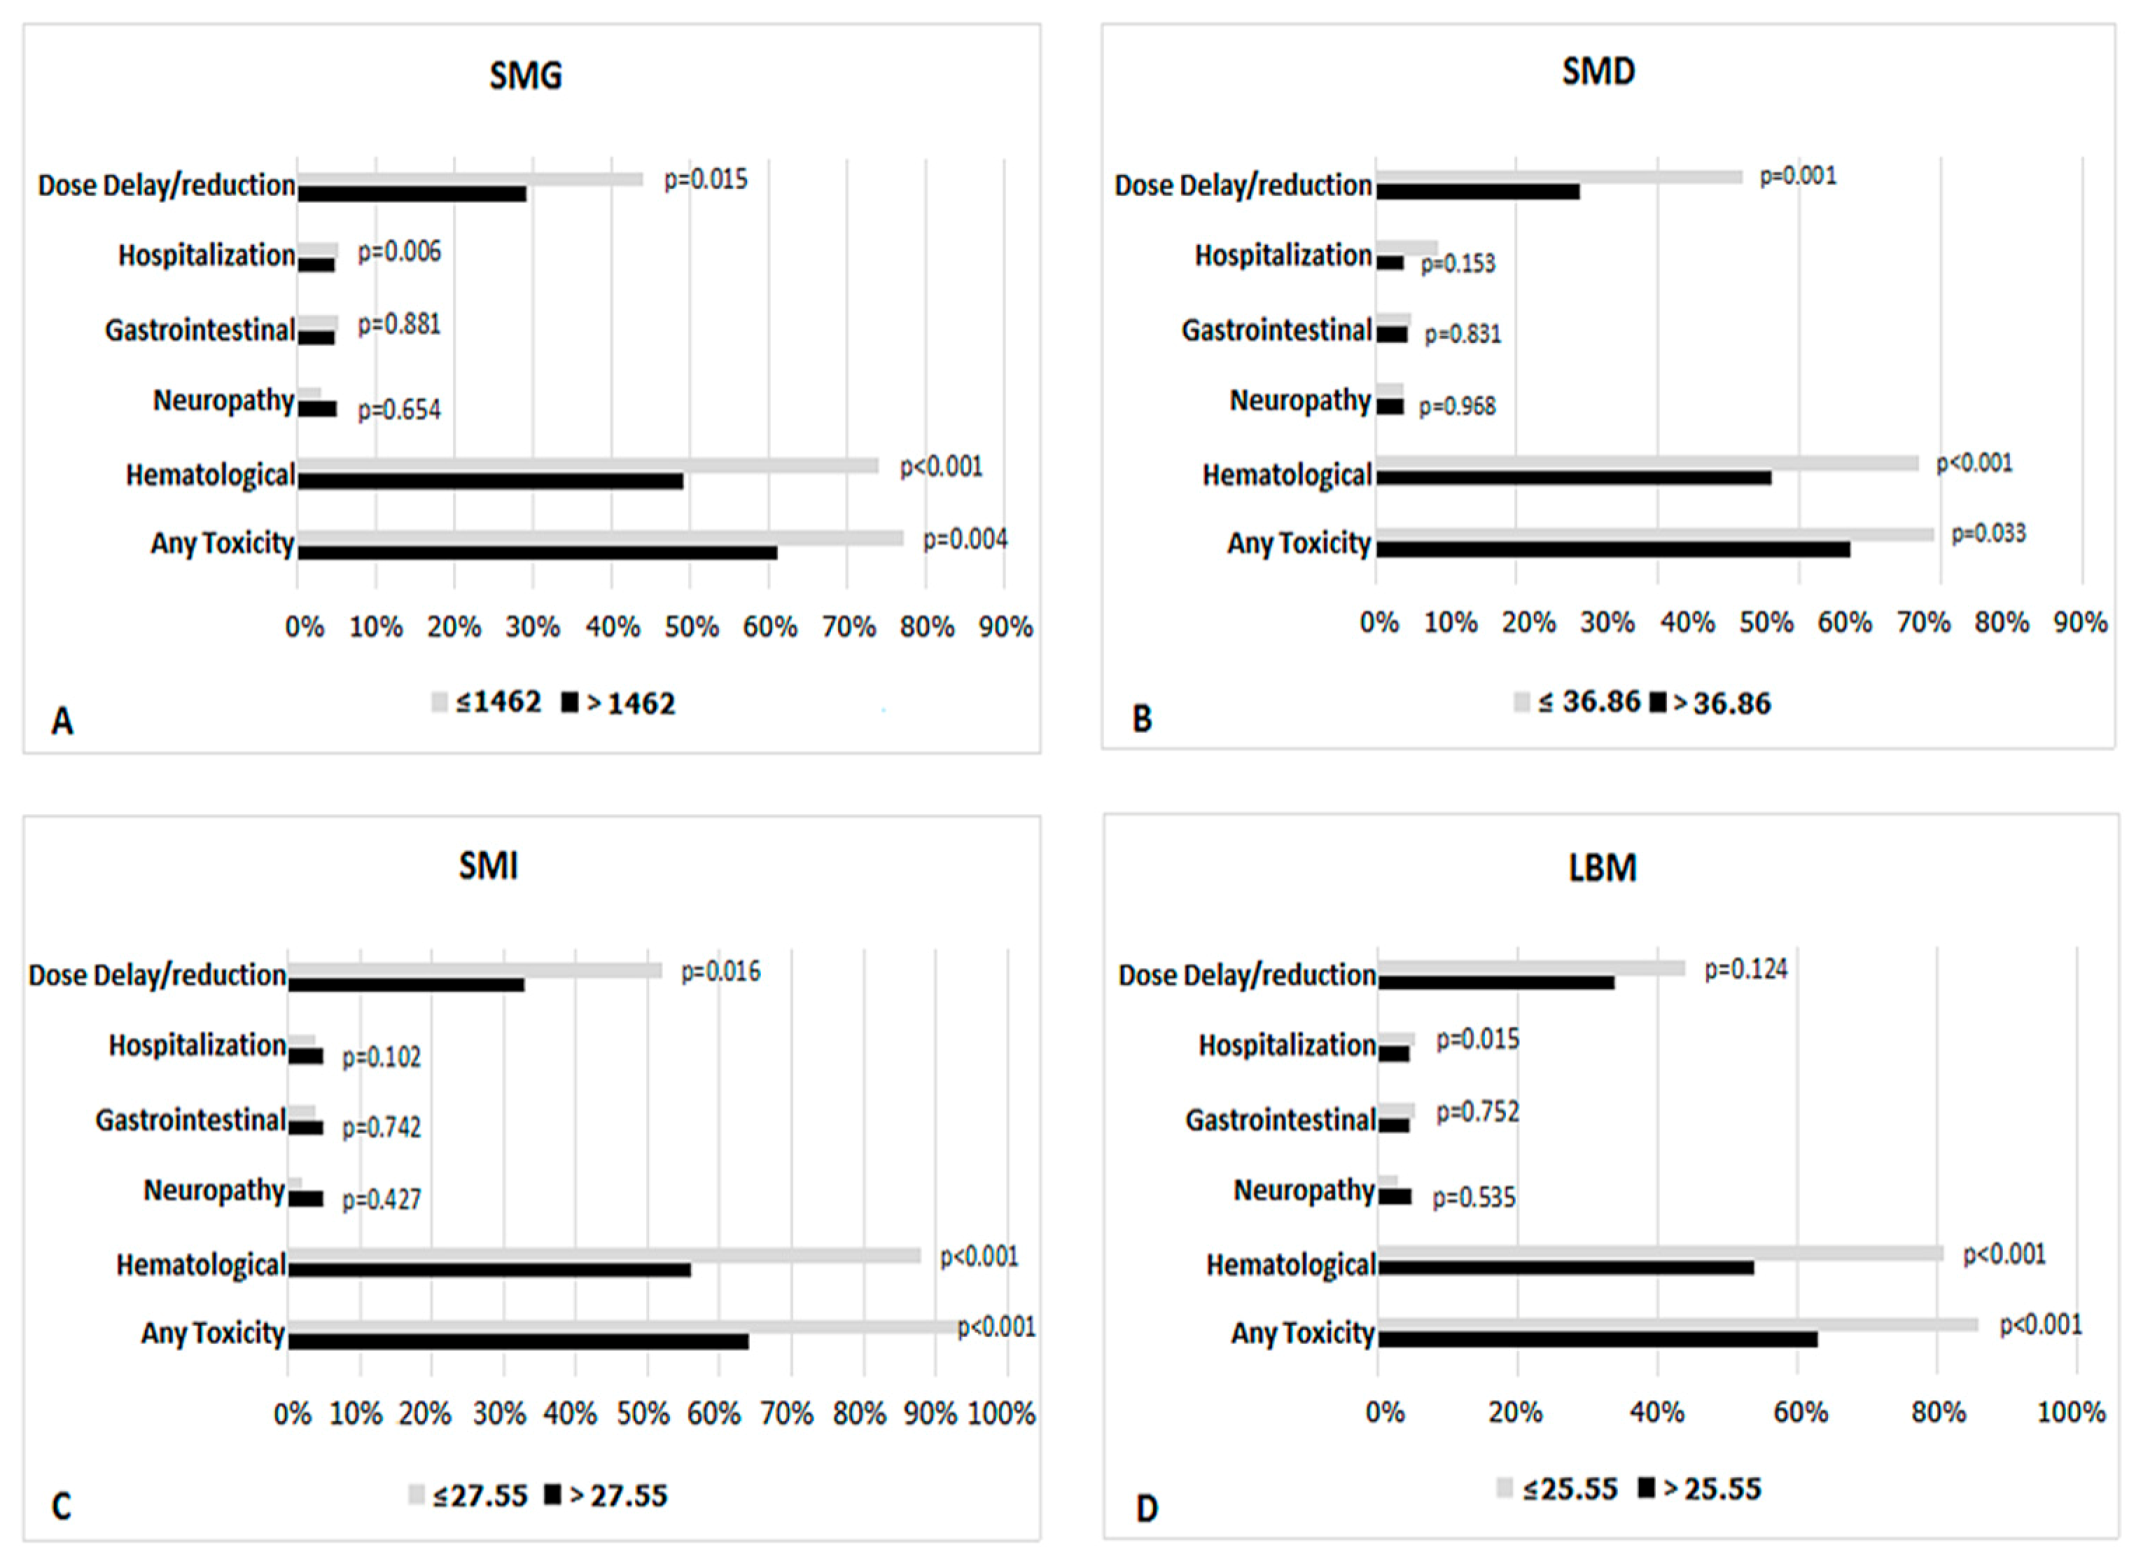
3.2. Body Composition Predicts Toxicity
3.3. Body Composition Predicts Dose Delay/Reduction
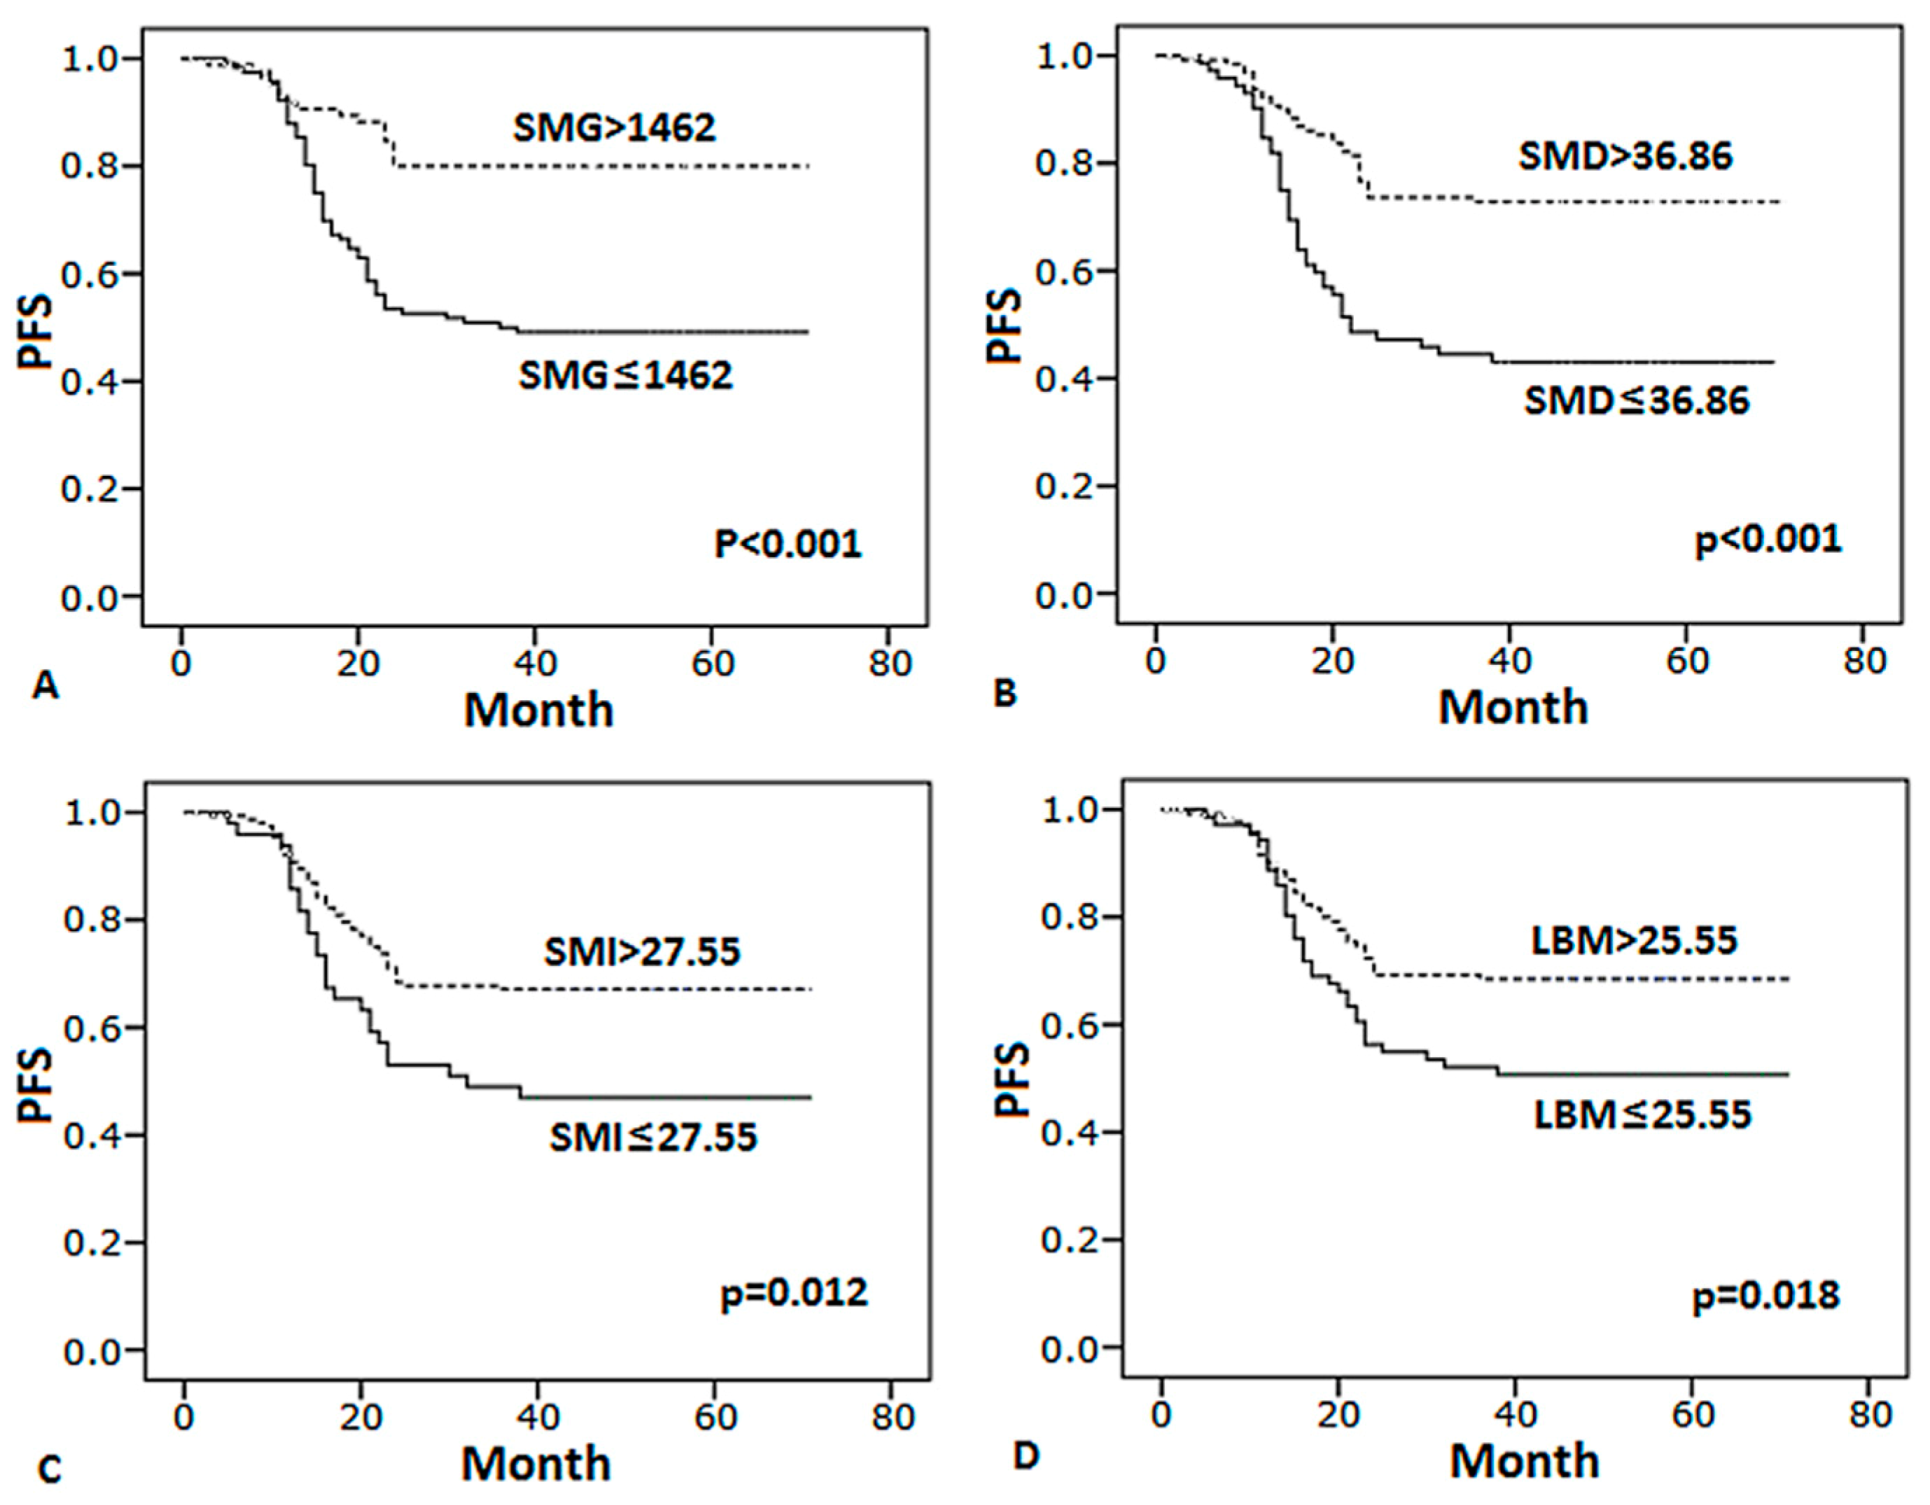
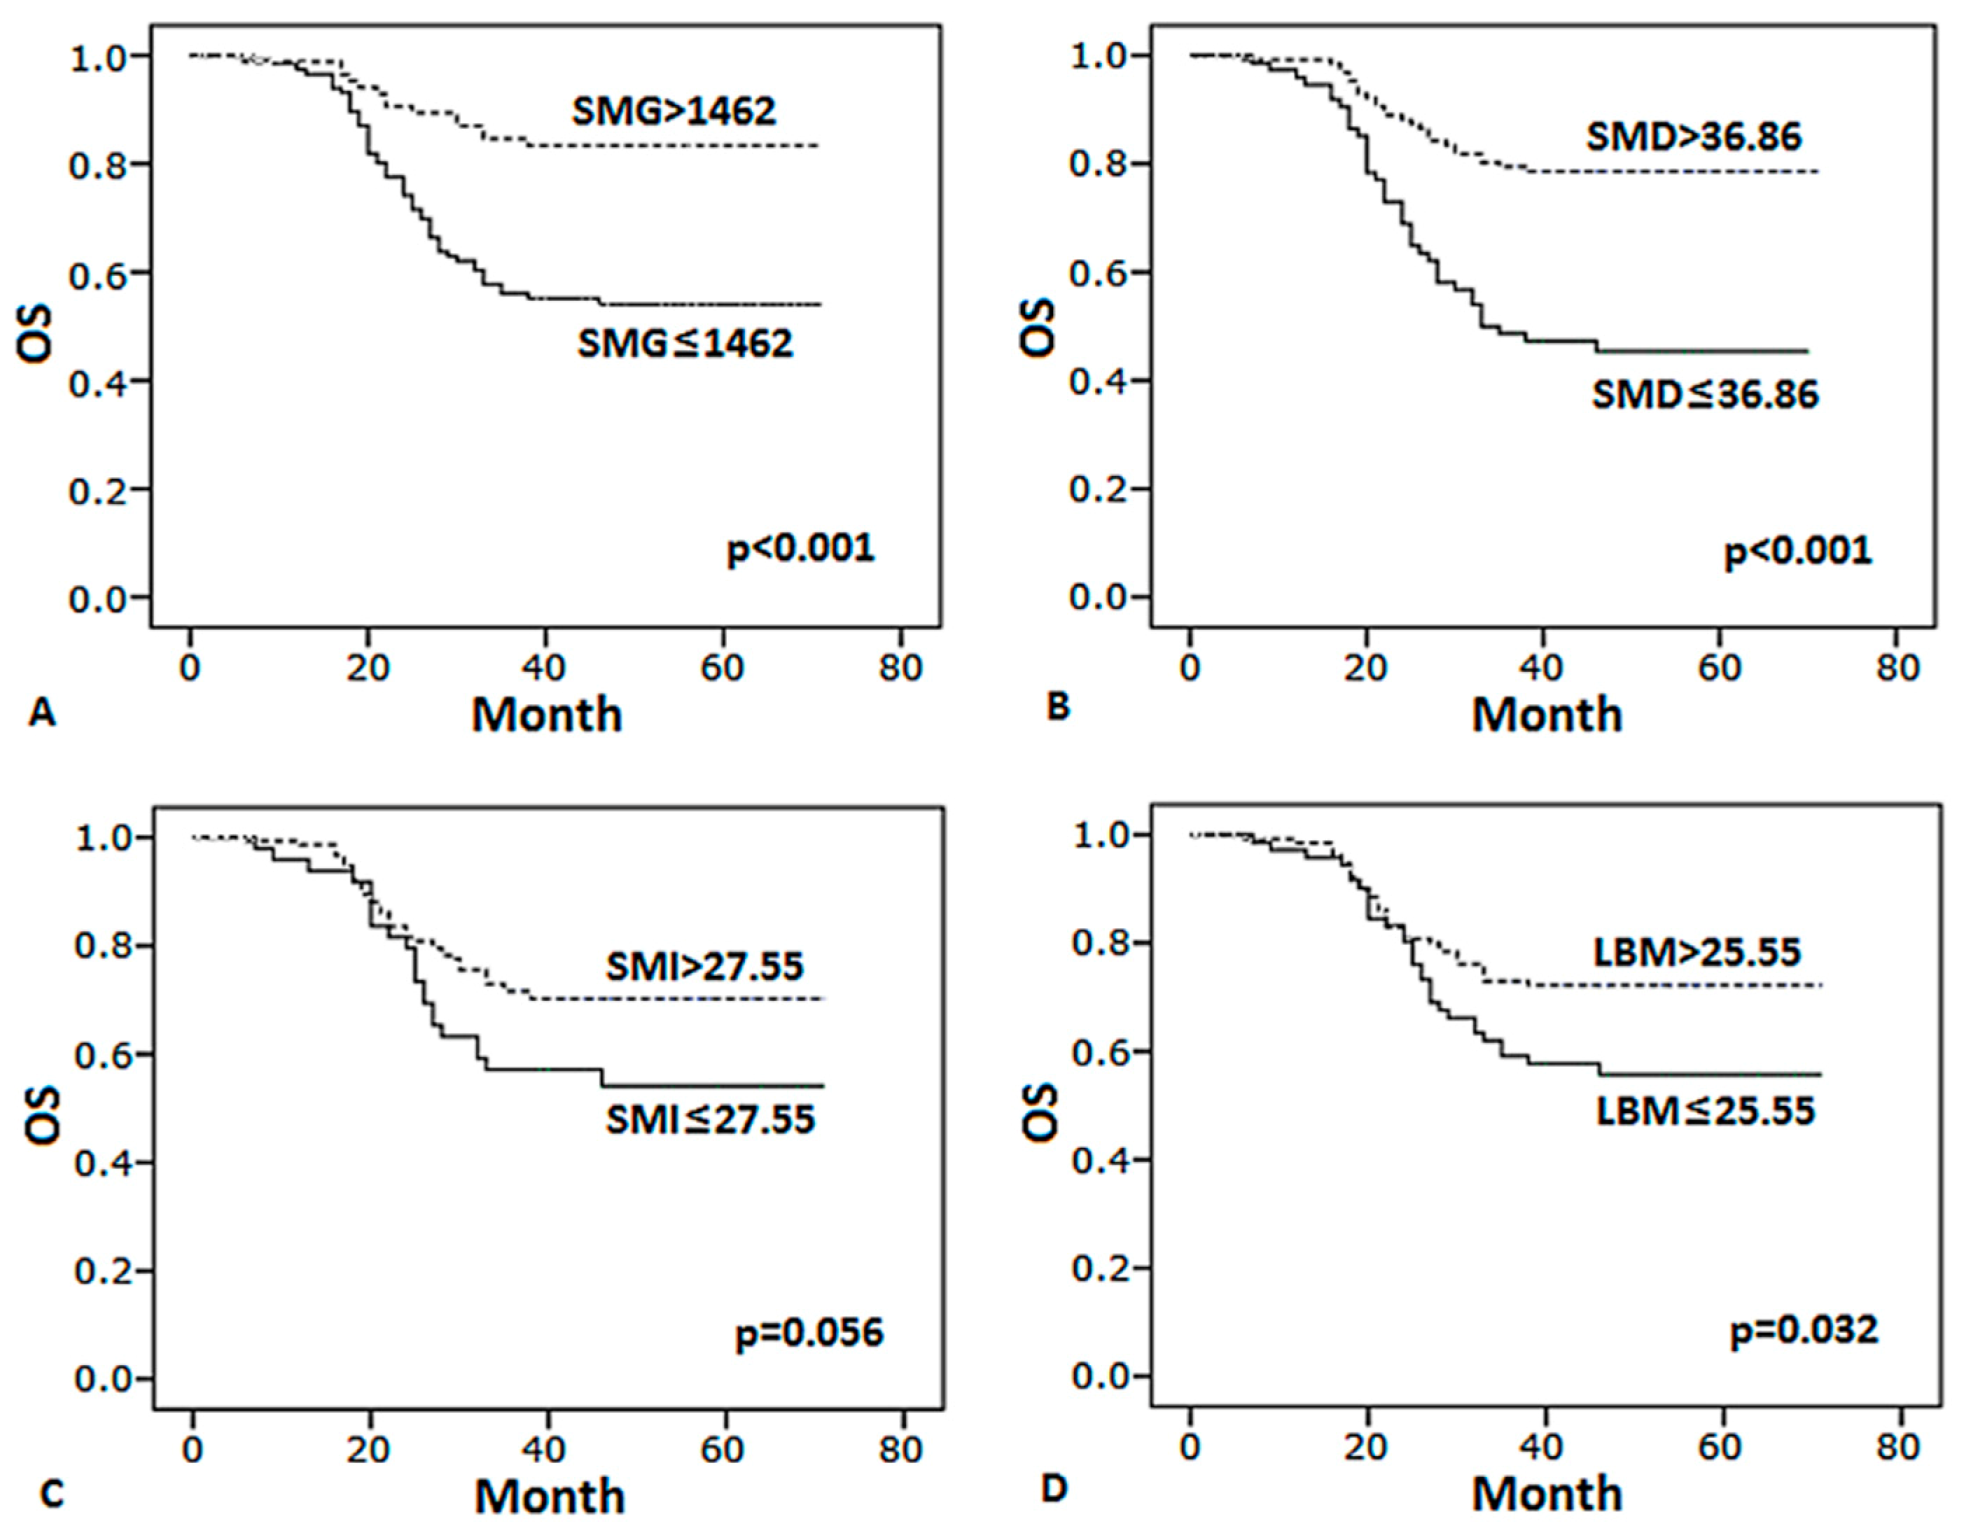
3.4. Body Composition Predicts Survival
4. Discussion
5. Conclusions
Supplementary Materials
Author Contributions
Funding
Institutional Review Board Statement
Informed Consent Statement
Data Availability Statement
Acknowledgments
Conflicts of Interest
References
- Camicia, R.; Winkler, H.C.; Hassa, P.O. Novel drug targets for personalized precision medicine in relapsed/refractory diffuse large B-cell lym-phoma: A comprehensive review. Mol. Cancer 2015, 14, 207. [Google Scholar] [CrossRef] [PubMed]
- Huang, J.-J.; Xia, Y.; Wang, Y.; Liu, P.-P.; Bi, X.-W.; Sun, P.; Lin, T.-Y.; Jiang, W.-Q.; Li, Z.-M. A comparison of R-EPOCH and R-CHOP as a first-line regimen in de novo DLBCL patients with high Ki-67 expression in a single institution. Oncotarget 2016, 7, 41242–41250. [Google Scholar] [CrossRef]
- Testoni, M.; Zucca, E.; Young, K.H.; Bertoni, F. Genetic lesions in diffuse large B-cell lymphomas. Ann. Oncol. 2015, 26, 1069–1080. [Google Scholar] [CrossRef] [PubMed]
- Araie, H.; Sakamaki, I.; Matsuda, Y.; Tai, K.; Ikegaya, S.; Itoh, K.; Kishi, S.; Oiwa, K.; Okura, M.; Tasaki, T.; et al. 3A Comparison between R-THP-COP and R-CHOP Regimens for the Treatment of Diffuse Large B-cell Lymphoma in Old Patients: A Single-institution Analysis. Intern. Med. 2017, 56, 2407–2413. [Google Scholar] [CrossRef]
- Intragumtornchai, T.; Sutheesophon, J.; Sutcharitchan, P.; Swasdikul, D. A predictive model for life-threatening neutropenia and febrile neutropenia after the first course of CHOP chemotherapy in patients with aggressive non-Hodgkin’s lymphoma. Leuk. Lymphoma 2000, 37, 351–360. [Google Scholar] [CrossRef]
- Baumgartner, R.N.; Koehler, K.M.; Gallagher, D.; Romero, L.; Heymsfield, S.B.; Ross, R.R.; Garry, P.J.; Lindeman, R.D. Epidemiology of Sarcopenia among the Elderly in New Mexico. Am. J. Epidemiol. 1998, 147, 755–763. [Google Scholar] [CrossRef] [PubMed]
- Shachar, S.S.; Williams, G.R.; Muss, H.B.; Nishijima, T.F. Prognostic value of sarcopenia in adults with solid tumours: A meta-analysis and systematic review. Eur. J. Cancer 2016, 57, 58–67. [Google Scholar] [CrossRef]
- Fung, E.B.; Xu, Y.; Kwiatkowski, J.L.; Vogiatzi, M.G.; Neufeld, E.; Olivieri, N.; Vichinsky, E.P.; Giardina, P.J. Relationship between Chronic Transfusion Therapy and Body Composition in Subjects with Thalassemia. J. Pediatr. 2010, 157, 641–647.e2. [Google Scholar] [CrossRef]
- Boudou-Rouquette, P.; Narjoz, C.; Golmard, J.L.; Thomas-Schoemann, A.; Mir, O.; Taieb, F.; Durand, J.; Coriat, R.; Dauphin, A.; Vidal, M.; et al. Early sorafenib-induced toxicity is associated with drug exposure and UGTIA9 genetic poly-morphism in patients with solid tumors: A preliminary study. PLoS ONE 2012, 7, e42875. [Google Scholar] [CrossRef] [PubMed]
- Ilich, A.I.; Danilak, M.; Kim, C.A.; Mulder, K.E.; Spratlin, J.L.; Chambers, C.R.; Ghosh, S.; Sawyer, M.B. Effects of gender on capecitabine toxicity in colorectal cancer. J. Oncol. Pharm. Pract. 2015, 22, 454–460. [Google Scholar] [CrossRef]
- Ali, R.; Baracos, V.E.; Sawyer, M.B.; Bianchi, L.; Roberts, S.; Assenat, E.; Mollevi, C.; Senesse, P. Lean body mass as an independent determinant of dose-limiting toxicity and neuropathy in patients with colon cancer treated with FOLFOX regimens. Cancer Med. 2016, 5, 607–616. [Google Scholar] [CrossRef] [PubMed]
- Gusella, M.; Toso, S.; Ferrazzi, E.; Ferrari, M.; Padrini, R. Relationships between body composition parameters and fluorouracil pharmacokinetics. Br. J. Clin. Pharmacol. 2002, 54, 131–139. [Google Scholar] [CrossRef] [PubMed]
- Gurney, H.P.; Ackland, S.; Gebski, V.; Farrell, G. Factors affecting epirubicin pharmacokinetics and toxicity: Evidence against using body-surface area for dose calculation. J. Clin. Oncol. 1998, 16, 2299–2304. [Google Scholar] [CrossRef]
- Müller, M.J.; Baracos, V.; Bosy-Westphal, A.; Dulloo, A.G.; Eckel, J.; Fearon, K.C.H.; Hall, K.D.; Pietrobelli, A.; Sørensen, T.I.A.; Speakman, J.; et al. Functional body composition and related aspects in research on obesity and cachexia: Report on the 12th Stock Conference held on 6 and 7 September 2013 in Hamburg, Germany. Obes. Rev. 2014, 15, 640–656. [Google Scholar] [CrossRef] [PubMed]
- Aslani, A.; Smith, R.C.; Allen, B.J.; Pavlakis, N.; Levi, J.A. The predictive value of body protein for chemotherapy-induced toxicity. Cancer 2000, 88, 796–803. [Google Scholar] [CrossRef]
- Wu, W.; Liu, X.; Chaftari, P.; Carreras, M.T.C.; Gonzalez, C.; Viets-Upchurch, J.; Merriman, K.; Tu, S.; Dalal, S.; Yeung, S.J. Association of body composition with outcome of docetaxel chemotherapy in metastatic prostate cancer: A retro-spective review. PLoS ONE 2015, 10, e0122047. [Google Scholar] [CrossRef] [PubMed]
- Prado, C.M.; Lieffers, J.R.; McCargar, L.J.; Reiman, T.; Sawyer, M.B.; Martin, L.; Baracos, V.E. Prevalence and clinical implications of sarcopenic obesity in patients with solid tumours of the respiratory and gastrointestinal tracts: A population-based study. Lancet Oncol. 2008, 9, 629–635. [Google Scholar] [CrossRef]
- Sjøblom, B.; Grønberg, B.H.; Benth, J.Š.; Baracos, V.E.; Fløtten, Ø.; Hjermstad, M.J.; Aass, N.; Jordhoy, M.S. Low muscle mass is associated with chemotherapy-induced haematological toxicity in advanced non-small cell lung cancer. Lung Cancer 2015, 90, 85–91. [Google Scholar] [CrossRef]
- Santini, F.; Pinchera, A.; Marsili, A.; Ceccarini, G.; Castagna, M.G.; Valeriano, R.; Giannetti, M.; Taddei, D.; Centoni, R.; Scartabelli, G.; et al. Lean Body Mass Is a Major Determinant of Levothyroxine Dosage in the Treatment of Thyroid Diseases. J. Clin. Endocrinol. Metab. 2005, 90, 124–127. [Google Scholar] [CrossRef]
- Morgan, D.J.; Bray, K.M. Lean Body Mass as a Predictor of Drug Dosage. Implications for Drug Therapy. Clin. Pharmacokinet. 1994, 26, 292–307. [Google Scholar] [CrossRef]
- Daly, L.E.; Power, D.G.; O’Reilly, Á.; Donnellan, P.; Cushen, S.J.; O’Sullivan, K.; Twomey, M.; Woodlock, D.P.; Redmond, H.P.; Ryan, A.M. The impact of body composition parameters on ipilimumab toxicity and survival in patients with metastatic melanoma. Br. J. Cancer 2017, 116, 310–317. [Google Scholar] [CrossRef]
- Martin, L.; Birdsell, L.; MacDonald, N.; Reiman, T.; Clandinin, M.T.; McCargar, L.J.; Murphy, R.; Ghosh, S.; Sawyer, M.B.; Baracos, V.E. Cancer Cachexia in the Age of Obesity: Skeletal Muscle Depletion Is a Powerful Prognostic Factor, Independent of Body Mass Index. J. Clin. Oncol. 2013, 31, 1539–1547. [Google Scholar] [CrossRef]
- Iwase, T.; Sangai, T.; Nagashima, T.; Sakakibara, M.; Sakakibara, J.; Hayama, S.; Miyazaki, M. Impact of body fat distribution on neoadjuvant chemotherapy outcomes in advanced breast cancer patients. Cancer Med. 2016, 5, 41–48. [Google Scholar] [CrossRef] [PubMed]
- Shachar, S.S.; Deal, A.M.; Weinberg, M.; Nyrop, K.A.; Williams, G.R.; Nishijima, T.F.; Benbow, J.M.; Muss, H.B. Skeletal Muscle Measures as Predictors of Toxicity, Hospitalization, and Survival in Patients with Met-astatic Breast Cancer Receiving Taxane-Based Chemotherapy. Clin. Cancer Res. 2017, 23, 658–665. [Google Scholar] [CrossRef] [PubMed]
- Lanic, H.; Kraut-Tauzia, J.; Modzelewski, R.; Clatot, F.; Mareschal, S.; Picquenot, J.M.; Stamatoullas, A.; Leprêtre, S.; Tilly, H.; Jardin, F. Sarcopenia is an independent prognostic factor in elderly patients with diffuse large B-cell lymphoma treated with immunochemotherapy. Leuk. Lymphoma 2013, 55, 817–823. [Google Scholar] [CrossRef] [PubMed]
- Chu, M.P.; Lieffers, J.; Ghosh, S.; Belch, A.R.; Chua, N.S.; Fontaine, A.; Sangha, R.; Turner, A.R.; Baracos, V.E.; Sawyer, M.B. Skeletal Muscle Radio-Density Is an Independent Predictor of Response and Outcomes in Follicular Lymphoma Treated with Chemoimmunotherapy. PLoS ONE 2015, 10, e0127589. [Google Scholar] [CrossRef]
- Shachar, S.S.; Deal, A.M.; Weinberg, M.; Williams, G.R.; Nyrop, K.A.; Popuri, K.; Choi, S.K.; Muss, H.B. Body Composition as a Predictor of Toxicity in Patients Receiving Anthracycline and Taxane–Based Chemotherapy for Early-Stage Breast Cancer. Clin. Cancer Res. 2017, 23, 3537–3543. [Google Scholar] [CrossRef]
- Müller, C.; Murawski, N.; Wiesen, M.H.J.; Held, G.; Poeschel, V.; Zeynalova, S.; Wenger, M.; Nickenig, C.; Peter, N.; Lengfelder, E.; et al. The role of sex and weight on rituximab clearance and serum elimination half-life in elderly patients with DLBCL. Blood 2012, 119, 3276–3284. [Google Scholar] [CrossRef]
- Riihijärvi, S.; Taskinen, M.; Jerkeman, M.; Leppä, S. Male gender is an adverse prognostic factor in B-cell lymphoma patients treated with immunochemo-therapy. Eur. J. Haematol. 2011, 86, 124–128. [Google Scholar] [CrossRef]


| Characteristic | All Patients (n = 201) | Sex | p-Value | |
|---|---|---|---|---|
| Male (n = 114) | Female (n = 87) | |||
| Age, years | 56.9 ± 11.4 | 57.7 ± 11.3 | 56 ± 11.4 | 0.307 |
| Age < 65 years, n (%) | 147 (73) | 80 (70) | 67 (77) | 0.605 |
| Age ≥ 65 years, n (%) | 54 (27) | 34 (30) | 20 (23) | 0.599 |
| Disease stage, n (%) | 0.682 | |||
| I | 16 (7.9) | 5 (4.3) | 11 (12.6) | |
| II | 72 (35.8) | 43 (37.7) | 29 (33.3) | |
| III | 77 (38.3) | 49 (43) | 28 (32.1) | |
| IV | 36 (17.9) | 17 (15) | 19 (21.8) | |
| LDH | 0.512 | |||
| normal | 107 (53.2) | 63 (55.3) | 44 (50.6) | |
| abnormal | 94 (46.8) | 51 (44.7) | 43 (49.4) | |
| IPI score | 0.842 | |||
| 0–2 | 164 (81.6) | 95 (83.3) | 68 (78.2) | |
| 3–4 | 37 (18.4) | 19 (16.7) | 19 (21.8) | |
| BMI, kg/m2 | 23.1 ± 3.1 | 23.4 ± 3.1 | 22.7 ± 3.2 | 0.132 |
| BMI group, n (%) | 0.132 | |||
| BMI < 20 | 30 (14.9) | 14 (12.3) | 15 (17.2) | |
| BMI 20–24.9 | 112 (55.7) | 60 (52.6) | 52 (61) | |
| BMI > 25 | 59 (29.4) | 41 (35.1) | 19 (21.8) | |
| Skeletal muscle area, cm2 | 95.4 ± 29.7 | 111.6 ± 25.2 | 74.1 ± 20.2 | <0.001 |
| Skeletal muscle gauge, AU | 1350.7 ± 524 | 1583 ± 472.8 | 1046.3 ± 423.6 | <0.001 |
| Skeletal muscle index, cm2/m2 | 34 ± 9.2 | 38.2 ± 8.3 | 28.6 ± 7.3 | <0.001 |
| Skeletal muscle radiodensity, HU | 38.6 ± 8.5 | 40.9 ± 6.7 | 35.5 ± 9.5 | <0.001 |
| Estimated lean body mass, kg | 30.4 ± 8.9 | 35.3 ± 7.6 | 24 ± 6.0 | <0.001 |
| Any Grade 3–4 Toxicity n = 143 | Any Grade 3–4 Hematological Toxicity n = 128 | Any Grade 3–4 Neurotoxicity n = 8 | Any Grade 3–4 GI Toxicity n = 10 | Hospitalization n = 12 | Dose Delay/Reduction n = 76 | |
|---|---|---|---|---|---|---|
| SMG 100 AU decrease | 1.11 (1.04, 1.18) ** | 1.15 (1.08, 1.23) ** | 0.99 (0.86, 1.13) | 1.01 (0.9, 1.14) | 1.23 (1.08, 1.41) ** | 1.10 (1.04, 1.17) ** |
| SMD 5 HU decrease | 1.25 (1.02, 1.52) * | 1.42 (1.16, 1.74) ** | 0.89 (0.56, 1.39) | 0.9 (0.6, 1.34) | 1.58 (1.17, 2.14) ** | 1.33 (1.11, 1.59) ** |
| SMI 5 cm2/m2 decrease | 1.34 (1.12, 1.59) ** | 1.44 (1.21, 1.71) ** | 0.98 (0.67, 1.44) | 1.11 (0.78, 1.57) | 1.78 (1.23, 2.57) ** | 1.22 (1.04, 1.44) * |
| LBM 5 kg decrease | 1.35 (1.13, 1.62) ** | 1.46 (1.22, 1.75) ** | 0.96 (0.64, 1.43) | 1.16 (0.81, 1.68) | 1.94 (1.27, 2.95) ** | 1.20 (1.01, 1.41) * |
| BMI 1 kg/m2 decrease | 1.06 (0.96, 1.17) | 1.06 (0.97, 1.17) | 1.04 (0.83, 1.31) | 0.94 (0.77, 1.15) | 1.12 (0.92, 1.36) | 0.96 (0.88, 1.05) |
| visceral adipose tissue density 1 unit decrease | 1.01 (0.98, 1.03) | 1.00 (0.97, 1.02) | 1.01 (0.95, 1.08) | 1.03 (0.96, 1.1) | 1.03 (0.97, 1.09) | 1.01 (0.99, 1.04) |
| visceral adipose tissue area 1 unit decrease | 1.00 (1, 1.01) | 1.01 (1, 1.01) | 1.00 (0.98, 1.02) | 0.99 (1, 1.01) | 1.00 (0.99, 1.01) | 1.00 (0.99, 1) |
| subcutaneous adipose tissue density 1 unit decrease | 1.02 (1, 1.04) | 1.02 (1, 1.04) | 0.99 (0.95, 1.03) | 1.02 (1, 1.04) | 1.02 (0.96, 1.08) | 0.99 (0.97, 1.02) |
| subcutaneous adipose tissue area 1 unit decrease | 1.00 (0.99, 1) | 1.00 (0.99, 1) | 1.00 (0.99, 1.02) | 1.01 (1, 1.03) | 1.00 (0.99, 1.01) | 1.00 (0.99, 1.003) |
| Variables | R-CHOP Regimens | p-Value | |
|---|---|---|---|
| Rituximab/SMG ≤0.605 mg/AU | Rituximab/SMG >0.605 mg/AU | ||
| Number of patients | 142 | 59 | |
| Sex, n (%) | <0.001 | ||
| Male | 96(67.6) | 18(30.5) | |
| Female | 46(32.4) | 41(69.5) | |
| Age, years, mean ± SD | 54.3 ± 10.8 | 63.5 ± 10.0 | <0.001 |
| Disease stage, n (%) | 0.012 | ||
| I vs. II | 70(49.3) | 18(30.5) | |
| III vs. IV | 72(50.7) | 41(69.5) | |
| BMI, kg/m2, mean ± SD | 23.2 ± 3.1 | 23.0 ± 3.3 | 0.675 |
| BMI group, n (%) | |||
| <20 | 19(13.4) | 10(17) | 0.514 |
| 20–24.9 | 77(54.2) | 32(54.2) | 0.857 |
| 25–29.9 | 46(32.4) | 17(28.8) | 0.762 |
| Skeletal muscle area, cm2, mean ± SD | 106.8 ± 25.6 | 67.9 ± 18.7 | <0.001 |
| Skeletal muscle gauge, mean ± SD | 1599 ± 383.9 | 745 ± 251.8 | <0.001 |
| Skeletal muscle index, cm2 /m2 | 37.7 ± 7.7 | 25.1 ± 5.9 | <0.001 |
| Skeletal muscle radiodensity, HU, mean ± SD | 42.4 ± 5.3 | 29.2 ± 7.3 | <0.001 |
| Estimated lean body mass, kg, mean ± SD | 33.9 ± 7.7 | 22.2 ± 5.6 | <0.001 |
| Rituximab (mg/AU SMG) | 0.43 ± 0.09 | 1.22 ± 1.83 | 0.002 |
| Any 3–4 grade toxicity, Number (%) | 92(64.8) | 51(86.4) | <0.001 |
| Dose-limiting toxicity | 43(30.3) | 33(55.9) | 0.001 |
| Neuropathy | 6(4.2) | 2(3.4) | 0.784 |
| Hematological toxicity | 78(54.9) | 50(84.7) | <0.001 |
| GI toxicity | 7(4.9) | 3(5.1) | 0.963 |
| Hospitalization | 5(3.5) | 7(11.9) | 0.069 |
| OS | PFS | |||||
|---|---|---|---|---|---|---|
| HR | CI | p-Value | HR | 95% CI | p-Value | |
| Univariate Analysis | ||||||
| Age, years | ||||||
| >60 vs. ≤60 | 1.663 | 1.030–2.685 | 0.038 | 1.452 | 0.925–2.28 | 0.105 |
| Disease stage | ||||||
| III–IV vs. I–II | 4.082 | 2.225–7.489 | <0.001 | 3.846 | 2.212–6.686 | <0.001 |
| LDH level | ||||||
| Elevated vs. Normal | 2.425 | 1.471–4.000 | 0.001 | 2.67 | 1.661–4.292 | <0.001 |
| Number of extranodal sites | ||||||
| 2–4 vs. 0–1 | 3.417 | 1.942–6.012 | <0.001 | 3.143 | 1.824–5.416 | <0.001 |
| IPI score | ||||||
| 3–4 vs. 0–2 | 3.492 | 2.122–5.748 | <0.001 | 3.020 | 1.875–4.864 | <0.001 |
| SMG | ||||||
| ≤1462 vs. >1462 | 3.313 | 1.837–5.976 | <0.001 | 3.126 | 1.820–5.370 | <0.001 |
| SMD | ||||||
| ≤36.86 vs. >36.86 | 3.141 | 1.925–5.125 | <0.001 | 2.676 | 1.700–4.213 | <0.001 |
| SMI | ||||||
| ≤27.55 vs. >27.55 | 1.645 | 0.987–2.74 | 0.056 | 1.837 | 1.143–2.953 | 0.012 |
| LBM | ||||||
| ≤25.55 vs. >25.55 | 1.674 | 1.035–2.707 | 0.036 | 1.724 | 1.098–2.708 | 0.018 |
| Rituximab/SMG mg/AU | ||||||
| >0.605 vs. ≤0.605 | 3.436 | 2.123–5.562 | <0.001 | 3.102 | 1.973–4.879 | <0.001 |
| Multivariate analysis | ||||||
| Disease stage | ||||||
| III–IV vs. I–II | 3.027 | 1.522–6.021 | 0.002 | 3.250 | 1.770–5.967 | <0.001 |
| LDH level | ||||||
| Elevated vs. Normal | 1.522 | 0.833–2.779 | 0.172 | 2.017 | 1.167–3.487 | 0.012 |
| Number of extranodal sites | ||||||
| 2–4 vs. 0–1 | 2.381 | 1.177–4.816 | 0.016 | 2.565 | 1.329–4.952 | 0.005 |
| Age, years | ||||||
| >60 vs. ≤60 | 1.028 | 0.497–2.127 | 0.940 | - | - | - |
| IPI score | ||||||
| 3–4 vs. 0–2 | 1.071 | 0.430–2.664 | 0.883 | 1.402 | 0.730–2.690 | 0.310 |
| SMG | ||||||
| ≤1462 vs. >1462 | 2.655 | 1.218–5.787 | 0.014 | 2.889 | 1.401–5.959 | 0.004 |
| SMD | ||||||
| ≤36.86 vs. >36.86 | 1.113 | 0.514–2.409 | 0.787 | 1.105 | 0.541–2.255 | 0.784 |
| SMI | ||||||
| ≤27.55 vs. >27.55 | - | - | - | 1.217 | 0.521–2.842 | 0.651 |
| LBM | ||||||
| ≤25.55 vs. >25.55 | 2.145 | 1.194–3.853 | 0.011 | 2.151 | 0.986–4.695 | 0.054 |
| Rituximab/SMG mg/AU | ||||||
| >0.605 vs. ≤0.605 | 2.115 | 0.956–4.676 | 0.064 | 1.988 | 0.903–4.376 | 0.088 |
Publisher’s Note: MDPI stays neutral with regard to jurisdictional claims in published maps and institutional affiliations. |
© 2021 by the authors. Licensee MDPI, Basel, Switzerland. This article is an open access article distributed under the terms and conditions of the Creative Commons Attribution (CC BY) license (http://creativecommons.org/licenses/by/4.0/).
Share and Cite
Guo, J.; Cai, P.; Li, P.; Cao, C.; Zhou, J.; Dong, L.; Yang, Y.; Xuan, Q.; Wang, J.; Zhang, Q. Body Composition as a Predictor of Toxicity and Prognosis in Patients with Diffuse Large B-Cell Lymphoma Receiving R-CHOP Immunochemotherapy. Curr. Oncol. 2021, 28, 1325-1337. https://doi.org/10.3390/curroncol28020126
Guo J, Cai P, Li P, Cao C, Zhou J, Dong L, Yang Y, Xuan Q, Wang J, Zhang Q. Body Composition as a Predictor of Toxicity and Prognosis in Patients with Diffuse Large B-Cell Lymphoma Receiving R-CHOP Immunochemotherapy. Current Oncology. 2021; 28(2):1325-1337. https://doi.org/10.3390/curroncol28020126
Chicago/Turabian StyleGuo, Jiaxun, Panpan Cai, Pengfei Li, Cong Cao, Jing Zhou, Lina Dong, Yan Yang, Qijia Xuan, Jingxuan Wang, and Qingyuan Zhang. 2021. "Body Composition as a Predictor of Toxicity and Prognosis in Patients with Diffuse Large B-Cell Lymphoma Receiving R-CHOP Immunochemotherapy" Current Oncology 28, no. 2: 1325-1337. https://doi.org/10.3390/curroncol28020126
APA StyleGuo, J., Cai, P., Li, P., Cao, C., Zhou, J., Dong, L., Yang, Y., Xuan, Q., Wang, J., & Zhang, Q. (2021). Body Composition as a Predictor of Toxicity and Prognosis in Patients with Diffuse Large B-Cell Lymphoma Receiving R-CHOP Immunochemotherapy. Current Oncology, 28(2), 1325-1337. https://doi.org/10.3390/curroncol28020126