Abstract
Wireless sensor networks (WSN) are the base of the Internet of Things (IoT) that all together give rise to the smart city. These WSNs consist of several sensors, which are densely distributed to observe physical or environmental conditions, like humidity, temperature, light intensity, and gas concertation. The sensors reading data are transmitted to the network coordinator, the IP-gateway, which is at the heart of the wireless network. Many monitoring systems are to be found in the literature with generic designs and with the output of algorithms that runs on the given systems. In this paper, we review the related work on monitoring systems and propose the framework based on WSN to sense the readings from the environment to transmit and store in the cloud for calling on the handheld devices when required by the single or multiple users. A real sensor nodes-based experimental testbed is implemented in order to study the scalability, adaptability, and sustainability of the novel WSN-based environmental monitoring framework.
1. Introduction
WSN is a technology developed with great potential in a great number of fields, including earth observation, environmental monitoring, agriculture, resource organization, public health, public security, transport, and military. The potential of WSN in earth applications and its general tendencies are discussed and essential questions are raised [1]. WSNs are formed by a set of devices that are wirelessly interconnected with each other through a wireless network and transmit the data to a gateway to be sent to the internet. A device is called a node, where each node is attached to one (or multiple) sensors. There are typically several parts for each sensor network node: a radio transceiver with an internal antenna or an external antenna connection, a microcontroller [2]. There are also an electronic circuit of sensor interfacing as a source of energy, typically a battery or an embedded type of energy harvesting [3,4].
A sensor node is a wireless device responsible for detecting events from its environment and then communicating them to the sink node [5]. The sensor may be used in some cases as forwarder; aggregating data from multiple sensor nodes, removing redundancy and communicating the data to the next hop [6]. To perform these tasks in an efficient way, the sensor node should be equipped by a microcontroller with specific characteristics. In this context, a low power and fast microcontroller is needed to achieve complex computational instructions without ignoring energy constraints. The size of a sensor node varies from a shoebox to the size of a fingertip, the cost of sensor nodes varies from a few to hundred dollars, depending on the complexity of each sensor node [7,8].
The implementation in this paper is based on Arduino® Uno [9] and some sensors, adding a transmitter module to gain the of benefit of the IEEE-technology Zigbee 802.15.4 protocol [10]. Since the Arduino Uno does not come with a Zigbee transmitter, we attach an XBee shield on the Arduino Uno to allow the Zigbee radio transmitting and will have a gateway acting as a receiver.
A new device that can be interconnected with similar devices to form a wireless network and that can be equipped with various sensors to measure values of almost all different types of environment parameters such as light, humidity, and temperature, etc. is proposed. Some multimedia applications require a supporting camera in order to sense and communicate images from target fields, others require the use of various sensors to get to the same result [11,12]. These intelligent devices work together to form a monitoring system for enabling a smart city [13]. Possible advantages of the technology of Zigbee is the size but it also comes up with numerous limitations. These miniaturized devices have low rates of sending data because of looking for energy savings. Scope is also limited to avoid higher power consumption. Thus, this technology will be well accepted in various fields such as automation, automotive, monitoring of all types (agricultural, industrial, and sanitary), and has started to compete with other technologies that have monopolized Wireless networks (Wi-Fi, Bluetooth, etc.) [14]. The Arduino Uno has many features, the most important is an opensource microcontroller; opensource means that it is designed to be shared with others and can be changed to meet certain requirements. This work consists of designing a WSN-based infrastructure for environmental monitoring. The main objectives of this projects are the following:
- A comprehensive literature review with respect to the sustainable wireless sensor network-based environment monitoring.
- Proposing an environmental monitoring methodology and a framework typically for WSN applications using IEEE 802.15.4 to optimize the available resource in the network.
- Conducting real testbed experimentations to evaluate the sustainability of the WSN-based environmental monitoring design.
The rest of the paper is organized as follows: in Section 2, the state of the art of wireless sensor networks, devices, applications, and features, are described and there is an extensive review of published literature on environmental monitoring. The methodology is given in Section 3 and explains the way to develop and implement the framework using multiple components, the server-side configuration, and the results. Section 4 concludes this paper with future works.
2. Literature Studies
The technical illustration WSN is provided first of all in this section and then the review of published literature on the topic of environmental monitoring based on WSN is provided.
2.1. Background
In traditional wired networks, the network layer is responsible for the maintenance of topology and the same is also typically responsible for addressing the security. The same exists for wireless networks but is a major challenge for the optimization of energy saving. The networks to be built within this layer of IEEE 802.15.4 standard are expected to be organized and maintained to reduce the total costs for the consumers. The IEEE 802.15.4 standard supports different topologies to form a network, including a Cluster Tree Network, a Star Network, and a Mesh Network [15]. The topology of choice is a design choice and depends on the application that you want to target, for example, a star topology for various peripherals connected to a parent node connected to the PC, or a mesh for various interconnected nodes to establish a security perimeter wide coverage [15]. Figure 1 shows the types of topologies.
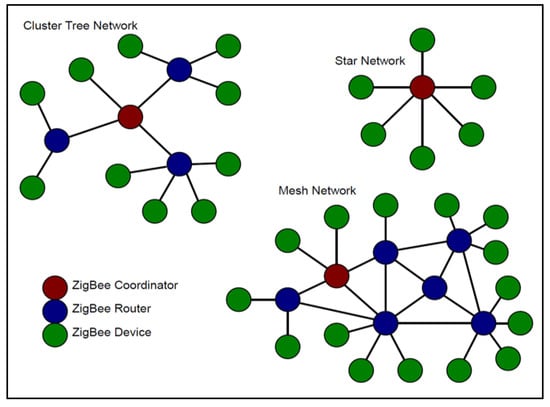
Figure 1.
Types of network schemes.
This standard is utilized for applications requiring a low data transmission rate. The reason for the use of wireless technology is the reduction in costs. Installation requires no rewiring since wireless networks pose for the exchange of information with a minimum of installation effort. This trend is driven by the large capacity of integral wireless components to be used in a cheaper way compared with other wireless communication systems and mobile telephony. The IEEE 802 DLL project divides into two sub-layers, MAC and LLC. The LLC is common to all standards of 802, while the MAC sub-layer’s hardware varies depending on the physical implementation of this layer. Figure 2 illustrates how the IEEE 802.15.4 standard is based on the International Organization for Standardization (ISO) reference model for Open Systems Interconnection (OSI). The characteristics of IEEE 802.15.4 MAC are: association and dissociation, delivery acknowledgments frame, channel access mechanisms, validation plot, and management guidelines. The sub-layers MAC provides two types of services to the higher layers of access through two SAPs. The MAC data service is served by the common part of the sub-layer (MCPS-SAP) [16].
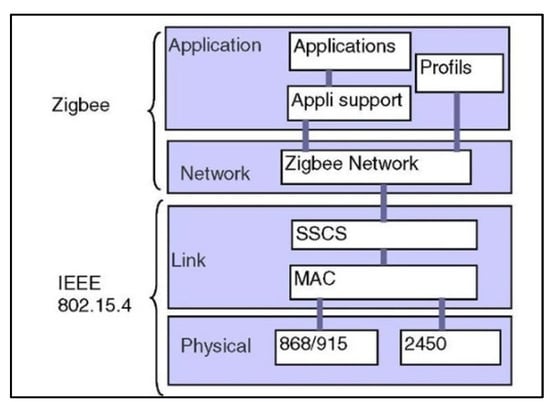
Figure 2.
Types of network schemes.
MAC services are accessed through the MLME SAP. These services provide an interface between the sub-layers SSCs or other LLC and physical layers. The administrator of MAC service has 26 primitives. Compared to the 802.15.1 (Bluetooth), which has about 131 primitives in 32 events, the 802.15.4 MAC is very simple, making it very versatile for the applications to which it was directed [17].
The general format of the MAC frame was designed to be flexible enough and to adjust to the demands of different applications with different network topologies while maintaining a simple protocol. The general format of a MAC frame is shown in Figure 3. A MAC frame is called MPDU protocols [18].
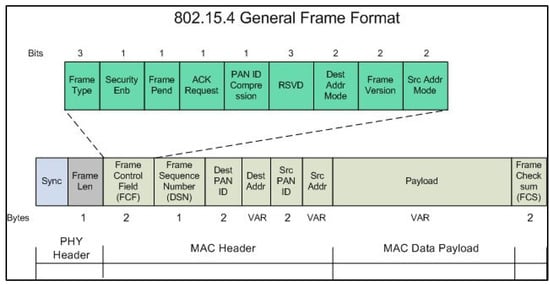
Figure 3.
MAC frame.
The first field in the frame header is the control field. It indicates the type of MAC frame that is transmitted, specifies the format and direction of field and control messages and the ACKs. In short, the control field is specified for the rest of the data frame and what it contains.
The address size may vary between 0 and 20 bytes. For example, a frame data can contain information of source and destination, while the ACK contains no information in any direction. Furthermore, one beacon frame may only contain information on the direction of the source. This stretchy assembly helps rise the efficiency of the protocol for the packet storage.
The payload field, where the data are sent, is of variable length. However, the complete MAC frame should not exceed 127 bytes of information. The payload depends on the type of frame. The IEEE 802.15.4 standard has four different types of frames: beacon frame, data, ACK frames, and MAC command frames.
Only the data frames and beacon contain information from higher layers. Frames ACK messages and MAC commands originated are used to communicate MAC peer-to-peer.
Other fields in the MAC frame are FCS, and the sequence number of the header link to ACK frames with previous record. The transmission is considered successful only when the ACK frame has the same sequence number as the previous frame transmitted.
The IEEE 802.15.4 PHY provides two options that match the MAC to allow a wide range of network applications. PHY’s both methods are based on DSSS. This is done because it leads to low implementation costs of digital integrated circuits, and both share the same basic structure of low-cycle operation packets with low consumption energy. The main difference between the two PHYs lies in the frequency band. The 2.4 GHz PHY specifies operation in the ISM band, which is practically available worldwide, while the PHY of the 868/915 MHz band specified operations in the 865 MHz in Europe and 915 MHz in the ISM band in the United States, while mobility between countries is not expected for most network applications [18].
The international band of 2.4 GHz offers advantages in terms of markets and lower manufacturing costs. Moreover, bands like the 868 MHz and the 915 MHz can be an alternative to growing and other co interference (such as microwave ovens, etc.) associated with the 2.4 GHz band. It also offers greater ranges by link because there are lower losses of propagation. A second distinction of the characteristics of the PHY is the range of transmission. The 2.4 GHz PHY enables transmission range 250 kb/s, whereas the 868/915 MHz PHY provides the transmission rates 20 kb/s and 40 kb/s, respectively. This superior transmission range in the 2.4 GHz PHY is mainly attributed to higher order modulation, in which each symbol represents multiple bits. The different transmission ranges can be used to achieve a variety of developments and applications. For example, having low density PHY data in the 868/915 MHz can be occupied for greater sensitivity and coverage areas, thus the number of nodes required to cover a geo-graphical area is reduced, while the upper range transmission in the 2.4 GHz PHY can be used to achieve throughput older and low latency. It is expected that applications are suitable to each PHY and their transmission ranges [18].
2.2. Related Work
A wireless sensor network (WSN) is considered as several sensor nodes randomly distributed in a target field to co-operatively monitor and record its physical conditions. This network includes hundreds or thousands of smart devices with sensing and processing capabilities that are powered by a dedicated battery. These devices are requested to acquire environmental stimuli, including humidity, temperature, light, and vibrations. The sensor nodes are designed for sensing events, communicating data, and aggregating and processing packets in a central location named sink node [5]. Due to these characteristics, the WSNs are used in various fields such as health care, industry, environmental monitoring, and research and development [19]. In this context, the authors in [20] reviewed some healthcare-based applications and outlined the challenges in wireless sensor networks to support high levels of trust-worthiness and to ensure the privacy and security of medical data. In [21], the authors proposed a health monitoring system capable of acquiring physiological parameters from multiple patient bodies using a wireless body sensor network (WBSN). When detecting an abnormal condition, this system issues an alarm to the patient and sends a SMS/email to the healthcare providers. The system has been evaluated in terms of coverage, energy consumption, and end-to-end delay.
Actually, the wireless sensor networks support many types of applications: medical, military, and civil. These applications include but are not limited to environmental monitoring, medical supervision, home surveillance and automation, object tracking, and agriculture control applications. Despite multiple offered services, the WSNs suffer from a severe limitation in terms of the energy resource at each sensor node. In addition, it is not often convenient to replace nodes’ batteries. Therefore, using energy-harvesting techniques based on the ambient resource can play a key role in extending the batteries’ lifetime [22].
The IoT framework is establishing connectivity of anyone with anything anywhere for a very large-scale Internet. Recently, a few papers started studying the security of IoT communications, especially their current status, challenging architectures and prospective measures [23,24,25]. First, the current status of IoT covers mainly its layered architectures and their impact on the proposed solutions. Second, several IoT challenges are considered due to the limited edge device capability, the involved heterogenous technologies, and the lack of security. Third, prospective measures have been implemented to address the security concerns specific to IoT layers and devices and to ensure interoperability in an heterogenous environment. The heterogenous network based on WSN and IoT is deployed to monitor animal health with the precise location in [26].
The authors in [27] proposed an educational IoT model to design a weather station based on ThingSpeak cloud services. Their platform involves both software and hardware parts including DHT11 and BMP180 sensors, Mega 2560 microcontroller, cloud API interfaces, MATLAB scripts as well as applications implemented upon both Windows and Android operating systems. The weather station consists of measuring environmental events (temperature, humidity, and pressure) and sending them to the ThingSpeak server via an ESP8266 WiFi module. The ThingSpeak server implements two channels. The Meteostanica channel is used to store the measured data as well as for MATLAb visualization. The second channel allows MATLAB data analysis, calculating the average values of measured metrics and then determining their current states.
In [28], the authors presented an environmental monitoring infrastructure using a sensor network-based architecture. Similar to [27], this work employs three main components: sensors, gateway, and cloud. The data (temperature and humidity) is measured by specific sensors and routed by the gateway toward the cloud where data are accessible in real time for visualization and analysis using smart phones. This architecture integrates both button memory and µPanel aspects for various reasons. First, button memory can allow this architecture to work even in absence of power and Internet connection. Second, µPanel is designed to operate with slow and unreliable Internet connection. In addition, µPanel-based cloud infrastructure becomes capable of monitoring sensors locally without permanent Internet connectivity. In terms of results, the authors demonstrated the µPanel efficiency in supporting easy and fast deployment of complex monitoring systems. They affirm that their compact transmission scheme at the smart-phones as well as the push notifications support are the main concepts reinforcing real time clients as similar to the smartphone-based monitoring in [5].
The authors in [29] used both smart sensor devices and cloud-hosted application in order to design a flexible IoT API for more end-to-end communication security. The main goal of this work is to provide secure end-to-end communications despite the recurrent network dis-connectivity and fog-device limitations especially in terms of energy, buffer, computing capacity, and network channel speed. To achieve these goals, the middleware implements two algorithms: Session Resumption and Optimal Scheme Decider algorithms. Any device, recently disconnected due to an unreliable network connectivity, can resume using the first algorithm. Moreover, to match with a given resource constraint, the user employs the second algorithm to select the most suitable end-to-end security scheme via supervised machine learning. In terms of results, this work demonstrated that using static properties of Preshared Key or Certificates can significantly speed-up secure communications.
The work performed in [30] introduces the main technologies able to solve environmental problems in smart cities. This work involves a wireless sensor network (WSN) including wireless sensor nodes, gateway, and cloud sites. First, data are collected from WSN nodes using Smart Environment Monitoring (SEM) applications. A gateway is used to translate the data from IoT devices and transmit them to Google Cloud Platform (GCP) IoT Core that can detect enormous vulnerabilities. When the parameters deviate from normal values, a notification email is sent to detect abnormalities in the environmental parameters. To manage IoT access and prevent MQTT (Message Queuing Telemetry Transport), message conflict in the AWS (Amazon Web Service) IoT Core, an email audit function is developed to check the security and status of edge device certificates via SNS (Simple Notification Service) email notification. The limitation of this mechanism resides on the device-server data synchronization required by X.509 certificates. A new connection between IoT device and GCP Core server is accomplished with a server certification file for authentication. In addition, several parameters such as ID, region, and device topic are used at the transport layer MQTT protocol to ensure more reliability and credibility of the connection. The main result of this work is limited to perform a comparison of the capability of IoT cores in AWS and GCP to identify the available services as well as how to use them in cloud-based IoT applications.
In [31], the authors developed a WSN and cloud computing-based communication system able to monitor ambient air quality. On one hand, the wireless sensor network is equipped with low-power ZigBee motes responsible for measuring field air quality and transmitting data to the cloud via an intermediate gateway. On the other hand, a cloud computing approach has been developed to collect, monitor, process, and visualize the air quality distribution in large areas. The collected data are processed in the cloud using pattern recognition and support vector machine-based artificial intelligence techniques that allow detecting contaminants and discriminating BTEX compounds. The authors performed a case study to evaluate the system operation, which demonstrated good performance in detecting, measuring, and discriminating the common volatile organic compounds. Their results are summarized by a discrimination rate of 93.05% and around 0.99 for coefficients determination.
3. Methodology, Implementation and Results
There are many types of microcontrollers with different characteristics and capabilities. In our platform, we used ATmega328P that is embedded in the Arduino Uno board. For data transmission means, the radio, we selected the XBee module, including a Digi XBee-Wi-Fi IP gateway as given in Figure 4.
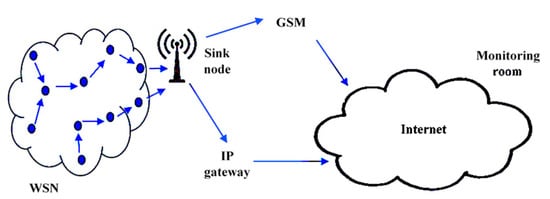
Figure 4.
Complete platform.
Sensors
Sensors are the most important part when it comes to detecting any event for any environment at any given moment. Thanks to new technologies, we were able to use some of the sensors to detect events such as the weather’s temperature and humidity, and the intensity of the light and some gas readings using the DHT11 sensor and the LDR sensor and MQ-2 and MQ-7 sensors [32,33]:
The DHT, as shown in Figure 5, is a sensor that consists of two parts, a capacitive humidity sensor and a thermistor. It also contains an ADC, which gives a digital signal of the temperature and the humidity readings, making it easy to acquire by the microcontroller.
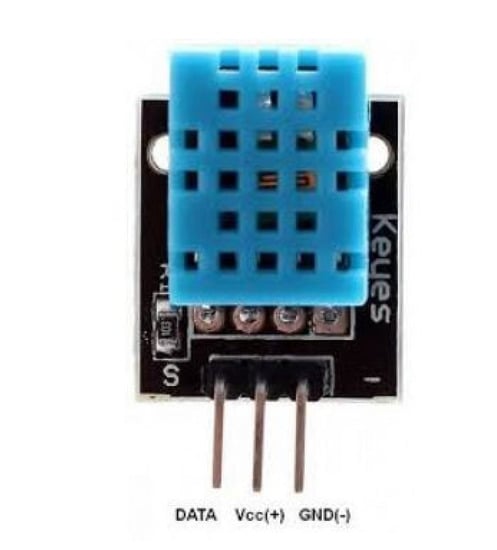
Figure 5.
DHT sensor.
The LDR, as shown in Figure 6, is a sensor that gives the values of the intensity of the light hitting it. It has two outputs, a digital and an analog one; we will be using the analog to be able to read a range of values.
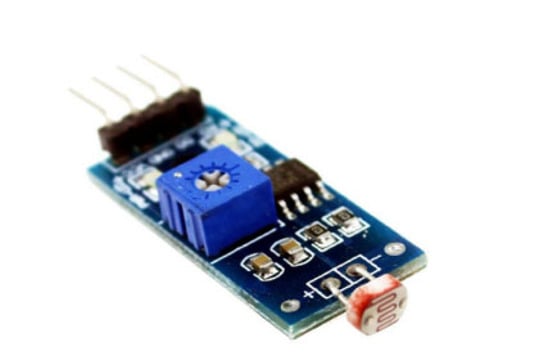
Figure 6.
LDR sensor.
The MQ2, as shown in Figure 7, is a gas leakage detection sensor; it can detect LPG, CO gas, smoke, and methane gas. This module is capable of measuring quickly the event levels due to its high sensitivity and fast latent period. This characteristic is due to a potentiometer integrated to adjust the sensitivity of the sensor.
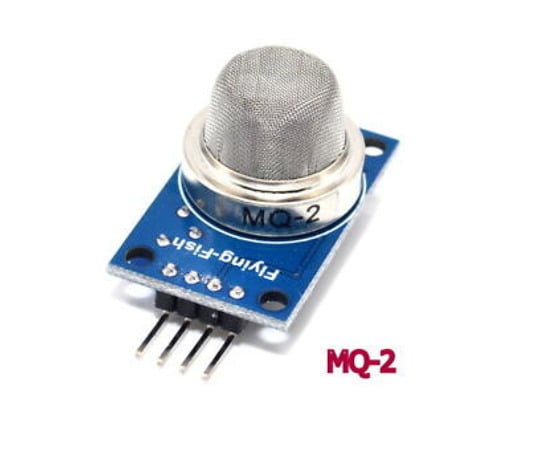
Figure 7.
MQ-2 sensor.
The MQ-7, as shown in Figure 8, is a CO sensor suitable for sensing CO concentrations within the air. It is able to detect CO-gas concentrations from 20 to 2000 ppm. The MQ-7 sensor uses the method of cycle high to detect CO-gas. This sensor is integrated in domestic CO-gas leakage alarms, portable CO-gas detectors, and industrial CO-gas alarm.
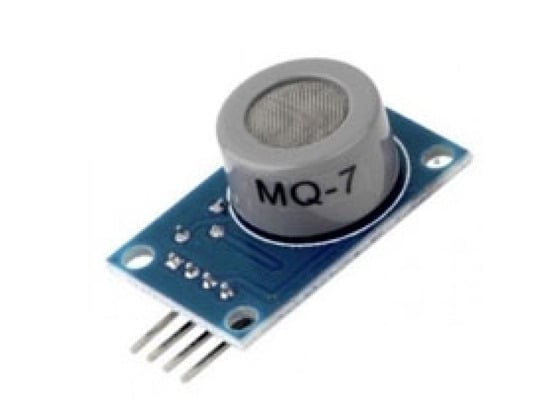
Figure 8.
MQ-7 sensor.
This research uses the Arduino Uno platform as the main component to support the connectivity between various types of communication devices. Arduino Uno is the most suited platform since it is an open-source board, which can be easily used and configured by the original Arduino IDE software. The Arduino Uno board, as shown in Figure 9, consists of the Atmega328 microcontroller, six analog pins, 14 digital I/O pins, a USB interface, and it uses the pins Rx and Tx for the serial communication.
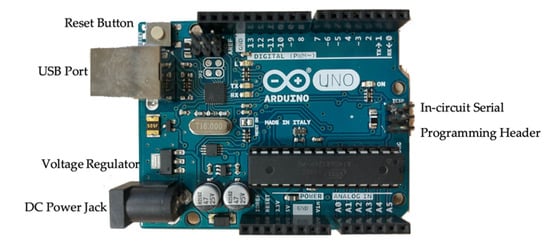
Figure 9.
The Arduino Uno board.
To communicate data and events, the XBee module, shown in Figure 10, supports sending and receiving data via the Zigbee protocol. In the current research, the XBee module is used as transmitter in our WSN devices. The XBee module can be attached to the Arduino Uno platform through a shield (Figure 11) designed specifically for this module, or via the USB adapter.
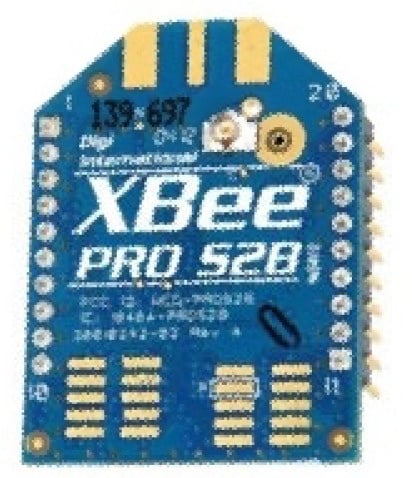
Figure 10.
XBee-PRO module.
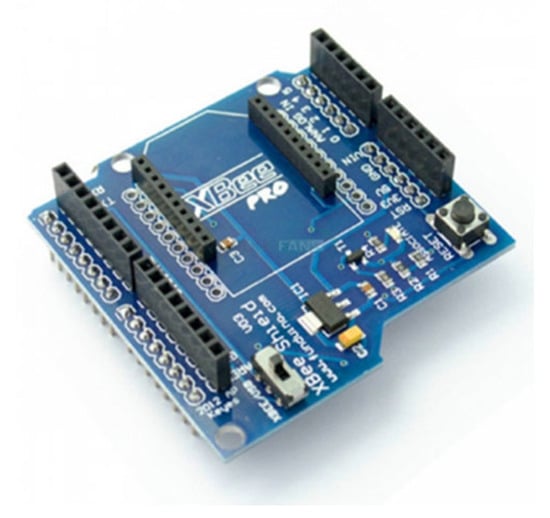
Figure 11.
XBee Arduino Shield.
We added also a GSM transmitter module in order to increase the project durability and provide an extra-channel with the server for more guarantee of packet delivery. This extra-channel increases the event collection probability at the server as well as eliminates errors and rapidly update sensed readings (event values). The STC SIM card is inserted in the GSM module to enable the internet connection. The GSM module has many great features, such as its area coverage, which can be up to 30 km, its low power consumption since our module works only on 2G, and the most important resides in the fact that it can be easily interfaced with our platform. Some modules require more power than the platform can provide, others work fine without any extra power supply. The use of the IP gateway is very important for accessing the data through the internet, because the XBee module does not operate in the Network layer; thus it cannot send data to the internet directly. Thanks to the new technologies, there exists an IP gateway, shown in Figure 12, that can receive the data via the Zigbee protocol and then uses the IP protocol to be transmitted through the internet. The gateway can connect to the internet either with an ethernet cable or through a Wi-Fi channel. To serve this goal, we will be using the Wi-Fi channel to support the portability and mobility of the application. The overall system is demonstrated with help of Figure 13.
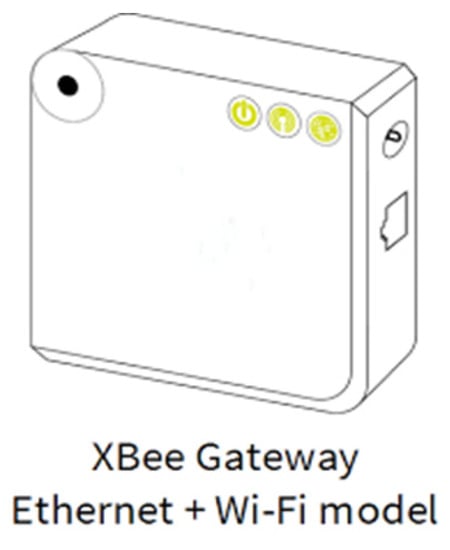
Figure 12.
Digi XBee IP-Gateway.
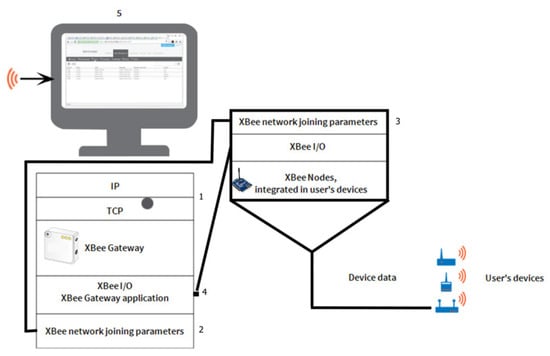
Figure 13.
Overall system flow.
The suitable devices for building a wireless sensor network should be low-cost and have a low power consumption. The first suggestion was the TelosB mote as shown in Figure 14, which is really good when it comes to detecting events. The TelosB mote has an embedded Zigbee transceiver and is configured by an USB port. The TelosB mote can work with either a Windows-based operating system, or with a Unix-based operating system, but not for a Mac operating system, which can be challenging for some applications. We decided to replace the TelosB mote with the Arduino Uno board because the original software tools for the TelosB mote is no longer in use and is outdated as mentioned on their website.
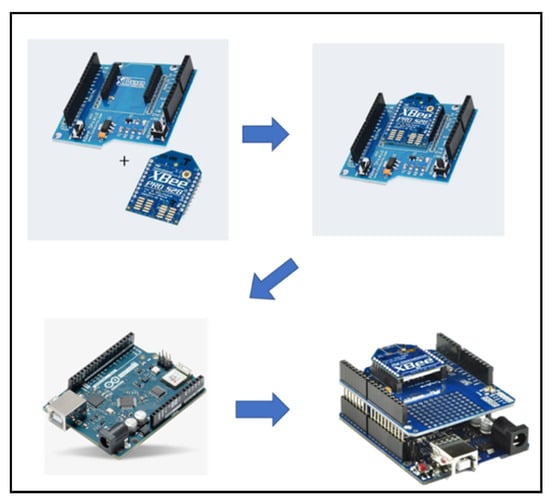
Figure 14.
Arduino Uno attached with the XBee through the XBee shield.
Arduino is an easy-to-use microcontroller. Before using Arduino, we need to add the peripherals and include all other components such as resistors, capacitors, and inductances. Nowadays, it is all combined in one single platform with simple interfaces.
The XBee module is attached to a shield designed to interface with the Arduino Uno as shown in Figure 14. The shield is a plug and play component. i.e., just plug it in and the XBee module will immediately turn ON.
- Pros:
- ○
- Easy to use.
- ○
- No coding required.
- ○
- No wires required.
- Cons:
- ○
- Limited to the board’s Rx and Tx.
- ○
- Fixed serial pins and cannot be changed.
- ○
- Extra component, which costs.
The XBee module is attached to an adapter, which then can be wired to the Arduino Uno, as shown in Figure 15. The adapter is an independent component, i.e., we need to know the pin-out map of the adapter. We also must have the Software Serial library in order to send the data from the Uno to the adapter. Then, it is sent to the IP gateway using the XBee module.
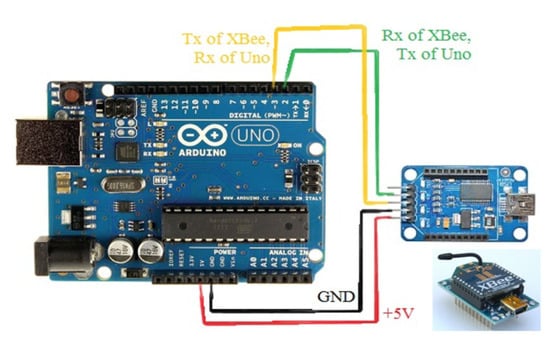
Figure 15.
Arduino Uno attached with the XBee through the XBee shield.
- Pros:
- ○
- Can be configured to use any GPIO as Tx, Rx.
- ○
- No shield required (saves cost).
- ○
- Does not block the board Tx, Rx, which the uploaded code goes through.
- Cons:
- ○
- Must download Serial Software Library to configure GPIOs.
- ○
- Requires knowledge in coding.
- ○
- If wires are damaged, connection will be lost.
From the above mentioned two designs (XBee shield, XBee adapter) and after experiencing them together, we decided to use the second design including the XBee adapter.
The IP-gateway plays the coordinator role in our WSN, as shown in Figure 16. In the WSN, there is one coordinator and a certain number of sensor nodes responsible of detecting environmental events. The coordinator then connects the WSN to the internet, either via Wi-Fi, or via ethernet cable. The LEDs on the device as shown in Figure 16 are, a is for power, b for XBee (blinks if connected and solid if not), c for network (blinking yellow means operating system running but no connectivity, solid yellow means IP is assigned to XBee gateway, blinking green means attempting connection to remote management server, faster blinking green means authentication with remote sever in process, solid green shows the remote management server connected).
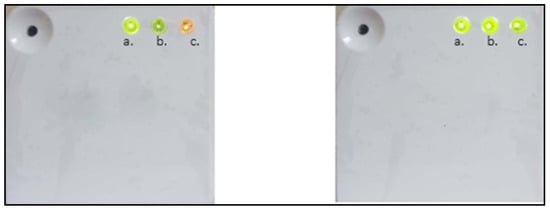
Figure 16.
IP-gateway, not connected to the internet (left)/and connected to internet (right).
The IP-gateway needs to be configured once employed as shown in Figure 17, by following the Wi-Fi method for the ease of use and accessibility. The configurations include acquiring the default Wi Fi IP-address, setting a default name, and a firewall (optional), as shown in Figure 17. After connecting the IP-gateway to the internet, we can now access the gateway by typing in the URL bar the default IP (198.168.100.1) and change the configurations, as shown in Figure 17, and after saving the output, as shown in Figure 18. In Figure 17, the red frame is to show the status of network connectivity step by step, the tick appears by itself as soon as the step is completed and the rest uncompleted tasks are not checked.
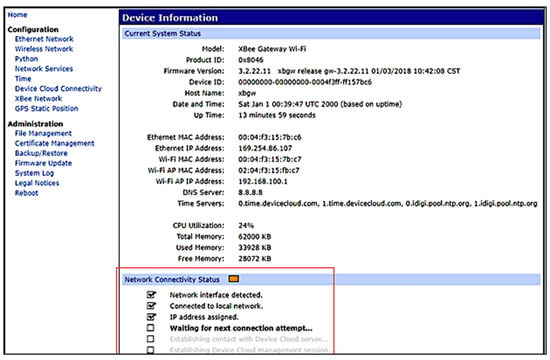
Figure 17.
IP-gateway’s homepage before any change in the configurations.
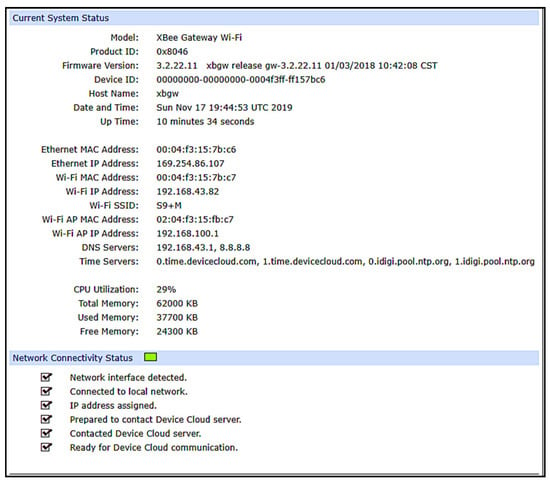
Figure 18.
The IP-gateway after configuration.
Now, we can check whether it is connected to the internet or not by logging-in and add the IP-gateway by the device ID written behind the gateway on the website (devicecloud.digi.com, accessed on 20 July 2020), as shown in Figure 19. After successfully connecting the IP-gateway to the internet, the status led turns to green, and the status on the website turns from red and disconnects to blue and connects, as shown in Figure 19. Note the status on the left of the MAC address field, reflecting that it is not connected.
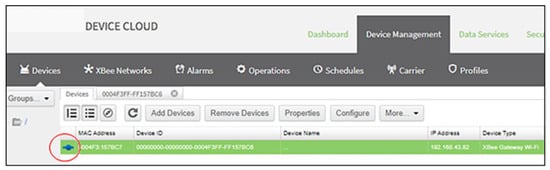
Figure 19.
The website showing the online status when the IP-gateway is connected to the internet.
Arduino is an open-source software, which allows the development of the source instructions that will be executed on the microcontroller. The software is called Arduino IDE, which provides the user with an integrated development environment. It is free to download, and it works on Unix-based, Windows-based, and Mac-based operating systems. To download the IDE, first, we go to (arduino.cc/en/Main/Software, accessed on 20 July 2020) and download the proper version. Then, a driver should be downloaded automatically. However, if the driver is not downloaded for any reason, it has to be downloaded manually in order to be able to upload the code to the platform.
Then libraries should also be downloaded for the DHT sensor, MQ2 sensor, XBee, and Software serial. It can be downloaded from the IDE, Sketch > Include Library > Manage Libraries.
The XBee module needs to be configured using a software called XCTU. It is developed from DIGI, and it is available on (https://www.digi.com/products/embedded-systems/digi-xbee/digi-xbee-tools/xctu, accessed on 20 July 2020). Once the XCTU is running, we connect the XBee module using a USB-adapter, as shown in Figure 20. When the XBee is connected to the computer, we can discover the module in the XCTU software by striking (Ctrl + Shift + D), as shown in Figure 21.
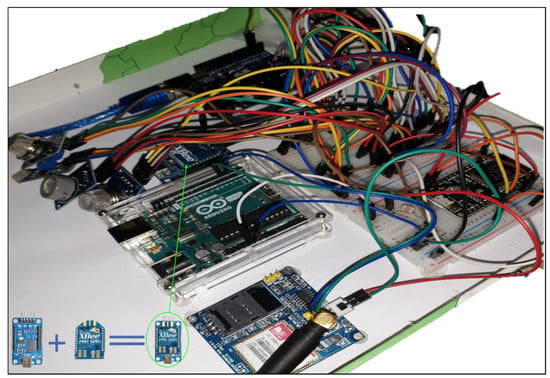
Figure 20.
XBee USB-adapter and complete testbed.
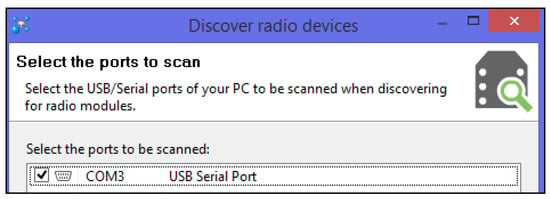
Figure 21.
Discovering the XBee module using XCTU through the use of a USB-adapter.
Now, the XBee module is discovered and is configurable. Both the XBee and the IP-gateway should have the same IDs to allow communication.
Note: the XBee module needs to be configured at least once. Then, we can remove it from the USB-adapter and connect it to the XBee shield on top of the Arduino Uno (if we were using the first proposed method mentioned earlier). However, since we are using the second method, we will configure the XBee method and then connect the adapter to the Arduino uno board. Hence, configurations will not be lost because they are stored in the ROM memory of the XBee module.
Once the IP-gateway and the XBee are configured, we can establish a new connection between them. First, both the IP-gateway and the XBee module should be powered. Then, we go to the website (devicecloud.digi.com, accessed on 20 July 2020) and we discover the XBee module by clicking on the IP-gateway under the “XBee Networks” in the “Device Management” as shown below. Then, we click the “Discover” and after clearing the cache we again click “Discover”, the red circled icon on the upper right corner of Figure 22. Now we go back to the XCTU software, and we scan for any XBee network in the range, as shown in Figure 22 and stop scanning with the help of “Stop” circled red in Figure 22.
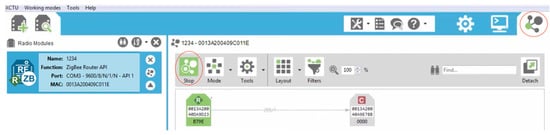
Figure 22.
Digi device cloud after connecting the XBee module to the IP-gateway.
First, we “switch to Network Working Mode” by pressing (Alt + v). Then, we start “scanning”. The IP-gateway should appear as a coordinator connected to the XBee module (or router). We also can make sure by comparing the devices MAC addresses. Now, we have successfully connected the XBee module to the internet via the IP-gateway, as shown in Figure 23.
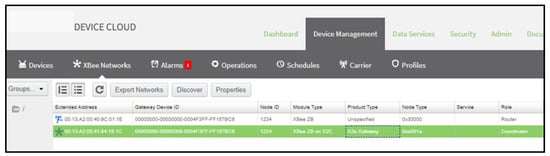
Figure 23.
Checking the connection between the XBee module and the IP-gateway in XCTU.
The main goal of this project consists of creating a WSN for environmental monitoring. We have successfully created a WSN using the Zigbee protocol. However, communicating the events through the internet network to a monitoring room, some decisions/reactions have to be achieved. In this context, connecting and configuring the IP gateway constitutes the most important contribution.
The WSN should be able to detect an event and send specified data to the network manager via the internet. First, the data will be read by the sensors, which are controlled by the Arduino. Then, the processed data will be transmitted using the Zigbee protocol through the XBee module. Next, it will be received at the IP-gateway, which automatically sends the data to the internet.
After uploading the code to the platform, it is time to take the sensor readings and check whether it is working correctly or not. We are using only two sensors, DHT and LDR. The DHT sensor is used to read both temperature and humidity, while the LDR sensor is responsible of measuring light intensity. The unit of humidity is given in percentage where 100% indicates maximum humidity. While the temperature will be read in Celsius using the serial monitor in the Arduino IDE, we can see the DHT and LDR readings in Figure 24. If a thumb is covering the sensors, a change in all the readings occurs. Humidity and temperature increase, while light intensity decreases. The sensor readings will be sent to the IP-gateway using the XBee module.
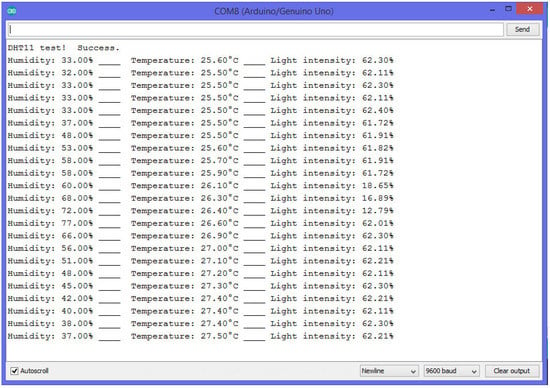
Figure 24.
Humidity, temperature, and light intensity readings in Arduino IDE serial monitor.
To establish a communication with the gateway, two ways could be considered; manually or automatically. Since we do not have the IP layer in the XBee module, we will use MAC addressing for IP-communication. Thus, for data transmission, we have to create a frame which will be transmitted to the IP-gateway. That frame is created using the XCTU software by clicking “Close” circled red, as shown in Figure 25. We first have to make sure that the XBee module (router) is connected to the IP-gateway coordinator in the “Network Working Mode”. Then, we strike (Ctrl + C) in XCTU to switch to the console mode. Next, we open the connection and create a frame, let us call it “frame_0”, as shown in Figure 26.
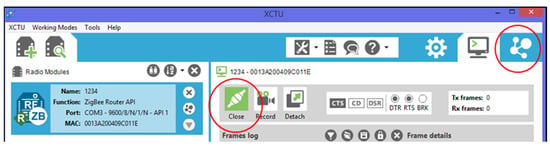
Figure 25.
Creating a frame in XCTU.
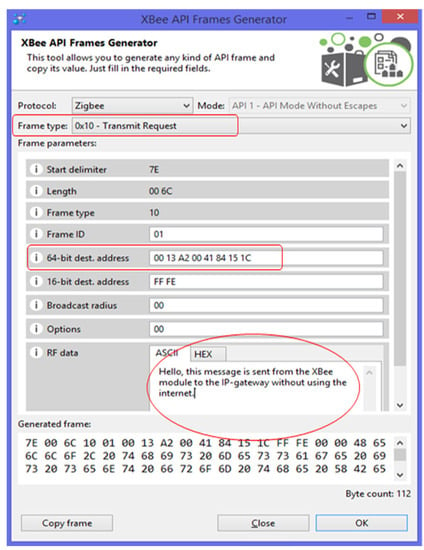
Figure 26.
The frame’s type, destination, and data.
Necessary attributes highlighted in Figure 26 with red circle to be configured are as following:
- The Frame type must be “Transmit Request”.
- The “64-bit dest. address” is the IP-gateway MAC address.
- The “RF data” is the message to be transmitted.
After that, we can transmit the frame, as shown in Figure 27, and the acknowledgment is shown in Figure 28.
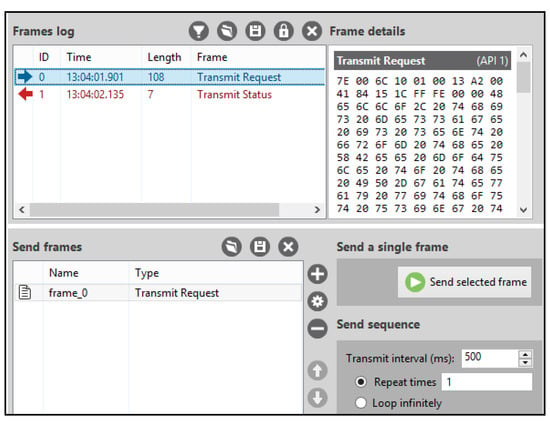
Figure 27.
The frame is transmitted and the reply is received.
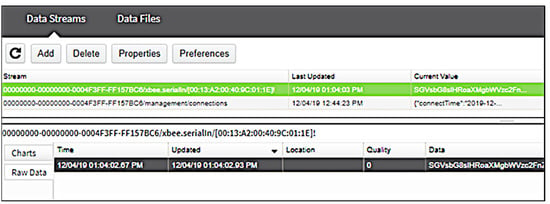
Figure 28.
IP-gateway data homepage after receiving “frame_0”.
Automatic configuration: automatic configuration can be done by integrating the code in the Arduino platform. It relies mainly on the Software Serial library (see source code in Appendix A).
Note: manual configuration has been used for debugging purposes only. The IP-gateway receives the data in base64. So, we need to decode the received message to text in order to make the message readable by humans (administrators). There are many tools able to encode/decode any message. We used many technical details in this regard from the following website (https://codebeautify.org/base64-decode, accessed on 20 July 2020).
The received readings before and after the decoding process are shown in Figure 29. Remote monitoring is a very interesting service provided by this project. At any time and from any location in the world, managing and monitoring the WSN is possible. This ser-vice requires using an internet server that can be reached from any end-system. We can compare the results from the server with our results as shown in Figure 30 at the platform level for system efficiency analysis. The humidity percentage shown in lower right side of Figure 30 is providing the user with three levels as the green is normal, yellow is to check, and red is where the user need to act seriously.
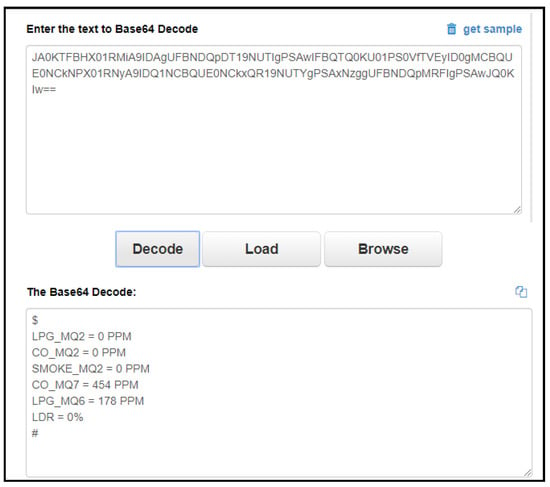
Figure 29.
The received readings before and after decoding.
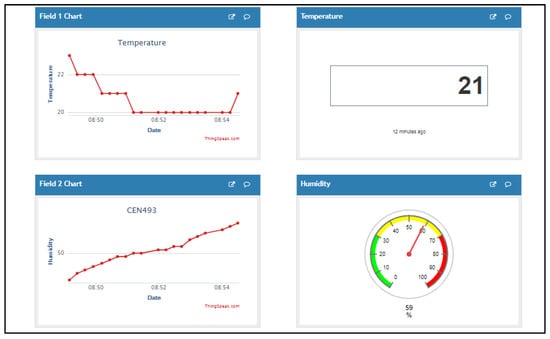
Figure 30.
Temperature and humidity from DHT sensor results at the server.
In this paper, server-based monitoring is enabled to remotely monitor the WSN events and react accordingly. In this context, a server constitutes a very important component to have access and manage the WSN from a distant location. The server finding process should consider some characteristics suitable for wireless sensor networks. First, we surveyed features of many types of servers such as Amazon web services, Google Cloud, and Microsoft Azure. The problem with the Saudi cloud services are that they are not for rent for individuals or for research use. So, we were required to look for other solutions. Based on the comparison with other cloud providers, we selected ThingSpeak to be used for our project, as the ThingSpeak provides a cloud platform for free to monitor and visualize live data. ThingSpeak supports MATLAB programming language, which is great for graph analyzing. However, both Google Cloud and Microsoft Azure require some personal data such as credit card information, which allow them to withdraw money, unlike ThingSpeak, which required nothing but creating a free account. In addition to ThingSpeak, we will also use Blynk application as our server in the GSM communication component. Blynk is available on both Android and iOS systems. The ThingSpeak server allows displaying the sensor data in both values and graphs. This service is offered using a MathWorks account that can be created via the following link (to https://thingspeak.com/, accessed on 20 July 2020). After successful registration, it is necessary to create new channels to support parameters generated from sensors. In its free version, ThingSpeak provides only up to eight fields to monitor, as shown in Figure 31.
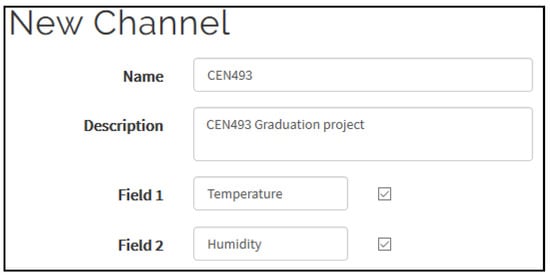
Figure 31.
ThingSpeak channel fields.
Blynk is an application that can be downloaded in our daily devices operating with both Android and on iOS operating systems. It allows the user to monitor the readings of any given senor. It supports GSM, Wi-Fi, USB, and many other connection methods. It also supports many platforms (Arduino, RaspberryPi, Node MCU etc.). To use this application, we downloaded it on the target device and created an account using email and password, under a new project. We shall specify the way of connectivity for the Arduino Uno and GSM. An authentication token is sent to the email. This token is very important, as it is the key to the connection. Monitoring will not be available without that key.
To send data to our server, we need two important parameters, as they are the key to the communication. These parameters are written as API Key and the Channel ID as shown in Figure 32. Both can be found in the channel page. Those two parameters are then added to the Arduino Uno source code (see Appendix A). On the hardware platform, we need to choose which pin to assign each element of the dashboard. Blynk provides three types of pins: (1) Analog: directly from the analog pin of the platform, (2) Digital: directly from the digital pin of the platform, and (3) Virtual: which is any variable in the code. We will be using the virtual pins as Blynk provides +1000 virtual pins and not limited to the GPIO pins of the platform.
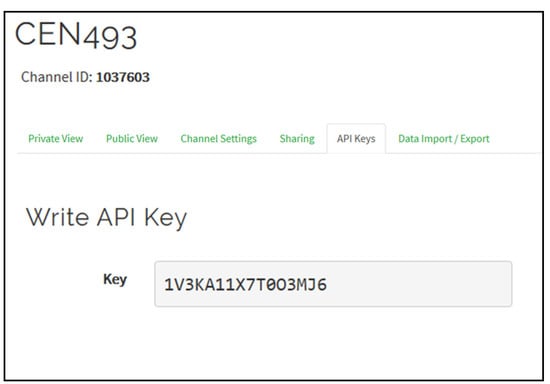
Figure 32.
ThingSpeak ID and key.
Figure 33 and Figure 34 show the environment monitoring through ThinkSpeak and Blynk servers, which are dedicated to Zigbee and GSM, respectively. In Figure 33, both temperature and humidity are displayed in time range and instantaneous ways. The time range supervision provides a clear expected trend for each environmental metric that can help the monitor to take fast action and prevent events and disaster from happening. The humidity percentage shown in lower right side of Figure 33 is providing the user with three levels as the green is normal, yellow is to check, and red is where the user need to act seriously. Figure 34 provides the same supervised metrics that consolidates the values generated through the ThinkSpeak server. The GSM path is considered as an alternate way of the event that is especially needed by various highly loss-sensitive applications and that demonstrates the system stability and sustainability. Therefore, with the enhancement in technologies, even the local does not work, still the older cellular versions will remain operational. The main advantage of our prototype resides in the cost-effective and communication efficiency. First, all used devices are very cheap and available everywhere. Second, their communication technologies are reliable and generate very light load that can reach the server and the monitoring room without dropping. The current prototype has high scalability and adaptability that can support large scale WSN and include any other type of sensors.
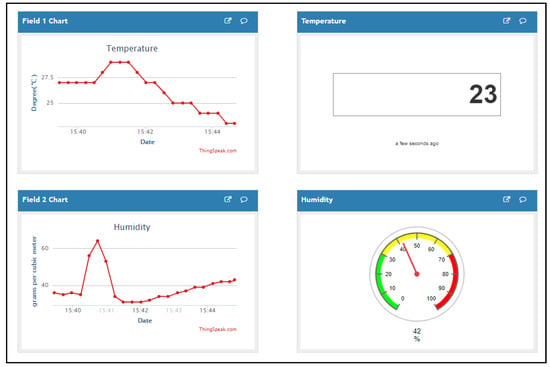
Figure 33.
ThingSpeak monitor.
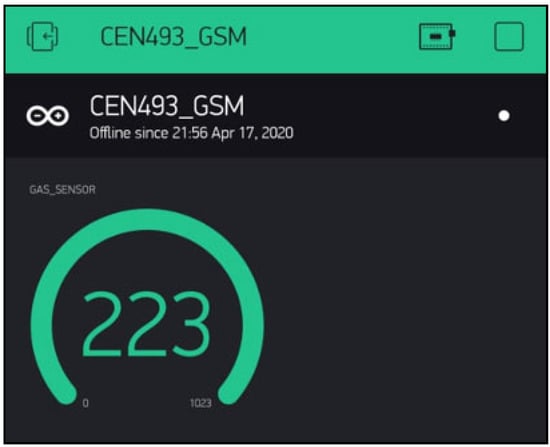
Figure 34.
Blynk Monitor.
4. Conclusions
In this research, we studied several concepts related to the wireless sensor networks: architecture, features, components, and applications. We discovered the main steps useful to build a wireless sensors network. In this context, we implemented the codes to configure the XBEE transmitter module, the IP-gateway, and the platform including various sensors. We also proposed the suitable interconnectivity of these components to form an entire and efficient platform for environmental event monitoring. The contribution started from proposing an environmental monitoring framework based on WSNs. The WSN contains the sensors and communication modules that are configured, and sensors’ readings are acquired. We included an additional GSM transmitter to support highly loss-sensitive applications. We implemented a server-based monitoring component that allows remote sensing from everywhere. A significant work has been achieved to establish the interconnectivity and interoperability of all these hardware and software components that realize the objectives of this research. Finally, the results show the proposed monitoring system design is completely sustainable.
Despite the significant work and effective results, still there will be the opportunity to improve the quality, the scale, and the efficiency of this prototype. Since the project is supposed to be used in an open area or inaccessible field (i.e., wild environment), the power consumption constitutes a very important parameter to be considered. Therefore, the prototype can be equipped with solar cell devices to use the sun’s renewable energy and prolong the network lifetime. Solar cell power absorption requires rechargeable batteries as well as power regulators to provide the platform safety.
Author Contributions
Conceptualization, R.O. and K.S.; methodology, R.O. and K.S.; software, R.O. and K.S.; validation, R.O. and K.S.; formal analysis, R.O. and K.S.; investigation, R.O. and K.S.; resources, R.O.; writing—original draft preparation, R.O. and K.S.; writing—review and editing, R.O. and K.S.; supervision, R.O.; project administration, R.O.; funding acquisition, R.O. All authors have read and agreed to the published version of the manuscript.
Funding
This research project was supported by a grant from the “Research Center of College of Computer and Information Sciences”, Deanship of Scientific Research, King Saud University.
Conflicts of Interest
The authors declare no conflict of interest.
Appendix A
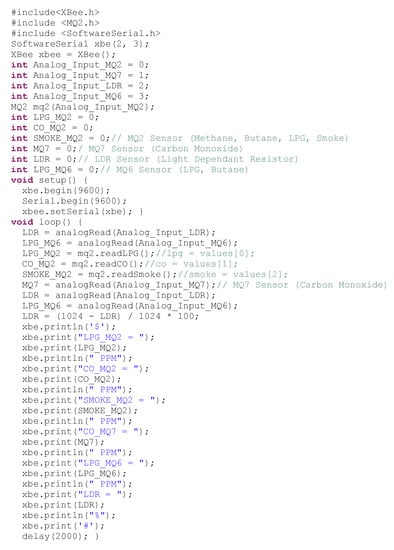
Figure A1.
XBee Arduino source code.
Appendix B
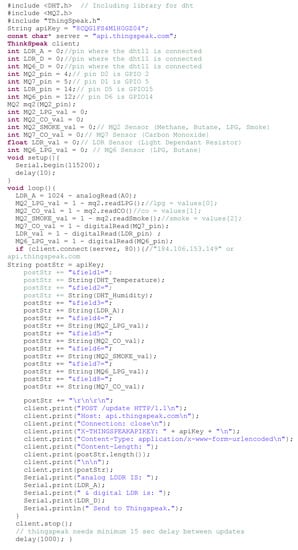
Figure A2.
ThingSpeak Arduino source code.
Appendix C
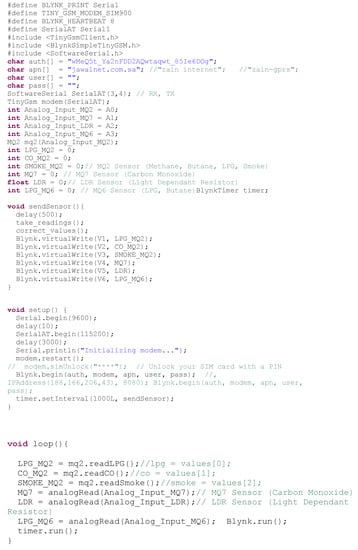
Figure A3.
Arduino GSM source code.
References
- Razooqi, Y.S.; Al-Asfoor, M. Intelligent Routing to Enhance Energy Consumption in Wireless Sensor Network: A Survey. In Mobile Computing and Sustainable Informatics; Springer: Berlin/Heidelberg, Germany, 2022; pp. 283–300. [Google Scholar]
- Saleem, K.; Fisal, N.; Al-Muhtadi, J. Empirical Studies of Bio-Inspired Self-Organized Secure Autonomous Routing Protocol. IEEE Sens. J. 2014, 14, 2232–2239. [Google Scholar] [CrossRef]
- Saleem, K.; Derhab, A.; Al-Muhtadi, J.; Shahzad, B.; Orgun, M.A. Secure transfer of environmental data to enhance human decision accuracy. Comput. Hum. Behav. 2015, 51, 632–639. [Google Scholar] [CrossRef]
- Singh, J.; Kaur, R.; Singh, D. Energy harvesting in wireless sensor networks: A taxonomic survey. Int. J. Energy Res. 2021, 45, 118–140. [Google Scholar] [CrossRef]
- Lim, H.; Kim, T. Smartphone-Based Data Collection System for Repetitive Concrete Temperature Monitoring in High-Rise Building Construction. Sustainability 2019, 11, 5211. [Google Scholar] [CrossRef] [Green Version]
- Yaseen, M.; Saleem, K.; Orgun, M.A.; Derhab, A.; Abbas, H.; Al-Muhtadi, J.; Iqbal, W.; Rashid, I. Secure sensors data acquisition and communication protection in eHealthcare: Review on the state of the art. Telemat. Inform. 2018, 35, 702–726. [Google Scholar] [CrossRef]
- Al-Muhtadi, J.; Qiang, M.; Zeb, K.; Chaudhry, J.; Saleem, K.; Derhab, A.; Orgun, M.A.; Shankaran, R.; Imran, M.; Pasha, M. A critical analysis of mobility management related issues of wireless sensor networks in cyber physical systems. IEEE Access 2018, 6, 16363–16376. [Google Scholar] [CrossRef]
- Mazunga, F.; Nechibvute, A. Ultra-low power techniques in energy harvesting wireless sensor networks: Recent advances and issues. Sci. Afr. 2021, 11, e00720. [Google Scholar] [CrossRef]
- Cameron, N. Arduino Applied; Springer: Berlin/Heidelberg, Germany, 2019. [Google Scholar]
- Santos, J.; Rodrigues, J.J.; Casal, J.; Saleem, K.; Denisov, V. Intelligent personal assistants based on internet of things approaches. IEEE Syst. J. 2016, 12, 1793–1802. [Google Scholar] [CrossRef]
- López-Ardao, J.C.; Rodrí guez-Rubio, R.F.; Suárez-González, A.; Rodrí guez-Pérez, M.; Sousa-Vieira, M.E. Current trends on green wireless sensor networks. Sensors 2021, 21, 4281. [Google Scholar] [CrossRef] [PubMed]
- Yunus, F.; Ismail, N.N.; Ariffin, S.S.; Shahidan, A.; Yusof, S.S.; Fisal, N.; Saleem, K.; Ahmed, A. Proposed Technique for Transport Protocol in Wireless Sensor Network (WSN) for Multimedia Application. J. Teknol. 2012, 58. [Google Scholar] [CrossRef]
- Marques, G.; Saini, J.; Dutta, M.; Singh, P.K.; Hong, W.-C. Indoor Air Quality Monitoring Systems for Enhanced Living Environments: A Review toward Sustainable Smart Cities. Sustainability 2020, 12, 4024. [Google Scholar] [CrossRef]
- Majid, M.; Habib, S.; Javed, A.R.; Rizwan, M.; Srivastava, G.; Gadekallu, T.R.; Lin, J.C.-W. Applications of wireless sensor networks and internet of things frameworks in the industry revolution 4.0: A systematic literature review. Sensors 2022, 22, 2087. [Google Scholar] [CrossRef]
- Alkama, L.; Bouallouche-Medjkoune, L. IEEE 802.15. 4 historical revolution versions: A survey. Computing 2021, 103, 99–131. [Google Scholar] [CrossRef]
- Kim, B.-S.; Kim, K.-I.; Shah, B.; Ullah, S.; Kim, K. An extended IEEE 802.15. 6 for thermal-aware resource management. Ad Hoc Netw. 2022, 131, 102856. [Google Scholar] [CrossRef]
- Yassein, M.B.; Al Nassan, H.; Mardini, W.; Khamayseh, Y. An Optimal (BO, SO) Values for Different Arrival Rates IEEE 802.15. 4/LR-WPAN. In Proceedings of the 2021 12th International Conference on Information and Communication Systems (ICICS), Valencia, Spain, 24–26 May 2021; pp. 392–398. [Google Scholar]
- Jabri, I.; Mansour, K.; Al-Oqily, I.; Ezzedine, T. Enhanced characterization and modeling of A-MPDU aggregation for IEEE 802.11 n WLANs. Trans. Emerg. Telecommun. Technol. 2022, 33, e4384. [Google Scholar]
- Farooqi, M.R.; Iqbal, N.; Singh, N.K.; Affan, M.; Raza, K. Wireless sensor networks towards convenient infrastructure in the healthcare industry: A systematic study. In Sensors for Health Monitoring; Elsevier: Amsterdam, The Netherlands, 2019; pp. 31–46. [Google Scholar]
- Ko, J.; Lu, C.; Srivastava, M.B.; Stankovic, J.A.; Terzis, A.; Welsh, M. Wireless sensor networks for healthcare. Proc. IEEE 2010, 98, 1947–1960. [Google Scholar] [CrossRef] [Green Version]
- Aminian, M.; Naji, H.R. A hospital healthcare monitoring system using wireless sensor networks. J. Health Med. Inform. 2013, 4, 121. [Google Scholar] [CrossRef] [Green Version]
- Tuna, G.; Gungor, V. Energy harvesting and battery technologies for powering wireless sensor networks. In Industrial Wireless Sensor Networks; Elsevier: Amsterdam, The Netherlands, 2016; pp. 25–38. [Google Scholar]
- Rodrigues, J.J.; Gawanmeh, A.; Saleem, K.; Parvin, S. Smart Devices, Applications, and Protocols for the IoT; IGI Global: Hershey, PA, USA, 2019. [Google Scholar]
- Saleem, K.; Alabduljabbar, G.M.; Alrowais, N.; Al-Muhtadi, J.; Imran, M.; Rodrigues, J.J. Bio-inspired network security for 5G-enabled IoT applications. IEEE Access 2020, 8, 229152–229160. [Google Scholar] [CrossRef]
- Yao, X.; Farha, F.; Li, R.; Psychoula, I.; Chen, L.; Ning, H. Security and privacy issues of physical objects in the IoT: Challenges and opportunities. Digit. Commun. Netw. 2021, 7, 373–384. [Google Scholar] [CrossRef]
- Arshad, J.; Rehman, A.U.; Othman, M.T.B.; Ahmad, M.; Tariq, H.B.; Khalid, M.A.; Moosa, M.A.R.; Shafiq, M.; Hamam, H. Deployment of Wireless Sensor Network and IoT Platform to Implement an Intelligent Animal Monitoring System. Sustainability 2022, 14, 6249. [Google Scholar] [CrossRef]
- Molnár, J.; Kiresova, S.; Vince, T.; Kovac, D.; Jacko, P.; Beres, M.; Hrabovský, P. Weather Station IoT Educational Model Using Cloud Services. J. Univers. Comput. Sci. 2020, 26, 1495–1512. [Google Scholar] [CrossRef]
- Corbellini, S.; Di Francia, E.; Grassini, S.; Iannucci, L.; Lombardo, L.; Parvis, M. Cloud based sensor network for environmental monitoring. Measurement 2018, 118, 354–361. [Google Scholar] [CrossRef]
- Mukherjee, B.; Wang, S.; Lu, W.; Neupane, R.L.; Dunn, D.; Ren, Y.; Su, Q.; Calyam, P. Flexible IoT security middleware for end-to-end cloud−fog communication. Future Gener. Comput. Syst. 2018, 87, 688–703. [Google Scholar] [CrossRef]
- Kim, J. Cloud Internet of Things for the Smart Environment of a Smart City. Master’s Thesis, California State University, San Bernardino, CA, USA, 2021. [Google Scholar]
- Arroyo, P.; Herrero, J.L.; Suárez, J.I.; Lozano, J. Wireless sensor network combined with cloud computing for air quality monitoring. Sensors 2019, 19, 691. [Google Scholar] [CrossRef] [Green Version]
- Prasad, B.; Manjunatha, R. Internet of Things Based Monitoring System for Oil Tanks. In Proceedings of the 2021 IEEE International Conference on Mobile Networks and Wireless Communications (ICMNWC), Tumkur, Karnataka, India, 3–4 December 2021; pp. 1–7. [Google Scholar]
- Banara, S.; Singh, T.; Chauhan, A. IoT Based Weather Monitoring System for Smart Cities: A Comprehensive Review. In Proceedings of the 2022 International Conference for Advancement in Technology (ICONAT), Goa, India, 21–22 January 2022; pp. 1–6. [Google Scholar]
Publisher’s Note: MDPI stays neutral with regard to jurisdictional claims in published maps and institutional affiliations. |
© 2022 by the authors. Licensee MDPI, Basel, Switzerland. This article is an open access article distributed under the terms and conditions of the Creative Commons Attribution (CC BY) license (https://creativecommons.org/licenses/by/4.0/).