
Assessment of Groundwater Quality and the Main Controls on Its Hydrochemistry in a Changing Climate in Morocco (Essaouira Basin)

 , , ,
, , ,
Abstract
1. Introduction
2. Materials and Methods
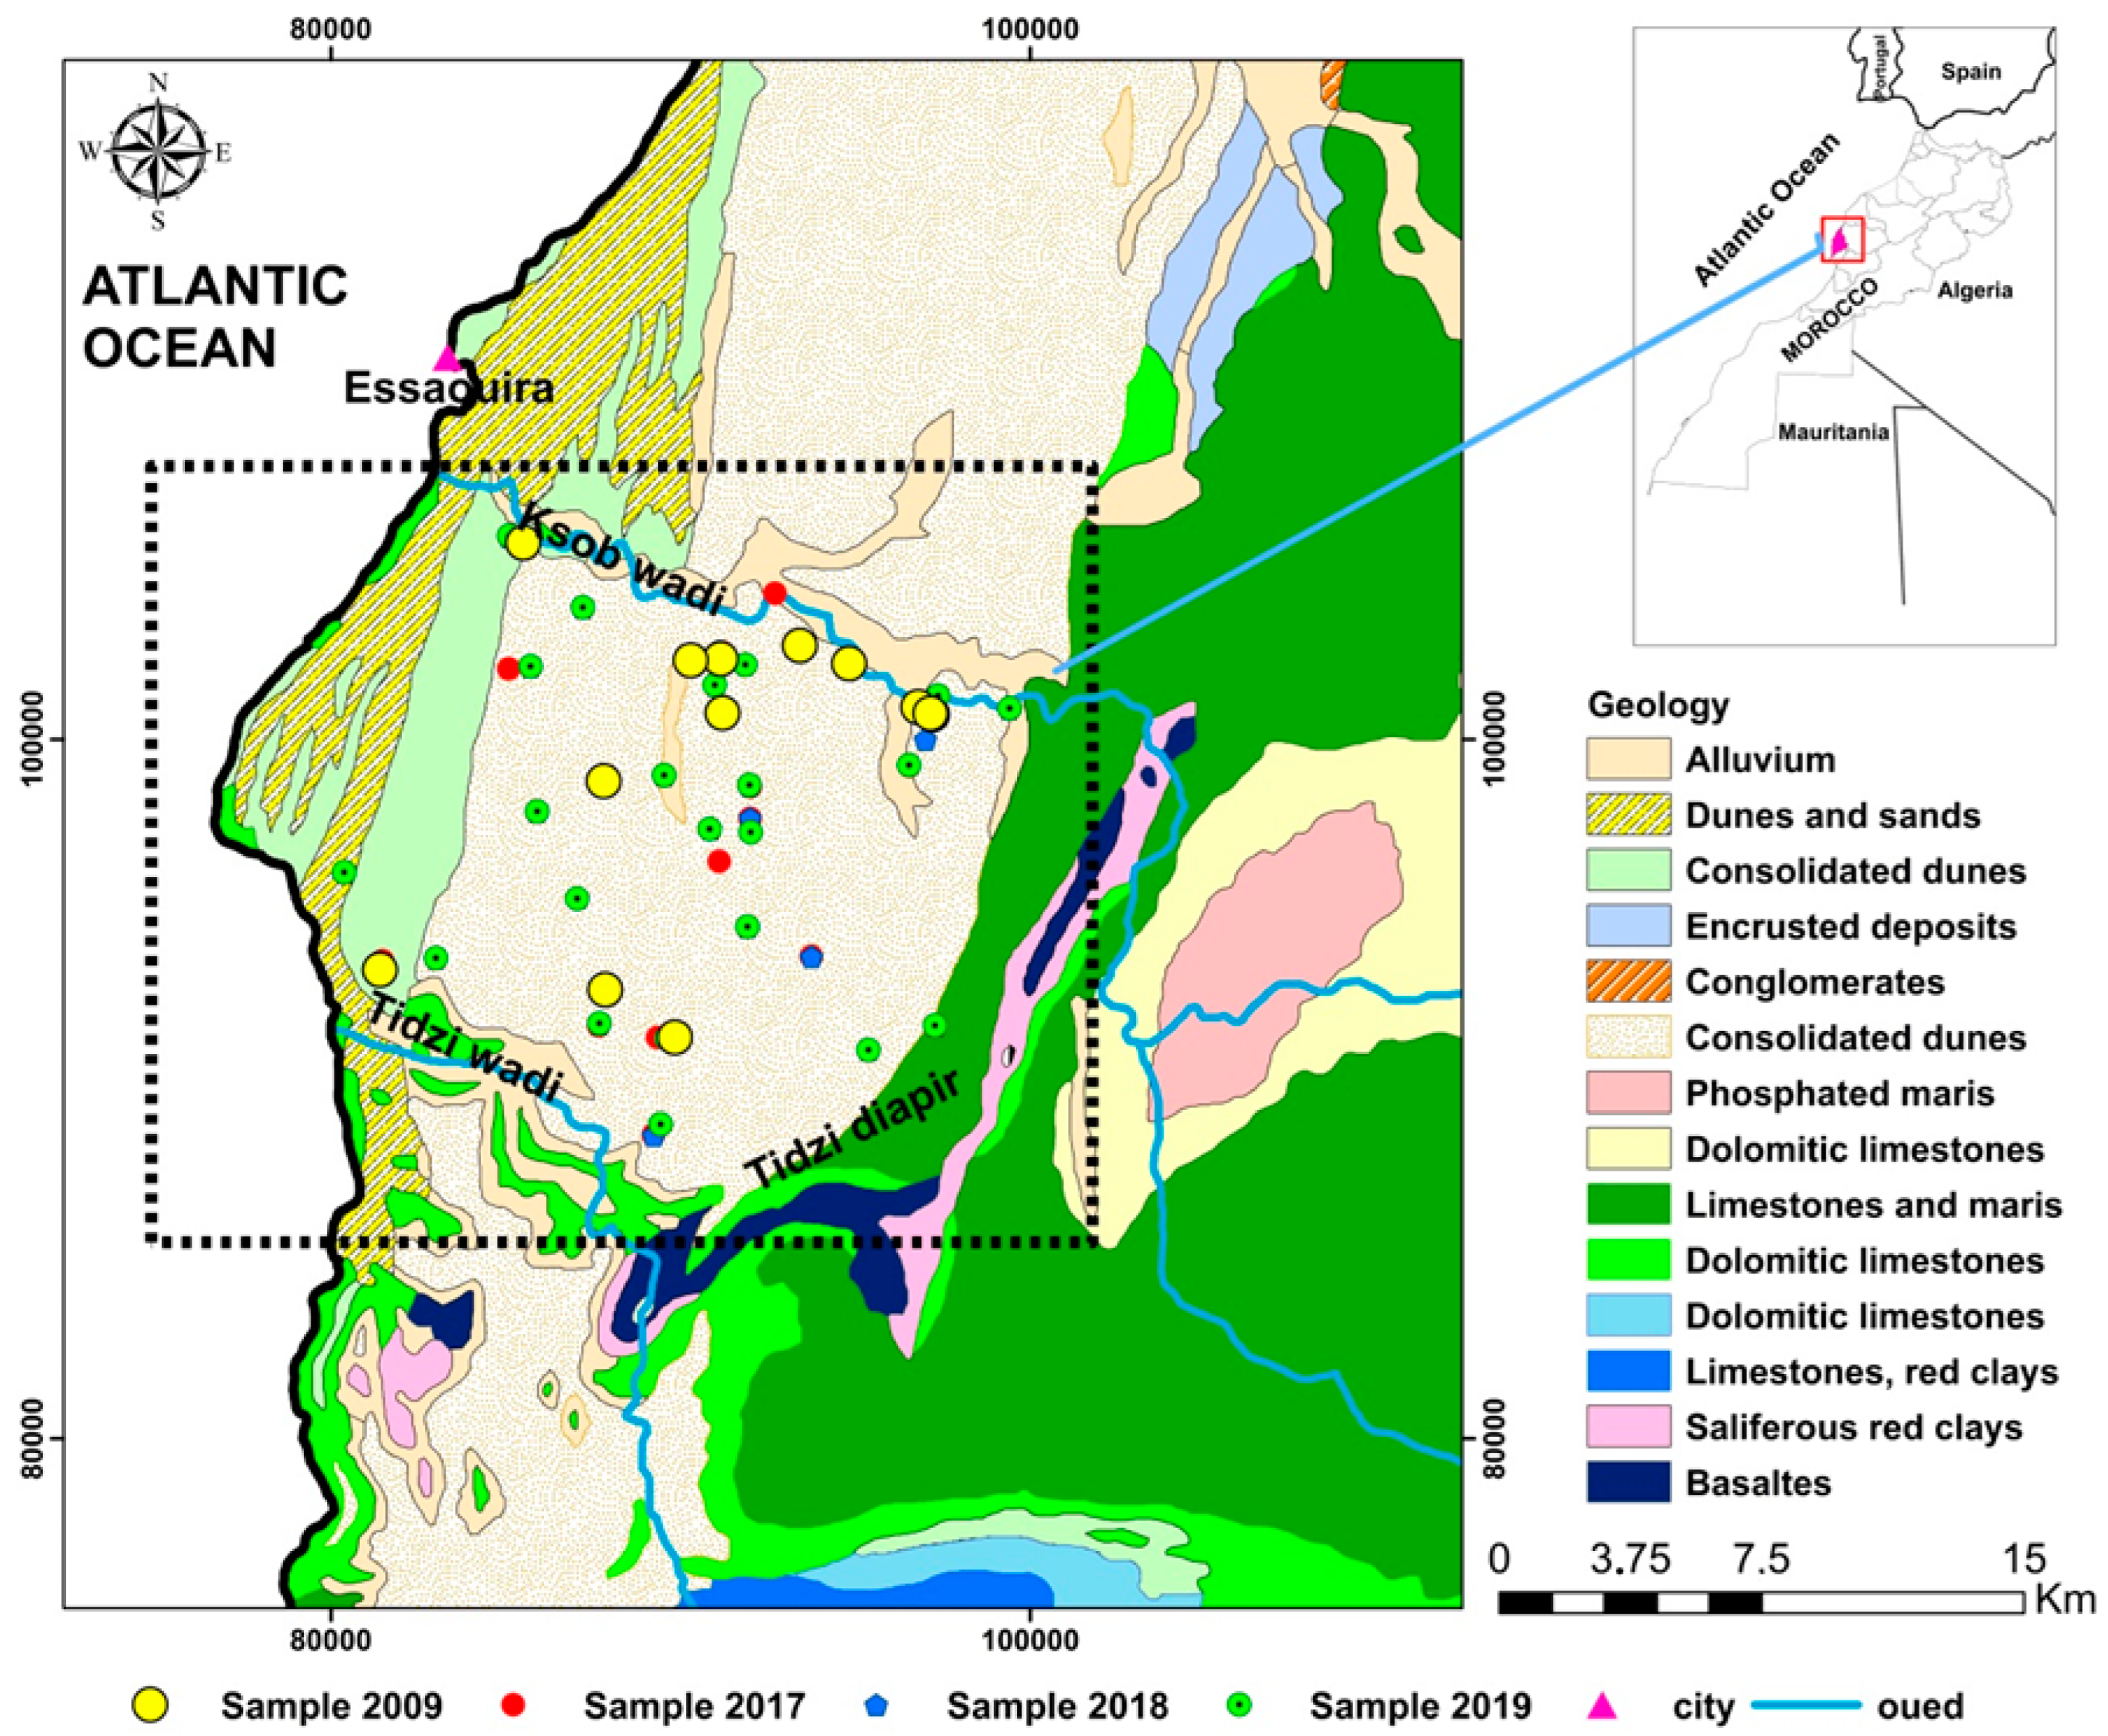
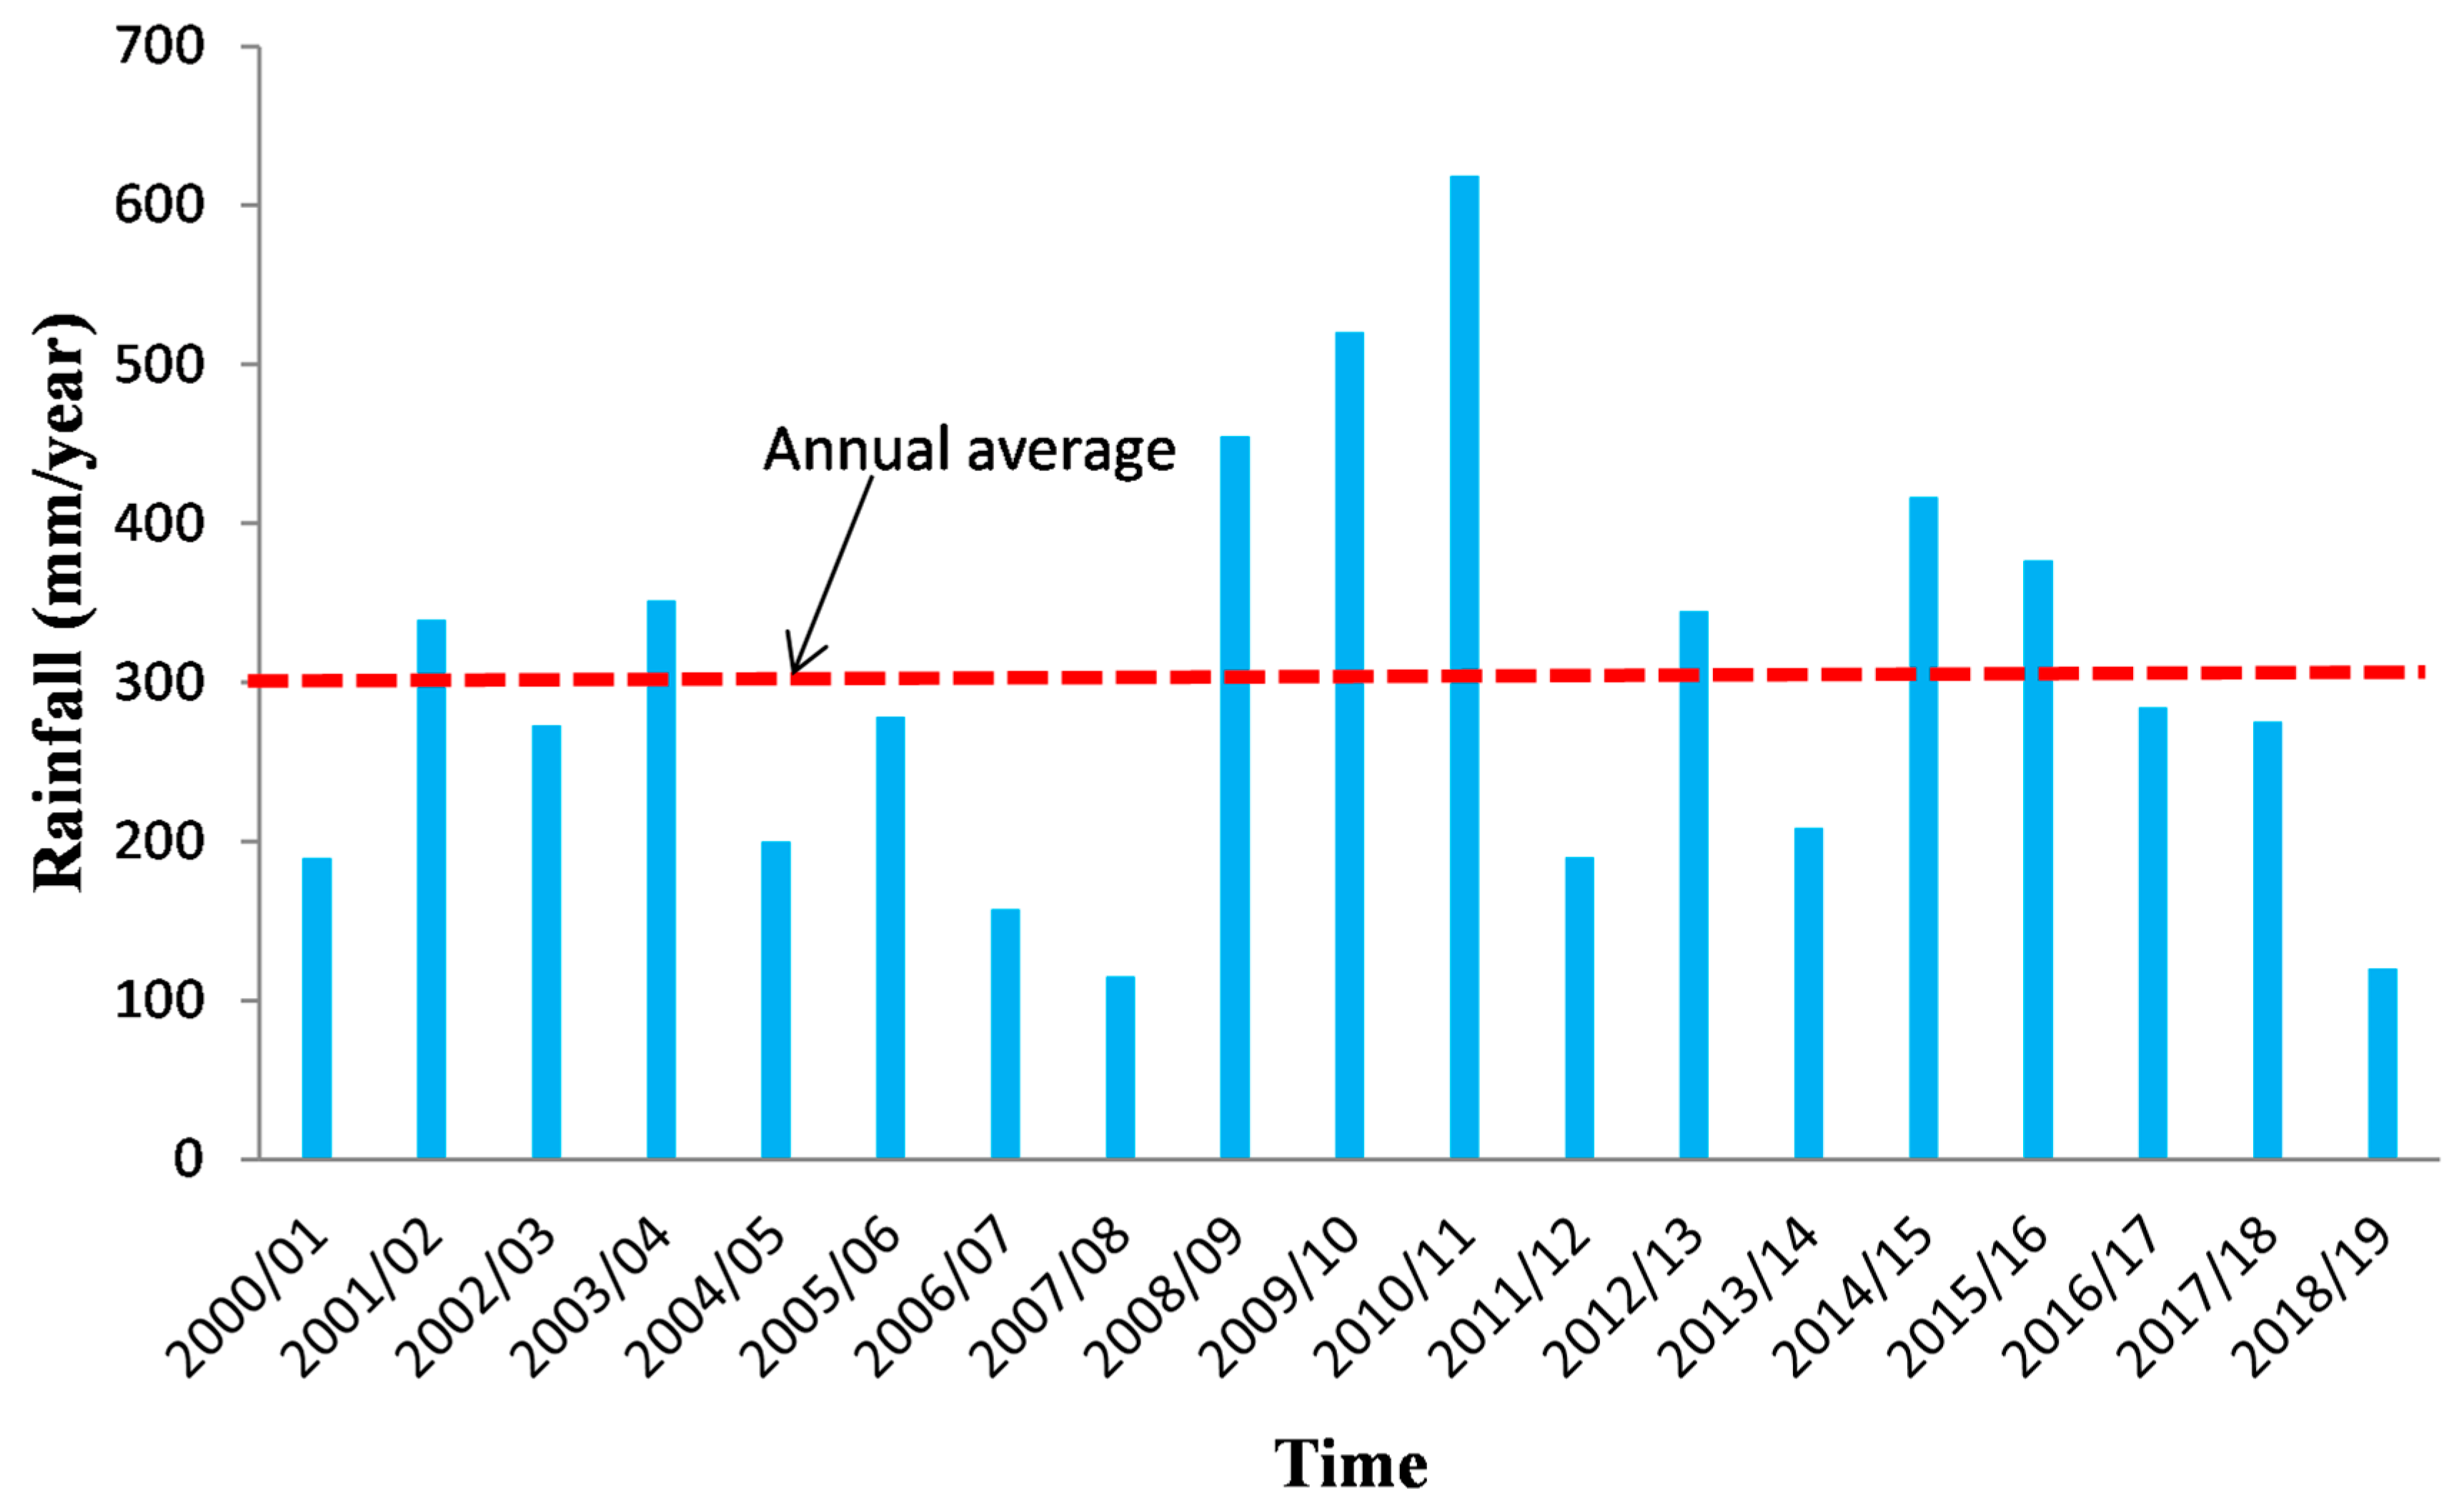
2.1. Location and Climate
2.2. Geologic Setting
2.3. Hydrogeologic Setting
2.4. Analytical Techniques and Groundwater Sampling
2.5. Groundwater Quality: Water Quality Index (WQI)
2.6. Irrigation Quality: Irrigation Water Quality Index (IWQI)
2.7. Irrigation Quality: Irrigation Water Quality Index (IWQI)
3. Results and Discussion
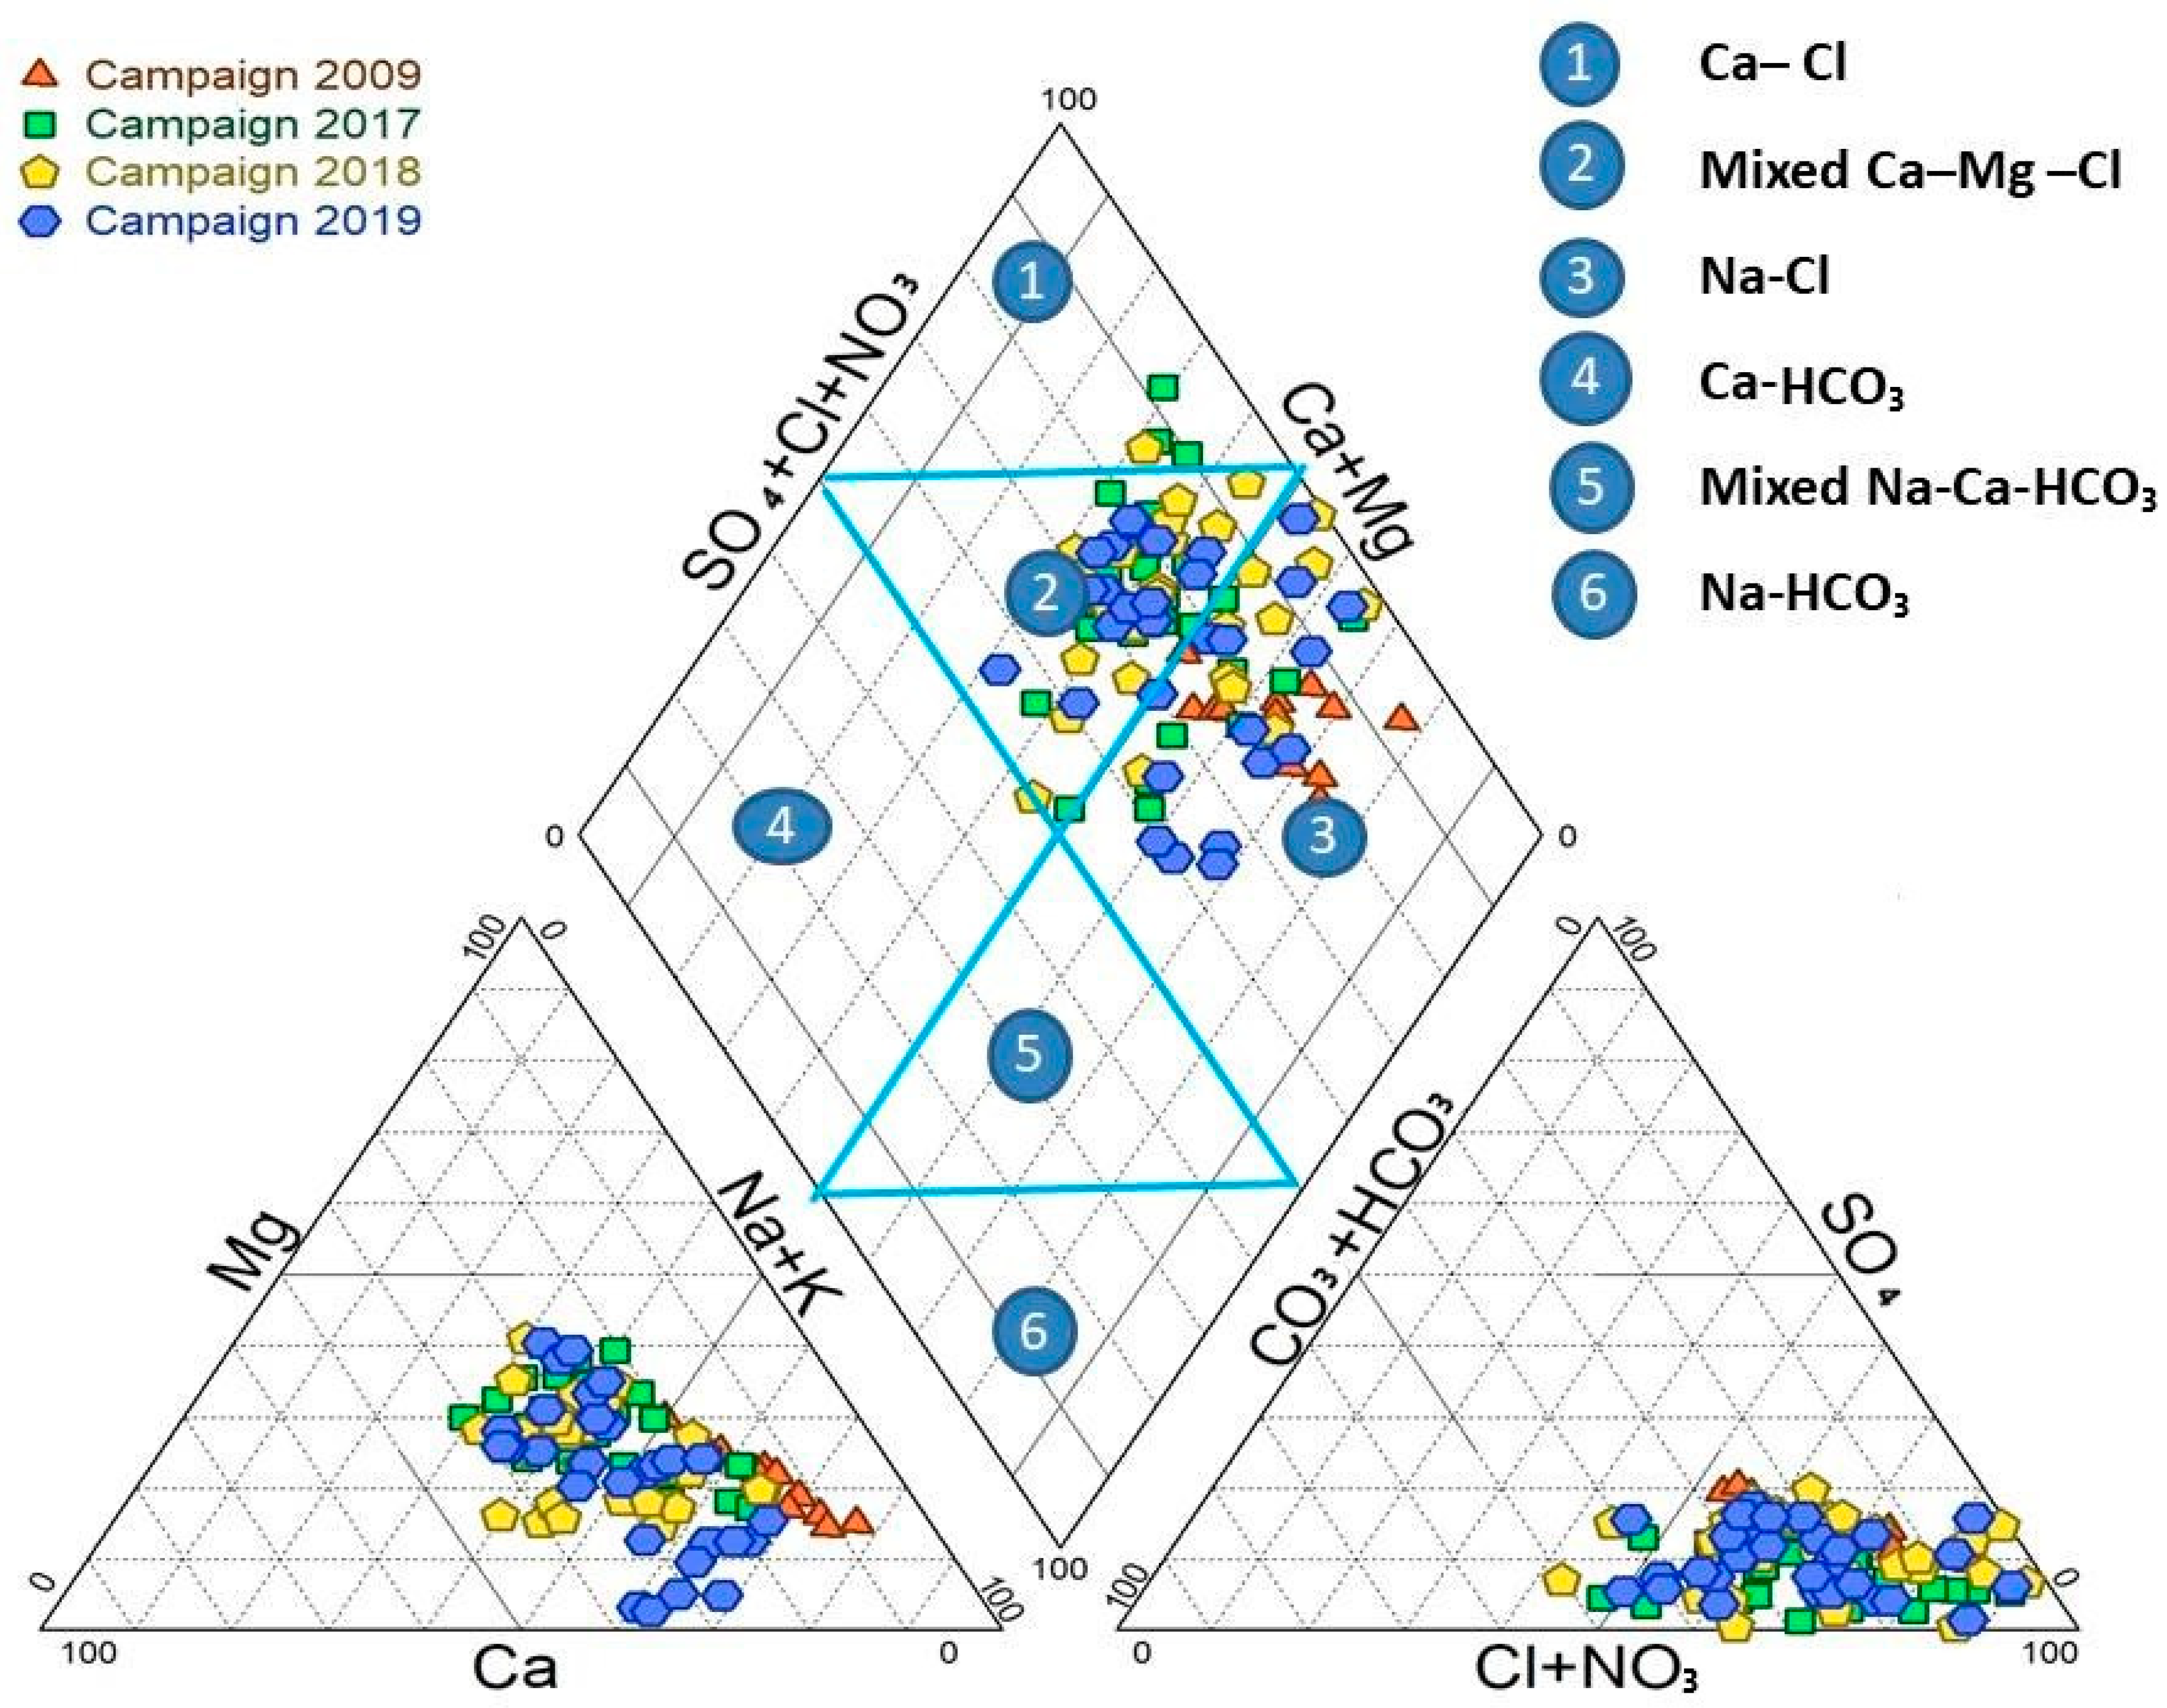
3.1. Groundwater Hydrochemical Types
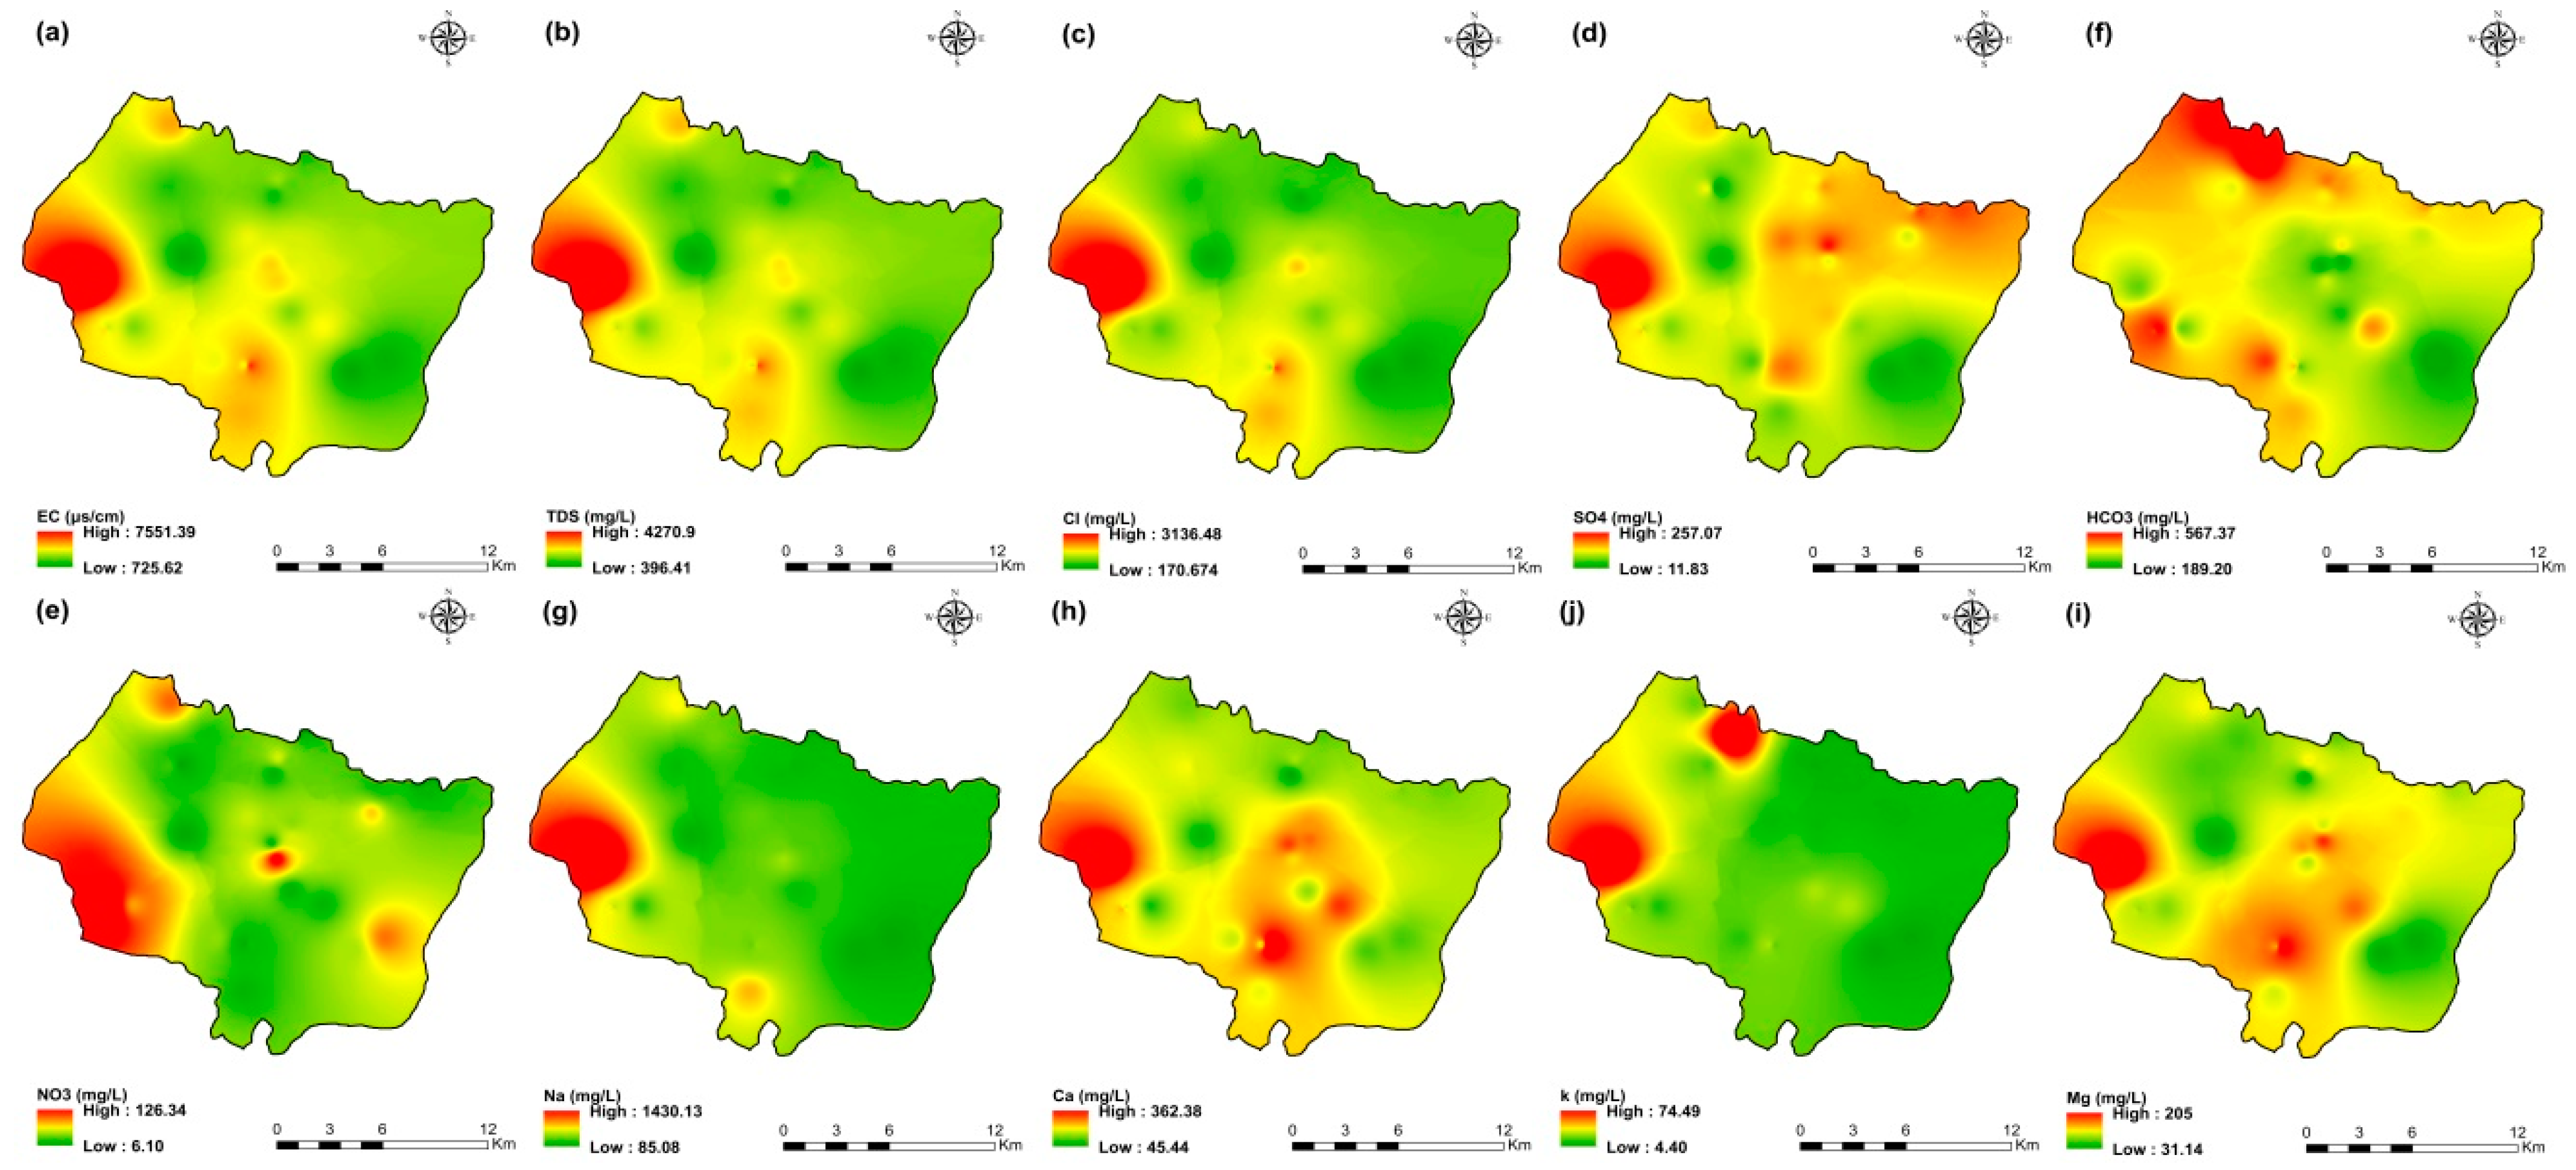
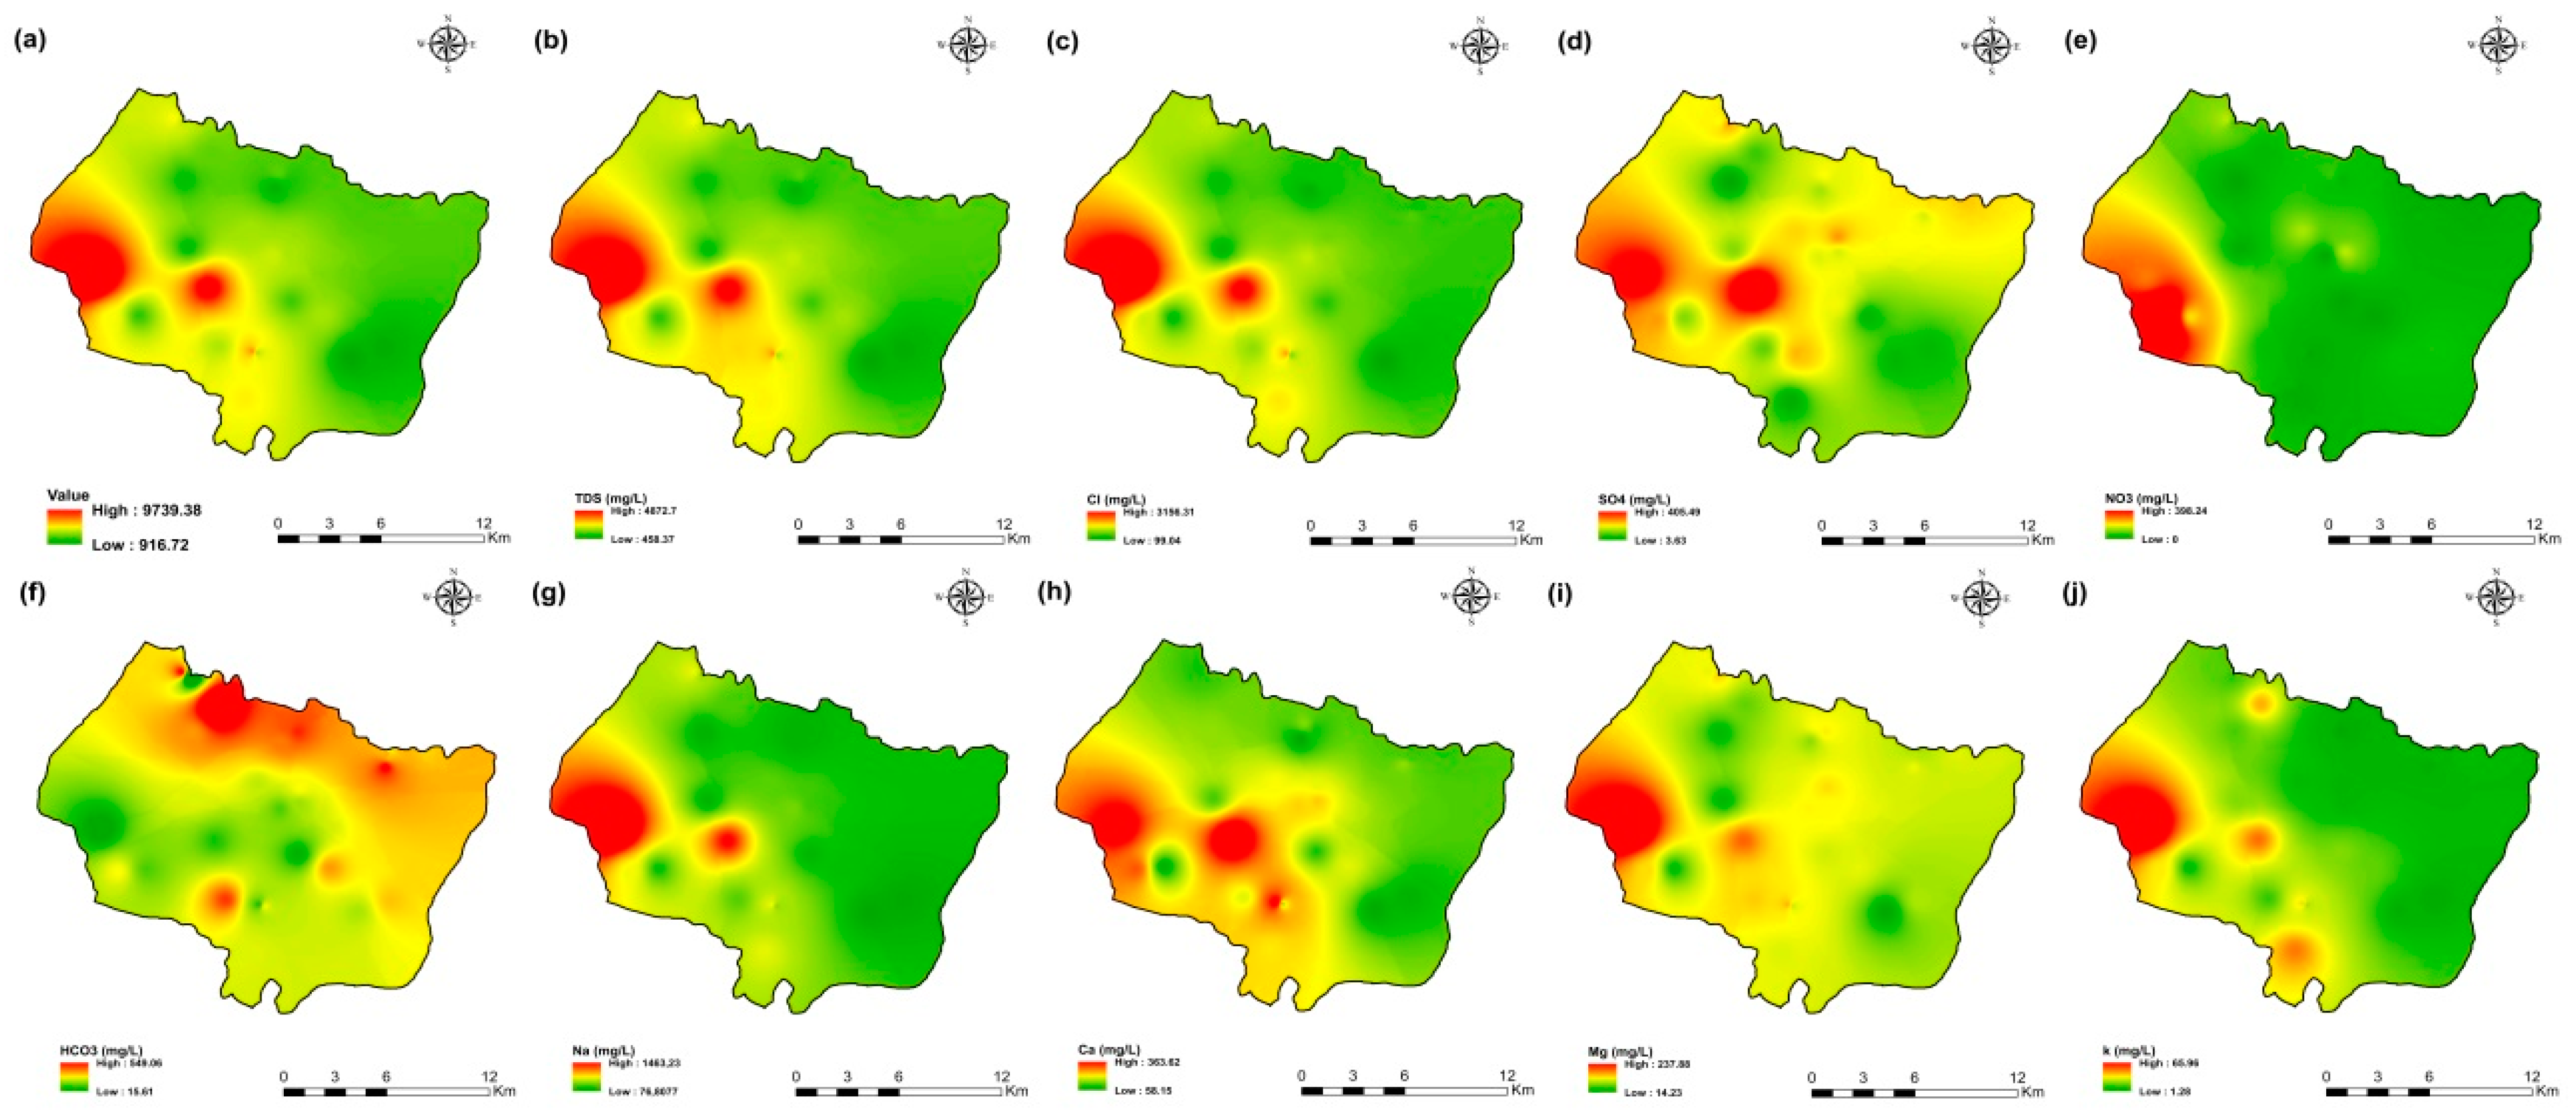
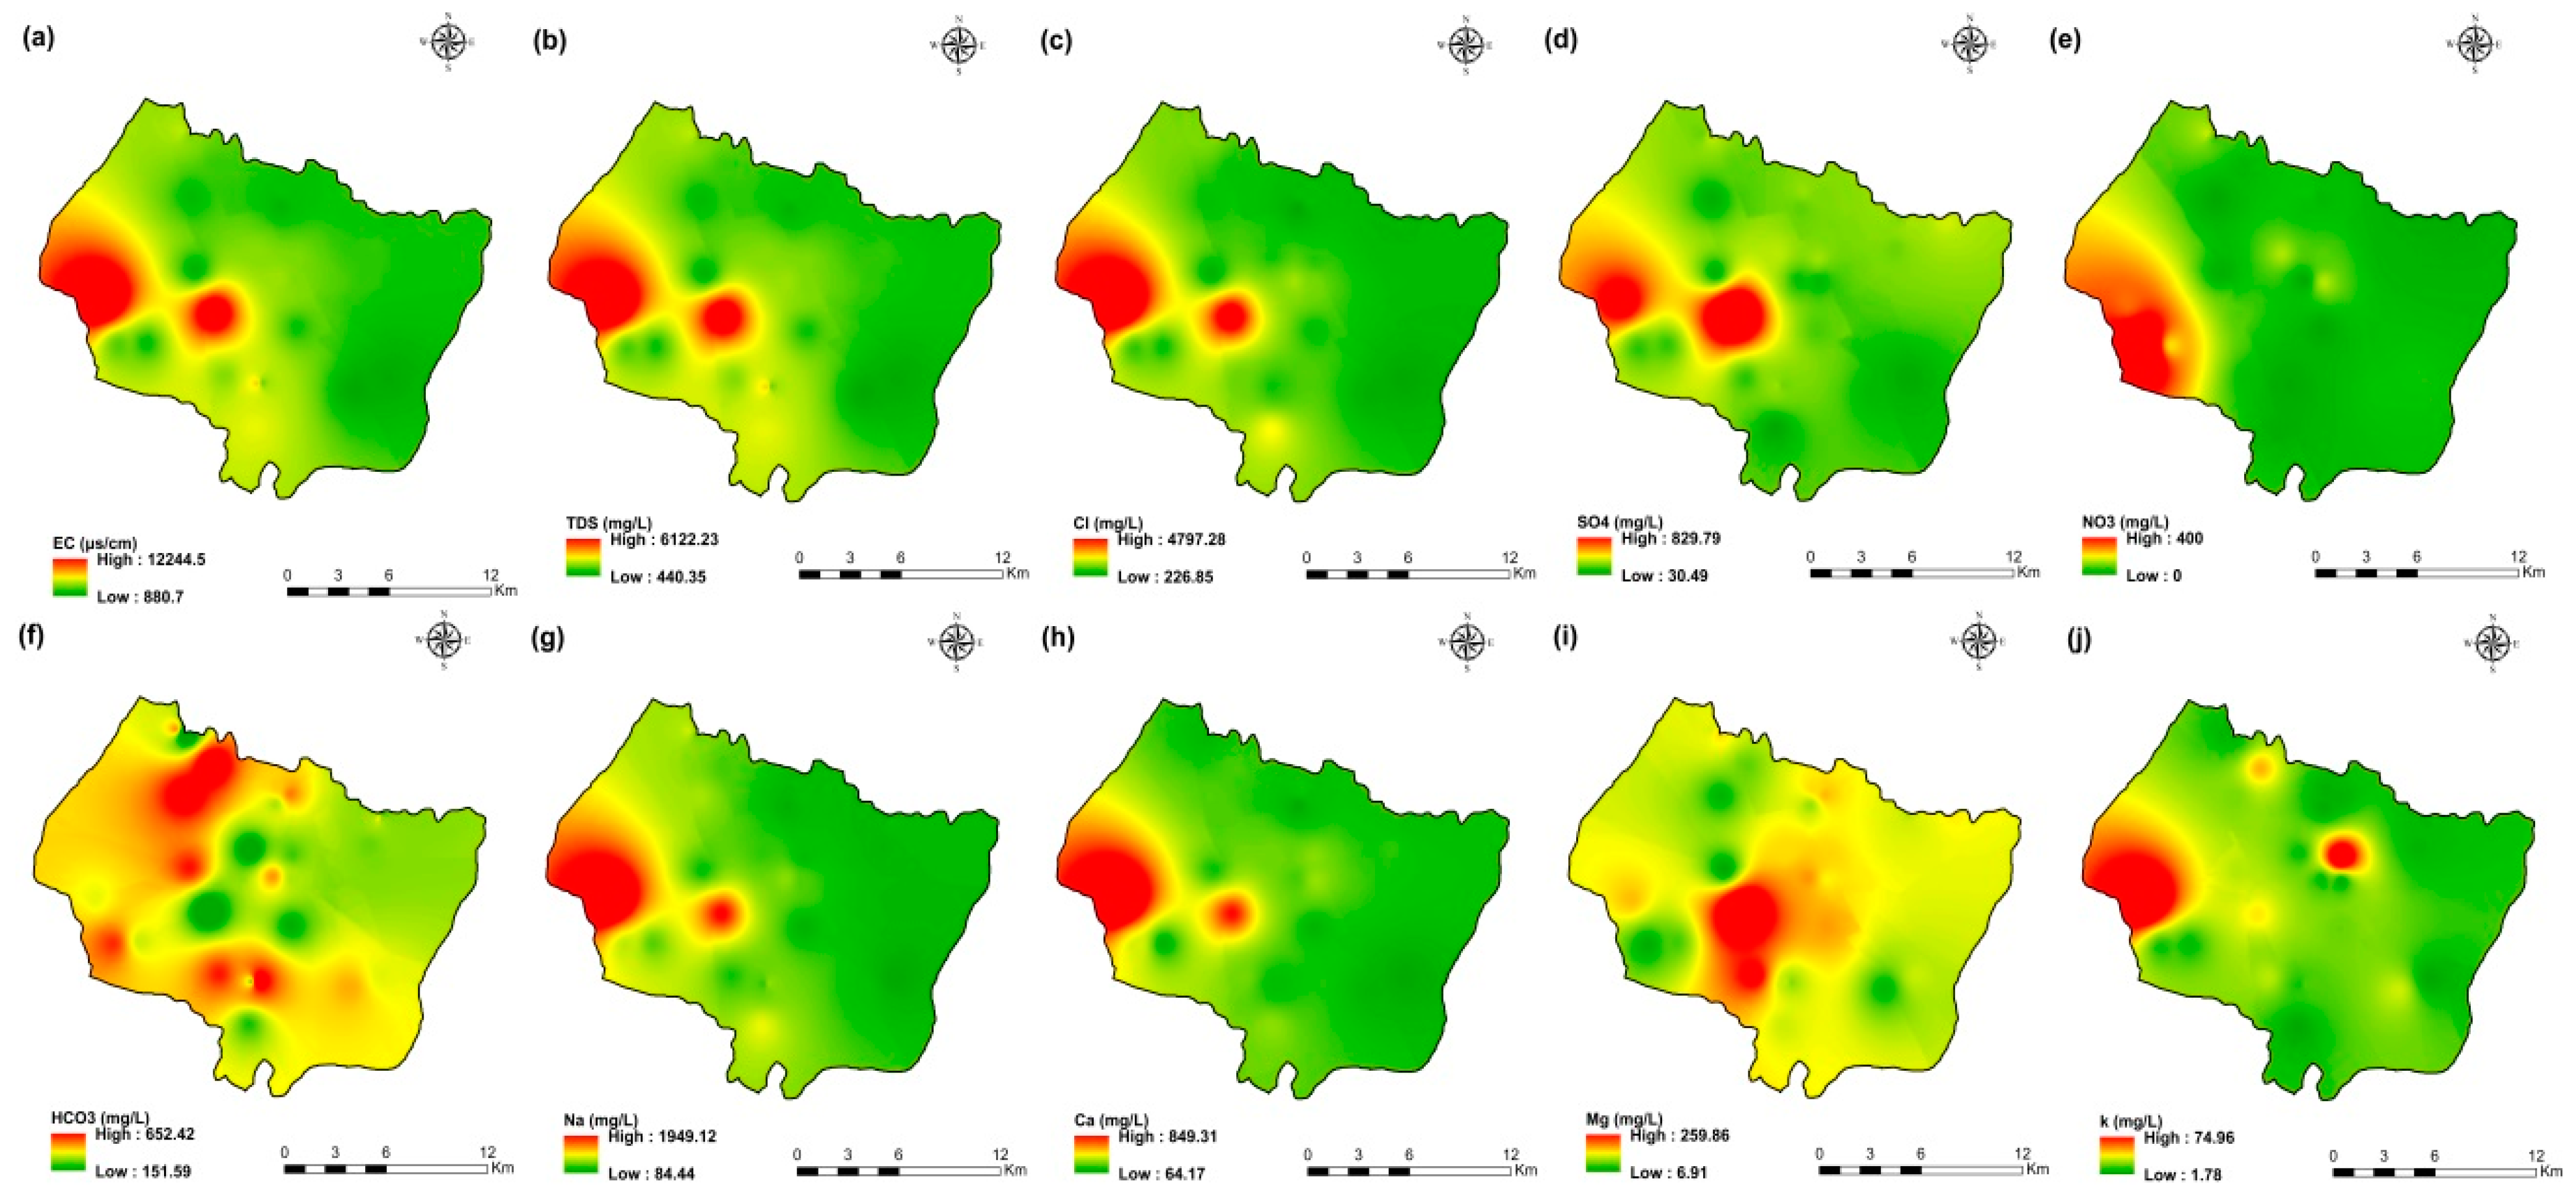
3.2. Hydrochemical Characteristics
3.3. Hydrochemical Characteristics
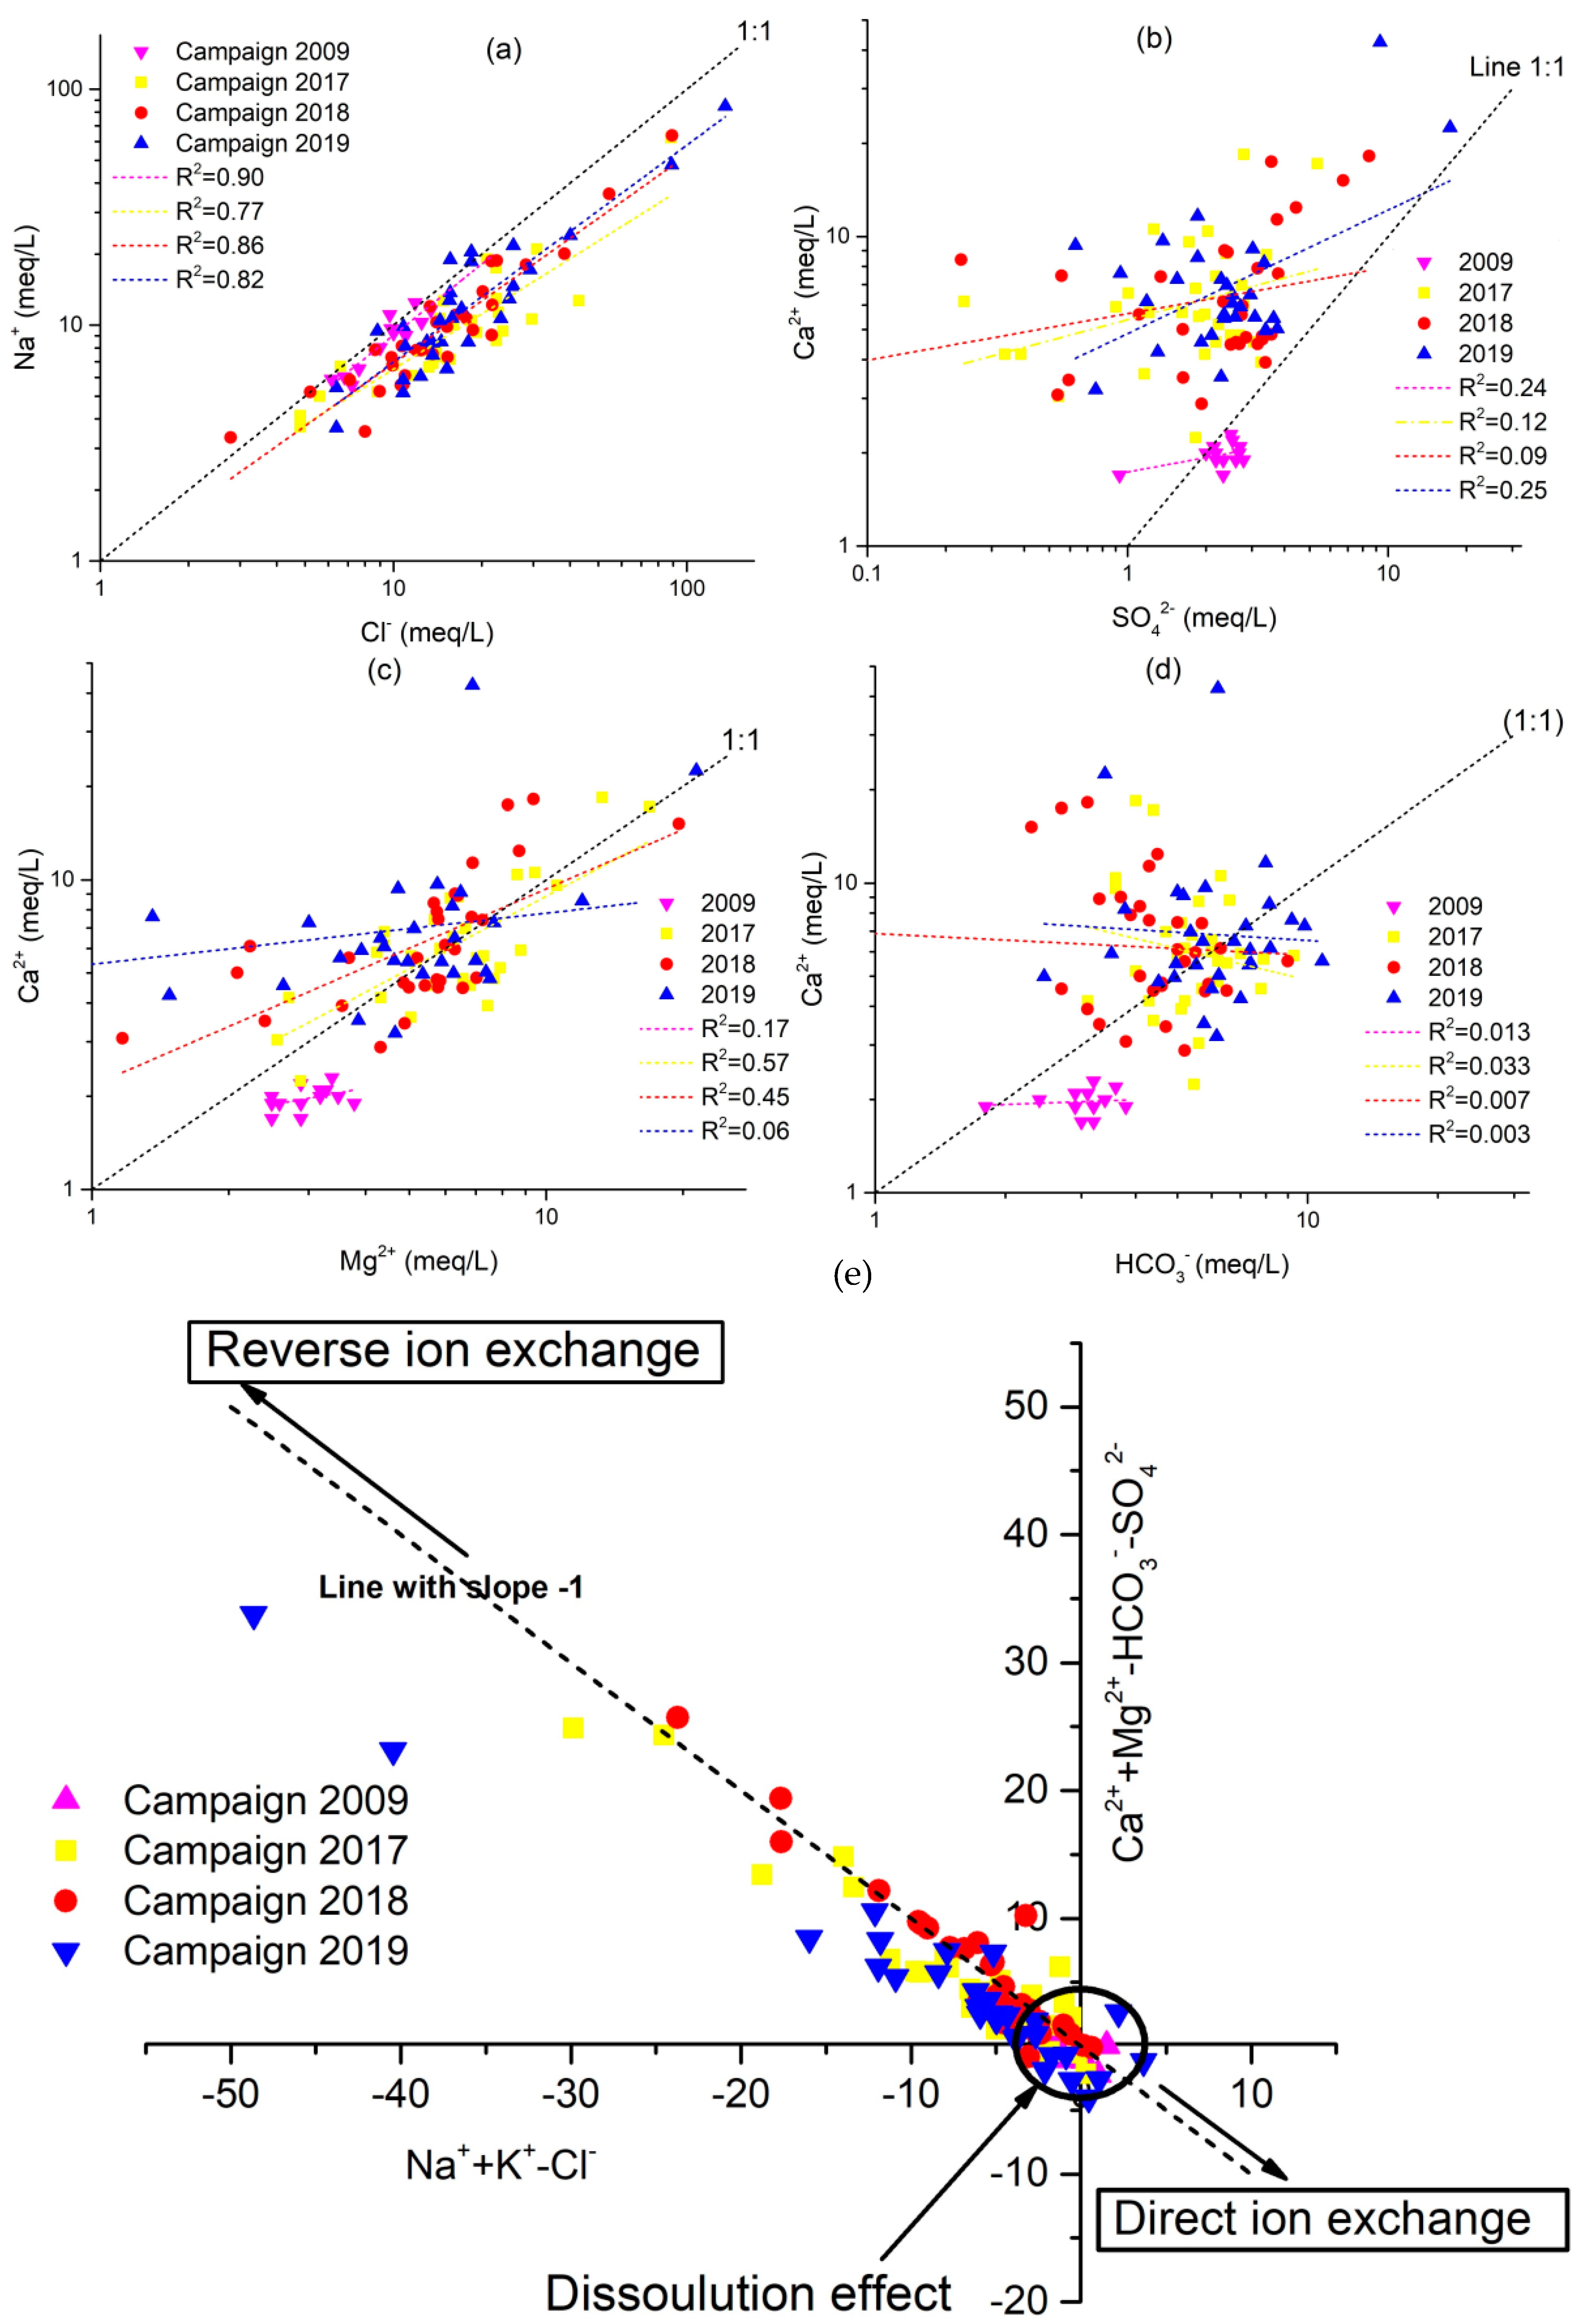
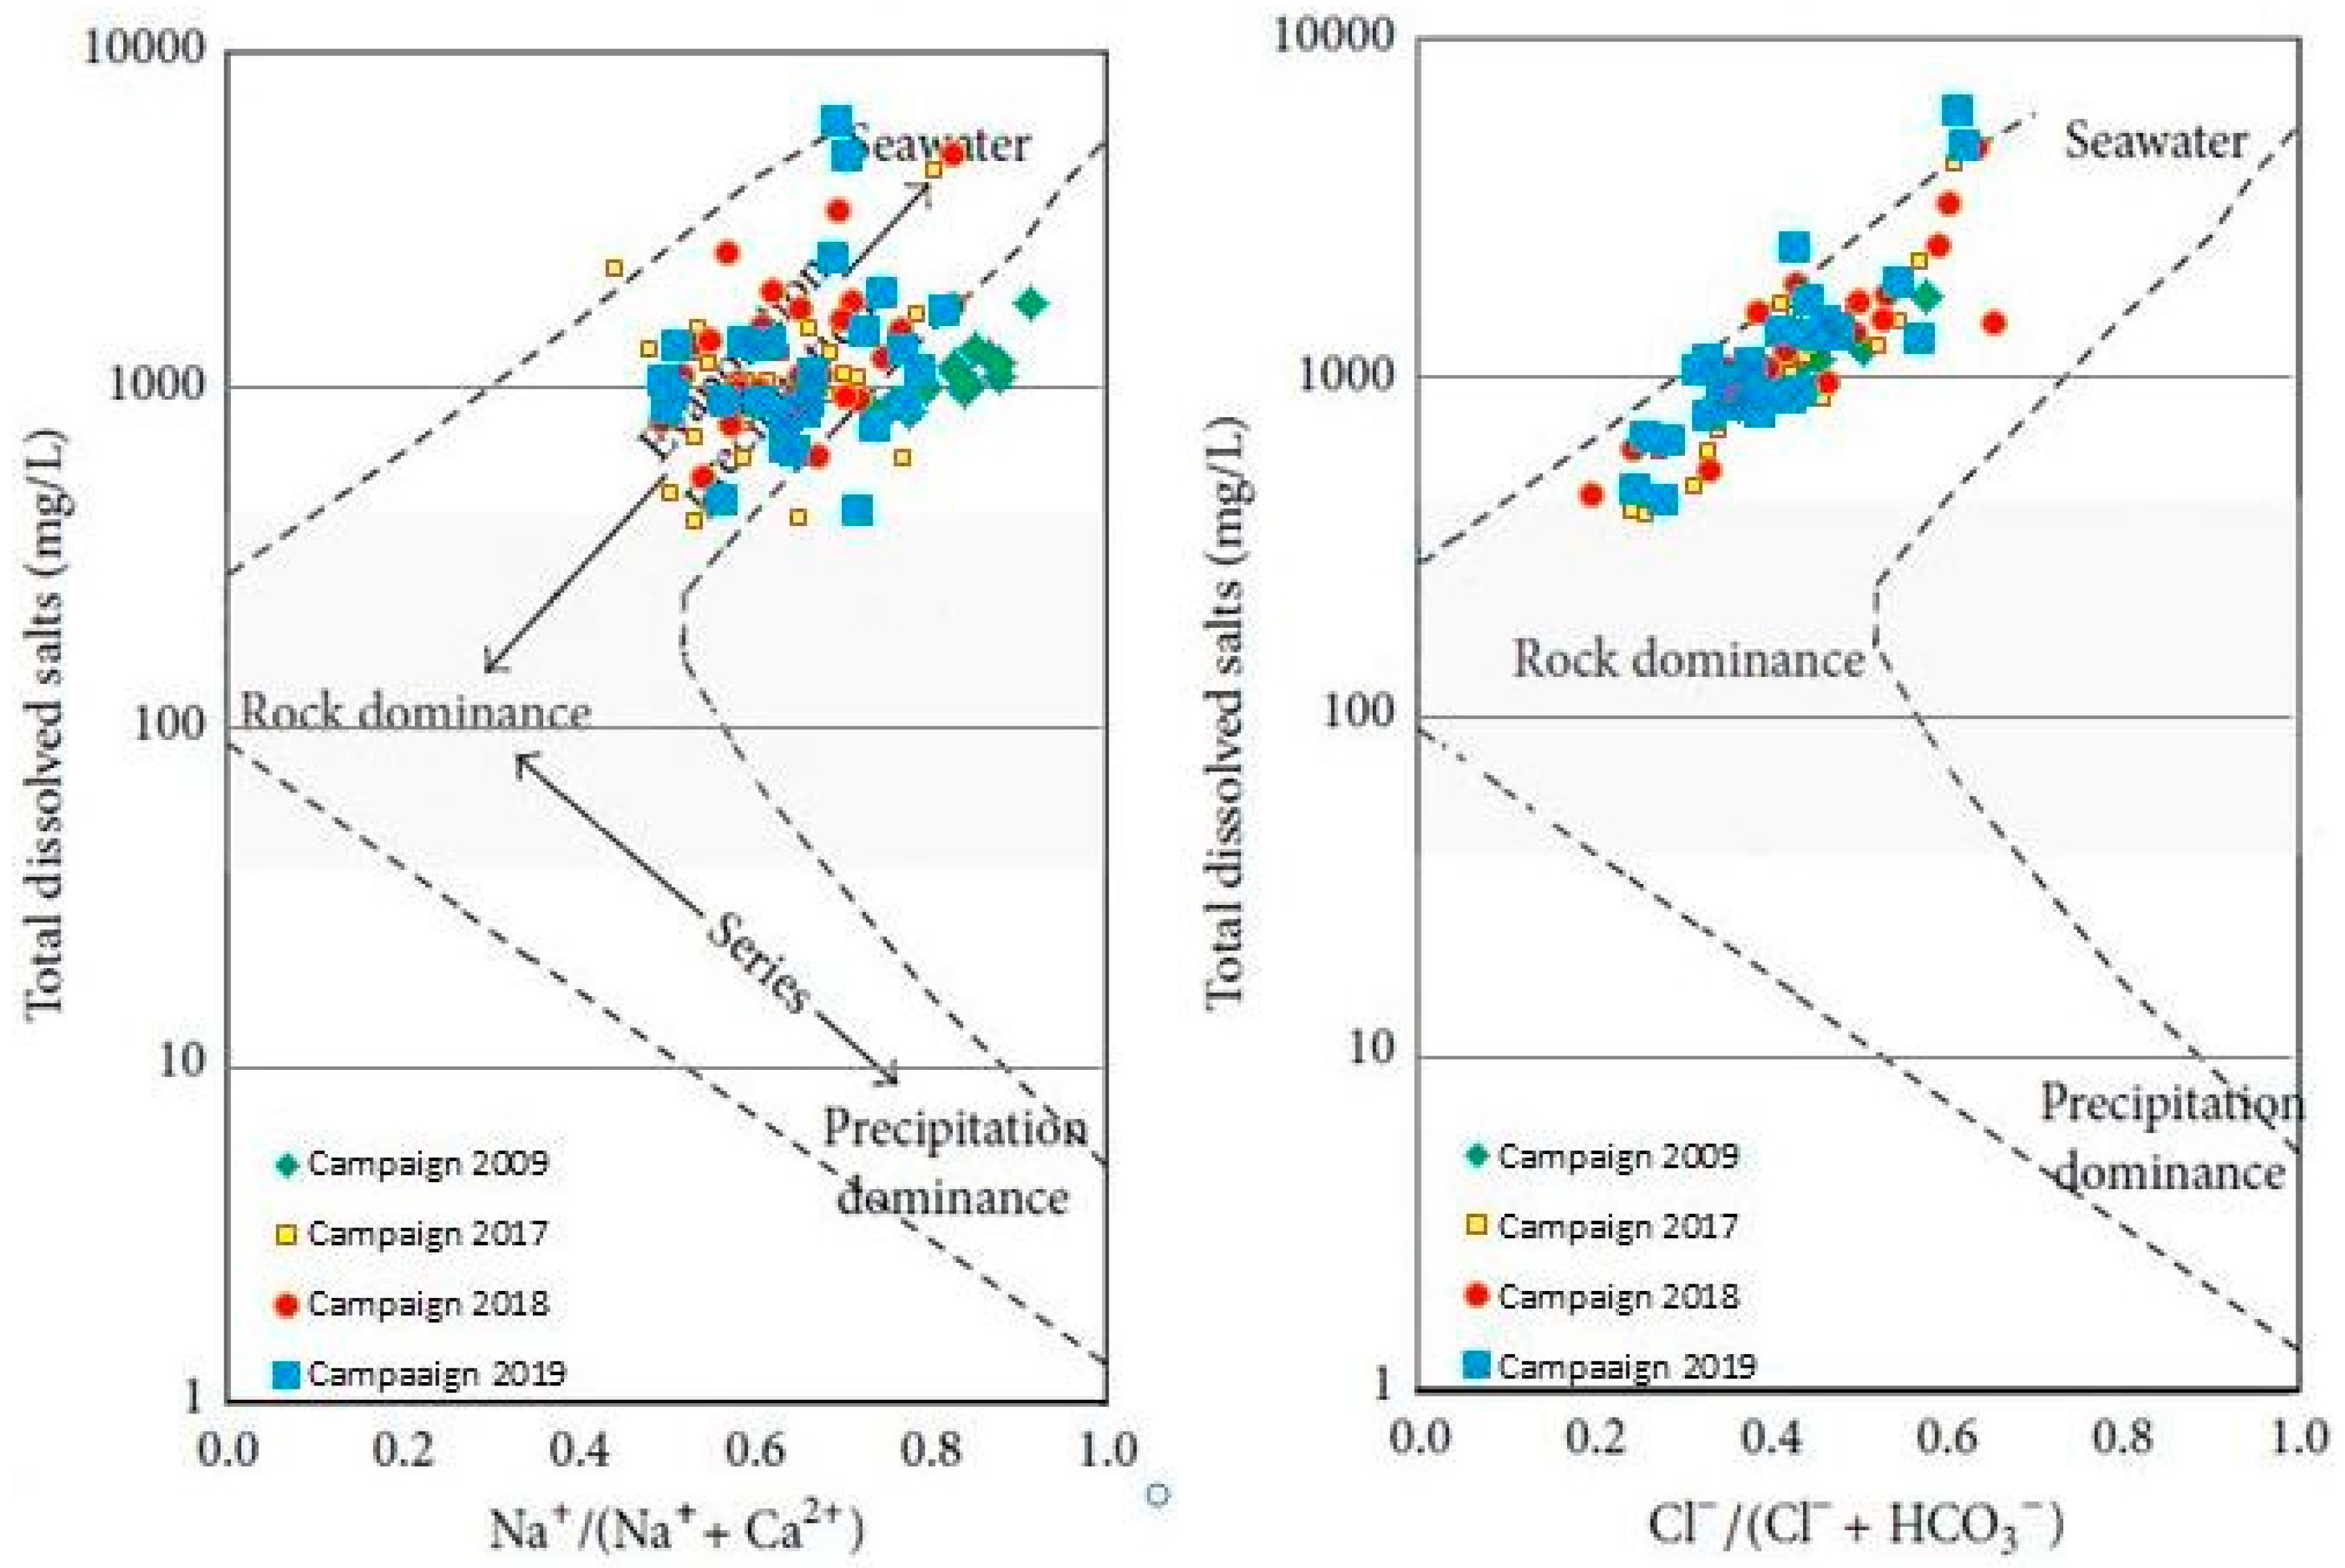
3.4. Major Ion Relations in the Groundwater
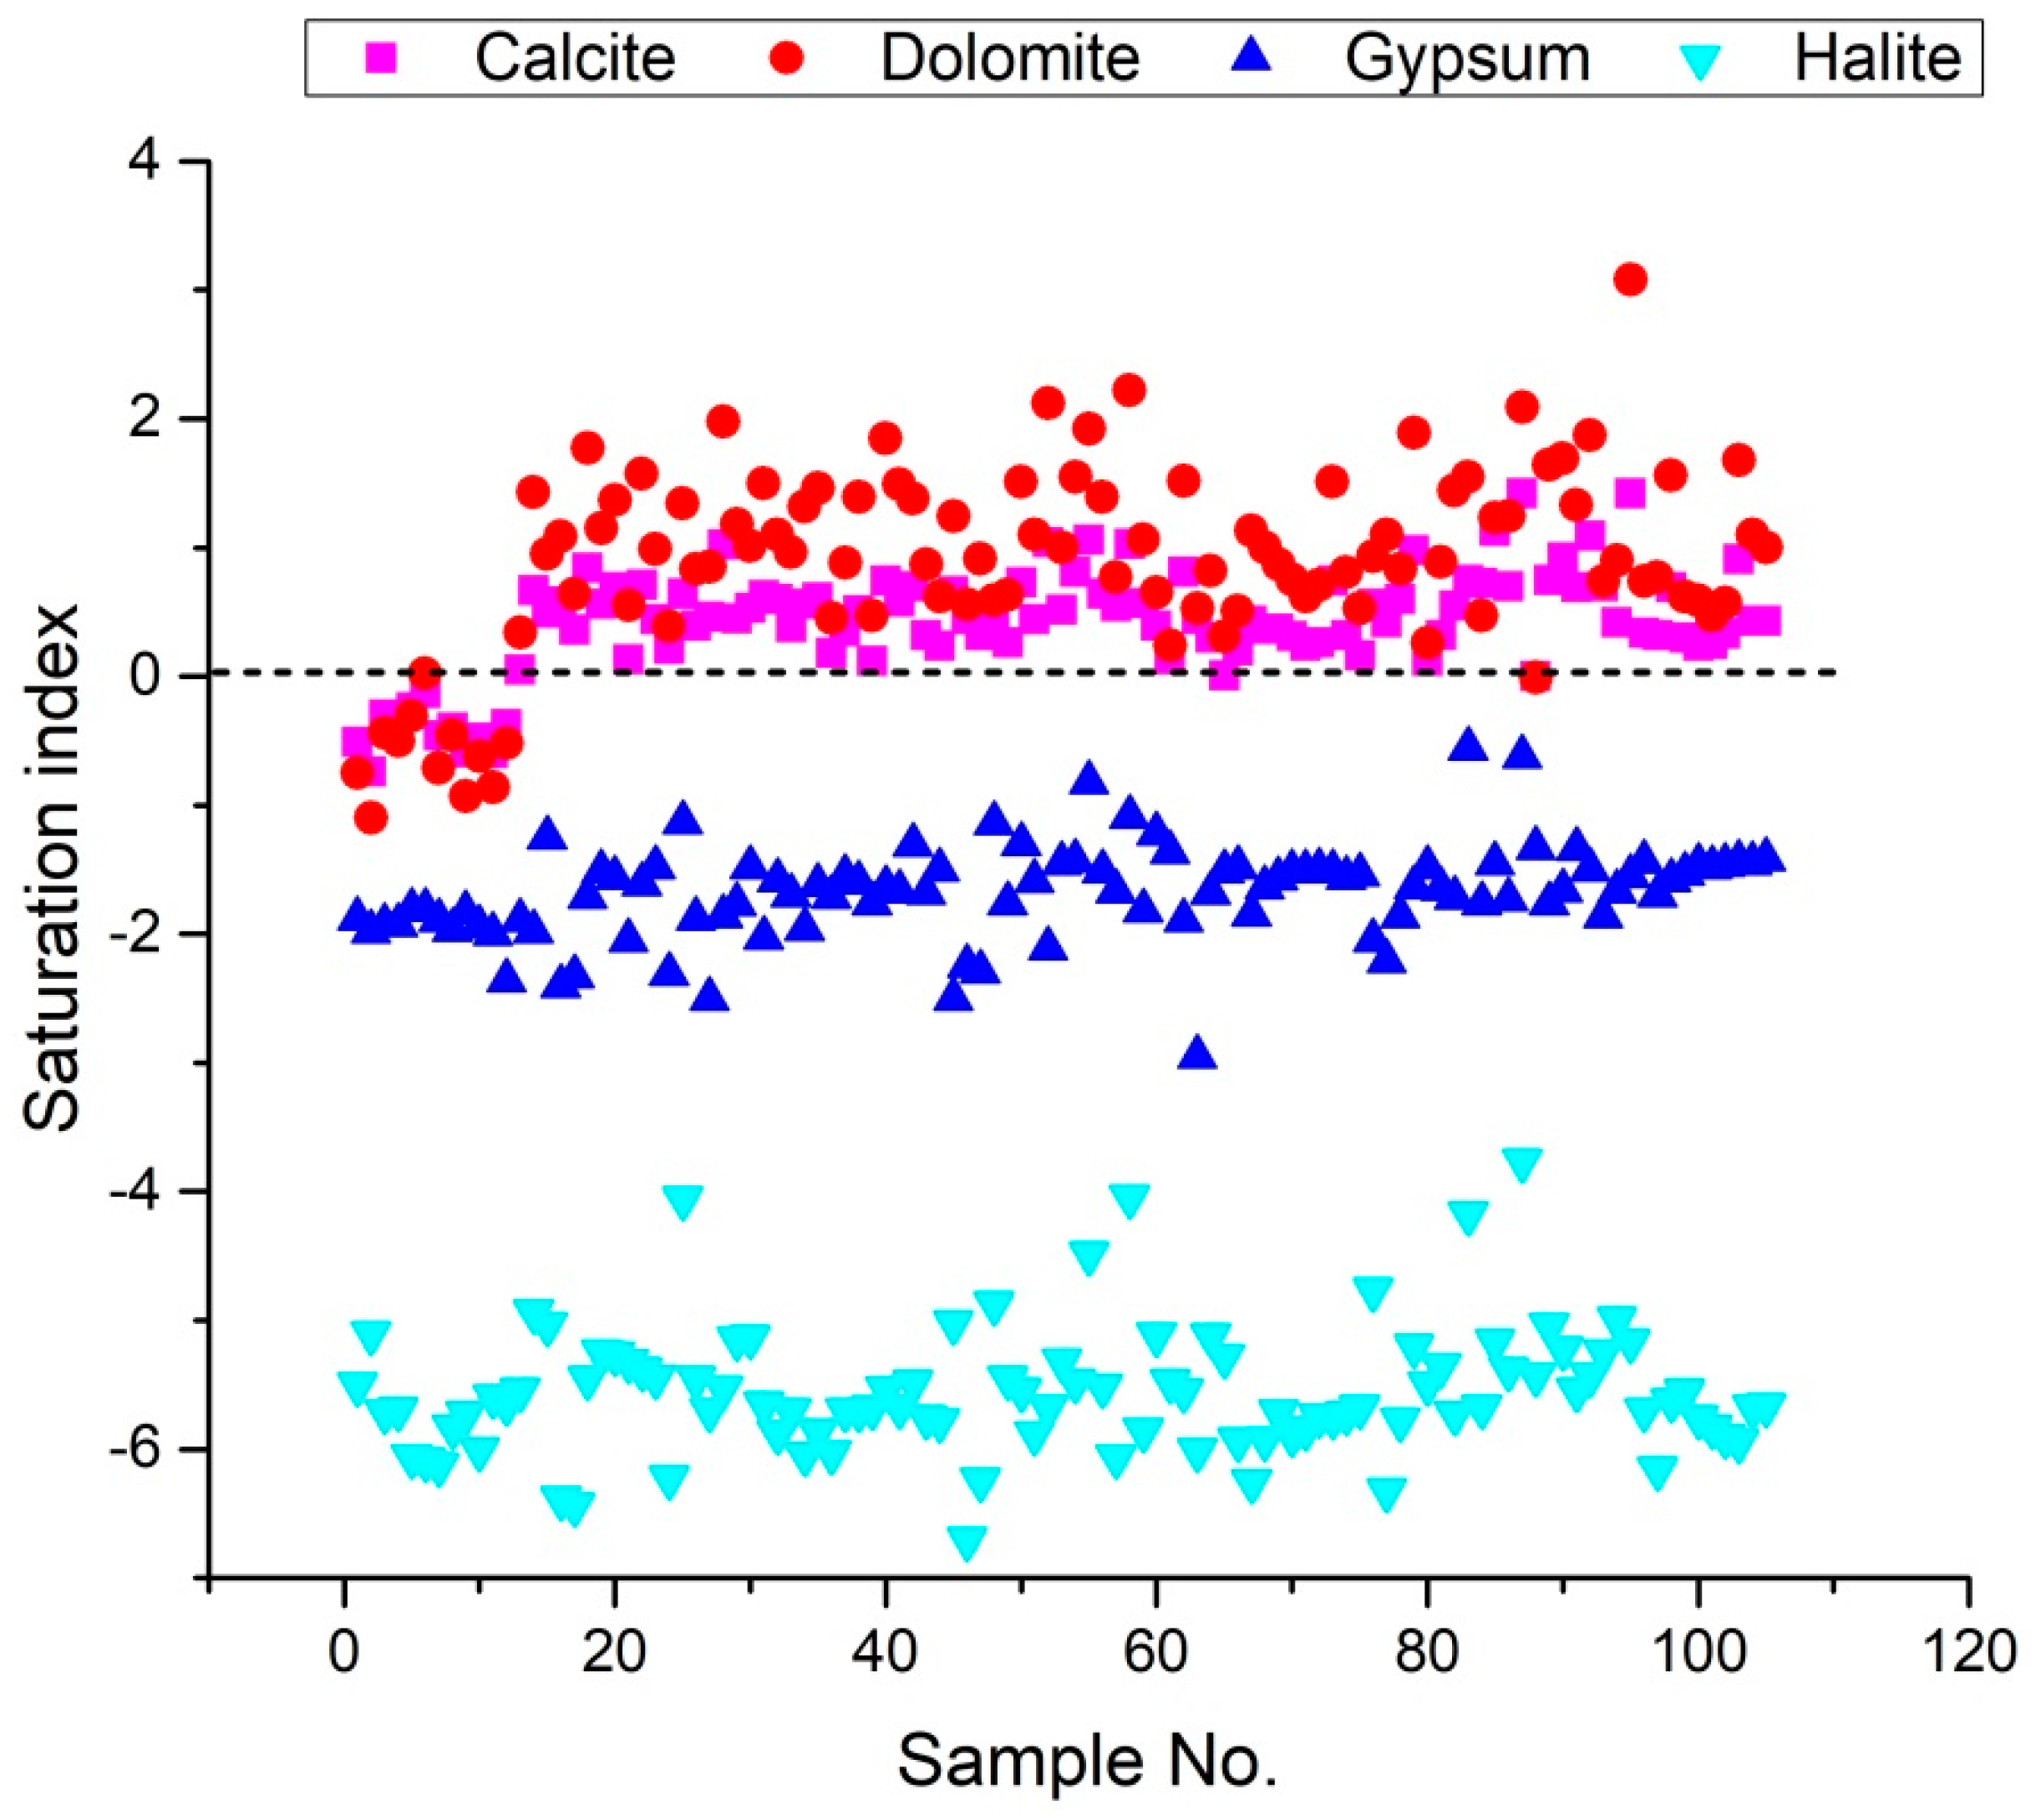
3.5. Saturation Index (SI)
3.6. Main Hydrochemical Processes
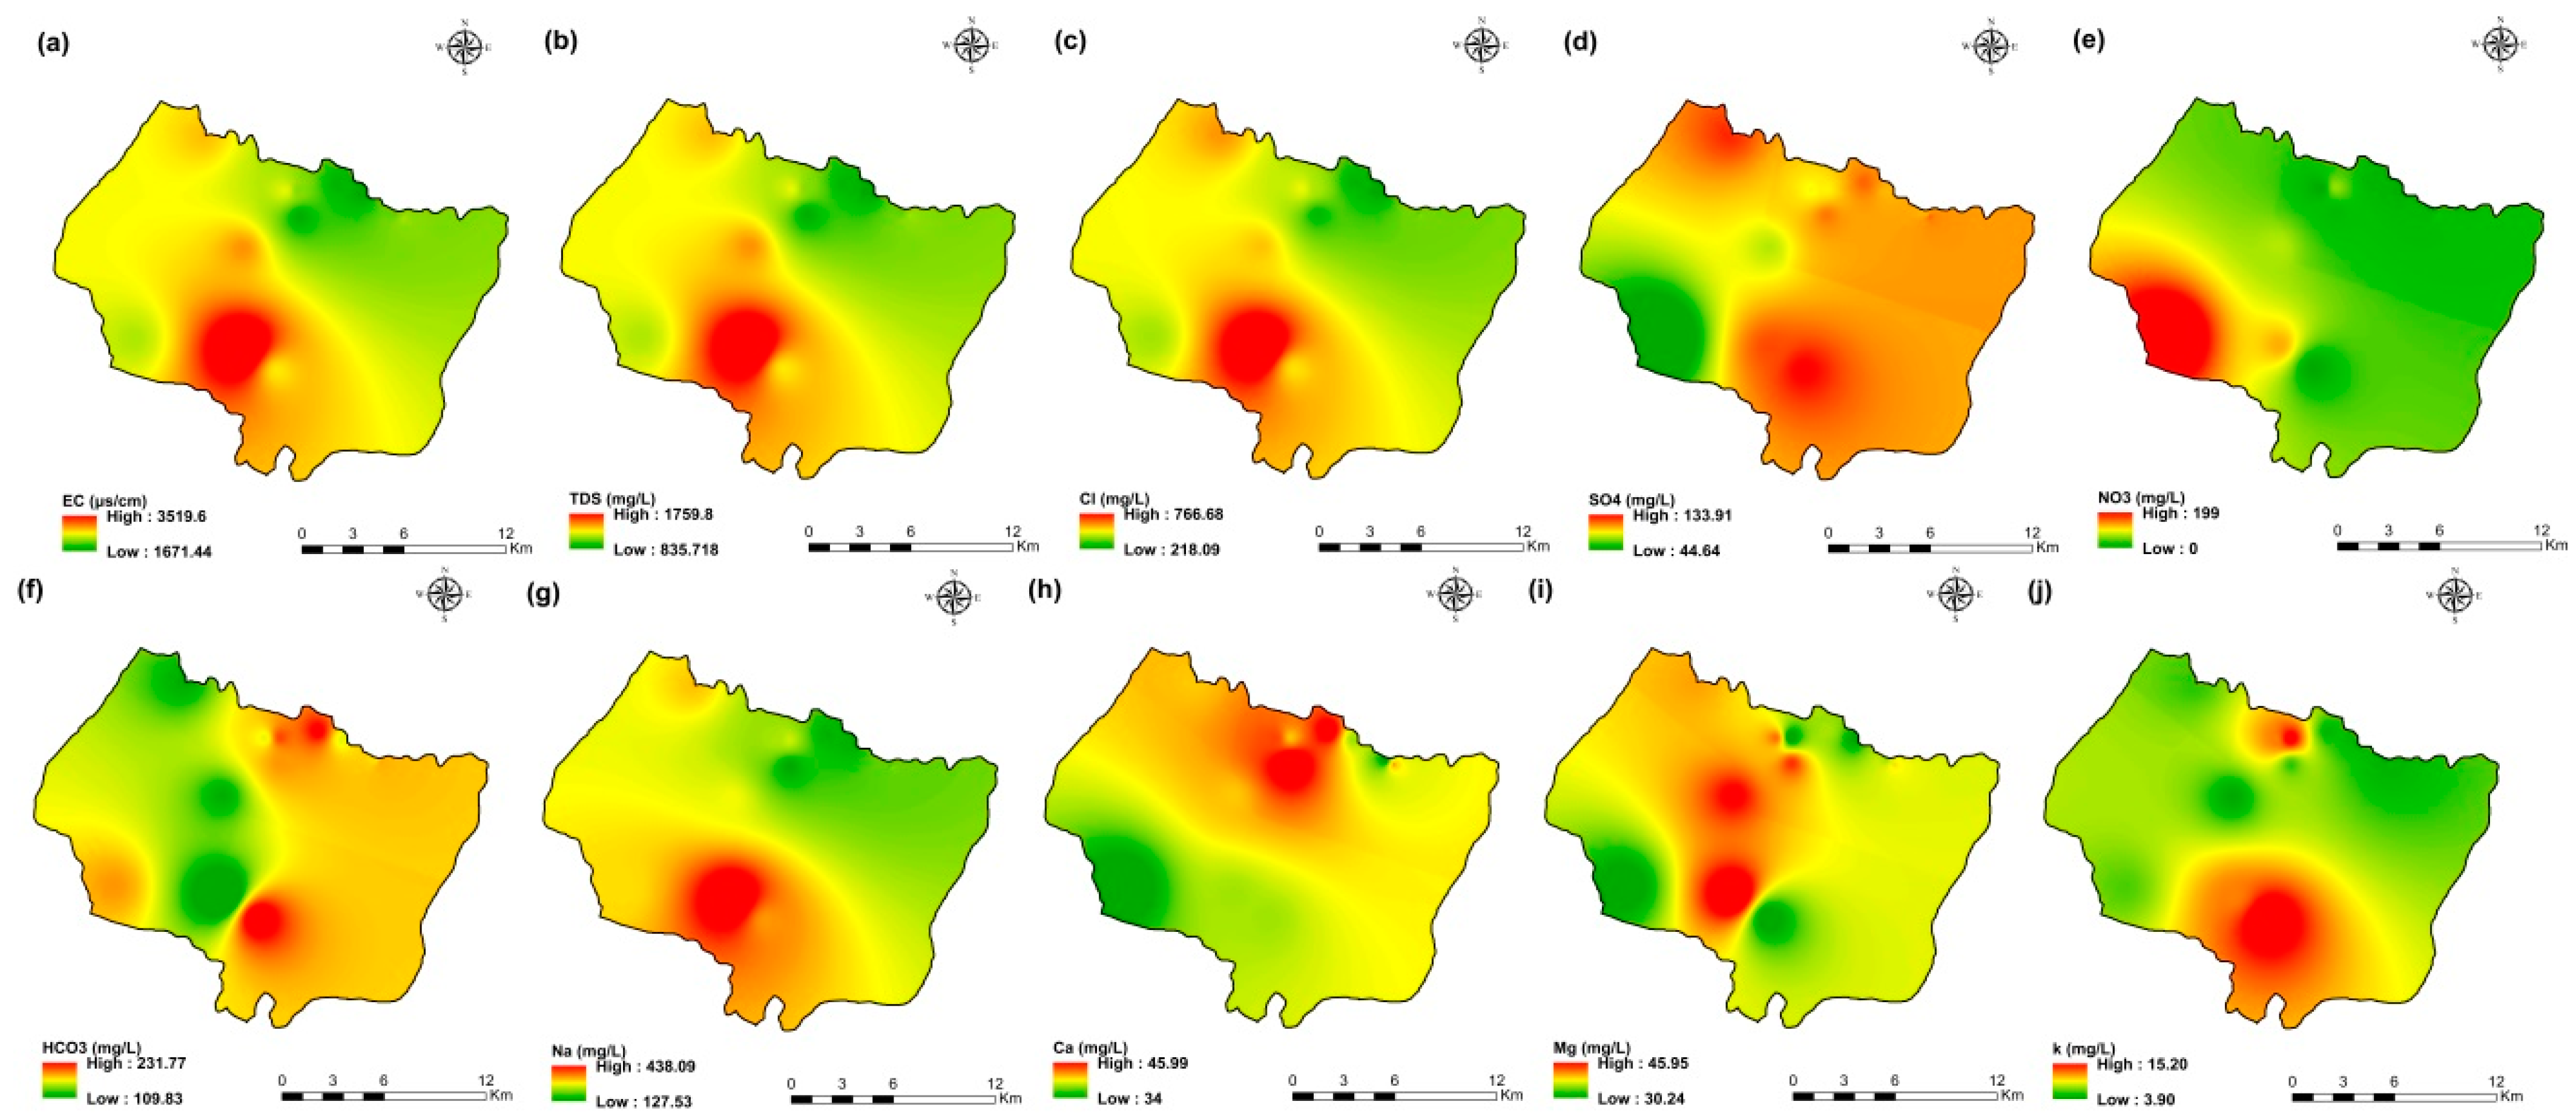
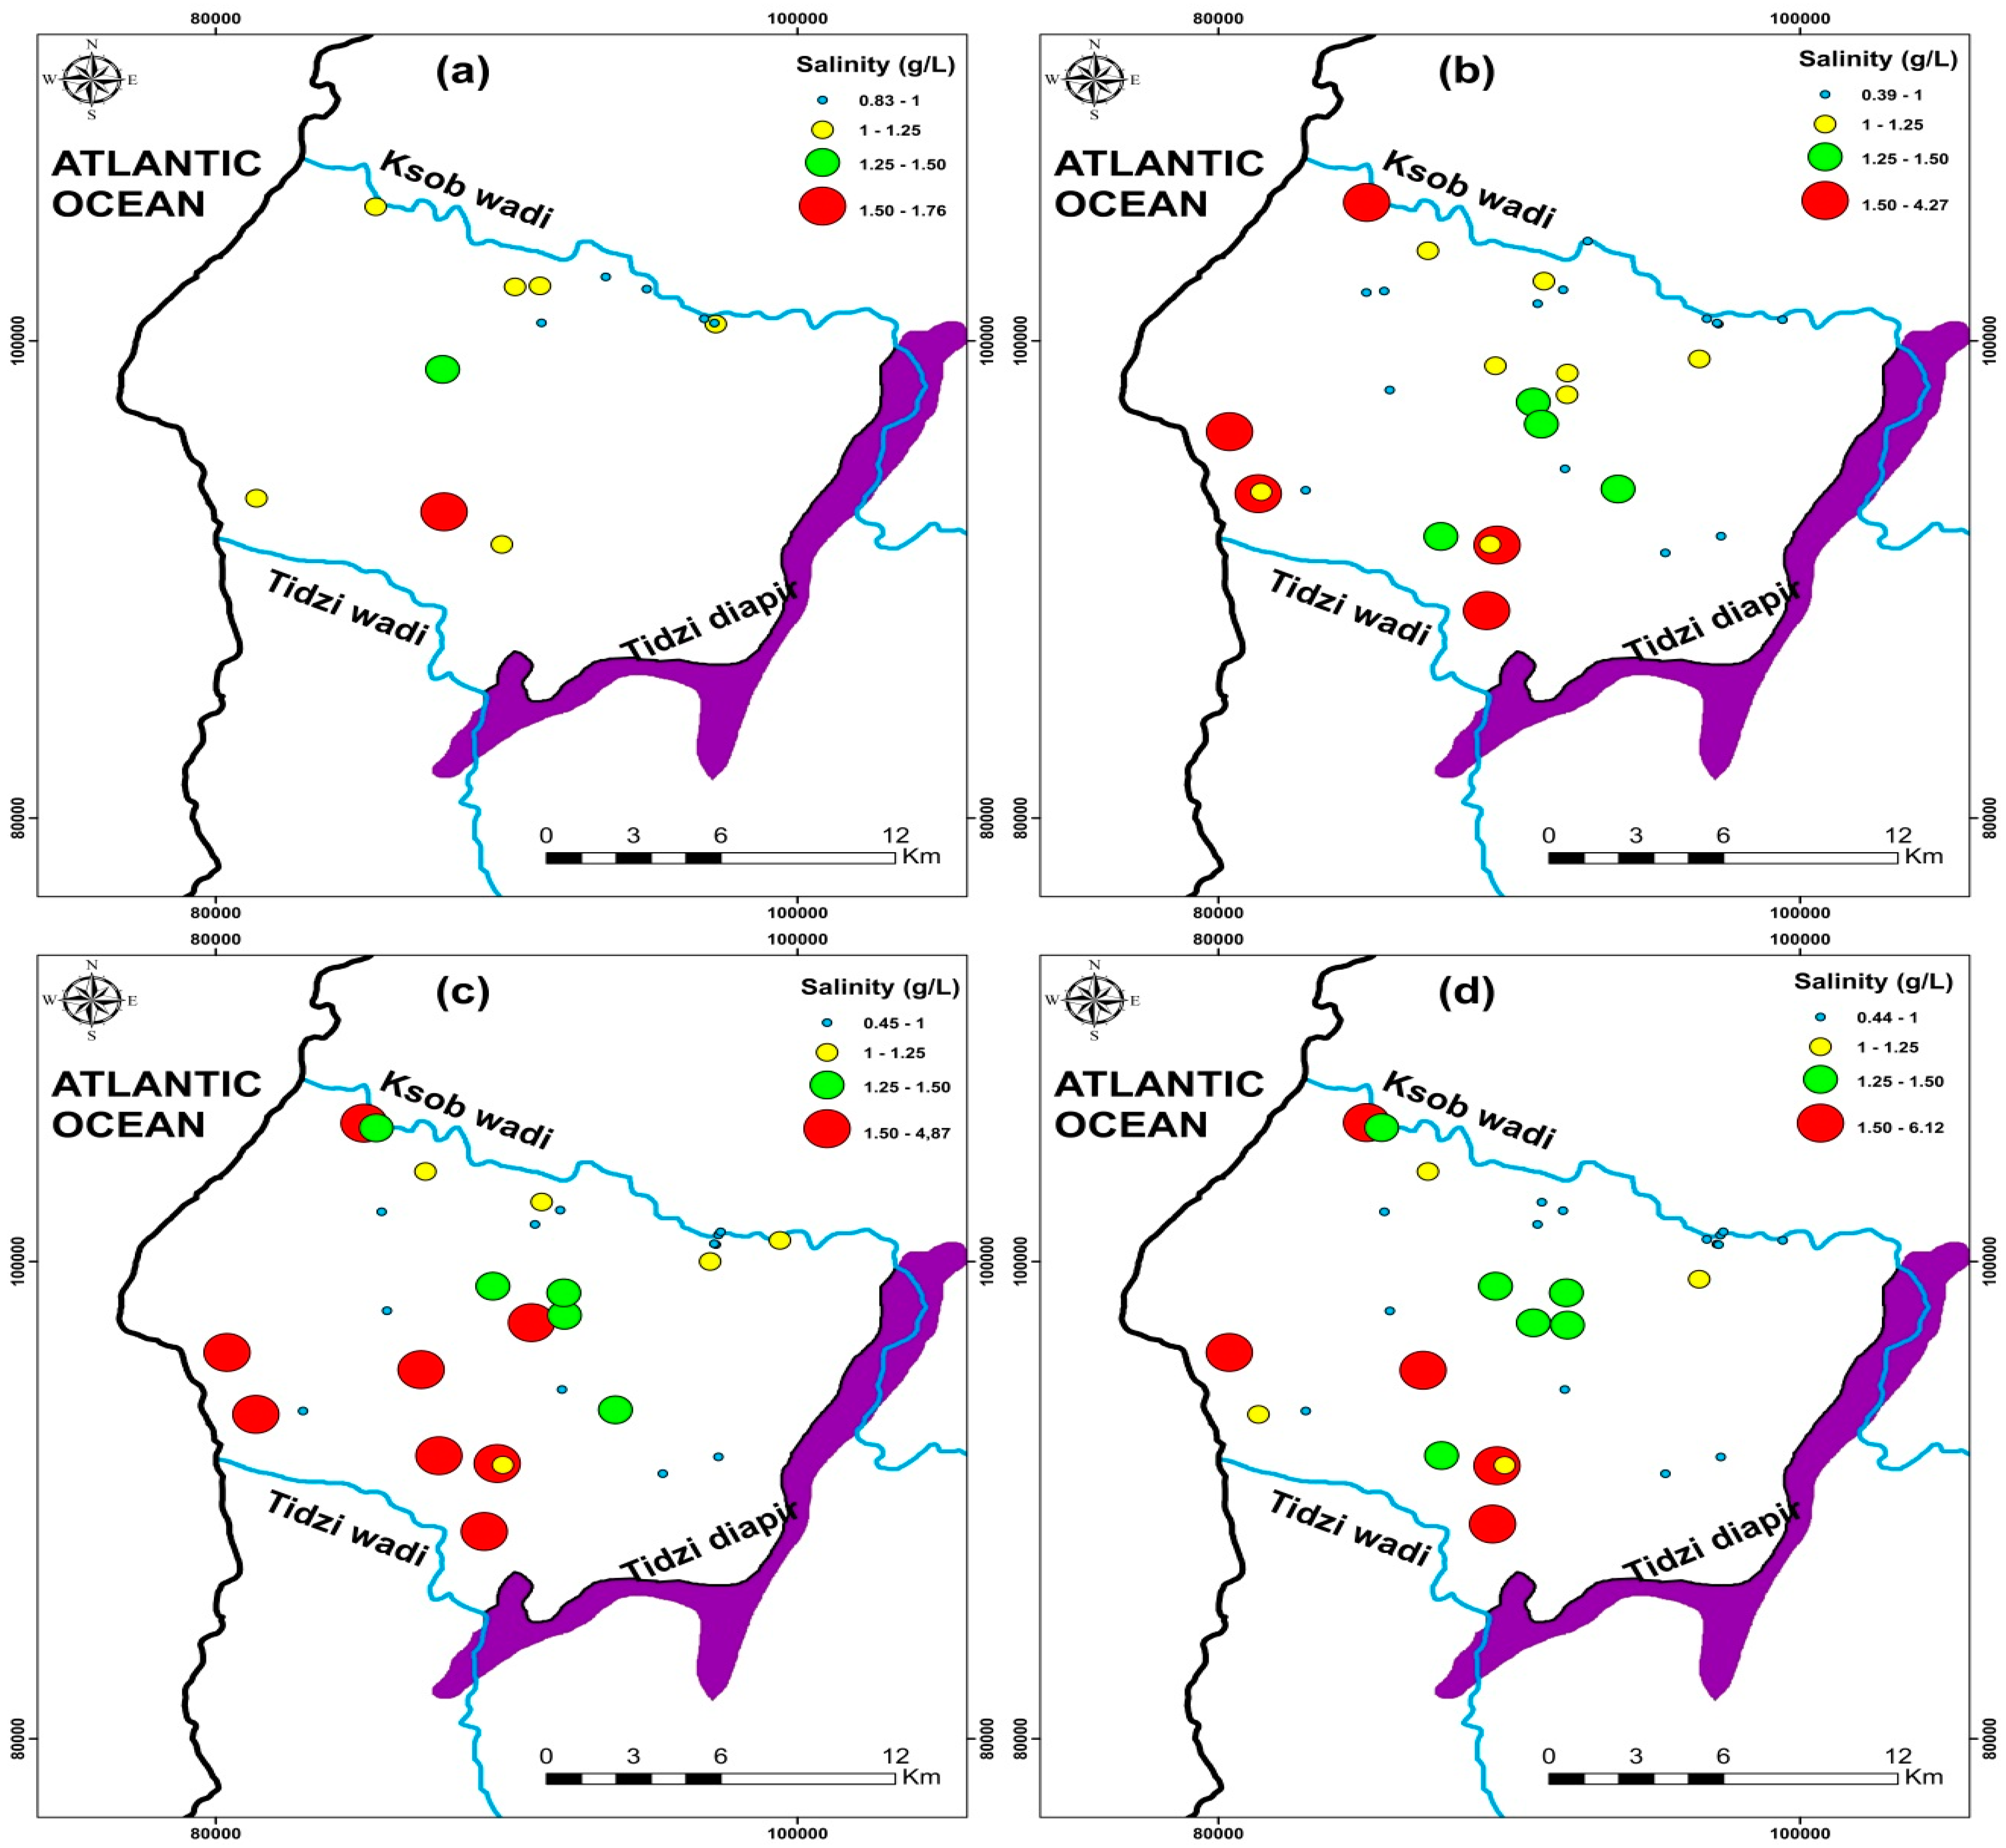
3.7. Groundwater Salinity
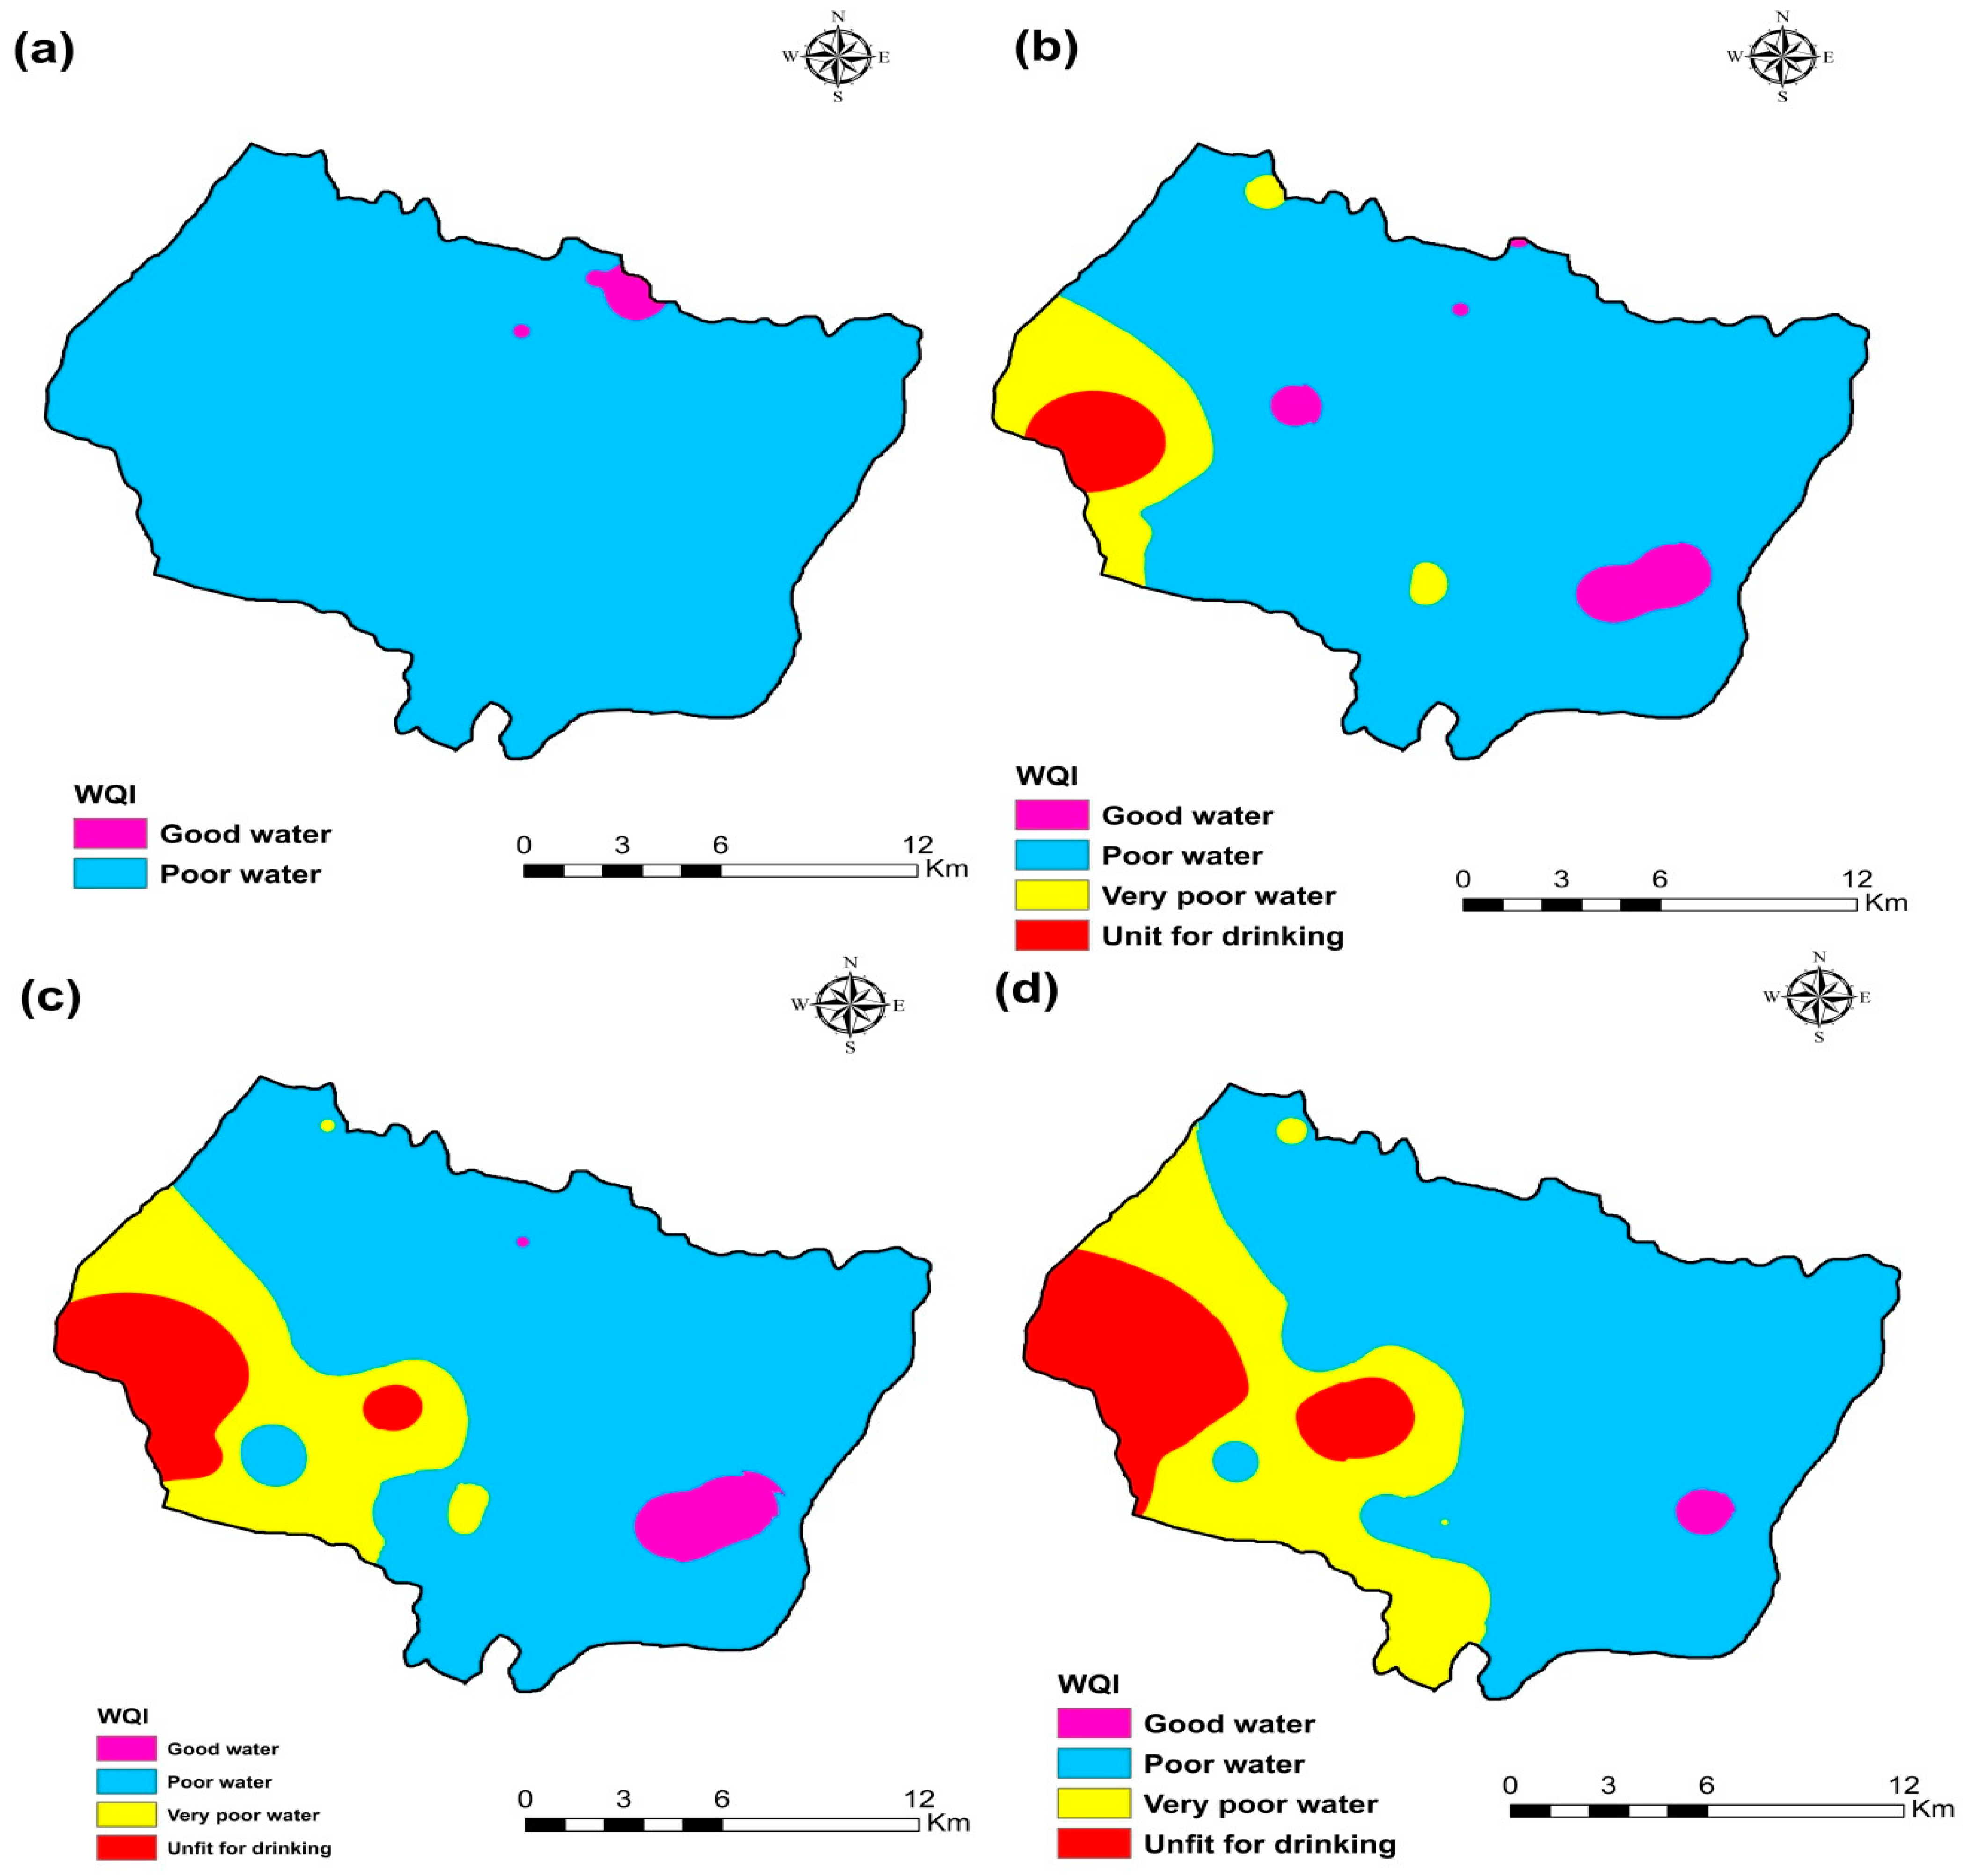
3.8. Water Quality Index (WQI) Calculated
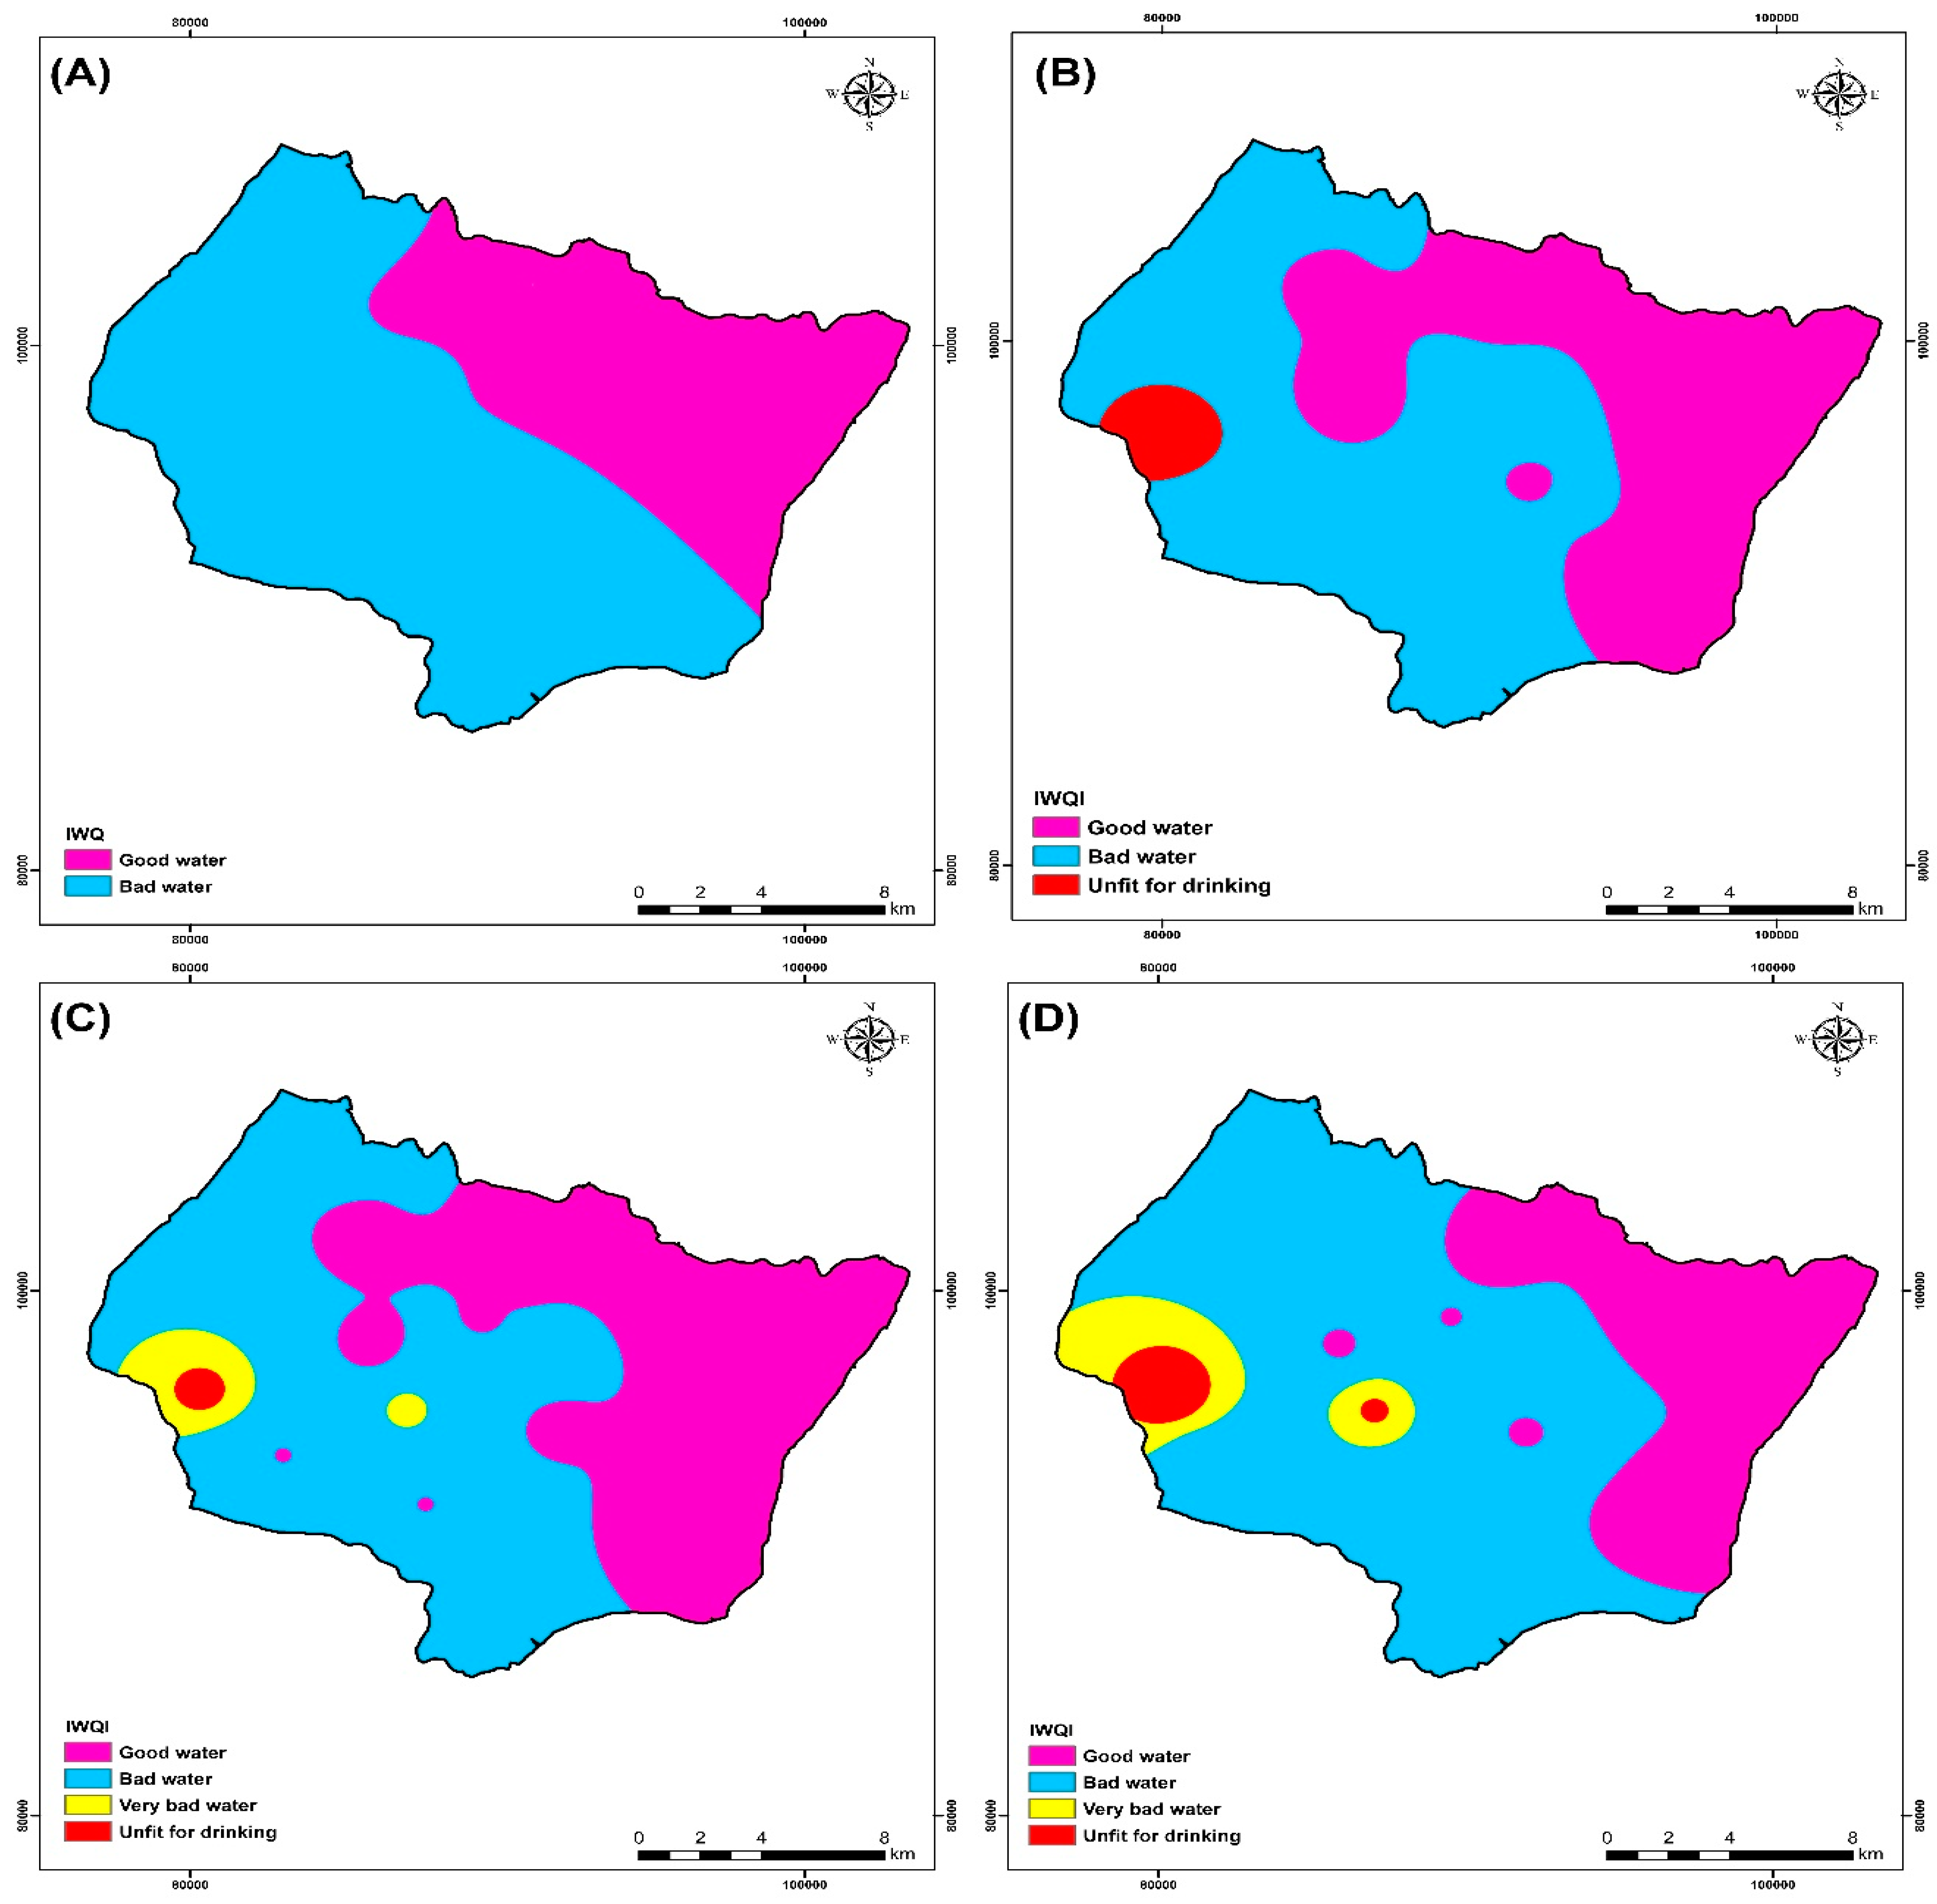
3.9. IWQI Calculation
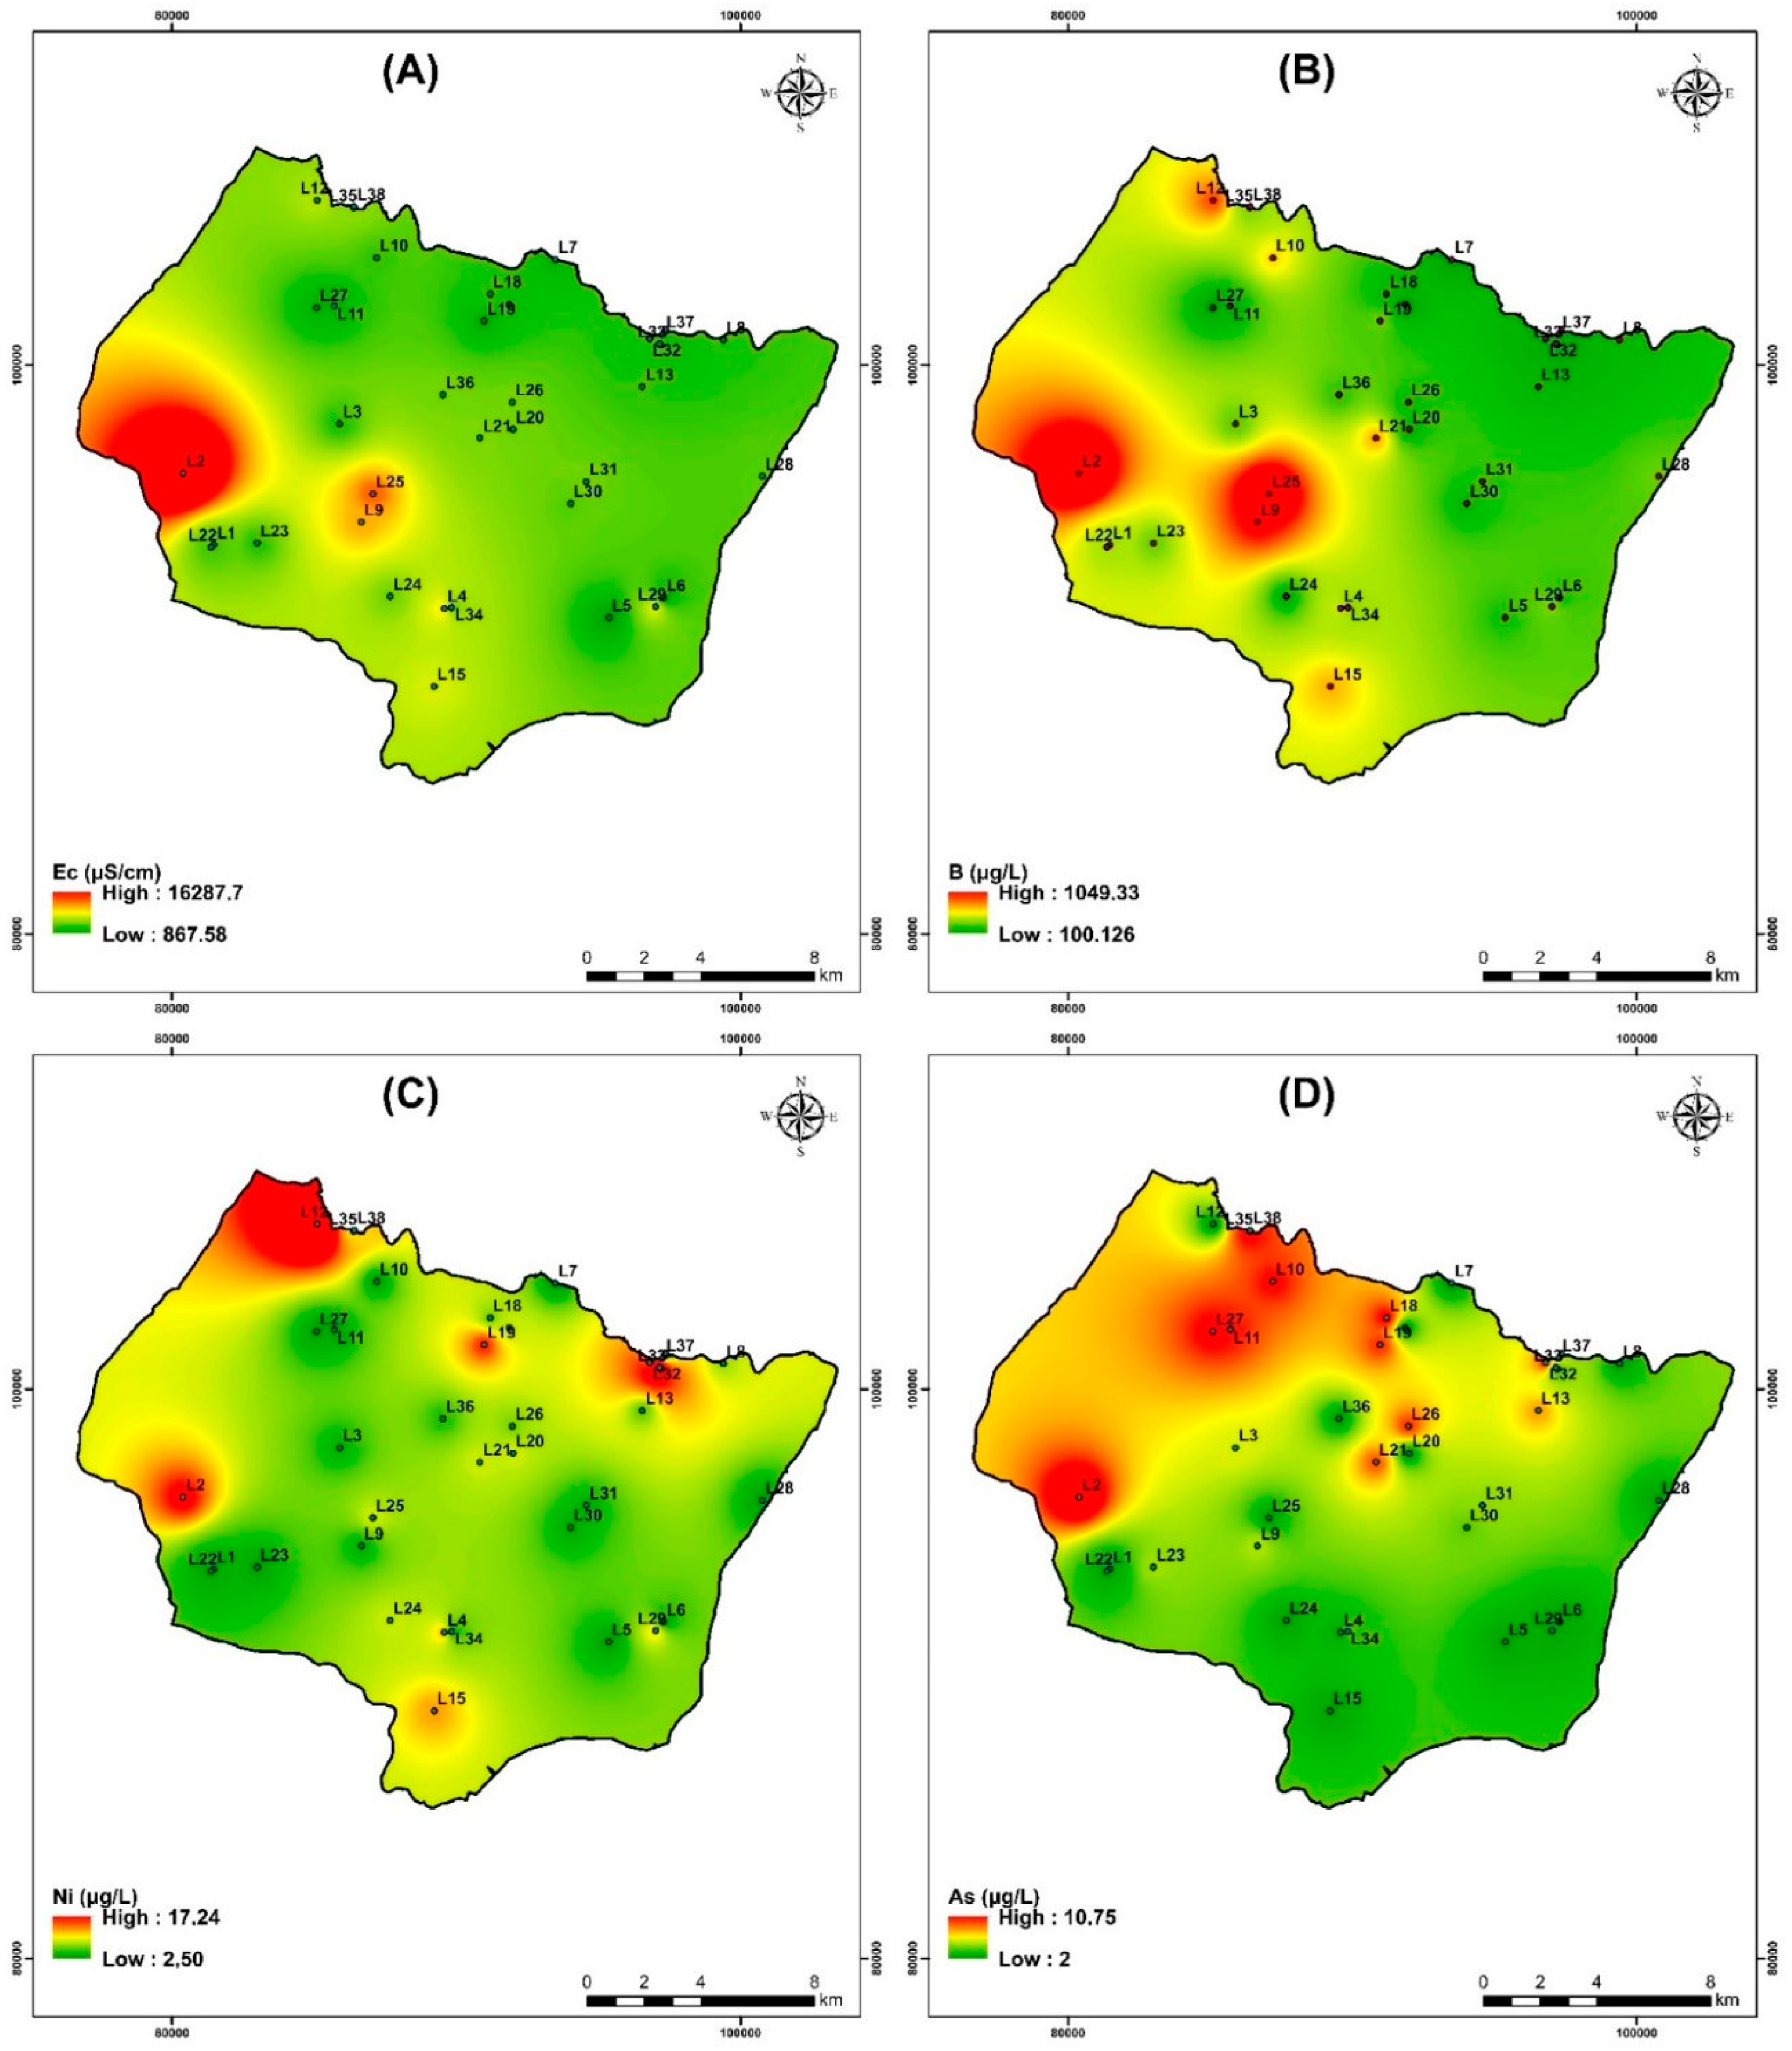
3.10. Heavy Metals
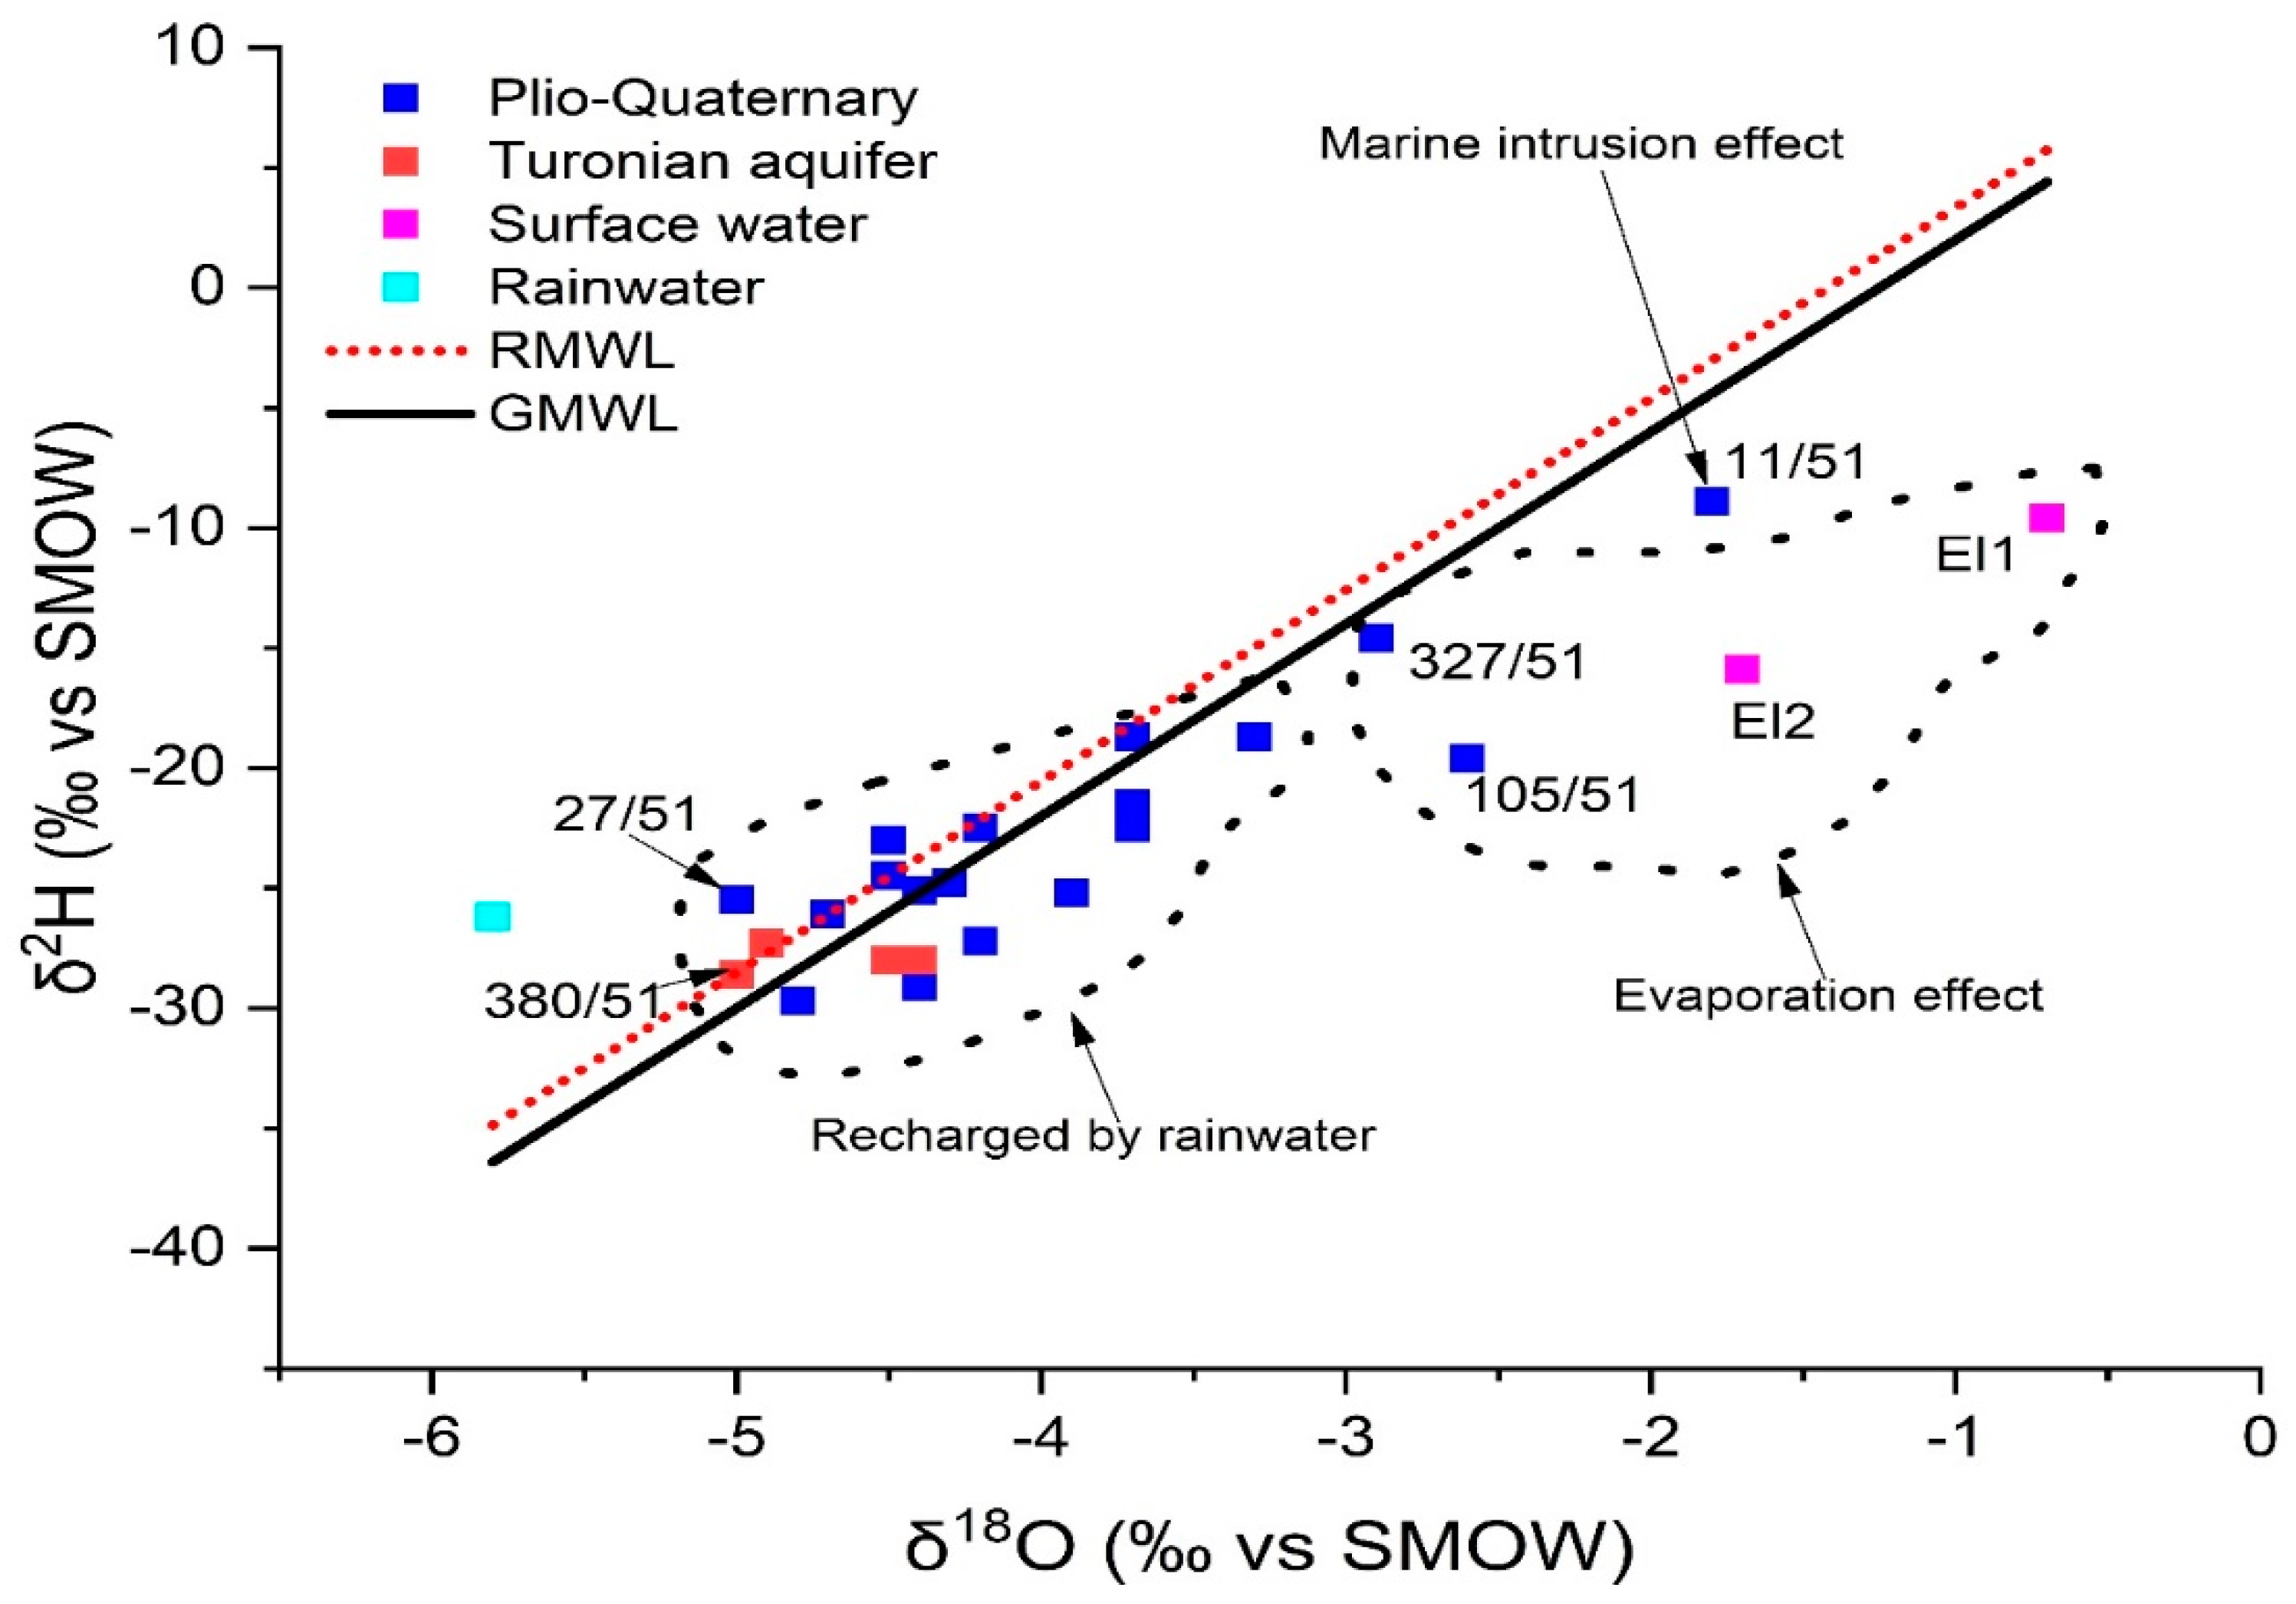
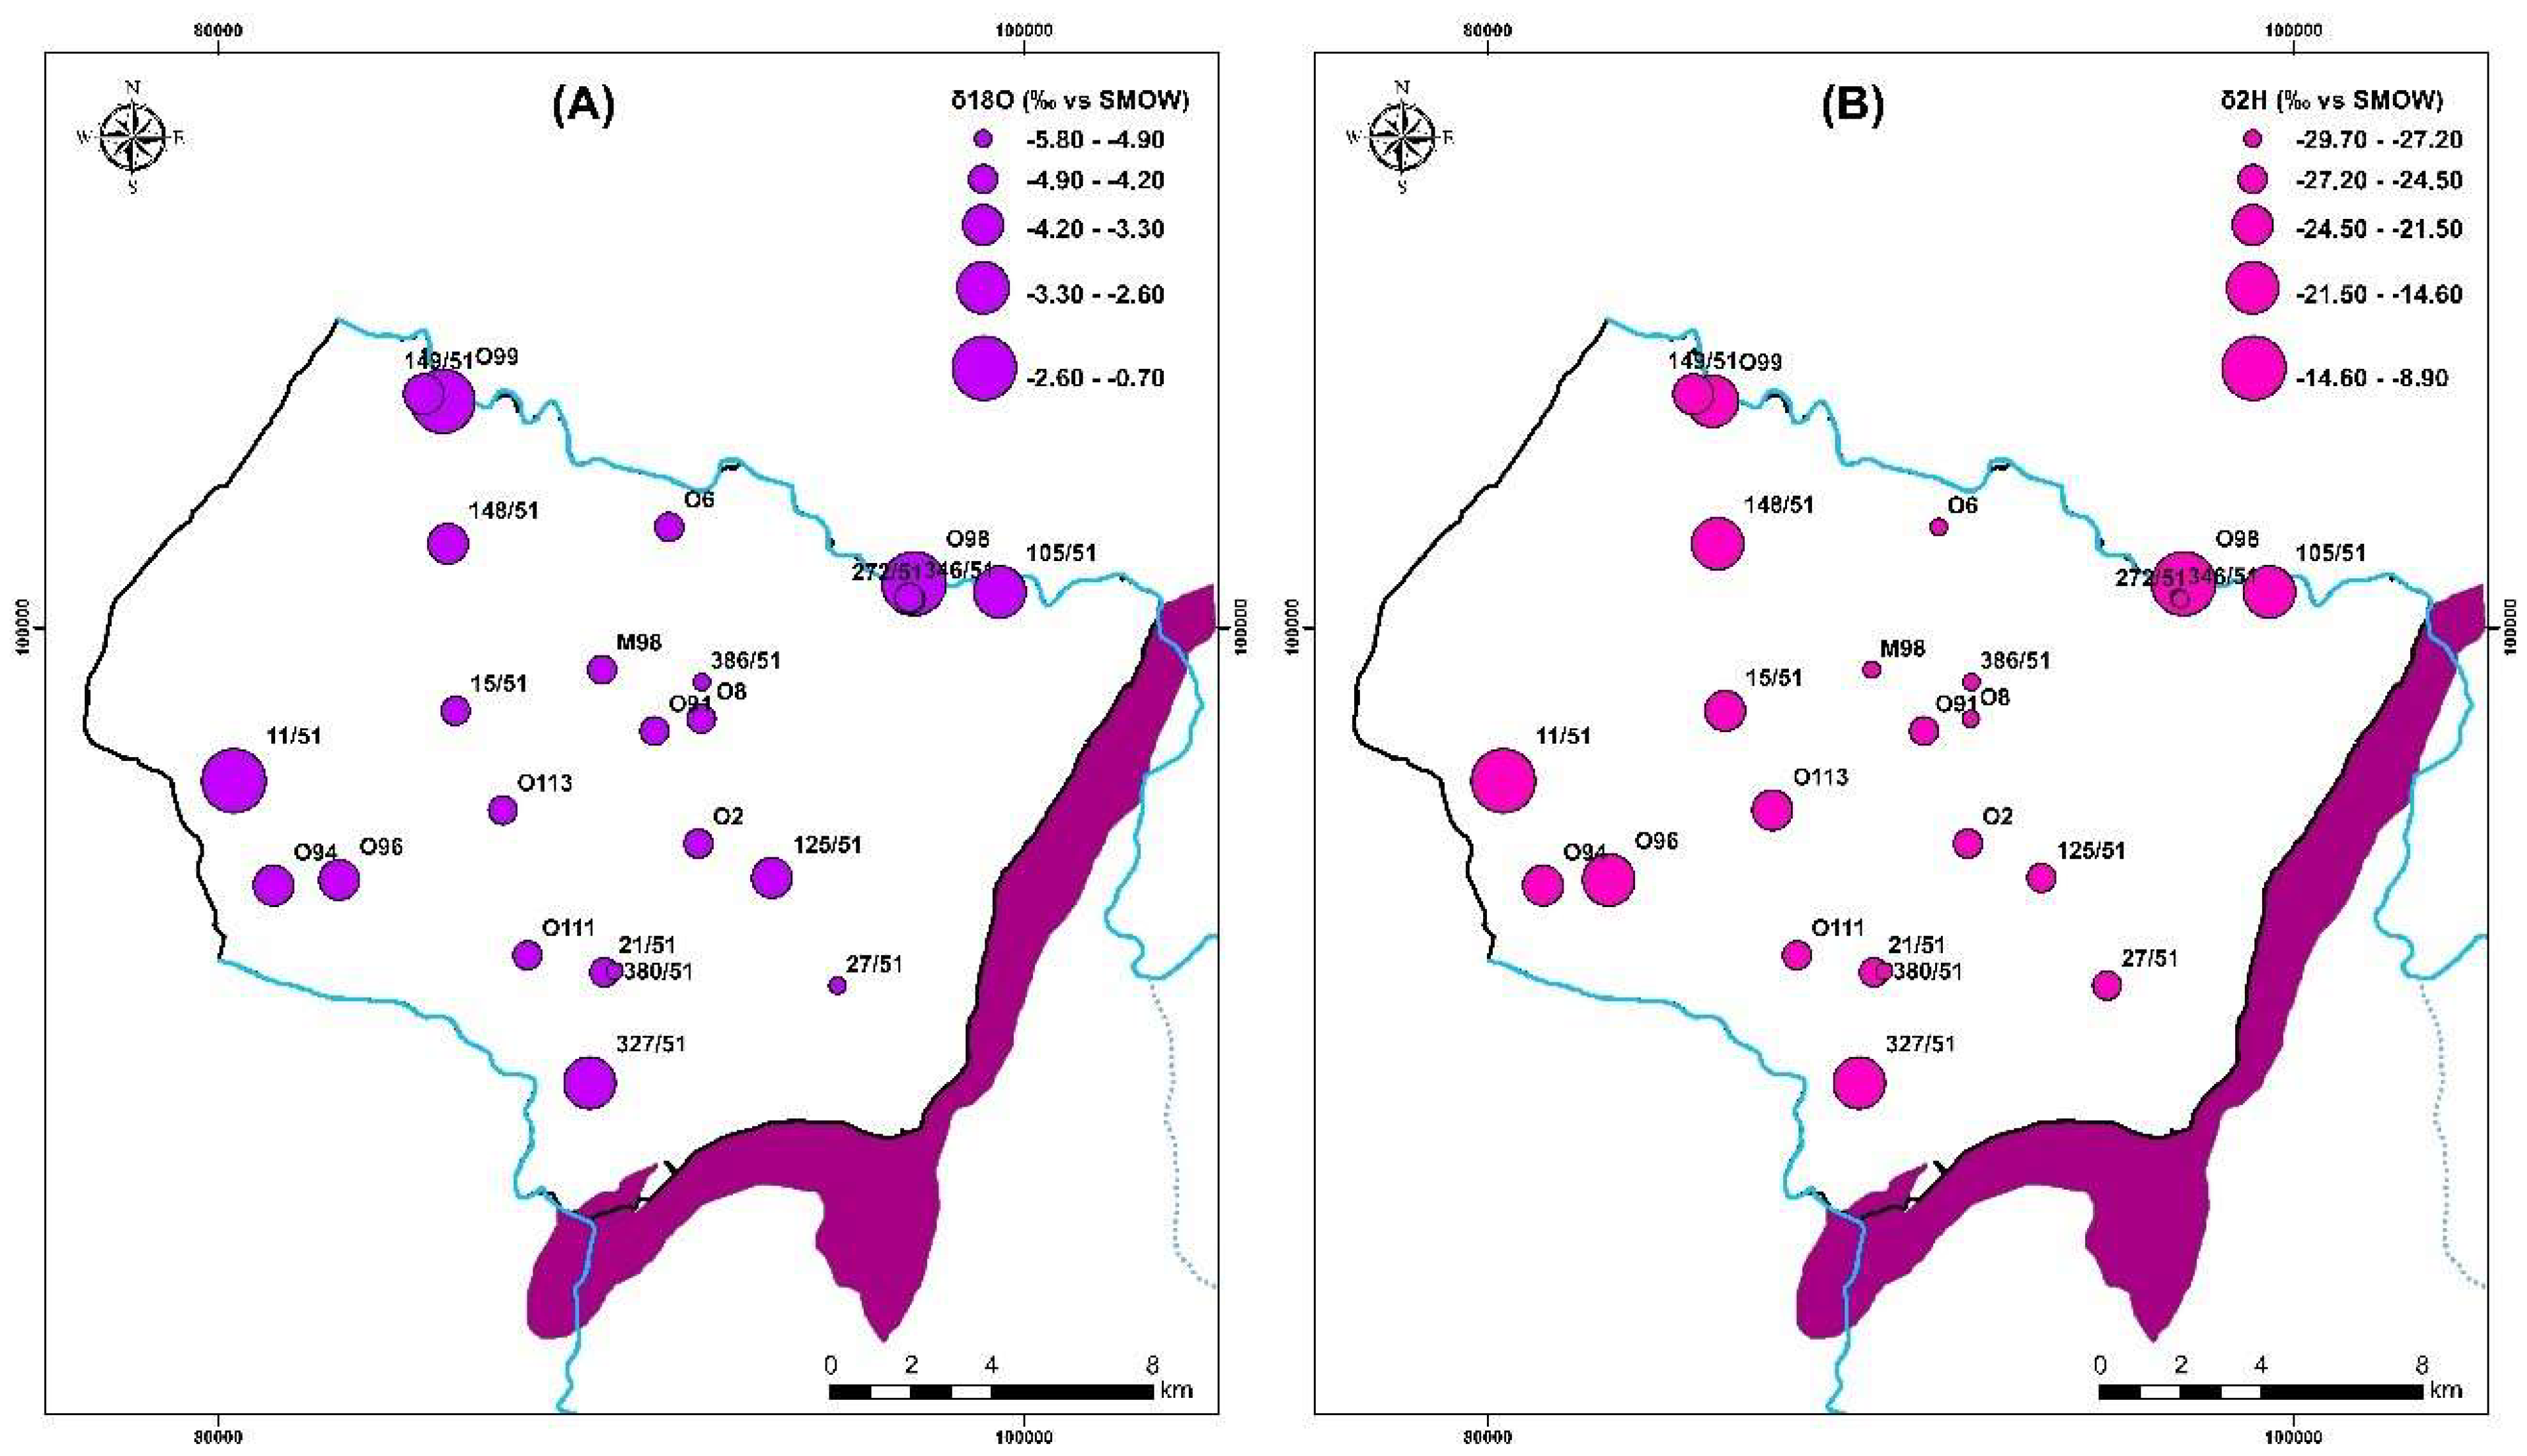
3.11. Water Stable Isotopes (δ2H-δ18O)
4. Conclusions
Supplementary Materials
Author Contributions
Funding
Acknowledgments
Conflicts of Interest
References
- Bahir, M.; Ouazar, D.; Ouhamdouch, S. Characterization of mechanisms and processes controlling groundwater salinization in coastal semi-arid area using hydrochemical and isotopic investigations (Essaouira basin, Morocco). Environ. Sci. Pollut. Res. 2018, 25, 24992–25004. [Google Scholar] [CrossRef] [PubMed]
- Fernandes, P.G.; Carreira, P.M.; Bahir, M. Mass balance simulation and principal components analysis applied to groundwater resources: Essaouira basin (Morocco). Environ. Earth Sci. 2010, 59, 1475–1484. [Google Scholar] [CrossRef]
- Hasan, M.; Shang, Y.; Metwaly, M.; Jin, W.; Khan, M.; Gao, Q. Assessment of Groundwater Resources in Coastal Areas of Pakistan for Sustainable Water Quality Management using Joint Geophysical and Geochemical Approach: A Case Study. Sustainability 2020, 12, 9730. [Google Scholar] [CrossRef]
- Bahir, M.; El Mountassir, O.; Chehbouni, A.; El Jiar, H.; Carreira, P.M. Hydrogeochemical and isotopic assessment for characterizing groundwater quality and recharge processes in the Essaouira Basin, Northwestern Morocco. Arab. J. Geosci. 2022, 15, 603. [Google Scholar] [CrossRef]
- Bouaroudj, S.; Menad, A.; Bounamous, A.; Ali-Khodja, H.; Gherib, A.; Weigel, D.E.; Chenchouni, H. Assessment of water quality at the largest dam in Algeria (Beni Haroun Dam) and effects of irrigation on soil characteristics of agricultural lands. Chemosphere 2019, 219, 76–88. [Google Scholar] [CrossRef] [PubMed]
- Carreira, P.M.; Bahir, M.; Ouhamdouch, S.; Galego Fernandes, P.; Nunes, D. Tracing salinization processes in coastal aquifers using an isotopic and geochemical approach: Comparative studies in western Morocco and southwest Portugal. Hydrogeol. J. 2018, 26, 2595–2615. [Google Scholar] [CrossRef]
- Jehan, S.; Ullah, I.; Khan, S.; Muhammad, S.; Khattak, S.A.; Khan, T. Evaluation of the Swat River, Northern Pakistan, water quality using multivariate statistical techniques and water quality index (WQI) model. Environ. Sci. Pollut. Res. 2020, 27, 38545–38558. [Google Scholar] [CrossRef]
- El Mountassir, O.; Bahir, M.; Ouazar, D.; Carreira, P.M. Nitrate Pollution in Groundwater of the Ouazi Basin: Case of Essaouira (Southwestern Morocco). In Advances in Geoethics and Groundwater Management: Theory and Practice for a Sustainable Development. Advances in Science, Technology & Innovation; Abrunhosa, M., Chambel, A., Peppoloni, S., Chaminé, H.I., Eds.; Springer: Berlin/Heidelberg, Germany, 2021; pp. 239–245. [Google Scholar] [CrossRef]
- El Mountassir, O.; Bahir, M.; Ouazar, D.; Carreira, P.M. For a Better Understanding of Recharge and Salinization Mechanism of a Cenomanian–Turonian Aquifer. In Advances in Geoethics and Groundwater Management: Theory and Practice for a Sustainable Development. Advances in Science, Technology & Innovation; Abrunhosa, M., Chambel, A., Peppoloni, S., Chaminé, H.I., Eds.; Springer: Berlin/Heidelberg, Germany, 2021; pp. 201–206. [Google Scholar] [CrossRef]
- El Mountassir, O.; Bahir, M.; Ouazar, D.; Chehbouni, A.; Carreira, P.M. Evaluation of nitrate source and its distribution in the groundwater of Essaouira basin. Sustain. Water Resour. Manag. 2022, 8, 28. [Google Scholar] [CrossRef]
- El Mountassir, O.; Bahir, M.; Ouazar, D.; Chehbouni, A.; Carreira, P.M. Temporal and spatial assessment of groundwater contamination with nitrate using nitrate pollution index (NPI), groundwater pollution index (GPI), and GIS (case study: Essaouira basin, Morocco). Environ. Sci. Pollut. Res. 2022, 29, 17132–17149. [Google Scholar] [CrossRef]
- Bahir, M.; EL Mountassir, O.; Ouazar, D.; Chehbouni, A.; Carreira, P.M. Stable isotope and quality of groundwater around Ksob sub-basin, Essaouira, Morocco. Sustain. Water Resour. Manag. 2021, 7, 73. [Google Scholar] [CrossRef]
- Moral, F.; Cruz-Sanjulián, J.; Olías, M. Geochemical evolution of groundwater in the carbonate aquifers of Sierra de Segura (Betic Cordillera, southern Spain). J. Hydrol. 2008, 360, 281–296. [Google Scholar] [CrossRef]
- André, L.; Franceschi, M.; Pouchan, P.; Atteia, O. Using geochemical data and modelling to enhance the understanding of groundwater flow in a regional deep aquifer, Aquitaine Basin, south-west of France. J. Hydrol. 2005, 305, 40–62. [Google Scholar] [CrossRef]
- Huang, X.; Wang, G.; Liang, X.; Cui, L.; Ma, L.; Xu, Q. Hydrochemical and stable isotope (δD and δ18O) characteristics of groundwater and hydrogeochemical processes in the Ningtiaota Coalfield, Northwest China. Mine Water Environ. 2018, 37, 119–136. [Google Scholar] [CrossRef]
- Afonso, M.J.; Chaminé, H.I.; Marques, J.M.; Carreira, P.M.; Guimaraes, L.; Guilhermino, L.; Gomes, A.; Fonseca, P.E.; Pires, A.; Rocha, F. Environmental issues in urban groundwater systems: A multidisciplinary study of the Paranhos and Salgueiros spring waters, Porto (NW Portugal). Environ. Earth Sci. 2010, 61, 379–392. [Google Scholar] [CrossRef]
- Bahir, M.; El Moukhayar, R.; Youbi, N.; Chamchati, H.; Chkir Ben Jemaa, N. Management and protection of groundwater resources in semi-arid zones: Application of hydrochemical methodologies to Essaouira Synclinal Basin, Morocco. Int. J. Hydrol. Sci. Technol. 2013, 3, 160–175. [Google Scholar] [CrossRef]
- Bahir, M.; Ouhamdouch, S.; Carreira, P.M.; Chkir, N.; Zouari, K. Geochemical and isotopic investigation of the aquifer system under semi-arid climate: Case of Essaouira basin (Southwestern Morocco). Carbonates Evaporites 2018, 33, 65–77. [Google Scholar] [CrossRef]
- El Mountassir, O.; Ouazar, D.; Bahir, M.; Chehbouni, A.; Carreira, P.M. GIS-based assessment of aquifer vulnerability using DRASTIC model and stable isotope: A case study on Essaouira basin. Arab. J. Geosci. 2021, 14, 321. [Google Scholar] [CrossRef]
- Bahir, M.; Ouhamdouch, S.; Ouazar, D.; Chehbouni, A.; Ouarani, M.; El Mountassir, O. Groundwater quality of the alluvial and carbonate aquifers of Essaouira basin (Morocco). Carbonates Evaporites 2021, 36, 23. [Google Scholar] [CrossRef]
- Mendonqa, J.L.; da Silva, M.O.; Bahir, M. Considerations concerning the origin of the Estoril (Portugal) thermal water. Estud. Geológicos 2004, 60, 153–159. [Google Scholar]
- Asadi, E.; Isazadeh, M.; Samadianfard, S.; Ramli, M.F.; Mosavi, A.; Nabipour, N.; Shamshirband, S.; Hajnal, E.; Chau, K.W. Groundwater quality assessment for sustainable drinking and irrigation. Sustainability 2019, 12, 177. [Google Scholar] [CrossRef]
- Bahir, M.; Ouhamdouch, S. Groundwater quality in semi-arid environments (Essaouira Basin, Morocco). Carbonates Evaporites 2020, 35, 41. [Google Scholar] [CrossRef]
- Bahir, M.; Ouhamdouch, S.; Ouazar, D. An assessment of the changes in the behavior of the groundwater resources in arid environment with global warming in Morocco. Groundw Sustain. 2021, 12, 100541. [Google Scholar] [CrossRef]
- Aouiti, S.; Hamzaoui Azaza, F.; El Melki, F.; Hamdi, M.; Celico, F.; Zammouri, M. Groundwater quality assessment for different uses using various water quality indices in semi-arid region of central Tunisia. Environ. Sci. Pollut. Res. 2021, 28, 46669. [Google Scholar] [CrossRef] [PubMed]
- EL Mountassir, O.; Bahir, M.; Ouazar, D.; Chehbouni, A.; Carreira, P.M. Geochemical and isotopic evidence of groundwater salinization processes in the Essaouira region, north-west coast, Morocco. SN Appl. Sci. 2021, 3, 698. [Google Scholar] [CrossRef]
- Rabeiy, R.E. Assessment and modeling of groundwater quality using WQI and GIS in Upper Egypt area. Environ. Sci. Pollut. Res. 2018, 25, 30808–30817. [Google Scholar] [CrossRef] [PubMed]
- Tiwari, A.K.; Singh, P.K.; Mahato, M.K. GIS-based evaluation of water quality index of ground water resources in West Bokaro Coalfield, India. Curr. World Environ. 2014, 9, 843. [Google Scholar] [CrossRef]
- Ibrahim, M.N. Assessing groundwater quality for drinking purpose in Jordan: Application of water quality index. J. Ecol. Eng. 2019, 20, 101–111. [Google Scholar] [CrossRef]
- Teshome, F.B. Seasonal water quality index and suitability of the water body to designated uses at the eastern catchment of Lake Hawassa. Environ. Sci. Pollut. Res. 2020, 27, 279–290. [Google Scholar] [CrossRef]
- Skoczko, I.; Piekutin, J.; Szatyłowicz, E.; Niedźwiecka, M. Removal of boron from groundwater by filtration through selected filter bed materials. Rocz. Ochr. Sr. 2016, 18, 279–290. [Google Scholar]
- Bahir, M.; El Moukhayar, R.; Chamchati, H.; Youbi, N.; Carreira, P.M.; Chkir, N. Recharge and hydrogeochemical evolution groundwater in semi-arid zone (Essaouira Basin, Morocco). Comun. Geol. 2014, 3, 651–653. [Google Scholar]
- Jalal, M.; Blavoux, B.; Bahir, M.; Bellion, Y.; Laftouhi, N.; Puig, J.; Mennani, A.; Daniel, M. Etude du fonctionnement du systeme aquifere karstique Cenomano-Turonien de l’oued Igrounzar, bassin d’Essaouira. Maroc. J. Afr. Earth Sci. 2001, 32, 803–817. [Google Scholar] [CrossRef]
- Mennani, A.; Blavoux, B.; Bahir, M.; Bellion, Y.; Jalal, M.; Daniel, M. Apports des analyses chimiques et isotopiques a la connaissance du fonctionnement des aquiferes plio-quaternaire et turonien de la zone synclinale d’Essaouira, Maroc occidental. J. Afr. Earth Sci. 2001, 32, 819–835. [Google Scholar] [CrossRef]
- Bahir, M.A. Mennani Problématique de la gestion des eaux souterraines au Maroc. Estud. Geológicos 2002, 58, 103–108. [Google Scholar]
- Laftouhi, N.E.; Vanclooster, M.; Jalal, M.; Witam, O.; Aboufirassi, M.; Bahir, M.; Persoons, É. Groundwater nitrate pollution in the Essaouira Basin (Morocco). Comptes Rendus Geosci. 2003, 335, 307–317. [Google Scholar] [CrossRef]
- Fernandes, P.G.; Bahir, M.; Mendonça, J.; Carreira, P.M.; Fakir, Y.; Silva, M. Anthropogenic features in the Sines (Portugal) and Essaouira (Morocco) coastal aquifers: A comparative study of their hydrochemical evolution by a Principal Component Analysis. Estud. Geol. 2005, 61, 207–219. [Google Scholar]
- Bahir, M.; Chkir, N.; Trabelsi, R.; Friha, H.A.; Zouari, K.; Chamchati, H. Hydro-geochemical behaviour of two coastal aquifers under severe climatic and human constraints: Comparative study between Essaouira basin in Morocco and Jeffara basin in Tunisia. Int. J. Hydrol. Sci. Technol. 2012, 2, 75–100. [Google Scholar] [CrossRef]
- Bahir, M.; El Mountassir, O.; Ouazar, D.; Carreira, P.M. Hydrochemical Analysis and Evaluation of Groundwater Quality in Ouazi Basin (Essaouira, Morocco). In Advances in Geoethics and Groundwater Management: Theory and Practice for a Sustainable Development. Advances in Science, Technology & Innovation; Abrunhosa, M., Chambel, A., Peppoloni, S., Chaminé, H.I., Eds.; Springer: Berlin/Heidelberg, Germany, 2021; pp. 247–250. [Google Scholar] [CrossRef]
- Horton, R.K. An index number system for rating water quality. J. Water Pollut. Control Fed. 1965, 37, 300–306. [Google Scholar]
- Brown, R.M.; McClelland, N.I.; Deininger, R.A.; O’Connor, M.F. A water quality index—Crashing the psychological barrier. In Indicators of Environmental Quality; Springer: Berlin/Heidelberg, Germany, 1972; pp. 173–182. [Google Scholar]
- Bahir, M.; El Mountassir, O.; Ouazar, D.; Carreira, P.M. Use of WQI and Isotopes to Assess Groundwater Quality of Coastal Aquifers (Essaouira, Morocco). In Advances in Geoethics and Groundwater Management: Theory and Practice for a Sustainable Development. Advances in Science, Technology & Innovation; Abrunhosa, M., Chambel, A., Peppoloni, S., Chaminé, H.I., Eds.; Springer: Berlin/Heidelberg, Germany, 2021; pp. 251–255. [Google Scholar] [CrossRef]
- El Mountassir, O.; Bahir, M.; Ouazar, D.; Ouhamdouch, S.; Chehbouni, A.; Ouarani, M. The use of GIS and water quality index to assess groundwater quality of krimat aquifer (Essaouira; Morocco). SN Appl. Sci. 2020, 2, 871. [Google Scholar] [CrossRef]
- Adimalla, N. Controlling factors and mechanism of groundwater quality variation in semiarid region of South India: An approach of water quality index (WQI) and health risk assessment (HRA). Environ. Geochem. Health 2020, 42, 1725–1752. [Google Scholar] [CrossRef]
- Soleimani, H.; Nasri, O.; Ojaghi, B.; Pasalari, H.; Hosseini, M.; Hashemzadeh, B.; Kavosi, A.; Masoumi, S.; Radfard, M.; Adibzadeh, A. Data on drinking water quality using water quality index (WQI) and assessment of groundwater quality for irrigation purposes in Qorveh&Dehgolan, Kurdistan, Iran. Data Br. 2018, 20, 375–386. [Google Scholar] [CrossRef]
- Bouteraa, O.; Mebarki, A.; Bouaicha, F.; Nouaceur, Z.; Laignel, B. Groundwater quality assessment using multivariate analysis, geostatistical modeling, and water quality index (WQI): A case of study in the Boumerzoug-El Khroub valley of Northeast Algeria. Acta Geochim. 2019, 38, 796–814. [Google Scholar] [CrossRef]
- El Baba, M.; Kayastha, P.; Huysmans, M.; De Smedt, F. Evaluation of the groundwater quality using the water quality index and geostatistical analysis in the Dier al-Balah Governorate, Gaza Strip, Palestine. Water 2020, 12, 262. [Google Scholar] [CrossRef]
- Wu, J.; Zhang, Y.; Zhou, H. Groundwater chemistry and groundwater quality index incorporating health risk weighting in Dingbian County, Ordos basin of northwest China. Geochem 2020, 80, 125607. [Google Scholar] [CrossRef]
- Bahir, M.; El Moukhayar, R.; Chkir, N.; Chamchati, H.; Fernandes, P.G.; Carreira, P.M. Groundwater Chemical Evolution in the Essaouira Aquifer Basin—NW Morocco. Open J. Mod. Hydrol. 2013, 3, 8. [Google Scholar] [CrossRef][Green Version]
- Bahir, M.; Carreira, P.; Silva, M.O.; Fernandes, P. Caractérisation hydrodynamique, hydrochimique et isotopique du système aquifère de Kourimat (Bassin d’Essaouira, Maroc). Estud. Geol. 2008, 64, 61–73. [Google Scholar] [CrossRef]
- Rassou, K.K.; Fakir, Y.; Bahir, M.; Zouari, K.; Marah, M. Origine et datation des eaux souterraines du bassin hydrologique de la lagune d’Oualidia. Estud. Geol. 2005, 61, 191–196. [Google Scholar] [CrossRef]
- Bahir, M.; Jalal, M.; Mennani, A.; Laftouhi, N. Potentialités hydrogéologiques du synclinal de Kourimat (bassin d’Essaouira, Maroc). Estud. Geol. 2001, 57, 47–52. [Google Scholar] [CrossRef]
- Elmeknassi, M.; Bouchaou, L.; El Mandour, A.; Elgettafi, M.; Himi, M.; Casas, A. Multiple stable isotopes and geochemical approaches to elucidate groundwater salinity and contamination in the critical coastal zone: A case from the Bou-areg and Gareb aquifers (North-Eastern Morocco). Environ. Pollut. 2022, 300, 118942. [Google Scholar] [CrossRef]
- Bahir, M.; Mennani, A.; Jalal, M.; Youbi, N. Ressources hydriques du bassin synclinal d’Essaouira (Maroc). Estud. Geol. 2000, 56, 185–195. [Google Scholar] [CrossRef]
- Mennani, A. Apport de l’hydrochimie et de l’isotopie à la Connaissance du Fonctionnement des Aquifères de la Zone Côtière d’Essaouira (Maroc Occidental). Ph.D. Thesis, Université Cadi Ayyad, Marrakesh, Morocco, 2001; p. 152. [Google Scholar]
- Chamchati, H. Evaluation et Protection des Ressources en eau en Zones Semi-Arides; Exemple du Bassin d’Essaouira. Ph.D. Thesis, Université Cadi Ayyad, Marrakesh, Morocco, 2014. [Google Scholar]
- Kouassi, A.M.; Mamadou, A.; Ahoussi, K.E.; Biemi, J. Simulation de la conductivité électrique des eaux souterraines en relation avec leurs propriétés géologiques: Cas de la Côte d’Ivoire. Rev. Ivoir. Sci. Technol. 2013, 21, 138–166. [Google Scholar]
- Brown, R.M.; McClelland, N.I.; Deininger, R.A.; Tozer, R.G. A water quality index-do we dare. Water Sew. Work. 1970, 117, 339–343. [Google Scholar]
- Xiao, J.; Wang, L.; Deng, L.; Jin, Z. Characteristics, sources, water quality and health risk assessment of trace elements in river water and well water in the Chinese Loess Plateau. Sci. Total Environ. 2019, 650, 2004–2012. [Google Scholar] [CrossRef] [PubMed]
- Edition, F. Guidelines for Drinking-Water Quality; WHO: Geneva, Switzerland, 2011; Volume 38, pp. 104–108.
- Al-Hamdany, N.A.; Al-Saffawi, A.Y.; Al-Shaker, Y.M. Applying the sub-index model to evaluate the quality of water for irrigation purposes, a case study: Wells water of left side from Mosul city, Iraq. Nippon. J. Environ. Sci. 2020, 1, 1–8. [Google Scholar] [CrossRef]
- Alghamdi, A.G.; Aly, A.A.; Aldhumri, S.A.; Al-Barakaha, F.N. Hydrochemical and quality assessment of groundwater resources in Al-Madinah City, Western Saudi Arabia. Sustainability 2020, 12, 3106. [Google Scholar] [CrossRef]
- Verma, P.; Singh, P.K.; Sinha, R.R.; Tiwari, A.K. Assessment of groundwater quality status by using water quality index (WQI) and geographic information system (GIS) approaches: A case study of the Bokaro district, India. Appl. Water Sci. 2020, 10, 27. [Google Scholar] [CrossRef]
- Ememu, A.H.; Nwankwoala, H.O. Application of Water Quality Index (WQI) For Agricultural and Irrigational Use Around Okpoko, Southeastern Nigeria. Eng. Herit. J. 2018, 2, 14–18. [Google Scholar] [CrossRef]
- Şener, Ş.; Şener, E.; Davraz, A. Evaluation of water quality using water quality index (WQI) method and GIS in Aksu River (SW-Turkey). Sci. Total Environ. 2017, 584, 131–144. [Google Scholar] [CrossRef]
- Jain, C.K.; Vaid, U. Assessment of groundwater quality for drinking and irrigation purposes using hydrochemical studies in Nalbari district of Assam, India. Environ. Earth Sci. 2018, 77, 1–14. [Google Scholar] [CrossRef]
- Kattan, Z. Using hydrochemistry and environmental isotopes in the assessment of groundwater quality in the Euphrates alluvial aquifer, Syria. Environ. Earth Sci. 2018, 77, 45. [Google Scholar] [CrossRef]
- Piper, A.M. A graphic procedure in the geochemical interpretation of water-analyses. Eos Trans. Am. Geophys. Union 1944, 25, 914–928. [Google Scholar] [CrossRef]
- Bahir, M.; Ouazar, D.; Ouhamdouch, S. Hydrogeochemical mechanisms and recharge mode of the aquifers under semiarid climate from Morocco. Appl. Water Sci. 2019, 9, 103. [Google Scholar] [CrossRef]
- Carreira, P.M.; Marques, J.M.; Nunes, D. Source of groundwater salinity in coastline aquifers based on environmental isotopes (Portugal): Natural vs. human interference. A review and reinterpretation. Appl. Geochem. 2014, 41, 163–175. [Google Scholar] [CrossRef]
- Foued, B.; Hénia, D.; Lazhar, B.; Nabil, M.; Nabil, C. Hydrogeochemistry and geothermometry of thermal springs from the Guelma region, Algeria. J. Geol. Soc. India 2017, 90, 226–232. [Google Scholar] [CrossRef]
- Hamed, Y.; Hadji, R.; Redhaounia, B.; Zighmi, K.; Bâali, F.; El Gayar, A. Climate impact on surface and groundwater in North Africa: A global synthesis of findings and recommendations. Euro-Mediterr J. Environ. Integr. 2018, 3, 25. [Google Scholar] [CrossRef]
- Ouhamdouch, S.; Bahir, M.; Ouazar, D.; Carreira, P.M.; Zouari, K. Evaluation of climate change impact on groundwater from semi-arid environment (Essaouira Basin, Morocco) using integrated approaches. Environ. Earth Sci. 2019, 78, 449. [Google Scholar] [CrossRef]
- Hamid, E.N.; Khan, J.; Malik, M.I. Multi-criteria evaluation based groundwater potential zonation of Pampore watershed using geo-spatial tools. Int. J. Res. Anal. 2018, 5, 352–358. [Google Scholar]
- Selvakumar, S.; Chandrasekar, N.; Kumar, G. Hydrogeochemical characteristics and groundwater contamination in the rapid urban development areas of Coimbatore, India. Water Resour. Ind. 2017, 17, 26–33. [Google Scholar] [CrossRef]
- Parkhurst, D.L.; Appelo, C.A.J. User’s guide to PHREEQC (Version 2): A computer program for speciation, batch-reaction, one-dimensional transport, and inverse geochemical calculations. Water-Resour. Investig. Rep. 1999, 99, 312. [Google Scholar] [CrossRef]
- Gibbs, R.J. Mechanisms controlling world water chemistry. Science 1970, 170, 1088–1090. [Google Scholar] [CrossRef]
- Bahir, M.; Ouhamdouch, S.; Ouazar, D.; El Moçayd, N. Climate change effect on groundwater characteristics within semi-arid zones from western Morocco. Groundw Sustain. Dev. 2020, 11, 100380. [Google Scholar] [CrossRef]
- Abourida, A.; Er-rouane, S.; Bahir, M.; da Silva, M.O.A. Cheggour Contribution des isotopes de l’environnement pour la comprehension du fonctionnement de l’aquifere mio-plioquaternaire du Haouz de Marrakech (Maroc). Estud. Geol. 2004, 60, 161–167. [Google Scholar] [CrossRef]
- Tijani, M.N.; Loehnert, E.P.; Uma, K.O. Origin of saline groundwaters in the Ogoja area, Lower Benue Trough, Nigeria. J. Afr. Earth Sci. 1996, 23, 237–252. [Google Scholar] [CrossRef]
- Kim, Y.; Lee, K.-S.; Koh, D.-C.; Lee, D.-H.; Lee, S.-G.; Park, W.-B.; Koh, G.-W.; Woo, N.-C. Hydrogeochemical and isotopic evidence of groundwater salinization in a coastal aquifer: A case study in Jeju volcanic island, Korea. J. Hydrol. 2003, 270, 282–294. [Google Scholar] [CrossRef]
- Geyh, M.A. An overview of 14C analysis in the study of groundwater. Radiocarbon 2000, 42, 99–114. [Google Scholar] [CrossRef]
- Craig, H. Isotopic variations in meteoric waters. Science 1961, 133, 1702–1703. [Google Scholar] [CrossRef]


| Sample | pH | EC | TDS | T | Ca2+ | Mg2+ | Na+ | K− | HCO3− | Cl− | SO42− | NO3− | IB |
|---|---|---|---|---|---|---|---|---|---|---|---|---|---|
| µS/cm | mg/L | °C | mg/L | % | |||||||||
| Campaign 2009 | |||||||||||||
| Min | 7.15 | 1671 | 835.5 | 19 | 34 | 30.24 | 127.42 | 3.9 | 109.8 | 217.97 | 44.64 | 0 | −7.71 |
| Max | 7.69 | 3520 | 1760 | 27 | 46 | 45.96 | 438.15 | 15.21 | 231.8 | 766.8 | 133.92 | 199 | −3.40 |
| Moy | 7.37 | 2193.77 | 1096.88 | 21.46 | 39.54 | 36.44 | 220.06 | 7.20 | 182.53 | 372.91 | 110.33 | 37.72 | −5.56 |
| SD | 0.14 | 482.48 | 241.24 | 2.47 | 3.48 | 5.12 | 83.82 | 3.88 | 32.80 | 142.38 | 22.96 | 54.68 | 1.23 |
| Campaign 2017 | |||||||||||||
| Min | 7.1 | 724 | 396 | 18.9 | 44.90 | 31.10 | 85.00 | 4.40 | 189.10 | 170.40 | 11.30 | 6 | −9.46 |
| Max | 8 | 7555 | 4273 | 27.4 | 368.70 | 205.10 | 1430.90 | 74.50 | 567.40 | 3138.20 | 257.20 | 126.50 | 7.08 |
| Moy | 7.57 | 2217.77 | 1165.48 | 22.66 | 133.84 | 80.83 | 254.28 | 14.63 | 337.29 | 670.64 | 93.97 | 32.71 | −4.25 |
| Sd | 0.23 | 1253.77 | 700.02 | 1.98 | 72.13 | 36.87 | 237.58 | 15.80 | 82.76 | 541.43 | 51.35 | 29.16 | 4.55 |
| Campaign 2018 | |||||||||||||
| Min | 7.2 | 916 | 458 | 17.58 | 57.72 | 14.20 | 76.75 | 1.28 | 12.20 | 98.80 | 3.47 | 0 | −9.30 |
| Max | 8.65 | 9744 | 4875 | 2029 | 364 | 238 | 1464 | 66 | 549.14 | 3158 | 406 | 398.25 | 2.98 |
| Moy | 7.68 | 1395 | 1918.24 | 90.51 | 136.75 | 71.17 | 278.05 | 11.20 | 270.43 | 640.99 | 127.33 | 38.70 | −1.89 |
| Sd | 0.36 | 1724.70 | 869.08 | 360.24 | 78.32 | 37.80 | 266.15 | 12.96 | 95.75 | 587.91 | 82.82 | 73.27 | 3.21 |
| Campaign 2019 | |||||||||||||
| Min | 7.09 | 880 | 440 | 17.26 | 64.13 | 6.804 | 84.28 | 1.77 | 150 | 226.60 | 30.29 | 0 | −10.29 |
| Max | 9.11 | 12,250 | 11,146 | 2305 | 849.70 | 260 | 1950 | 75 | 658.8 | 4799.60 | 830.29 | 400 | 4.62 |
| Moy | 7.62 | 2775.40 | 1715.87 | 231.83 | 163.29 | 67.27 | 346.92 | 12.20 | 381.71 | 814.25 | 145.12 | 38.53 | −5.92 |
| Sd | 0.38 | 2394.10 | 2146.45 | 635.64 | 147.32 | 46.35 | 359.90 | 16.71 | 116.40 | 921.05 | 148.96 | 75.18 | 3.32 |
| Physico-Chemical Parameters | WHO Standard (2011) | Weight (wi) | Relative Weight (Wi) |
|---|---|---|---|
| pH | 6.5–8.5 | 4 | 0.114 |
| EC (µS/cm) | 500–1500 | 4 | 0.114 |
| TDS (mg/L) | 500 | 5 | 0.142 |
| Cl− (mg/L) | 250 | 3 | 0.086 |
| SO42− (mg/L) | 250 | 4 | 0.114 |
| NO3− (mg/L) | 45 | 5 | 0.142 |
| HCO3- (mg/L) | 120 | 3 | 0.086 |
| Na+ (mg/L) | 200 | 2 | 0.057 |
| Ca2+ (mg/L) | 75 | 2 | 0.057 |
| Mg2+ (mg/L) | 50 | 1 | 0.029 |
| K+ (mg/L) | 12 | 2 | 0.057 |
| 35 | 0.998 |
| Physico-Chemical Parameters | Si | wi | Wi |
|---|---|---|---|
| pH | 6.5–8.5 | 4 | 0.09 |
| EC | 2000 | 5 | 0.11 |
| Cl− (meq/L) | 10 | 3 | 0.07 |
| NO3− (meq/L) | 2.18 | 3 | 0.07 |
| HCO3− (meq/L) | 8.5 | 3 | 0.07 |
| PI | 75 | 5 | 0.11 |
| Na (%) | 60 | 4 | 0.09 |
| SAR | 18 | 5 | 0.11 |
| MAR | 50 | 4 | 0.09 |
| PS | 7 | 5 | 0.11 |
| KI | 1 | 3 | 0.07 |
| SOMME | 44 | 1 |
| EC | Ca2+ | Mg2+ | Na+ | K+ | HCO3− | Cl− | SO42− | NO3− | |
|---|---|---|---|---|---|---|---|---|---|
| Campaign 2009 (n = 13) | |||||||||
| EC | 1 | ||||||||
| Ca2+ | −0.20 | 1 | |||||||
| Mg2+ | 0.59 | 0.40 | 1 | ||||||
| Na+ | 0.95 | −0.33 | 0.36 | 1 | |||||
| K+ | 0.34 | −0.05 | −0.22 | 0.49 | 1 | ||||
| HCO3− | −0.73 | 0.13 | −0.75 | −0.58 | 0.20 | 1 | |||
| Cl− | 0.99 | −0.19 | 0.58 | 0.96 | 0.39 | −0.72 | 1 | ||
| SO42− | 0.13 | 0.46 | 0.31 | 0.06 | 0.17 | −0.04 | 0.18 | 1 | |
| NO3− | 0.33 | −0.46 | −0.07 | 0.45 | −0.03 | −0.23 | 0.31 | −0.76 | 1 |
| Campaign 2017 (n = 31) | |||||||||
| EC | 1 | ||||||||
| Ca2+ | 0.82 | 1 | |||||||
| Mg2+ | 0.86 | 0.83 | 1 | ||||||
| Na+ | 0.92 | 0.62 | 0.68 | 1 | |||||
| K+ | 0.55 | 0.39 | 0.36 | 0.66 | 1 | ||||
| HCO3− | −0.06 | −0.25 | −0.20 | 0.01 | 0.32 | 1 | |||
| Cl− | 0.98 | 0.83 | 0.87 | 0.92 | 0.57 | −0.15 | 1 | ||
| SO42− | 0.66 | 0.49 | 0.64 | 0.59 | 0.30 | −0.09 | 0.62 | 1 | |
| NO3− | 0.36 | 0.18 | 0.12 | 0.42 | 0.13 | 0.08 | 0.27 | 0.14 | 1 |
| Campaign 2018 (n = 31) | |||||||||
| EC | 1 | ||||||||
| Ca2+ | 0.82 | 1 | |||||||
| Mg2+ | 0.89 | 0.69 | 1 | ||||||
| Na+ | 0.97 | 0.71 | 0.86 | 1 | |||||
| K+ | 0.87 | 0.70 | 0.75 | 0.88 | 1 | ||||
| HCO3− | −0.36 | −0.30 | −0.29 | −0.33 | −0.21 | 1 | |||
| Cl− | 0.99 | 0.80 | 0.90 | 0.98 | 0.88 | −0.36 | 1 | ||
| SO42− | 0.73 | 0.65 | 0.70 | 0.69 | 0.51 | −0.38 | 0.69 | 1 | |
| NO3− | 0.30 | 0.32 | 0.29 | 0.34 | 0.31 | −0.11 | 0.27 | 0.28 | 1 |
| Campaign 2019 (n = 30) | |||||||||
| EC | 1 | ||||||||
| Ca2+ | 0.92 | 1 | |||||||
| Mg2+ | 0.56 | 0.38 | 1 | ||||||
| Na+ | 0.93 | 0.95 | 0.35 | 1 | |||||
| K+ | 0.61 | 0.73 | 0.16 | 0.64 | 1 | ||||
| HCO3− | −0.23 | −0.08 | −0.39 | −0.01 | 0.05 | 1 | |||
| Cl− | 0.97 | 0.96 | 0.51 | 0.97 | 0.65 | −0.16 | 1 | ||
| SO42− | 0.80 | 0.68 | 0.78 | 0.67 | 0.40 | −0.35 | 0.74 | 1 | |
| NO3− | 0.20 | 0.34 | −0.17 | 0.32 | 0.16 | 0.10 | 0.22 | 0.07 | 1 |
| WQI Range | Type of Water | Campaign 2009 | Campaign 2017 | Campaign 2018 | Campaign 2019 | ||||
|---|---|---|---|---|---|---|---|---|---|
| Sample No. | Sample % | Sample No. | Sample % | Sample No. | Sample % | Sample No. | Sample % | ||
| <50 | Excellent water | - | - | - | - | - | - | - | - |
| 50–100.1 | Good water | 3 | 23 | 5 | 16.1 | 3 | 9.7 | 1 | 3.3 |
| 100–200.1 | Poor water | 10 | 77 | 22 | 71 | 23 | 74.2 | 3 | 76.7 |
| 200–300.1 | Very poor water | - | - | 3 | 9.7 | 2 | 6.4 | 4 | 13.3 |
| >300 | Unsuitable water for drinking | - | - | 1 | 3.2 | 3 | 9.7 | 2 | 6.7 |
| Range | pH | EC | Cl− | NO3− | HCO3− | PI | %NA | SAR | MH | PS | KI | IWQI |
|---|---|---|---|---|---|---|---|---|---|---|---|---|
| Campaign 2009 | ||||||||||||
| Min | 7.15 | 1671 | 6.15 | 0.00 | 1.80 | 65.37 | 50.05 | 3.29 | 55.48 | 7.31 | 0.98 | 75.42 |
| Max | 7.69 | 3520 | 21.63 | 3.21 | 3.80 | 85.54 | 77.30 | 11.31 | 66.60 | 22.93 | 3.36 | 149.90 |
| Mean | 7.37 | 2193.77 | 10.52 | 0.61 | 2.99 | 76.79 | 64.64 | 6.08 | 60.14 | 11.67 | 1.93 | 98.95 |
| Campaign 2017 | ||||||||||||
| Min | 7.1 | 724 | 4.81 | 0.10 | 3.10 | 33.13 | 29.12 | 1.99 | 39.29 | 4.98 | 0.40 | 60.28 |
| Max | 8 | 7555 | 88.52 | 2.04 | 9.30 | 76.42 | 65.26 | 15.08 | 65.47 | 91.20 | 1.83 | 320.55 |
| Mean | 7.57 | 2217.77 | 18.92 | 0.53 | 5.53 | 54.68 | 43.94 | 4.14 | 50.25 | 19.90 | 0.82 | 106.58 |
| Campaign 2018 | ||||||||||||
| Min | 7.2 | 916 | 2.79 | 0.00 | 0.20 | 44.39 | 30.13 | 1.74 | 26.74 | 3.06 | 0.43 | 60.58 |
| Max | 8.65 | 9744 | 89.08 | 6.42 | 9.00 | 73.34 | 65.29 | 15.28 | 59.99 | 92.44 | 1.83 | 352.29 |
| Mean | 7.68 | 2753.87 | 18.08 | 0.62 | 4.43 | 56.40 | 46.03 | 4.49 | 46.54 | 19.41 | 0.89 | 110.31 |
| Campaign 2019 | ||||||||||||
| Min | 7.09 | 880 | 6.39 | 0.00 | 2.46 | 43.33 | 32.12 | 1.85 | 7.03 | 6.77 | 0.47 | 66.71 |
| Max | 9.11 | 12,250 | 135.39 | 6.45 | 10.80 | 79.71 | 68.29 | 17.09 | 61.03 | 140.05 | 2.12 | 462.91 |
| Mean | 7.62 | 2775.4 | 22.97 | 0.62 | 6.26 | 60.29 | 49.69 | 5.47 | 41.43 | 24.48 | 1.09 | 124.54 |
| Parameters | Weight | Relative Weight | Effective Weight (%) | ||
|---|---|---|---|---|---|
| Min | Max | Average | |||
| PH | 4 | 0.09 | 1.52 | 25.41 | 10.54 |
| EC | 5 | 0.11 | 5.78 | 24.77 | 12.44 |
| Cl− | 3 | 0.07 | 3.14 | 19.94 | 10.25 |
| NO3− | 3 | 0.07 | 0.00 | 14.84 | 1.60 |
| HCO3− | 3 | 0.07 | 0.12 | 7.56 | 4.17 |
| PI | 5 | 0.11 | 2.13 | 17.44 | 9.09 |
| %NA | 4 | 0.09 | 2.09 | 11.52 | 7.26 |
| SAR | 5 | 0.11 | 1.29 | 5.32 | 2.72 |
| MH | 4 | 0.09 | 0.55 | 16.14 | 8.92 |
| PS | 5 | 0.11 | 8.19 | 49.11 | 26.23 |
| KI | 3 | 0.07 | 1.75 | 16.45 | 6.78 |
| Sample | T | pH | EC | B | Ni | Cr | Cd | As | Aquifer |
|---|---|---|---|---|---|---|---|---|---|
| °C | µS/cm | µg/L | |||||||
| L1 | 21.3 | 9.2 | 2011 | 270 | 2.73 | <2 | <0.5 | <2 | PQ |
| L2 | 20.6 | 9.5 | 16,300 | 1050 | 7.91 | <2 | <0.5 | 10.76 | PQ |
| L3 | 20.4 | 7.3 | 1780 | 220 | 2.91 | <2 | <0.5 | 4.74 | PQ |
| L4 | 23 | 8.8 | 4460 | 320 | 6 | <2 | <0.5 | <2 | PQ |
| L5 | 22.5 | 9.2 | 863 | 180 | <2.5 | <2 | <0.5 | <2 | PQ |
| L6 | 23.2 | 8.9 | 941 | 170 | <2.5 | <2 | <0.5 | <2 | PQ |
| L7 | 22.4 | 7.64 | 1396 | 100 | <2.5 | <2 | <0.5 | <2 | PQ |
| L8 | 23 | 7.5 | 1898 | 150 | 4.25 | <2 | <0.5 | <2 | PQ |
| L9 | 22.65 | 9.4 | 4888 | 630 | 2.89 | <2 | <0.5 | 4.34 | PQ |
| L10 | 20.8 | 8 | 1942 | 390 | 2.64 | <2 | <0.5 | 8.2 | PQ |
| L11 | 21.43 | 7.55 | 1310 | 130 | <2.5 | <2 | <0.5 | 8.06 | PQ |
| L12 | 22.83 | 9.27 | 3169 | 550 | 17.27 | <2 | <0.5 | <2 | PQ |
| L13 | 24 | 7.4 | 1962 | 150 | 3.62 | <2 | <0.5 | 6.25 | PQ |
| L14 | 22 | 7.47 | 1620 | 120 | 3.27 | <2 | <0.5 | <2 | PQ |
| L15 | 22.3 | 9.5 | 3500 | 430 | 5.96 | <2 | <0.5 | <2 | PQ |
| L16 | 21.5 | 7.6 | 1600 | 110 | <2.5 | <2 | <0.5 | 2.27 | PQ |
| L17 | 25 | 7.64 | 1610 | 100 | 4.47 | <2 | <0.5 | <2 | PQ |
| L18 | 22.55 | 7.36 | 1910 | 160 | 3.9 | <2 | <0.5 | 8.55 | PQ |
| L19 | 22.6 | 7.85 | 1236 | 230 | 7.38 | <2 | <0.5 | 7.74 | PQ |
| L20 | 23.2 | 9.6 | 2480 | 140 | 4.66 | <2 | <0.5 | <2 | PQ |
| L21 | 23.2 | 9.7 | 2621 | 440 | 4.63 | <2 | <0.5 | 7.24 | PQ |
| L22 | 22 | 9.8 | 2116 | 290 | <2.5 | <2 | <0.5 | 2.12 | PQ |
| L23 | 21 | 9.5 | 1820 | 230 | <2.5 | <2 | <0.5 | 4.14 | PQ |
| L24 | 22.8 | 8.58 | 2470 | 140 | 4.55 | <2 | <0.5 | <2 | PQ |
| L25 | 22.4 | 9.5 | 5930 | 1030 | 4.67 | <2 | <0.5 | <2 | PQ |
| L26 | 24.2 | 9 | 2509 | 160 | 3.93 | <2 | <0.5 | 7.73 | PQ |
| L27 | 21.4 | 7.8 | 1363 | 110 | <2.5 | <2 | <0.5 | 8.61 | PQ |
| L28 | 23.37 | 7.4 | 2247 | 230 | <2.5 | <2 | <0.5 | <2 | PQ |
| L29 | 26.7 | 8.54 | 3851 | 250 | 5.44 | <2 | <0.5 | <2 | PQ |
| L30 | 25 | 9.2 | 2270 | 150 | 2.7 | <2 | <0.5 | 3.47 | PQ |
| L31 | 24.7 | 9.7 | 2470 | 190 | 2.79 | <2 | <0.5 | 3.99 | PQ |
| L32 | 28 | 7.19 | 1857 | 120 | 6.89 | <2 | <0.5 | 8.58 | T |
| L33 | 29 | 7.18 | 1768 | 110 | 17.65 | <2 | <0.5 | 3.89 | T |
| L34 | 25 | 8.8 | 2190 | 250 | <2.5 | <2 | <0.5 | 3.32 | T |
| L35 | 22.45 | 8.85 | 2457 | 200 | 5.7 | <2 | <0.5 | 10.34 | T |
| L36 | 24.5 | 9.1 | 2510 | 190 | 3.23 | <2 | <0.5 | <2 | T |
| L37 | 26.7 | 8.04 | 1500 | 110 | 4.53 | <2 | <0.5 | 5.97 | Wadi upstream |
| L38 | 27.11 | 9.9 | 3040 | 320 | 4.7 | <2 | <0.5 | 5.83 | Wadi downstream |
| 6.5–8.5 | 1500 | 500 | 70 | 50 | 3 | 10 | WHO | ||
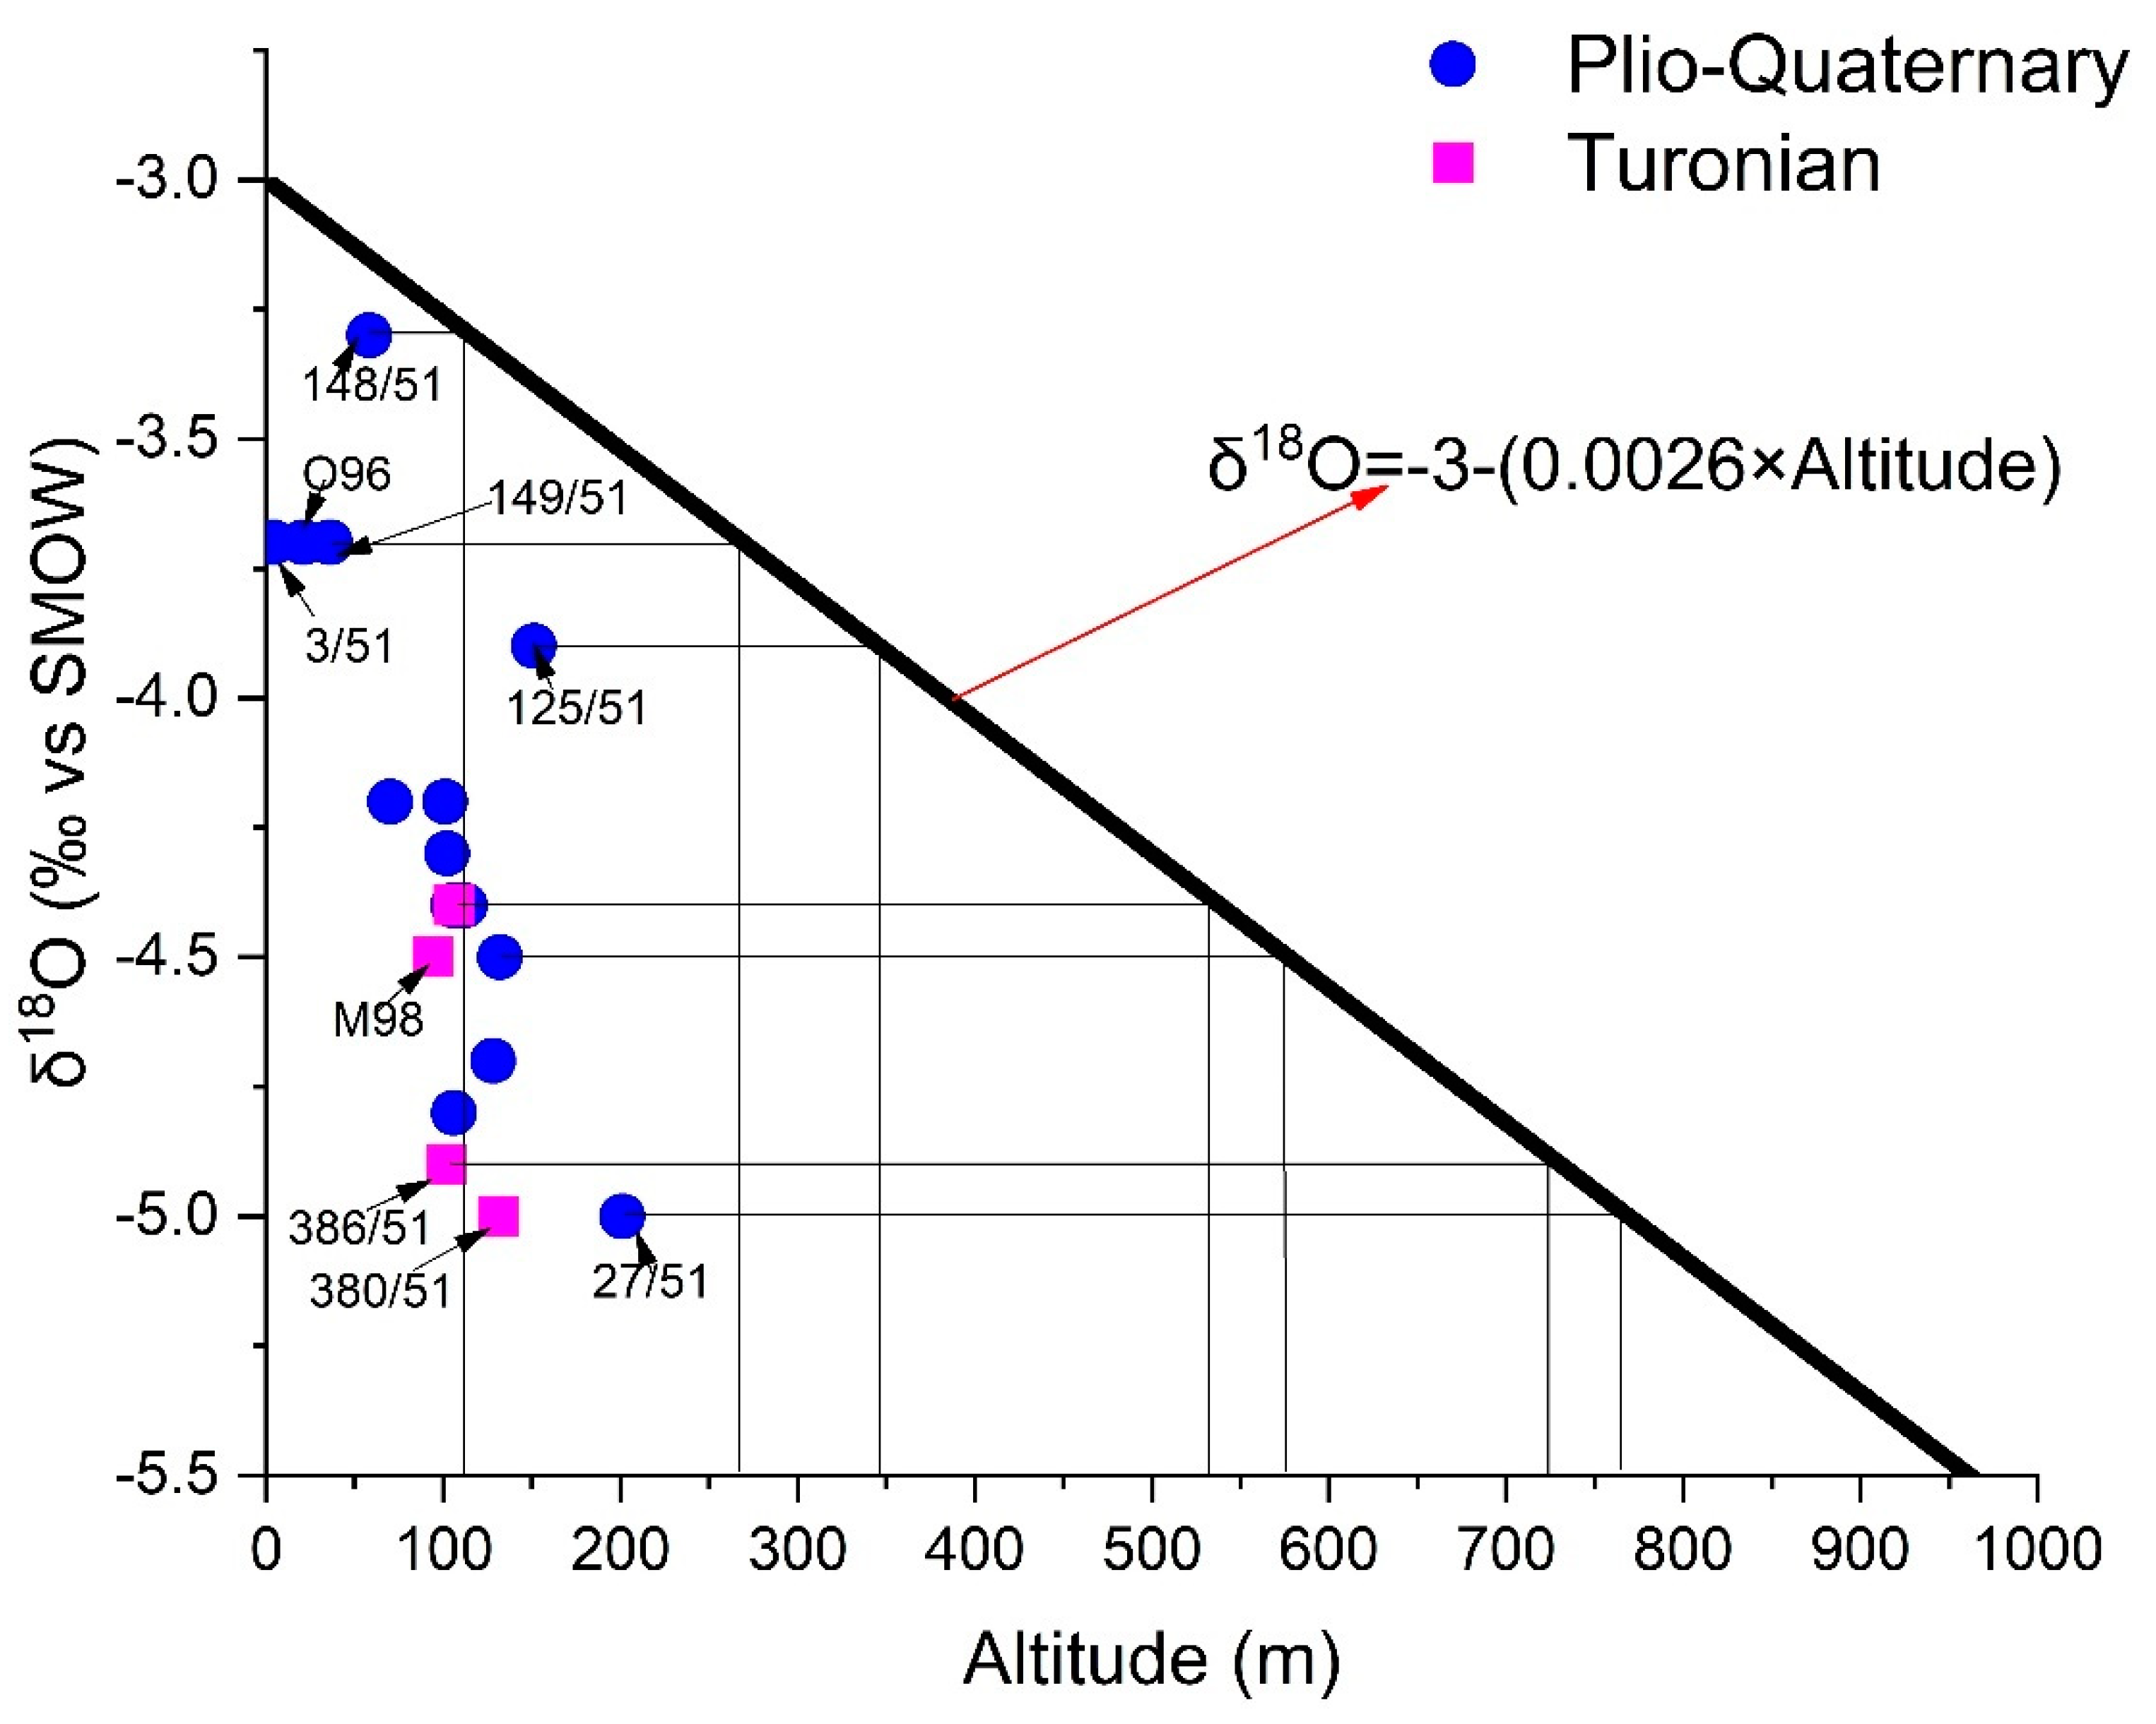
| Sample | pH | T | EC | δ2H | δ18O | Cl− (meq/L) |
|---|---|---|---|---|---|---|
| 11/51 | 8.4 | 17.6 | 9744 | −8.9 | −1.8 | 89.08 |
| 15/51 | 7.8 | 19.8 | 1557 | −23 | −4.5 | 7.11 |
| 21/51 | 7.4 | 23.3 | 4933 | −26.1 | −4.7 | 38.29 |
| 27/51 | 7.8 | 22.2 | 916 | −25.5 | −5 | 2.79 |
| 105/51 | 7.5 | 22.7 | 2187 | −19.6 | −2.6 | 11.96 |
| 125/51 | 8 | 26.3 | 2716 | −25.2 | −3.9 | 15.29 |
| 148/51 | 7.5 | 21.2 | 1602 | −18.7 | −3.3 | 8.98 |
| 149/51 | 7.4 | 23.1 | 3482 | −22.5 | −3.7 | 21.58 |
| 272/51 | 7.5 | 22 | 1957 | −29.1 | −4.4 | 9.86 |
| 327/51 | 7.7 | 21.9 | 3608 | −14.6 | −2.9 | 28.34 |
| O2 | 7.9 | 25.2 | 1960 | −24.5 | −4.5 | 10.96 |
| O6 | 7.3 | 21.7 | 2176 | −27.2 | −4.2 | 10.61 |
| O8 | 7.9 | 20.5 | 2731 | −29.7 | −4.8 | 18.68 |
| O91 | 7.6 | 23.2 | 3034 | −24.8 | −4.3 | 21.73 |
| O94 | 7.4 | 20.7 | 3408 | −21.5 | −3.7 | 22.54 |
| O96 | 8.1 | 20.7 | 1842 | −18.7 | −3.7 | 8.67 |
| O111 | 7.2 | 23.6 | 2794 | −25.1 | −4.4 | 17.75 |
| O113 | 8.1 | 21.3 | 6716 | −22.5 | −4.2 | 54.44 |
| M98 | 7.2 | 23.2 | 2699 | −28 | −4.5 | 16.29 |
| 346/51 | 7.3 | 27.1 | 1967 | −28 | −4.4 | 9.92 |
| 380/51 | 7.9 | 21.5 | 2428 | −28.6 | −5 | 13.34 |
| 386/51 | 7.8 | 22.3 | 2638 | −27.3 | −4.9 | 15.24 |
| EL1 | 8.2 | 20.7 | 1896 | −9.6 | −0.7 | 10.69 |
| EL2 | 8.7 | 25.8 | 2965 | −15.9 | −1.7 | 20.15 |
| O121 | 6 | 23.8 | 48 | −26.2 | −5.8 | not measured |
Publisher’s Note: MDPI stays neutral with regard to jurisdictional claims in published maps and institutional affiliations. |
© 2022 by the authors. Licensee MDPI, Basel, Switzerland. This article is an open access article distributed under the terms and conditions of the Creative Commons Attribution (CC BY) license (https://creativecommons.org/licenses/by/4.0/).
Share and Cite
El Mountassir, O.; Bahir, M.; Chehbouni, A.; Dhiba, D.; El Jiar, H. Assessment of Groundwater Quality and the Main Controls on Its Hydrochemistry in a Changing Climate in Morocco (Essaouira Basin). Sustainability 2022, 14, 8012. https://doi.org/10.3390/su14138012
El Mountassir O, Bahir M, Chehbouni A, Dhiba D, El Jiar H. Assessment of Groundwater Quality and the Main Controls on Its Hydrochemistry in a Changing Climate in Morocco (Essaouira Basin). Sustainability. 2022; 14(13):8012. https://doi.org/10.3390/su14138012
Chicago/Turabian StyleEl Mountassir, Otman, Mohammed Bahir, Abdelghani Chehbouni, Driss Dhiba, and Hicham El Jiar. 2022. "Assessment of Groundwater Quality and the Main Controls on Its Hydrochemistry in a Changing Climate in Morocco (Essaouira Basin)" Sustainability 14, no. 13: 8012. https://doi.org/10.3390/su14138012
APA StyleEl Mountassir, O., Bahir, M., Chehbouni, A., Dhiba, D., & El Jiar, H. (2022). Assessment of Groundwater Quality and the Main Controls on Its Hydrochemistry in a Changing Climate in Morocco (Essaouira Basin). Sustainability, 14(13), 8012. https://doi.org/10.3390/su14138012