Article

Cumulative LDL-C Burden and Incident Acute Coronary Syndrome in Type 2 Diabetes

1
Primary Health Care Corporation, Doha P.O. Box 26555, Qatar
2
College of Medicine, Qatar University, Doha P.O. Box 2713, Qatar
3
Hamad Medical Corporation, Doha P.O. Box 3050, Qatar
*
Author to whom correspondence should be addressed.
Cardiovasc. Med. 2026, 29(2), 18; https://doi.org/10.3390/cardiovascmed29020018
Submission received: 25 March 2026 / Revised: 10 May 2026 / Accepted: 13 May 2026 / Published: 19 May 2026

Abstract

Background: Low-density lipoprotein cholesterol (LDL-C) is a central modifiable driver of atherosclerotic cardiovascular disease, yet cardiovascular risk in type 2 diabetes mellitus (T2DM) may be better captured by longitudinal LDL-C exposure than by a single LDL-C measurement. We examined the association of current LDL-C, cumulative LDL-C burden, and prior time below LDL-C targets with incident acute coronary syndrome (ACS) in patients with T2DM. Methods: We conducted a retrospective longitudinal cohort study using routinely collected electronic health-record data. Patients with T2DM and at least one valid LDL-C measurement between 1 January 2018 and 31 December 2023 were followed from the first eligible LDL-C measurement until incident ACS or administrative censoring on 31 March 2024. LDL-C was modeled using time-updated start–stop Cox regression. The primary exposure was current LDL-C category: <1.4, 1.4 to <1.8, 1.8 to <2.6, 2.6 to <3.4, 3.4 to <4.9, and ≥4.9 mmol/L. Secondary exposure metrics were cumulative LDL-C burden above prespecified thresholds and prior percentage of follow-up time below LDL-C targets. Models were adjusted for age, sex, hypertension, chronic kidney disease, HbA1c, T2DM duration, and calendar year of baseline LDL-C measurement; HbA1c and T2DM duration were multiply imputed. Results: The analytic cohort included 106,185 patients, 426,965 LDL-C intervals, and 5416 incident ACS events over 419,251.0 person-years. Compared with current LDL-C <1.4 mmol/L, adjusted ACS risk was higher for current LDL-C 3.4 to <4.9 mmol/L (HR 1.35, 95% CI 1.21–1.50) and ≥4.9 mmol/L (HR 1.94, 95% CI 1.63–2.32), whereas lower LDL-C categories were not clearly different from the reference category after adjustment. Each 1 mmol/L-year higher cumulative LDL-C burden was associated with higher ACS risk across evaluated thresholds, with HRs ranging from 1.04 to 1.13. Greater prior time below LDL-C targets was associated with lower ACS risk, with HRs of 0.97–0.98 per 10% higher time below target. Findings were consistent in sensitivity analyses restricted to patients with at least three LDL-C measurements, landmark analyses, and complete-case analysis. Conclusions: In patients with T2DM, incident ACS risk was associated with very high current LDL-C and with longitudinal LDL-C exposure captured by cumulative burden and time below target. These findings support sustained, target-oriented LDL-C control and suggest that longitudinal LDL-C metrics may complement single LDL-C values in cardiovascular risk assessment.

1. Introduction

Type 2 diabetes mellitus (T2DM) is a major contributor to atherosclerotic cardiovascular disease, and acute coronary syndrome (ACS) remains one of its most clinically important complications. The global diabetes burden continues to rise, making diabetes-related cardiovascular prevention a central priority for health systems [1]. In Qatar, T2DM and cardiometabolic risk factors are highly prevalent in primary-care populations, making locally generated evidence on preventable coronary risk particularly relevant [2,3].
Low-density lipoprotein cholesterol (LDL-C) is a causal, modifiable driver of atherosclerotic cardiovascular disease [4]. In people with diabetes, randomized statin-trial evidence shows an approximately one-fifth proportional reduction in major vascular events per 1 mmol/L LDL-C reduction, and broader meta-analytic evidence indicates that cardiovascular benefit is proportional to the absolute LDL-C reduction achieved through statin and selected non-statin pathways [5,6]. Contemporary guidelines therefore recommend risk-based LDL-C targets in diabetes, commonly <1.8 mmol/L (<70 mg/dL) for many high-risk primary-prevention patients and <1.4 mmol/L (<55 mg/dL) for secondary-prevention or very-high-risk patients [7,8,9].
Most clinical datasets, however, do not reflect a single static LDL-C exposure. Patients move in and out of target over time because of treatment initiation, treatment intensification, adherence, comorbidity, and testing patterns. A single baseline LDL-C value may therefore misclassify cumulative atherogenic exposure. Although longitudinal evidence suggests that cumulative LDL-C exposure and LDL-C time in target range provide information beyond a one-time LDL-C measure, few studies have jointly evaluated current LDL-C, cumulative burden, and prior time below target in patients with T2DM using incident ACS endpoints in Middle Eastern real-world care settings [10,11].
We therefore conducted a large retrospective longitudinal electronic health-record cohort study of patients with T2DM to evaluate the association between time-updated LDL-C and incident ACS. In addition to current LDL-C categories, we prespecified two complementary longitudinal exposure metrics: cumulative LDL-C burden above guideline-relevant thresholds and prior percentage of follow-up time below LDL-C targets. We hypothesized that very high current LDL-C, increasing cumulative LDL-C burden, and lower time below target would be associated with higher incident ACS risk.

2. Materials and Methods

2.1. Study Design and Data Source

We conducted a retrospective longitudinal cohort study using routinely collected electronic health-record data from Qatar’s Primary Health Care Corporation (PHCC). Patients were identified as having T2DM. The dataset included patient-level demographic variables, administrative clinical indicators, serial LDL-C measurements, HbA1c measurements, estimated glomerular filtration rate (eGFR) measurements, diagnosis indicators, and undated cardiometabolic medication-use flags. The administrative censoring date was 31 March 2024. The study is reported in accordance with STROBE guidance for observational studies [12].
Medication-use dates were not available. Because the medication flags did not identify treatment timing, intensity, adherence, or changes after LDL-C testing, including them as primary model covariates could introduce treatment-exposure misclassification and confounding by indication rather than adequately control treatment confounding. Medication variables were therefore used only for descriptive summaries and as auxiliary variables in multiple imputation; they were not interpreted as time-dependent treatment exposures or causal treatment-effect covariates.

2.2. Source Population and Eligibility Criteria

The source population comprised patients with a valid patient identifier in the T2DM dataset. Patients were eligible for the analytic cohort if they had at least one valid LDL-C measurement between 1 January 2018 and 31 December 2023. LDL-C measurements were considered valid when the value was positive, ≤20 mmol/L, linked to an LDL-C assay, and accompanied by a valid measurement date.
For patients with an ACS diagnosis, LDL-C measurements were eligible only if they occurred strictly before the ACS date. Patients with ACS but without any eligible pre-ACS LDL-C measurement were excluded from the incident-event analytic cohort to preserve temporal ordering between LDL-C exposure and ACS occurrence. Baseline was defined as the date of the first eligible LDL-C measurement. Follow-up started at baseline and ended at the first recorded ACS event or administrative censoring on 31 March 2024, whichever occurred first.
Patients were identified from the T2DM source population; however, the first recorded T2DM diagnosis date was treated as an administrative recorded date rather than an absolute biological onset date. Therefore, the analysis did not require every baseline LDL-C measurement to occur after the first recorded T2DM diagnosis date. Duration of T2DM at baseline was calculated when the first recorded T2DM diagnosis date preceded the baseline LDL-C date and was treated as missing when the recorded diagnosis date occurred after baseline LDL-C.

2.3. LDL-C Exposure Definitions

LDL-C was analyzed longitudinally using time-updated start–stop intervals, as detailed in the Supplementary Methods. Briefly, serial eligible LDL-C measurements were ordered chronologically within each patient, and the most recent LDL-C value was carried forward until the next eligible LDL-C measurement, incident ACS, or administrative censoring. Interval time was measured in years from baseline LDL-C, and intervals with non-positive duration were not retained.
The primary exposure was current time-updated LDL-C category. LDL-C was categorized as <1.4, 1.4 to <1.8, 1.8 to <2.6, 2.6 to <3.4, 3.4 to <4.9, and ≥4.9 mmol/L. The <1.4 mmol/L category was used as the reference group.
Two prespecified longitudinal LDL-C exposure metrics were evaluated as key secondary analyses. First, cumulative LDL-C burden above prespecified thresholds was calculated before each interval start as the sum of interval-level excess LDL-C exposure, defined as max (LDL-C—threshold, 0), multiplied by interval duration in years. Intuitively, 1 mmol/L-year represents LDL-C exposure 1 mmol/L above a threshold for one year, or 0.5 mmol/L above a threshold for two years. Cumulative burden was evaluated above 1.4, 1.8, 2.6, 3.4, and 4.9 mmol/L and modeled per 1 mmol/L-year higher burden. Second, prior time below LDL-C target was calculated before each interval start as the cumulative percentage of follow-up time from baseline spent below a given threshold; it was not based on a moving window. Time below target was evaluated for LDL-C <1.4, <1.8, and <2.6 mmol/L and modeled per 10% higher prior time below target. Both secondary metrics used only LDL-C exposure history accumulated before the interval start.

2.4. Outcome Ascertainment

The study outcome was incident ACS during follow-up, defined using the first recorded ACS diagnosis date in the electronic health-record data. In the available EHR extract, ACS was provided as an administrative diagnosis/date field representing a composite ACS endpoint. Component-level differentiation of ST-elevation myocardial infarction, non-ST-elevation myocardial infarction, and unstable angina, as well as ICD-code position, hospital-confirmation status, and independent adjudication status, was not available. Patients were classified as having incident ACS if the ACS date occurred after baseline LDL-C and on or before 31 March 2024. Patients without ACS during follow-up were administratively censored on 31 March 2024. In the time-updated interval dataset, the ACS event indicator was assigned to the final interval ending at the ACS date, so each patient could contribute no more than one ACS event.

2.5. Covariates

The primary adjustment set included age, sex, hypertension, chronic kidney disease (CKD), HbA1c, duration of T2DM, and calendar year of baseline LDL-C measurement. Exact birth dates were not available. Age at data extraction was treated as age on 31 March 2024; date of birth was estimated from this value, and age was recalculated at baseline, follow-up end, and each interval start. In time-updated Cox models, age at interval start was modeled per 10-year increase. Sex was modeled as male vs. female.
Hypertension and CKD were defined using administrative clinical indicators. For patients with ACS, pre-ACS indicators were preferentially used when available. HbA1c was selected from valid pre-baseline HbA1c measurements within 365 days before baseline LDL-C. Calendar year was defined as the calendar year of the baseline LDL-C measurement and centered at 2018 for model fitting.
Continuous eGFR was not included in the primary adjustment model because the available eGFR values appeared top-coded or censored around 60 mL/min/1.73 m2; the CKD indicator was retained as the renal-status covariate. Nationality was not included in the primary adjustment set because it was not a core confounder for the LDL-C/ACS question and could create sparse-category instability. Thyroid-stimulating hormone and urine albumin ratio were not included as primary covariates because they were not core confounders and had unfavorable missingness or data-quality characteristics.

2.6. Missing Data and Multiple Imputation

Missingness was assessed at the patient level for candidate covariates. HbA1c and T2DM duration were selected for multiple imputation because they were clinically important primary adjustment covariates with incomplete observed data. The imputation approach assumes that, conditional on observed variables included in the imputation model, missing HbA1c and T2DM duration values were plausibly missing at random. In the final analytic cohort, HbA1c was missing in 23,215 patients (21.86%), and T2DM duration was missing in 36,674 patients (34.54%). Complete primary covariates included age, sex, hypertension, CKD, and calendar year of baseline LDL-C measurement.
Multiple imputation by chained equations was performed using predictive mean matching [13,14]. Fifty imputed datasets were generated with 20 iterations and 5 donors. The imputation model included the complete primary covariates and clinically relevant auxiliary variables: incident ACS status, follow-up time, log follow-up time, a survival-hazard auxiliary predictor, baseline LDL-C, number of eligible LDL-C measurements, indicator for at least three LDL-C measurements, time-weighted mean LDL-C, final cumulative LDL-C burden above 1.8 mmol/L, final percentage of time below LDL-C 1.8 mmol/L, dyslipidemia, and undated cardiometabolic medication-use flags. The survival-hazard auxiliary predictor was used only to support imputation and was not interpreted clinically.
Incomplete non-target predictors were excluded from the imputation predictor matrix to prevent residual missingness in completed target variables; specifically, continuous eGFR was excluded from the predictor matrix. No single completed dataset was selected for analysis. Models were fitted separately in each of the 50 completed datasets, and estimates were pooled using Rubin’s rules. Integrity audits confirmed that the multiple-imputation object contained 50 imputations and that no residual missingness remained in HbA1c or T2DM duration across the completed datasets.

2.7. Statistical Analysis

Baseline characteristics were summarized overall and by incident ACS status. Continuous variables were reported as medians with interquartile ranges, and categorical variables were reported as counts and percentages. LDL-C measurement patterns and unadjusted event rates were summarized descriptively; inferential analyses used adjusted time-to-event models.
The primary analysis used Cox proportional hazards regression with start–stop follow-up intervals to estimate the association between current time-updated LDL-C category and incident ACS [15]. The model included current LDL-C category and was adjusted for age at interval start, male sex, hypertension, CKD, HbA1c, T2DM duration at baseline, and calendar year of baseline LDL-C measurement. Robust standard errors were clustered by patient identifier, and Efron’s method was used for tied event times. Results were reported as hazard ratios (HRs) with 95% confidence intervals (CIs).
Key secondary analyses used the same Cox start–stop framework and adjustment set. The cumulative-burden analysis estimated the HR for ACS per 1 mmol/L-year higher cumulative LDL-C burden above each threshold. The time-in-target analysis estimated the HR for ACS per 10% higher prior follow-up time below each LDL-C target. Secondary analyses were interpreted as supportive longitudinal exposure analyses rather than independent treatment-effect estimates.

2.8. Sensitivity Analyses

Sensitivity analyses evaluated the robustness of the primary time-updated LDL-C category model. First, the primary model was repeated after restricting the cohort to patients with at least three eligible LDL-C measurements. Second, 90-day and 180-day landmark analyses were performed to reduce potential reverse-causation bias from LDL-C measurements obtained close to ACS onset. Third, a complete-case analysis was performed using patients with complete data for all primary covariates. Sensitivity analyses used the same LDL-C category definition, adjustment set, robust patient-level clustering, and tie-handling approach as the primary model.

2.9. Software and Reproducibility

Data preparation, longitudinal interval construction, descriptive tables, and figure generation were performed using Python (3.10.15). Multiple imputation and Cox proportional hazards models were performed using R (version 4.4.2). The analysis pipeline generated patient-level cohort files, start–stop interval files, multiple-imputation audit files, pooled model outputs, publication tables, and journal-ready figures.

3. Results

3.1. Cohort Derivation and Follow-Up

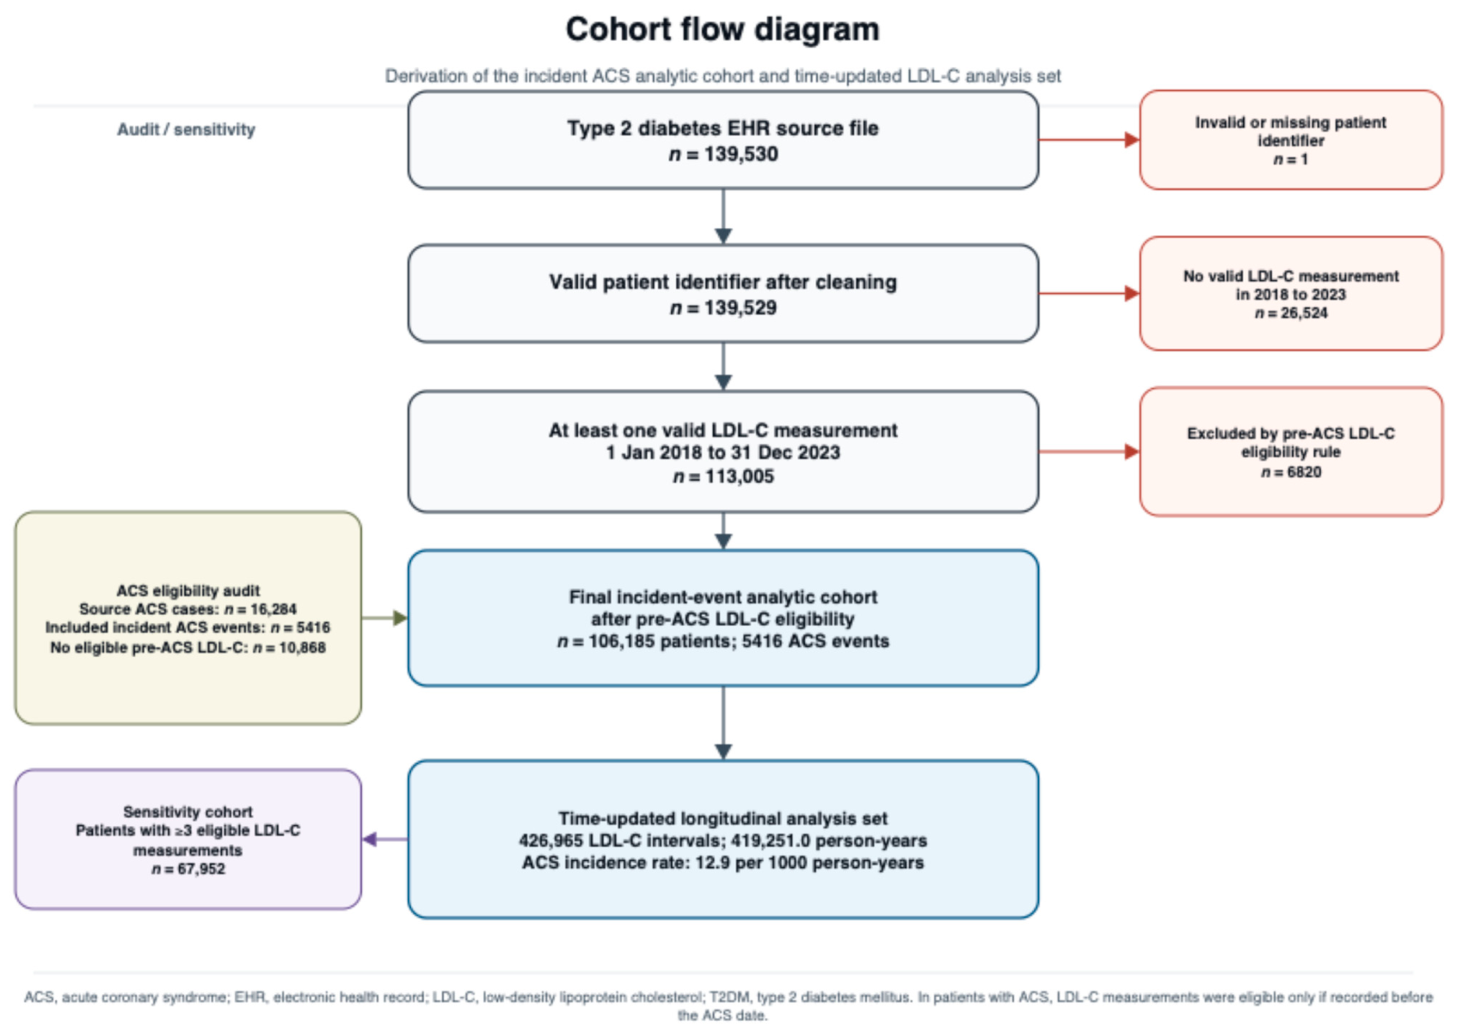
After removal of one record with an invalid patient identifier, the cleaned source population included 139,529 patients with T2DM. Of these, 113,005 had at least one valid LDL-C measurement between 1 January 2018 and 31 December 2023 before application of the pre-ACS eligibility rule. After requiring LDL-C measurements to occur before ACS among patients with ACS, the final analytic cohort included 106,185 patients. Among 16,284 source ACS cases, 5416 had an eligible pre-ACS LDL-C measurement and contributed incident ACS events during follow-up; 10,868 source ACS cases had no eligible pre-ACS LDL-C measurement and were excluded from the incident-event analytic cohort (Figure 1 and Table S1).
During 419,251.0 person-years of follow-up, 5416 incident ACS events occurred, corresponding to an overall incidence rate of 12.9 events per 1000 person-years. Median follow-up was 4.42 years (IQR 2.53–5.51). The longitudinal analysis dataset contained 426,965 time-updated LDL-C intervals across the same 106,185 patients, and 67,952 patients had at least three eligible LDL-C measurements. The final interval-level outcome audit confirmed 5416 interval-level ACS events and no patient with more than one event-coded interval (Table S1).

3.2. Baseline Characteristics

Baseline characteristics are shown in Table 1. The median age at baseline LDL-C was 49.3 years (IQR 41.0–57.9), and 59,178 patients (55.7%) were male. Hypertension was present in 61,123 patients (57.6%), and CKD was present in 7465 patients (7.0%). The median baseline LDL-C was 2.8 mmol/L (IQR 2.2–3.5), and the median number of eligible LDL-C measurements per patient was 4.0 (IQR 2.0–6.0).
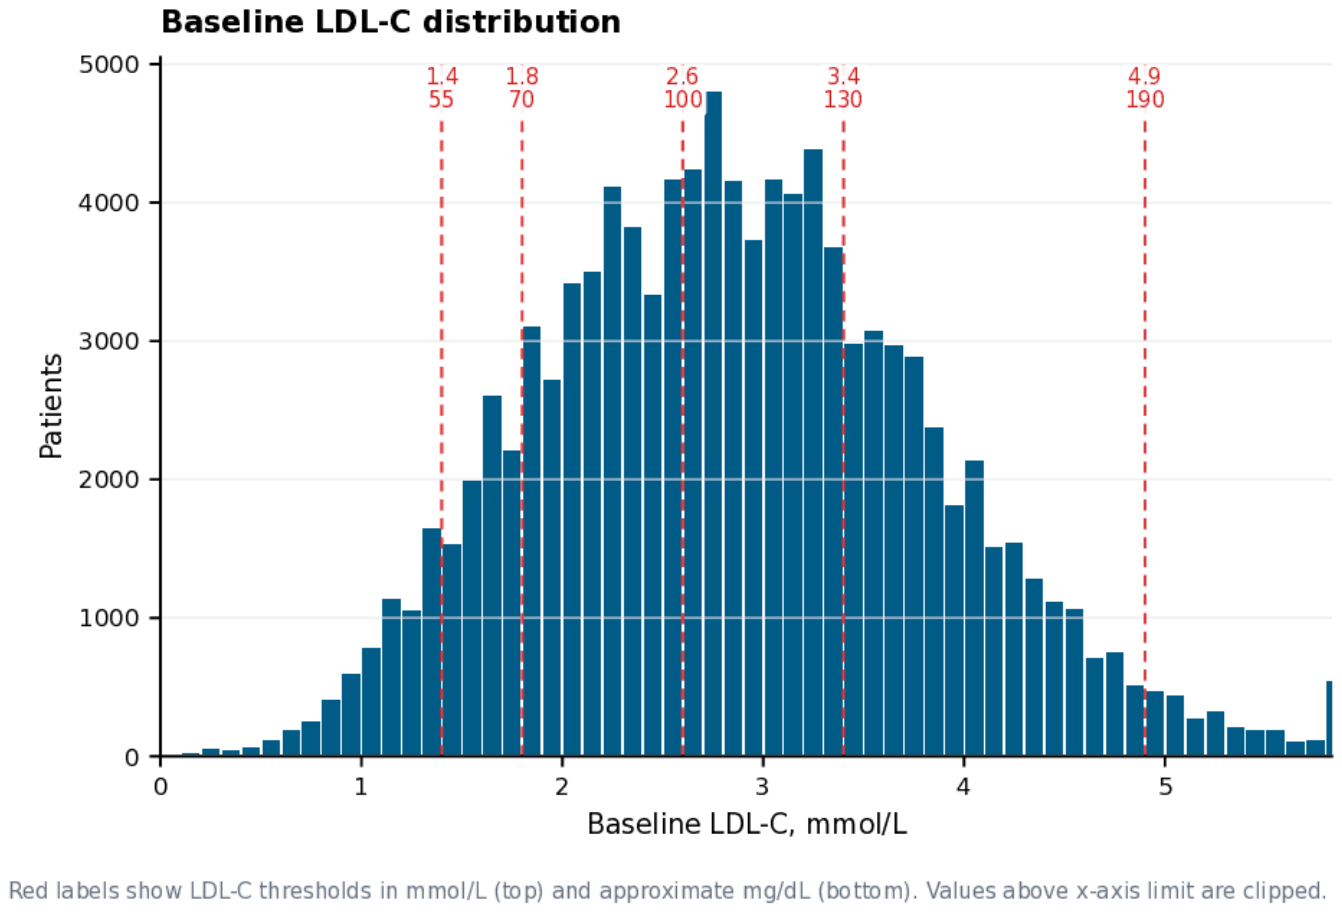
Patients who developed incident ACS were older than those who did not develop ACS, with median ages of 57.1 vs. 48.9 years, respectively. They were also more frequently male (66.3% vs. 55.2%) and had a higher prevalence of hypertension (88.3% vs. 55.9%) and CKD (19.8% vs. 6.3%). Median baseline LDL-C was slightly lower among patients who developed ACS than among those who did not (2.7 vs. 2.8 mmol/L), supporting adjusted longitudinal analyses rather than reliance on baseline unadjusted comparisons (Table 1 and Figure 2).

3.3. Missing Data and Multiple-Imputation Quality Control

The complete primary adjustment covariates were age, sex, hypertension, CKD, and calendar year of baseline LDL-C measurement. HbA1c was missing in 23,215 patients (21.86%), and T2DM duration at baseline was missing in 36,674 patients (34.54%). Complete-case analysis for the primary covariate set would have included 54,105 patients (50.95% of the analytic cohort). Therefore, the primary analyses used multiple imputation by chained equations for HbA1c and T2DM duration (Figure S1).
The MICE audit confirmed that the imputation object contained 50 completed imputations from 50 requested imputations, with 20 iterations. Both imputed variables used predictive mean matching. Across all 50 completed datasets and both imputed target variables, residual missingness after completion was 0. The predictor-matrix audit confirmed that eGFR was excluded as an incomplete non-target predictor and was not part of the primary adjustment set; CKD was retained as the renal-status adjustment variable.

3.4. Time-Updated LDL-C Exposure and Unadjusted Event Rates

Unadjusted interval-level incidence rates by current LDL-C category were not monotonic, consistent with differences in baseline clinical risk across LDL-C strata. Incidence rates per 1000 person-years were <1.4 mmol/L: 16.5; 1.4 to <1.8 mmol/L: 15.7; 1.8 to <2.6 mmol/L: 12.7; 2.6 to <3.4 mmol/L: 10.9; 3.4 to <4.9 mmol/L: 12.8; and ≥4.9 mmol/L: 19.9. The highest unadjusted rate was observed in the current LDL-C ≥4.9 mmol/L category, but low LDL-C categories also had elevated unadjusted rates, likely reflecting older and clinically higher-risk patients.

3.5. Primary Time-Updated Cox Analysis

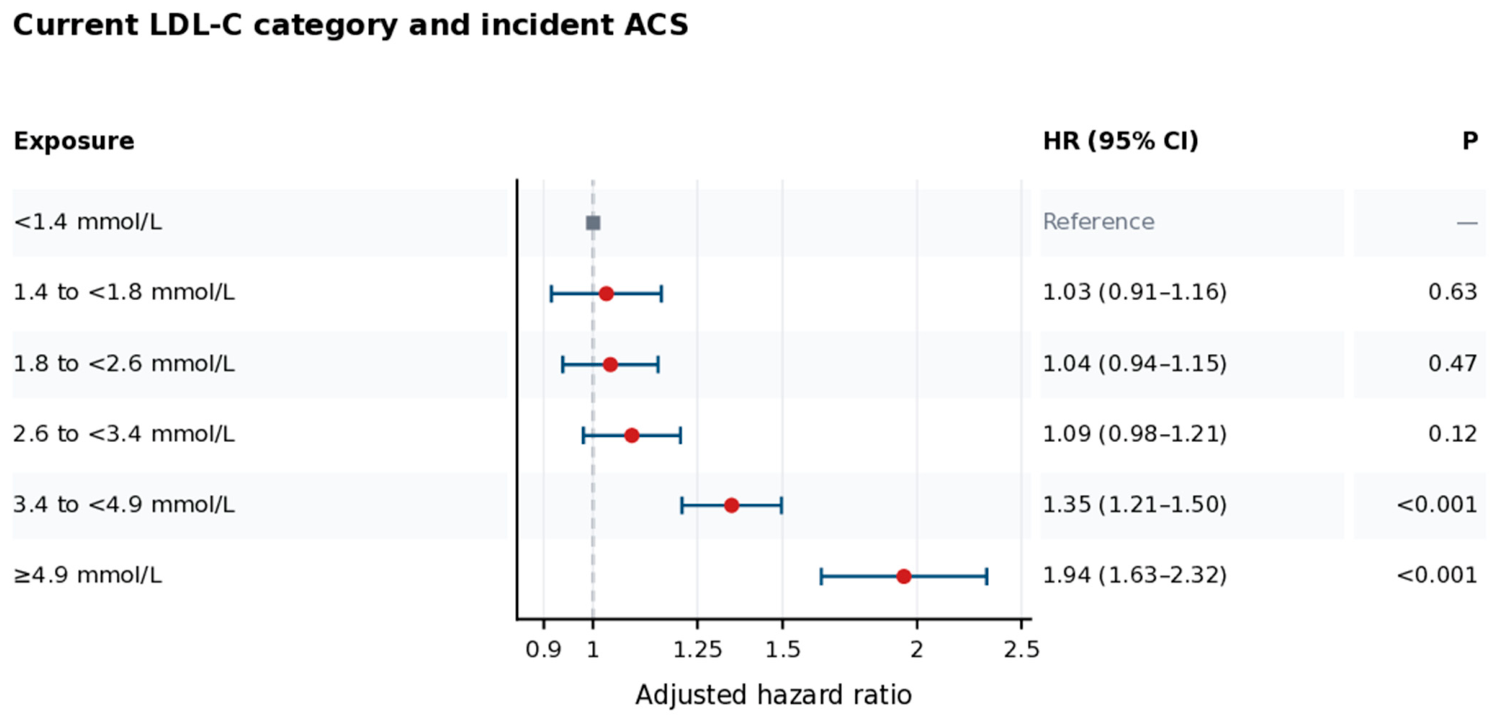
After adjustment, current LDL-C categories below 3.4 mmol/L did not show clear evidence of higher ACS risk compared with LDL-C < 1.4 mmol/L. The adjusted HRs were 1.03 (95% CI 0.91–1.16; p = 0.634) for LDL-C 1.4 to <1.8 mmol/L, 1.04 (95% CI 0.94–1.15; p = 0.474) for LDL-C 1.8 to <2.6 mmol/L, and 1.09 (95% CI 0.98–1.21; p = 0.117) for LDL-C 2.6 to <3.4 mmol/L (Table 2 and Figure 3).
Higher current LDL-C categories were associated with higher ACS risk. Current LDL-C 3.4 to <4.9 mmol/L was associated with a 35% higher adjusted hazard of ACS (HR 1.35, 95% CI 1.21–1.50; p < 0.001), and current LDL-C ≥ 4.9 mmol/L was associated with a 94% higher adjusted hazard (HR 1.94, 95% CI 1.63–2.32; p < 0.001), compared with current LDL-C <1.4 mmol/L (Table 2 and Figure 3).

3.6. Secondary Longitudinal LDL-C Exposure Analyses

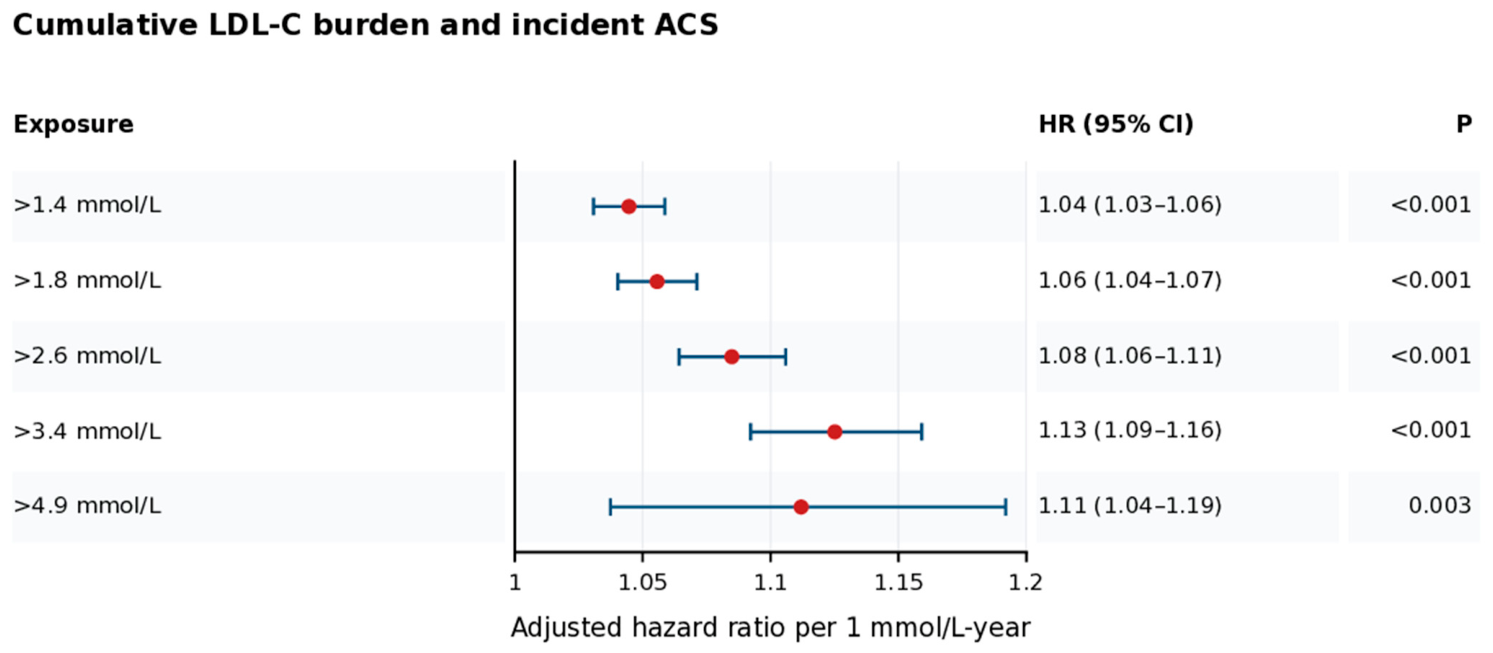
Cumulative LDL-C burden above 1.8 mmol/L had a median interval-level value of 0.79 mmol/L-years (IQR 0.00–2.69) before interval start. In adjusted analyses, each 1 mmol/L-year higher cumulative LDL-C burden was associated with higher ACS risk across all evaluated thresholds: HR 1.04 (95% CI 1.03–1.06) above 1.4 mmol/L, HR 1.06 (95% CI 1.04–1.07) above 1.8 mmol/L, HR 1.08 (95% CI 1.06–1.11) above 2.6 mmol/L, HR 1.13 (95% CI 1.09–1.16) above 3.4 mmol/L, and HR 1.11 (95% CI 1.04–1.19) above 4.9 mmol/L (Table 2 and Figure 4). Because the highest threshold had fewer exposed intervals, threshold-specific estimates should be interpreted as complementary measures of accumulated exposure rather than as a formal monotonic dose–response across thresholds.
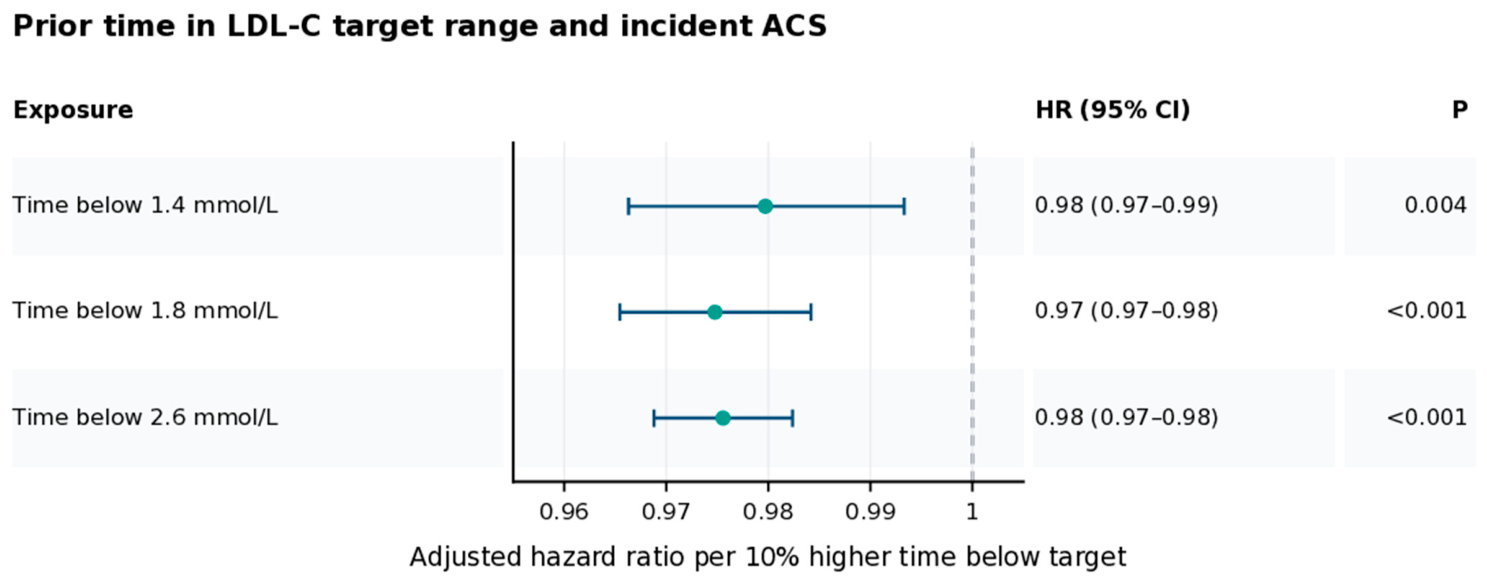
The median prior percentage of follow-up time below LDL-C 1.8 mmol/L at interval start was 0% (IQR 0–0), indicating that many intervals had no previous time below this stringent target. Nevertheless, greater prior time below LDL-C targets was associated with lower ACS risk. For each 10% higher prior time below target, adjusted HRs were 0.98 (95% CI 0.97–0.99; p = 0.004) for <1.4 mmol/L, 0.97 (95% CI 0.97–0.98; p < 0.001) for <1.8 mmol/L, and 0.98 (95% CI 0.97–0.98; p < 0.001) for <2.6 mmol/L (Table 2 and Figure 5).

3.7. Sensitivity Analyses

Sensitivity analyses supported the primary findings (Table 3). Among patients with at least three eligible LDL-C measurements, current LDL-C 3.4 to <4.9 mmol/L and ≥ 4.9 mmol/L remained associated with incident ACS, with adjusted HRs of 1.34 (95% CI 1.14–1.57; p < 0.001) and 1.87 (95% CI 1.39–2.52; p < 0.001), respectively. Landmark analyses excluding early events yielded similar or slightly stronger associations. In the 90-day landmark analysis, the corresponding HRs were 1.40 (95% CI 1.25–1.56; p < 0.001) and 2.03 (95% CI 1.68–2.44; p < 0.001). In the 180-day landmark analysis, the corresponding HRs were 1.40 (95% CI 1.25–1.57; p < 0.001) and 2.01 (95% CI 1.66–2.45; p < 0.001).
The complete-case analysis also remained directionally consistent, with adjusted HRs of 1.35 (95% CI 1.18–1.55; p < 0.001) for current LDL-C 3.4 to <4.9 mmol/L and 1.77 (95% CI 1.39–2.25; p < 0.001) for current LDL-C ≥ 4.9 mmol/L. These sensitivity analyses indicate that the main findings were robust to restriction by LDL-C measurement frequency, landmark exclusion of early ACS events, and complete-case analysis (Table 3).

4. Discussion

In this large longitudinal electronic health-record cohort of patients with T2DM, incident ACS risk was associated with both current and accumulated LDL-C exposure. The primary time-updated analysis showed that current LDL-C 3.4 to <4.9 mmol/L and ≥ 4.9 mmol/L were associated with higher adjusted ACS risk compared with LDL-C < 1.4 mmol/L, whereas intermediate LDL-C categories below 3.4 mmol/L were not clearly different from the reference category after adjustment. The longitudinal exposure analyses strengthened this pattern: cumulative LDL-C burden above prespecified thresholds was consistently associated with higher ACS risk, and greater prior time below LDL-C targets was associated with lower ACS risk.
These findings are clinically important because the unadjusted LDL-C pattern was non-monotonic. Patients who developed ACS were older and had substantially higher prevalence of hypertension and CKD, and their baseline LDL-C was slightly lower than that of patients without ACS. This pattern is plausible in routine care, where lower LDL-C may reflect older age, established comorbidity, treatment exposure, or more intensive monitoring rather than intrinsically lower cardiovascular risk. The time-updated adjusted models therefore provide a more clinically meaningful assessment than a simple baseline LDL-C comparison.
Our findings are consistent with, but distinct from, randomized LDL-C-lowering evidence. The Cholesterol Treatment Trialists’ diabetes meta-analysis showed a 21% proportional reduction in major vascular events per 1 mmol/L LDL-C reduction in people with diabetes, and a large JAMA meta-analysis found that statins and selected non-statin LDL-lowering interventions acting through LDL-receptor pathways produced similar relative reductions per unit of LDL-C lowering [5,6]. Our study was observational and should not be interpreted as estimating treatment effects. Rather, it shows that in real-world T2DM care, patients with greater longitudinal LDL-C exposure have higher incident ACS risk, while those spending more time below LDL-C targets have lower risk.
The results also align with emerging evidence that cumulative lipid exposure matters. A pooled cohort study in JAMA Cardiology found that cumulative LDL-C exposure and time-weighted average LDL-C across young adulthood and middle age were associated with future coronary heart disease even after accounting for midlife LDL-C [10]. More recent work on LDL-C time in target range similarly suggests that the proportion of time spent within LDL-C targets may predict cardiovascular outcomes [11]. Our study extends this concept to a large T2DM cohort with incident ACS as the outcome, using clinically interpretable LDL-C categories, cumulative burden thresholds, and time-below-target metrics.
The guideline context is direct. ADA recommendations for diabetes and recent ACC/AHA dyslipidemia guidance emphasize risk-based LDL-C targets, including <70 mg/dL (<1.8 mmol/L) for many high-risk primary-prevention patients and <55 mg/dL (<1.4 mmol/L) for secondary-prevention or very-high-risk patients [7,8]. The 2023 ESC diabetes guideline similarly uses LDL-C targets linked to cardiovascular risk categories [9]. Our findings do not revise these thresholds; instead, they support the practical principle that sustained time below target and reduced cumulative LDL-C burden may be important complements to a single LDL-C value.
Several strengths support the credibility of this analysis. The cohort was large, follow-up was longitudinal, and LDL-C exposure was restricted to measurements occurring before ACS, preserving temporal ordering. The start–stop Cox structure allowed LDL-C status to change over time, and secondary analyses captured cumulative burden and prior time below target before each risk interval. Multiple imputation was used for clinically relevant incomplete covariates, and sensitivity analyses were directionally consistent after restriction to patients with at least three LDL-C measurements, landmark exclusion of early events, and complete-case analysis. Important limitations should also be acknowledged. ACS was identified from an administrative EHR diagnosis/date field and was not independently adjudicated; component ACS subtypes, diagnostic coding position, and hospital-confirmation details were not available in the extract. Patients with ACS but no eligible pre-ACS LDL-C were excluded, which was necessary for temporal validity but may limit generalizability to patients with less lipid testing before their event.
Residual confounding is possible because observational EHR data do not fully capture smoking, lifestyle, family history, medication adherence, treatment intensity, or non-PHCC care. Medication-use flags were undated; because timing, intensity, adherence, and treatment changes were unavailable, they were not modeled as time-dependent treatment exposures or primary treatment-effect covariates, leaving potential treatment-related confounding. Surveillance and healthcare-utilization bias may also persist, because patients with more frequent LDL-C testing may differ systematically in comorbidity, treatment intensity, healthcare engagement, and baseline cardiovascular risk; the sensitivity analysis restricted to patients with at least three LDL-C measurements reduces but does not eliminate this concern. The LDL-C <1.4 mmol/L reference category should therefore be interpreted cautiously, as some patients in this group may have had higher baseline cardiovascular burden, intensive treatment exposure, or reverse-risk characteristics not fully captured in routine EHR data.
Continuous eGFR could not be included because the available eGFR data appeared top-coded or censored, so CKD was used as the renal-status covariate. Duration of T2DM depended on the recorded diagnosis date and may not represent the true biological onset of diabetes. HbA1c and T2DM duration were multiply imputed under a missing-at-random assumption conditional on observed predictors in the imputation model; although imputation audits and complete-case analyses were reassuring, missingness, particularly for T2DM duration, remains a potential source of uncertainty. Overall, these findings support a shift from viewing LDL-C control as a single laboratory value toward viewing it as a longitudinal exposure in patients with T2DM. At the health-system level, cumulative LDL-C burden and time below target may be useful quality-improvement metrics for identifying patients with sustained residual coronary risk.


5. Conclusions

In this large longitudinal cohort of patients with T2DM, very high current LDL-C was associated with incident ACS, and longitudinal LDL-C exposure metrics provided additional clinically relevant information. Higher cumulative LDL-C burden was associated with higher ACS risk, while greater prior time below LDL-C targets was associated with lower risk. These findings support sustained, target-oriented LDL-C management in T2DM and suggest that cumulative burden and time-below-target metrics may complement single LDL-C measurements in cardiovascular risk assessment.

Supplementary Materials

The following supporting information can be downloaded at: https://www.mdpi.com/article/10.3390/cardiovascmed29020018/s1, Figure S1, primary covariate missingness and multiple-imputation handling; Table S1, cohort derivation and eligibility counts.

Author Contributions

Conceptualization: A.S. and A.K.; methodology: A.K.; formal analysis: A.K.; data curation: A.S. and A.K.; writing—original draft preparation: A.S. and A.K.; writing—review and editing: A.S., A.K., Z.M. and A.A.A.; critical intellectual revision of the manuscript, including methodology and interpretation of results: Z.M. and A.A.A.; supervision: A.S. All authors have read and agreed to the published version of the manuscript.

Funding

The study was funded by the Primary Health Care Corporation, Doha, Qatar, grant number BUHOOTH-D-23-00049R5.

Institutional Review Board Statement

The study was approved by the Primary Health Care Corporation Institutional Review Board under exempt review (Reference No.: BUHOOTH-D-23-00049).

Informed Consent Statement

Patient consent was waived because the study used de-identified routinely collected data.

Data Availability Statement

The dataset used in this study is not publicly available due to institutional and regulatory restrictions. De-identified data may be available from the corresponding author on reasonable request and with Primary Health Care Corporation approval.

Use of Artificial Intelligence

Generative AI (ChatGPT 5.0, OpenAI) was used to assist with language editing, grammar correction, and improving clarity and overall readability of the manuscript. It was also used to support literature exploration and help refine the relevance and structure of the study. All scientific content, data analysis, interpretations, and final decisions were independently developed, verified, and approved by the authors.

Acknowledgments

The authors acknowledge the Research Department and the Business Health Intelligence at the Primary Health Care Corporation, Qatar.

Conflicts of Interest

Author Alan Saeed and author Anas Kalfah was employed by Primary Health Care Corporation; Author Aisha Al Adab was employed by Hamad Medical Corporation. The remaining authors declare that the research was conducted in the absence of any commercial or financial relationships that could be construed as a potential conflict of interest.

References

  1. International Diabetes Federation. IDF Diabetes Atlas, 11th ed.; International Diabetes Federation: Brussels, Belgium, 2025. [Google Scholar]
  2. Syed, M.A.; Alnuaimi, A.S.; Zainel, A.J.; A/Qotba, H.A. Prevalence of non-communicable diseases by age, gender and nationality in publicly funded primary care settings in Qatar. BMJ Nutr. Prev. Health 2019, 2, 20–29. [Google Scholar] [CrossRef] [PubMed]
  3. Al-Kuwari, M.G.; Al-Abdulla, S.A.; Abdulla, M.Y.; Bakri, A.H.; Mohammed, A.M.; Kandy, M.C.; Patterson, A.; Krishnan, J.I. Epidemiological health assessment in primary healthcare in the State of Qatar-2019. Qatar Med. J. 2021, 2021, 57. [Google Scholar] [CrossRef] [PubMed]
  4. Ference, B.A.; Ginsberg, H.N.; Graham, I.; Ray, K.K.; Packard, C.J.; Bruckert, E.; Hegele, R.A.; Krauss, R.M.; Raal, F.J.; Schunkert, H.; et al. Low-density lipoproteins cause atherosclerotic cardiovascular disease. 1. Evidence from genetic, epidemiologic, and clinical studies. Eur. Heart J. 2017, 38, 2459–2472. [Google Scholar] [CrossRef] [PubMed]
  5. Cholesterol Treatment Trialists’ Collaboration. Efficacy of cholesterol-lowering therapy in 18,686 people with diabetes in 14 randomised trials of statins: A meta-analysis. Lancet 2008, 371, 117–125. [Google Scholar] [CrossRef] [PubMed]
  6. Silverman, M.G.; Ference, B.A.; Im, K.; Wiviott, S.D.; Giugliano, R.P.; Grundy, S.M.; Braunwald, E.; Sabatine, M.S. Association between lowering LDL-C and cardiovascular risk reduction among different therapeutic interventions: A systematic review and meta-analysis. JAMA 2016, 316, 1289–1297. [Google Scholar] [CrossRef] [PubMed]
  7. American Diabetes Association Professional Practice Committee for Diabetes. 10. Cardiovascular Disease and Risk Management: Standards of Care in Diabetes-2026. Diabetes Care 2026, 49, S216–S245. [Google Scholar] [CrossRef] [PubMed]
  8. Blumenthal, R.S.; Morris, P.B.; Gaudino, M.; Johnson, H.M.; Anderson, T.S.; Bittner, V.A.; Blankstein, R.; Brewer, L.C.; Cho, L.; de Ferranti, S.D.; et al. 2026 ACC/AHA/AACVPR/ABC/ACPM/ADA/AGS/APhA/ASPC/NLA/PCNA guideline on the management of dyslipidemia: A report of the American College of Cardiology/American Heart Association Joint Committee on Clinical Practice Guidelines. J. Am. Coll. Cardiol. 2026. [Google Scholar] [CrossRef] [PubMed]
  9. Marx, N.; Federici, M.; Schütt, K.; Müller-Wieland, D.; Ajjan, R.A.; Antunes, M.J.; Christodorescu, R.M.; Crawford, C.; Di Angelantonio, E.; Eliasson, B.; et al. 2023 ESC Guidelines for the management of cardiovascular disease in patients with diabetes. Eur. Heart J. 2023, 44, 4043–4140. [Google Scholar] [CrossRef] [PubMed]
  10. Zhang, Y.; Pletcher, M.J.; Vittinghoff, E.; Clemons, A.M.; Jacobs, D.R., Jr.; Allen, N.B.; Alonso, A.; Bellows, B.K.; Oelsner, E.C.; Zeki Al Hazzouri, A.; et al. Association between cumulative low-density lipoprotein cholesterol exposure during young adulthood and middle age and risk of cardiovascular events. JAMA Cardiol. 2021, 6, 1406–1413. [Google Scholar] [CrossRef] [PubMed]
  11. Huang, J.; Yu, Z.; Wu, Y.; Chen, C.; Chen, Z.; Zhao, J.; He, J.; Dong, Y.; Li, B.; Liu, C.; et al. Low-density lipoprotein cholesterol time in target range and clinical outcomes in the general population. JACC Adv. 2025, 4, 102184. [Google Scholar] [CrossRef] [PubMed]
  12. von Elm, E.; Altman, D.G.; Egger, M.; Pocock, S.J.; Goetzsche, P.C.; Vandenbroucke, J.P.; STROBE Initiative. The Strengthening the Reporting of Observational Studies in Epidemiology (STROBE) statement: Guidelines for reporting observational studies. PLoS Med. 2007, 4, e296. [Google Scholar] [CrossRef] [PubMed]
  13. van Buuren, S.; Groothuis-Oudshoorn, K. mice: Multivariate imputation by chained equations in R. J. Stat. Softw. 2011, 45, 1–67. [Google Scholar] [CrossRef]
  14. Rubin, D.B. Multiple Imputation for Nonresponse in Surveys; Wiley: New York, NY, USA, 1987. [Google Scholar]
  15. Therneau, T.M.; Grambsch, P.M. Modeling Survival Data: Extending the Cox Model; Springer: New York, NY, USA, 2000. [Google Scholar]
Figure 1. Cohort flow diagram.
Cardiovascmed 29 00018 g001
Figure 2. Baseline LDL-C distribution in the final analytic cohort.
Cardiovascmed 29 00018 g002
Figure 3. Adjusted primary time-updated Cox model for current LDL-C category. The grey square indicates the reference category, LDL-C < 1.4 mmol/L, with hazard ratio fixed at 1.0.
Cardiovascmed 29 00018 g003
Figure 4. Adjusted cumulative LDL-C burden models.
Cardiovascmed 29 00018 g004
Figure 5. Adjusted prior time below LDL-C target models.
Cardiovascmed 29 00018 g005
Table 1. Baseline characteristics of the analytic cohort by incident ACS status.
CharacteristicOverallNo incident ACSIncident ACS
Patients, n106,185100,7695416
Age at baseline LDL-C, years49.3 (41.0–57.9)48.9 (40.7–57.4)57.1 (49.0–64.9)
Male sex59,178 (55.7%)55,586 (55.2%)3592 (66.3%)
Hypertension61,123 (57.6%)56,342 (55.9%)4781 (88.3%)
Chronic kidney disease7465 (7.0%)6395 (6.3%)1070 (19.8%)
Baseline LDL-C, mmol/L2.8 (2.2–3.5)2.8 (2.2–3.5)2.7 (2.0–3.5)
Eligible LDL-C measurements, n4.0 (2.0–6.0)4.0 (2.0–6.0)2.0 (1.0–4.0)
HbA1c, %6.9 (6.1–8.6)6.9 (6.1–8.6)7.2 (6.2–8.8)
T2DM duration at baseline, years1.7 (0.7–2.7)1.7 (0.6–2.7)1.8 (1.3–2.6)
Values are n (%) or median (IQR). HbA1c and T2DM duration are shown as observed baseline values; these variables were multiply imputed for adjusted Cox models. ACS, acute coronary syndrome; LDL-C, low-density lipoprotein cholesterol; T2DM, type 2 diabetes mellitus.
Table 2. Adjusted associations of longitudinal LDL-C exposure metrics with incident ACS.
MetricExposure ContrastAdjusted HR (95% CI)p Value
Current LDL-C categoryCurrent LDL-C 1.4 to <1.8 vs. <1.4 mmol/L1.03 (0.91–1.16)0.63
Current LDL-C categoryCurrent LDL-C 1.8 to <2.6 vs. <1.4 mmol/L1.04 (0.94–1.15)0.47
Current LDL-C categoryCurrent LDL-C 2.6 to <3.4 vs. <1.4 mmol/L1.09 (0.98–1.21)0.12
Current LDL-C categoryCurrent LDL-C 3.4 to <4.9 vs. <1.4 mmol/L1.35 (1.21–1.50)<0.001
Current LDL-C categoryCurrent LDL-C ≥ 4.9 vs. <1.4 mmol/L1.94 (1.63–2.32)<0.001
Cumulative LDL-C burdenBurden above 1.4 mmol/L per 1 mmol/L-year1.04 (1.03–1.06)<0.001
Cumulative LDL-C burdenBurden above 1.8 mmol/L per 1 mmol/L-year1.06 (1.04–1.07)<0.001
Cumulative LDL-C burdenBurden above 2.6 mmol/L per 1 mmol/L-year1.08 (1.06–1.11)<0.001
Cumulative LDL-C burdenBurden above 3.4 mmol/L per 1 mmol/L-year1.13 (1.09–1.16)<0.001
Cumulative LDL-C burdenBurden above 4.9 mmol/L per 1 mmol/L-year1.11 (1.04–1.19)0.003
Prior time below targetTime below 1.4 mmol/L per 10% higher time0.98 (0.97–0.99)0.004
Prior time below targetTime below 1.8 mmol/L per 10% higher time0.97 (0.97–0.98)<0.001
Prior time below targetTime below 2.6 mmol/L per 10% higher time0.98 (0.97–0.98)<0.001
Hazard ratios are adjusted for age at interval start, sex, hypertension, chronic kidney disease, HbA1c, T2DM duration at baseline, and calendar year of baseline LDL-C measurement. Estimates were pooled across 50 multiply imputed datasets. ACS, acute coronary syndrome; CI, confidence interval; HR, hazard ratio; LDL-C, low-density lipoprotein cholesterol.
Table 3. Sensitivity analyses for the primary time-updated LDL-C category model.
Sensitivity AnalysisLDL-C ContrastAdjusted HR (95% CI)p ValueImputations Pooled
≥3 LDL-C tests3.4 to <4.9 vs. <1.4 mmol/L1.34 (1.14–1.57)<0.00150
≥3 LDL-C tests≥4.9 vs. <1.4 mmol/L1.87 (1.39–2.52)<0.00150
90-day landmark3.4 to <4.9 vs. <1.4 mmol/L1.40 (1.25–1.56)<0.00150
90-day landmark≥ 4.9 vs. <1.4 mmol/L2.03 (1.68–2.44)<0.00150
180-day landmark3.4 to <4.9 vs. <1.4 mmol/L1.40 (1.25–1.57)<0.00150
180-day landmark≥4.9 vs. <1.4 mmol/L2.01 (1.66–2.45)<0.00150
Complete case3.4 to <4.9 vs. <1.4 mmol/L1.35 (1.18–1.55)<0.001Not imputed
Complete case≥4.9 vs. <1.4 mmol/L1.77 (1.39–2.25)<0.001Not imputed
The reference category for all contrasts is current LDL-C <1.4 mmol/L. Estimates for the first three sensitivity analyses were pooled across 50 multiply imputed datasets. The complete-case analysis was not multiplied imputed. ACS, acute coronary syndrome; CI, confidence interval; HR, hazard ratio; LDL-C, low-density lipoprotein cholesterol.
Disclaimer/Publisher’s Note: The statements, opinions and data contained in all publications are solely those of the individual author(s) and contributor(s) and not of MDPI and/or the editor(s). MDPI and/or the editor(s) disclaim responsibility for any injury to people or property resulting from any ideas, methods, instructions or products referred to in the content.