Article

External Validation and Performance of an Artificial Intelligence-Based Quantitative Coronary Angiography Software in a European Cohort


1
Medipixel, Inc., Seoul 06174, Republic of Korea
2
Andreas Grüntzig Clinical Research Centre and Core Laboratory, University Hospital Zurich, 8091 Zurich, Switzerland
3
Department of Cardiology, University Hospital Zurich, 8091 Zurich, Switzerland
4
Faculty of Medicine, University of Zurich, 8091 Zurich, Switzerland
*
Author to whom correspondence should be addressed.
Cardiovasc. Med. 2026, 29(1), 10; https://doi.org/10.3390/cardiovascmed29010010
Submission received: 23 December 2025 / Revised: 29 January 2026 / Accepted: 16 February 2026 / Published: 20 February 2026

Abstract

Artificial intelligence-based quantitative coronary angiography (AI-QCA) has recently emerged as a promising tool for real-time lesion assessment in cardiology. We aimed to validate a novel AI-QCA software, trained on a Korean dataset, in a European cohort. We analyzed 556 lesions from 252 subjects in two European datasets. The AI-QCA system performed automated vessel segmentation and measurements of minimum lumen diameter, proximal and distal reference diameters, percent diameter stenosis (%DS) and lesion length. The performance of AI-QCA was assessed using both automated and manual frame selection methods, with all measurements validated against expert manual QCA. AI-QCA achieved a lesion detection rate of 86.2% in automated frame selection. AI-QCA and manual QCA showed strong agreement (Pearson’s r > 0.90, R2 > 0.8 for all QCA measurements). For %DS categorization (<50%, 50% to <70%, and ≥70%), 433 lesions were classified into the same category by both methods, with a weighted κ of 0.832 (95% CI, 0.743–0.922). Vessel segmentation achieved a mean DSC of 0.953. This study validated the performance of AI-QCA using a European dataset and demonstrated high lesion detection rate and its strong agreement with manual QCA, which supports its applicability for real-time clinical decision-making during percutaneous coronary intervention.

1. Introduction

Coronary angiography (CAG) remains the gold standard for assessing coronary artery disease (CAD) in clinical settings. For decades, the decision to perform percutaneous coronary intervention (PCI) has relied primarily on the operator’s visual estimation of stenosis severity. However, numerous studies have reported significant inter- and intra-observer variability in visual estimation [1,2]. This variability may lead to suboptimal revascularization decisions, as visual estimation tends to overestimate lesion severity, potentially resulting in unnecessary interventions [2,3,4]. To address these limitations, quantitative coronary angiography (QCA) was introduced as a computer-assisted method to provide objective and reproducible measurements of coronary lesions [5,6]. Manual QCA demonstrates good reproducibility, with inter-core laboratory precision typically ranging from 0.2 to 0.3 mm for minimal lumen diameter measurements [7,8,9]. Although QCA has improved the standardization of lesion assessment, its use remains largely confined to research settings due to its labor-intensive and time-consuming nature, limiting its feasibility for real-time application in catheterization laboratories.
Recent advances in deep learning technology have revolutionized medical image analysis [10], demonstrating efficacy in automated segmentation, feature extraction, and classification modeling. In the field of interventional cardiology, various architectural innovations have been developed to address the unique challenges of coronary angiography analysis. For instance, recent studies have introduced multi-instance learning with attention mechanisms [11] and spatial-temporal transformer networks for stenosis detection [12]. Other advancements include multi-task learning frameworks that optimize vessel segmentation with centerline detection [13] and subpixel-level segmentation frameworks [14]. However, domain shift remains a fundamental challenge. This phenomenon leads to performance degradation when models encounter images from different clinical settings with varying acquisition protocols and equipment. To mitigate this, federated learning frameworks have emerged as an effective solution, allowing institutions to share model weights while retaining data locally [15], with histogram matching serving as a privacy-preserving strategy to harmonize image appearance across sites.
Despite these technological advances, practical clinical implementation remains challenging. In this context, artificial intelligence-based quantitative coronary angiography (AI-QCA) has emerged as a promising tool for integrating real-time quantitative analysis into routine clinical workflows. Several studies have suggested that AI-QCA can accurately detect coronary lesions and provide precise quantitative assessments [16,17,18]. However, the performance of artificial intelligence-based medical devices may be influenced by selection bias [19], as it largely depends on the characteristics of the original training dataset. To ensure the robustness of these devices, external validation using multicenter or multinational datasets is essential [20], particularly given documented inter-ethnic differences in coronary vessel diameter and plaque composition between Asian and European populations [21,22]. Additionally, while numerous studies have investigated the performance of AI-QCA, most have evaluated quantification based on the manually selected optimal frame [16,17,18,23]. Considering real-world clinical feasibility, it is necessary to assess whether AI-QCA can produce consistent and reliable results even when the system does not select the optimal frame.
The aim of the present study was to evaluate the performance of an AI-QCA software (MPXA-2000 Version 1.1.0, Medipixel, Inc., Seoul, Republic of Korea) trained on an Asian population in a European dataset, assessing its generalizability across different populations.

2. Materials and Methods

2.1. Study Design and Study Population

This study is a retrospective, post hoc analysis of prospectively collected data from the MULTISTARS AMI study and the USZ General Consent database. The MULTISTARS AMI trial was an investigator-initiated, multinational, randomized, open-label trial conducted across 37 sites in Europe, which evaluated immediate versus staged multivessel PCI strategies in hemodynamically stable patients with STEMI and multivessel coronary artery disease. The USZ General Consent database comprises consecutive patients who consented to research use of their clinical data at USZ. The study population comprised 115 subjects from MULTISTARS AMI and 200 subjects from the USZ General Consent database. This study was conducted in accordance with ethical guidelines of the Declaration of Helsinki and was approved by the ethics committee of the Canton of Zürich (BASEC-ID: 2024-00587). Informed consent was obtained from all subjects, either through the General Consent USZ (Version 4, dated 1 December 2023) or the MULTISTARS AMI trial consent (BASEC-ID: 2016-01026, Version 5, dated 30 June 2021).
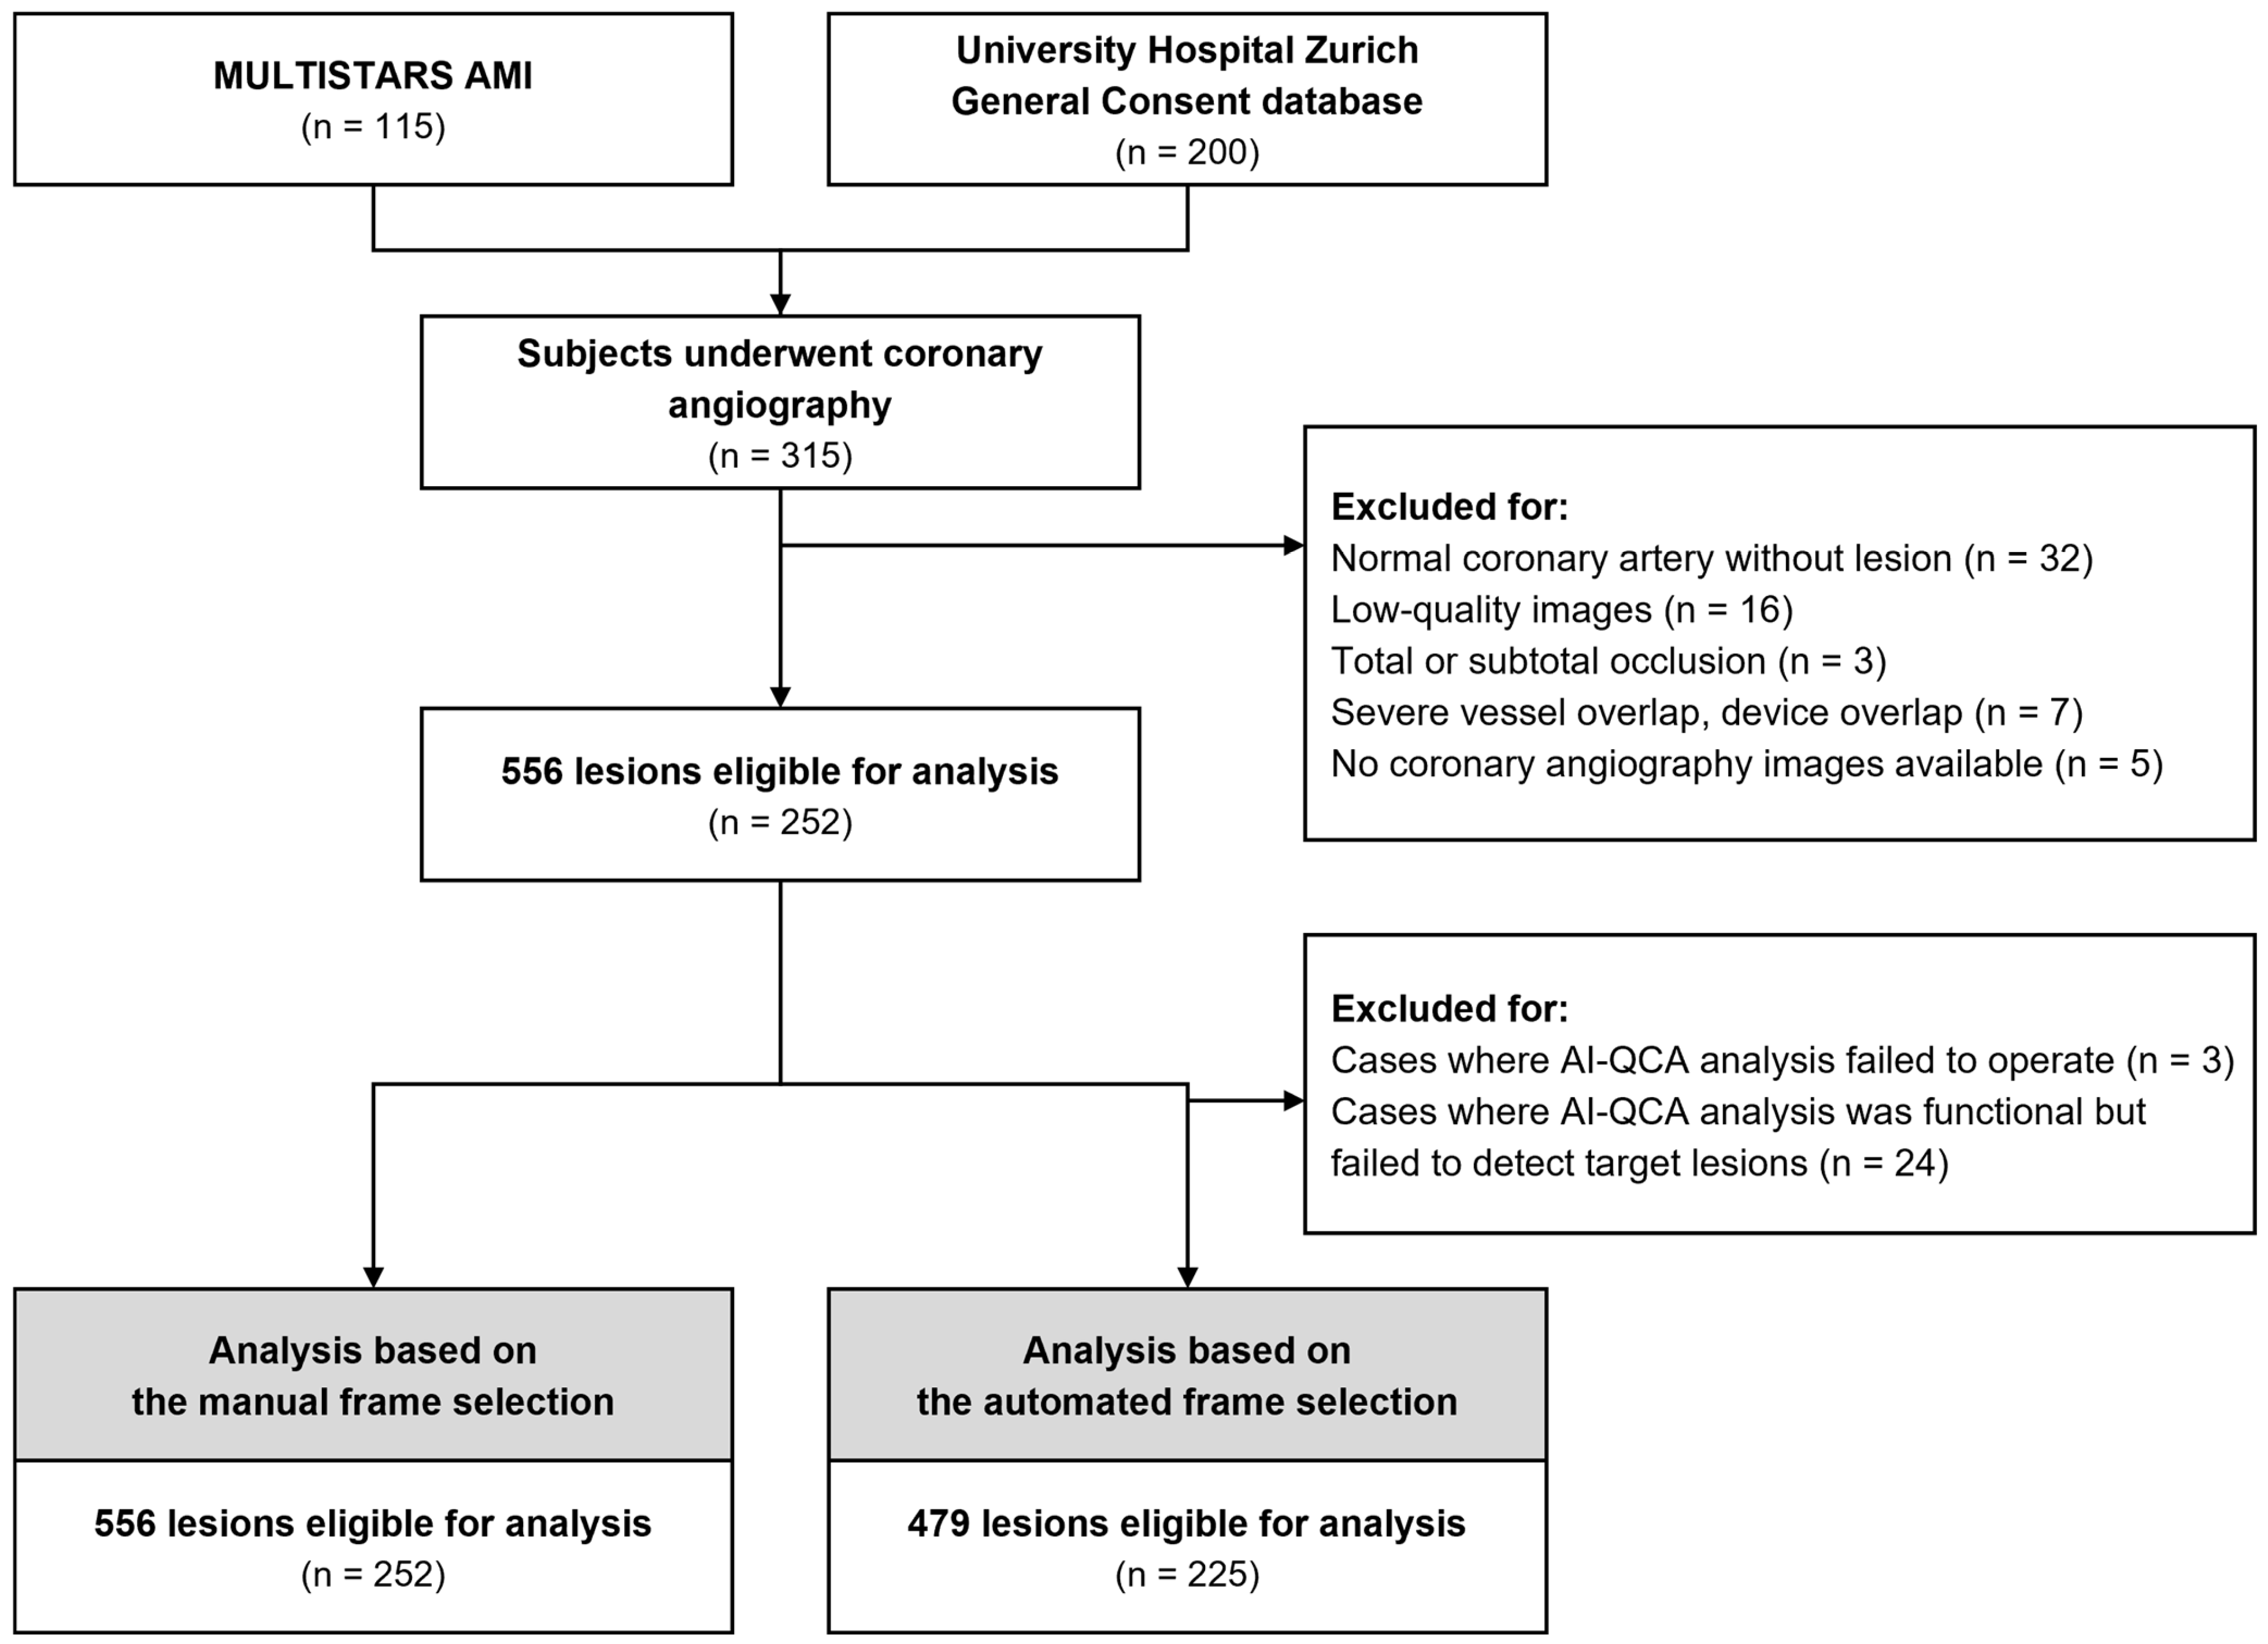
Subjects who underwent CAG with at least one lesion in a major vessel, including right coronary artery (RCA), left anterior descending (LAD), left circumflex (LCX), or left main (LM), or its big side branches were included. From an initial screening of 315 patients, 63 (20%) were excluded. 37 (11.7%) had no analyzable lesions (normal coronary artery without lesion, n = 32; no coronary angiography available, n = 5), and 26 (8.3%) were excluded based on predefined criteria: low-quality images with inadequate contrast (n = 16, 5.1%), total or subtotal occlusion (n = 3, 1.0%), and severe vessel overlap or device overlap (n = 7, 2.2%). After patient eligibility assessment, all coronary angiographic data were collected and de-identified by the Andreas Grüntzig Coronary Angiography and Physiology Core Laboratory before being transferred to Medipixel, Inc. for annotation.

2.2. Annotation and Manual QCA Process

Ground truth annotations were generated using CAAS workstation 8.2.4 (Pie Medical Imaging, Maastricht, The Netherlands). For each case, annotators selected the angiographic projection that best demonstrated the target lesion while minimizing foreshortening and vessel overlap. Unlike previous studies that typically used end-diastolic frames appropriate for lesion visualization [3,17,18], frames were selected based on optimal contrast clarity and suitability for manual contour delineation from a QCA perspective. This approach reflects the practical limitation that end-diastolic frames are not always available or optimal due to vessel overlap or insufficient contrast opacification [24,25]. Because QCA accuracy critically depends on clear vessel boundaries, we prioritized image quality over strict cardiac phase adherence to ensure that AI-QCA is evaluated against reliable manual measurements. Each angiographic image was categorized based on the target vessel (RCA, LAD, LCX, or LM) that was intended to visualize or target for intervention.
All coronary arteries with a diameter of at least 1.5 mm were visually identified and labeled at a pixel-by-pixel level, followed by manual refinement of vessel contours. The proximal and distal ends of lesions were adjusted as needed. QCA measurements, including minimum lumen diameter (MLD), reference diameter (RD), proximal reference diameter (PRD), distal reference diameter (DRD), percent diameter stenosis (%DS), and lesion length (LL), were calculated based on annotated vessel contours and lesion boundaries. In this study, lesions are defined as segments with a %DS ≥ 30%.
Annotations were conducted by trained professionals (Soyeon Kim and Soohyun Kim), including radiologic technicians registered with the Ministry of Health and Welfare. Initial measurements and labeling were performed by a first annotator, followed by independent cross-referencing and verification by a second annotator. In cases of discrepancies, all annotators convened to resolve the disagreements through consensus. The completed annotations underwent a final quality assurance review by board-certified interventional cardiologists to ensure clinical accuracy and consistency.

2.3. Artificial Intelligence-Based QCA

AI-QCA was conducted using the MPXA-2000 Version 1.1.0 (Medipixel, Inc., Seoul, Republic of Korea). This software was trained on a dataset of 7658 coronary angiographic images from 3129 patients who underwent X-ray coronary angiography at Asan Medical Center (AMC) and Chungnam National University Hospital (CNUH) from February 2016 to November 2016 [17,18,26]. The training dataset consisted of patients with a mean age of 63.5 ± 10.9 years at AMC and 68.0 ± 11.3 years at CNUH (28.8% female overall). Vessel distribution included the RCA (33.6%), LAD (32.1%), and LCX (34.2%). Coronary angiograms were acquired via femoral or radial routes using standard catheters and digitally recorded in DICOM format. The software employs advanced deep learning models and computer vision algorithms to analyze angiographic images, providing real-time QCA.
A frame selection algorithm in AI-QCA operates through a three-stage process: first, a convolutional neural network coupled with gated recurrent unit architecture identifies candidate frames from the angiographic sequence. The CNN component utilizes EfficientNet-B0 architecture without modifications, initialized with pre-trained weights from timm library with all layers trainable. The GRU module, trained from scratch, consists of 2 layers with 64 hidden units processing sequences of 20 frames with 64-dimensional features. The model was trained on 1137 angiographic images from 612 patients. Model training employed the same hyperparameters and data augmentation strategies as the previous study [26]. Second, the identified candidates are filtered based on mask size criteria, retaining only frames where the vessel mask size exceeds both the mean value and a predefined threshold value. Third, from the filtered dataset, the single frame with the highest prediction score is selected, where the prediction score represents the probability of frame suitability based on a binary classification model. Following optimal frame selection, AI-QCA automatically classifies the target vessel of coronary images, and performs vessel segmentation. Detected vessel contours are analyzed to generate QCA measurements in the region of interest, including MLD, RD, PRD, DRD, %DS and LL.
Whenever AI-QCA’s automatically selected frame differed from the annotator-selected optimal frame, additional analyses were conducted using the annotator-selected frame to allow for performance evaluation on the same frame. To mitigate potential bias, AI-QCA analysis was conducted by independent technicians who were blinded to the annotations. Except for this frame selection process, all AI-QCA procedures were completed without human intervention.

2.4. Statistical Analysis

Continuous variables were presented as mean and standard deviation. Categorical variables were summarized as frequencies and percentages. For manual frame selection, if the MLD location determined by manual QCA was within the lesion identified by AI-QCA, the lesion was considered ‘detected’. Conversely, if the MLD location fell outside the identified lesion, it was classified as ‘undetected’. For automated frame selection, if the frames used in manual QCA and AI-QCA were different, trained professionals who performed the annotation determined whether the same lesion was analyzed. Lesion detection rate was calculated as the ratio of detected lesions count to the total number of lesions. Among lesions classified as ‘detected’, quantitative agreement between AI-QCA and manual QCA measurements was assessed using Passing–Bablok regression analysis. Bias and limits of agreement between the two methods were evaluated using Bland–Altman plots. %DS measurements were categorized into three groups using the following thresholds: <50%, 50% to <70%, and ≥70%, in accordance with established clinical practice guidelines for coronary stenosis management [27]. Categorical agreement between AI-QCA and manual QCA was assessed using Cohen’s weighted kappa (κ) statistic, which measures interrater reliability for categorical data. Quadratic weights were applied to the kappa calculation to impose stricter penalties for larger disagreements compared to adjacent category disagreements.
Vessel classification accuracy was calculated as the ratio of correct assessments (either RCA, LAD, LCX, or LM) to the total number of assessments. The Dice similarity coefficient (DSC), also referred to as the F1-score, was employed as an evaluation metric for segmentation performance. DSC was calculated as 2|A∩B|/(|A| + |B|), where A represents the coronary artery areas automatically segmented by AI-QCA and B represents the ground truth manually annotated by trained professionals. The coefficient was computed on a pixel-wise basis for each target vessel segment individually. All analyses were conducted using both automated frame selection and manual frame selection. However, calculating the DSC from different frames was deemed infeasible and therefore not performed. A p-value of <0.05 was considered statistically significant. Statistical analyses were conducted using R software (version 4.4.2, R Foundation for Statistical Computing, Vienna, Austria).

3. Results

3.1. Baseline Characteristics

Among 315 screened subjects, 252 subjects with 429 vessels were eligible for analysis (Figure 1). Of the 429 eligible vessels, 329 contained single lesions, 76 had two lesions, 21 had three lesions, and 3 had four lesions, resulting in a total of 556 lesions for efficacy evaluation.
The study population consisted of 252 patients, with 112 patients in the MULTISTARS AMI group and 140 patients in the USZ General Consent group (Table 1). The majority of patients were Caucasian in both groups (109 of 112 patients, 97.3% vs. 135 of 140 patients, 96.4%; p = 0.968), with only 3 patients (2.7%) and 5 patients (3.6%) being non-Caucasian in each group, respectively. Female patients comprised the majority in both groups (92 of 112 patients, 82.1% vs. 115 of 140 patients, 82.1%; p = 1.000). Mean age and body mass index were similar between the two groups (63.5 ± 12.1 vs. 65.6 ± 12.5 years, p = 0.179; 27.6 ± 5.0 vs. 28.1 ± 5.3 kg/m2, p = 0.399). The mean %DS and LL of analyzed lesions were 44.8 ± 12.1% and 20.8 ± 12.1 mm, respectively.
Among the analyzed lesions, 175 lesions (31.5%) were located in RCA, 172 (30.9%) in LAD, 179 (32.2%) in LCX, and 30 (5.4%) in LM (Table A1). All angiography images were primarily acquired at 15 fps (92%), with other acquisitions at 25 fps and 7.5 fps.

3.2. Evaluation Based on the Automated Frame Selection

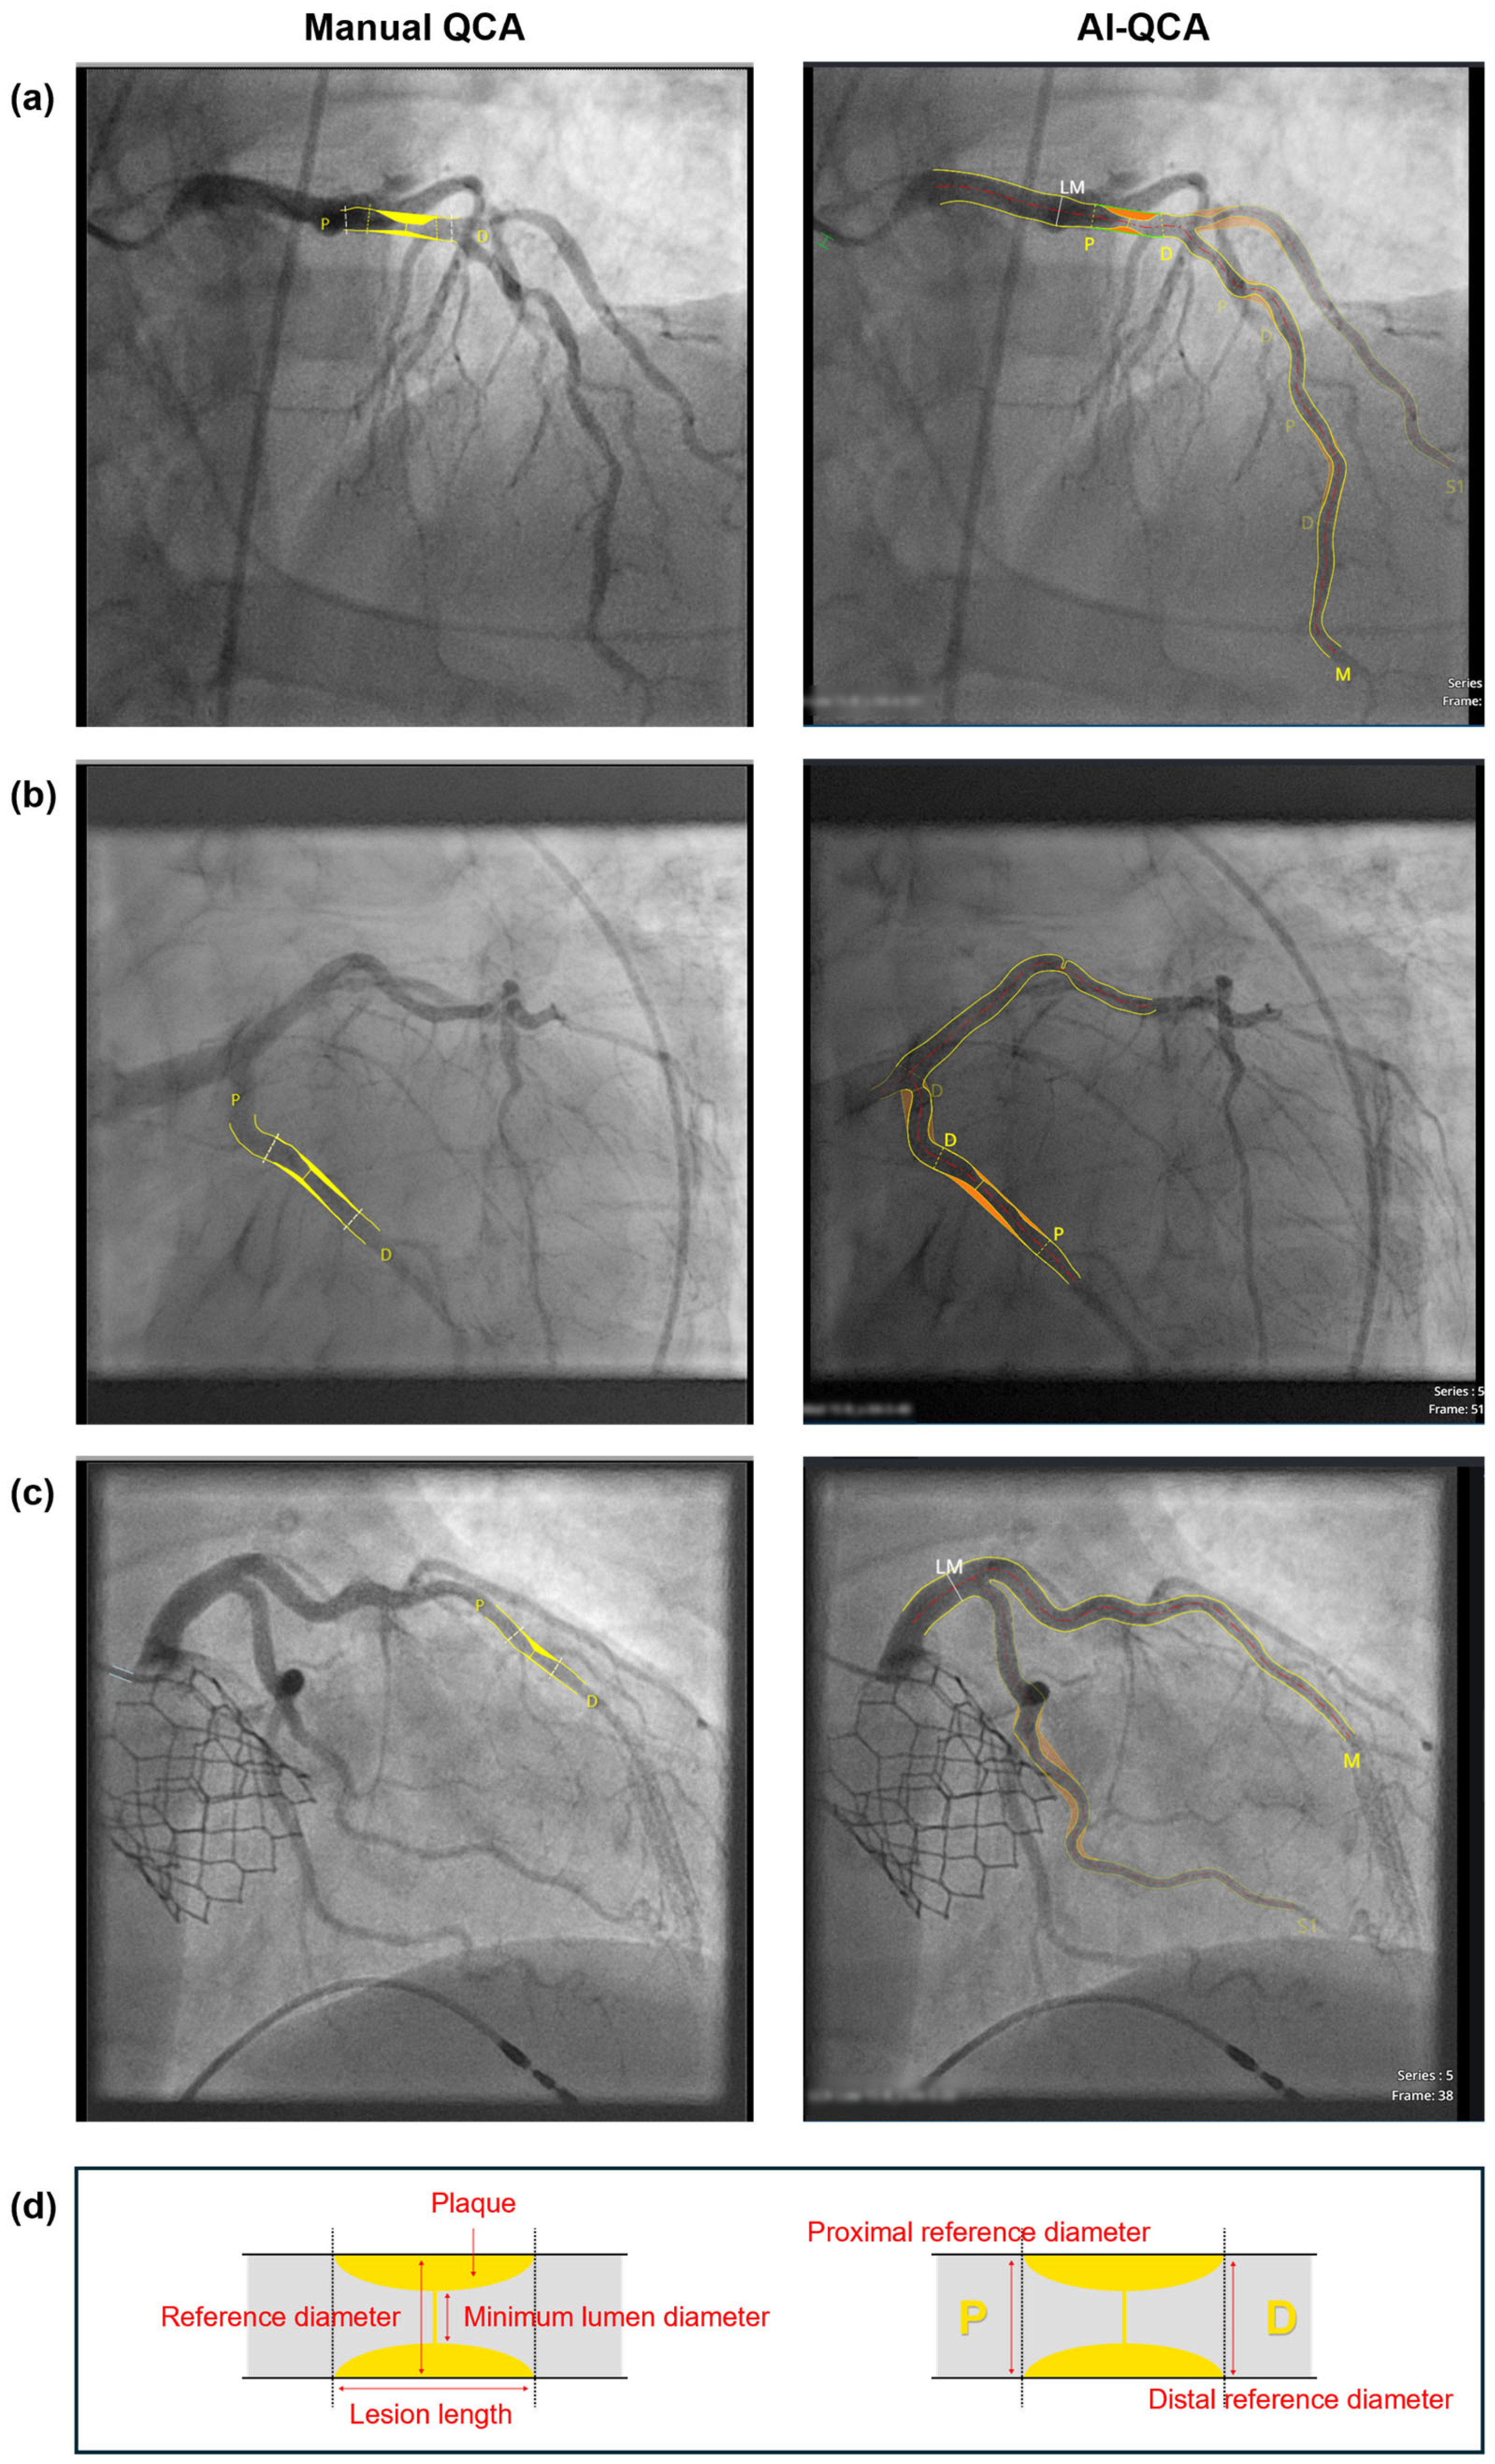
Among the 556 lesion analyses, 419 (75.4%) had matching frames between annotation and automated AI-QCA selection, 60 (10.8%) had different frames, and 77 (13.8%) were excluded from analysis (Figure 2). Exclusions were due to either AI-QCA analysis failure (1.2%) or inability to detect the target lesion identified by manual QCA (9.5%). Thus, AI-QCA detected 479 out of the 556 lesions identified by manual QCA, showing a lesion detection rate of 86.15%.
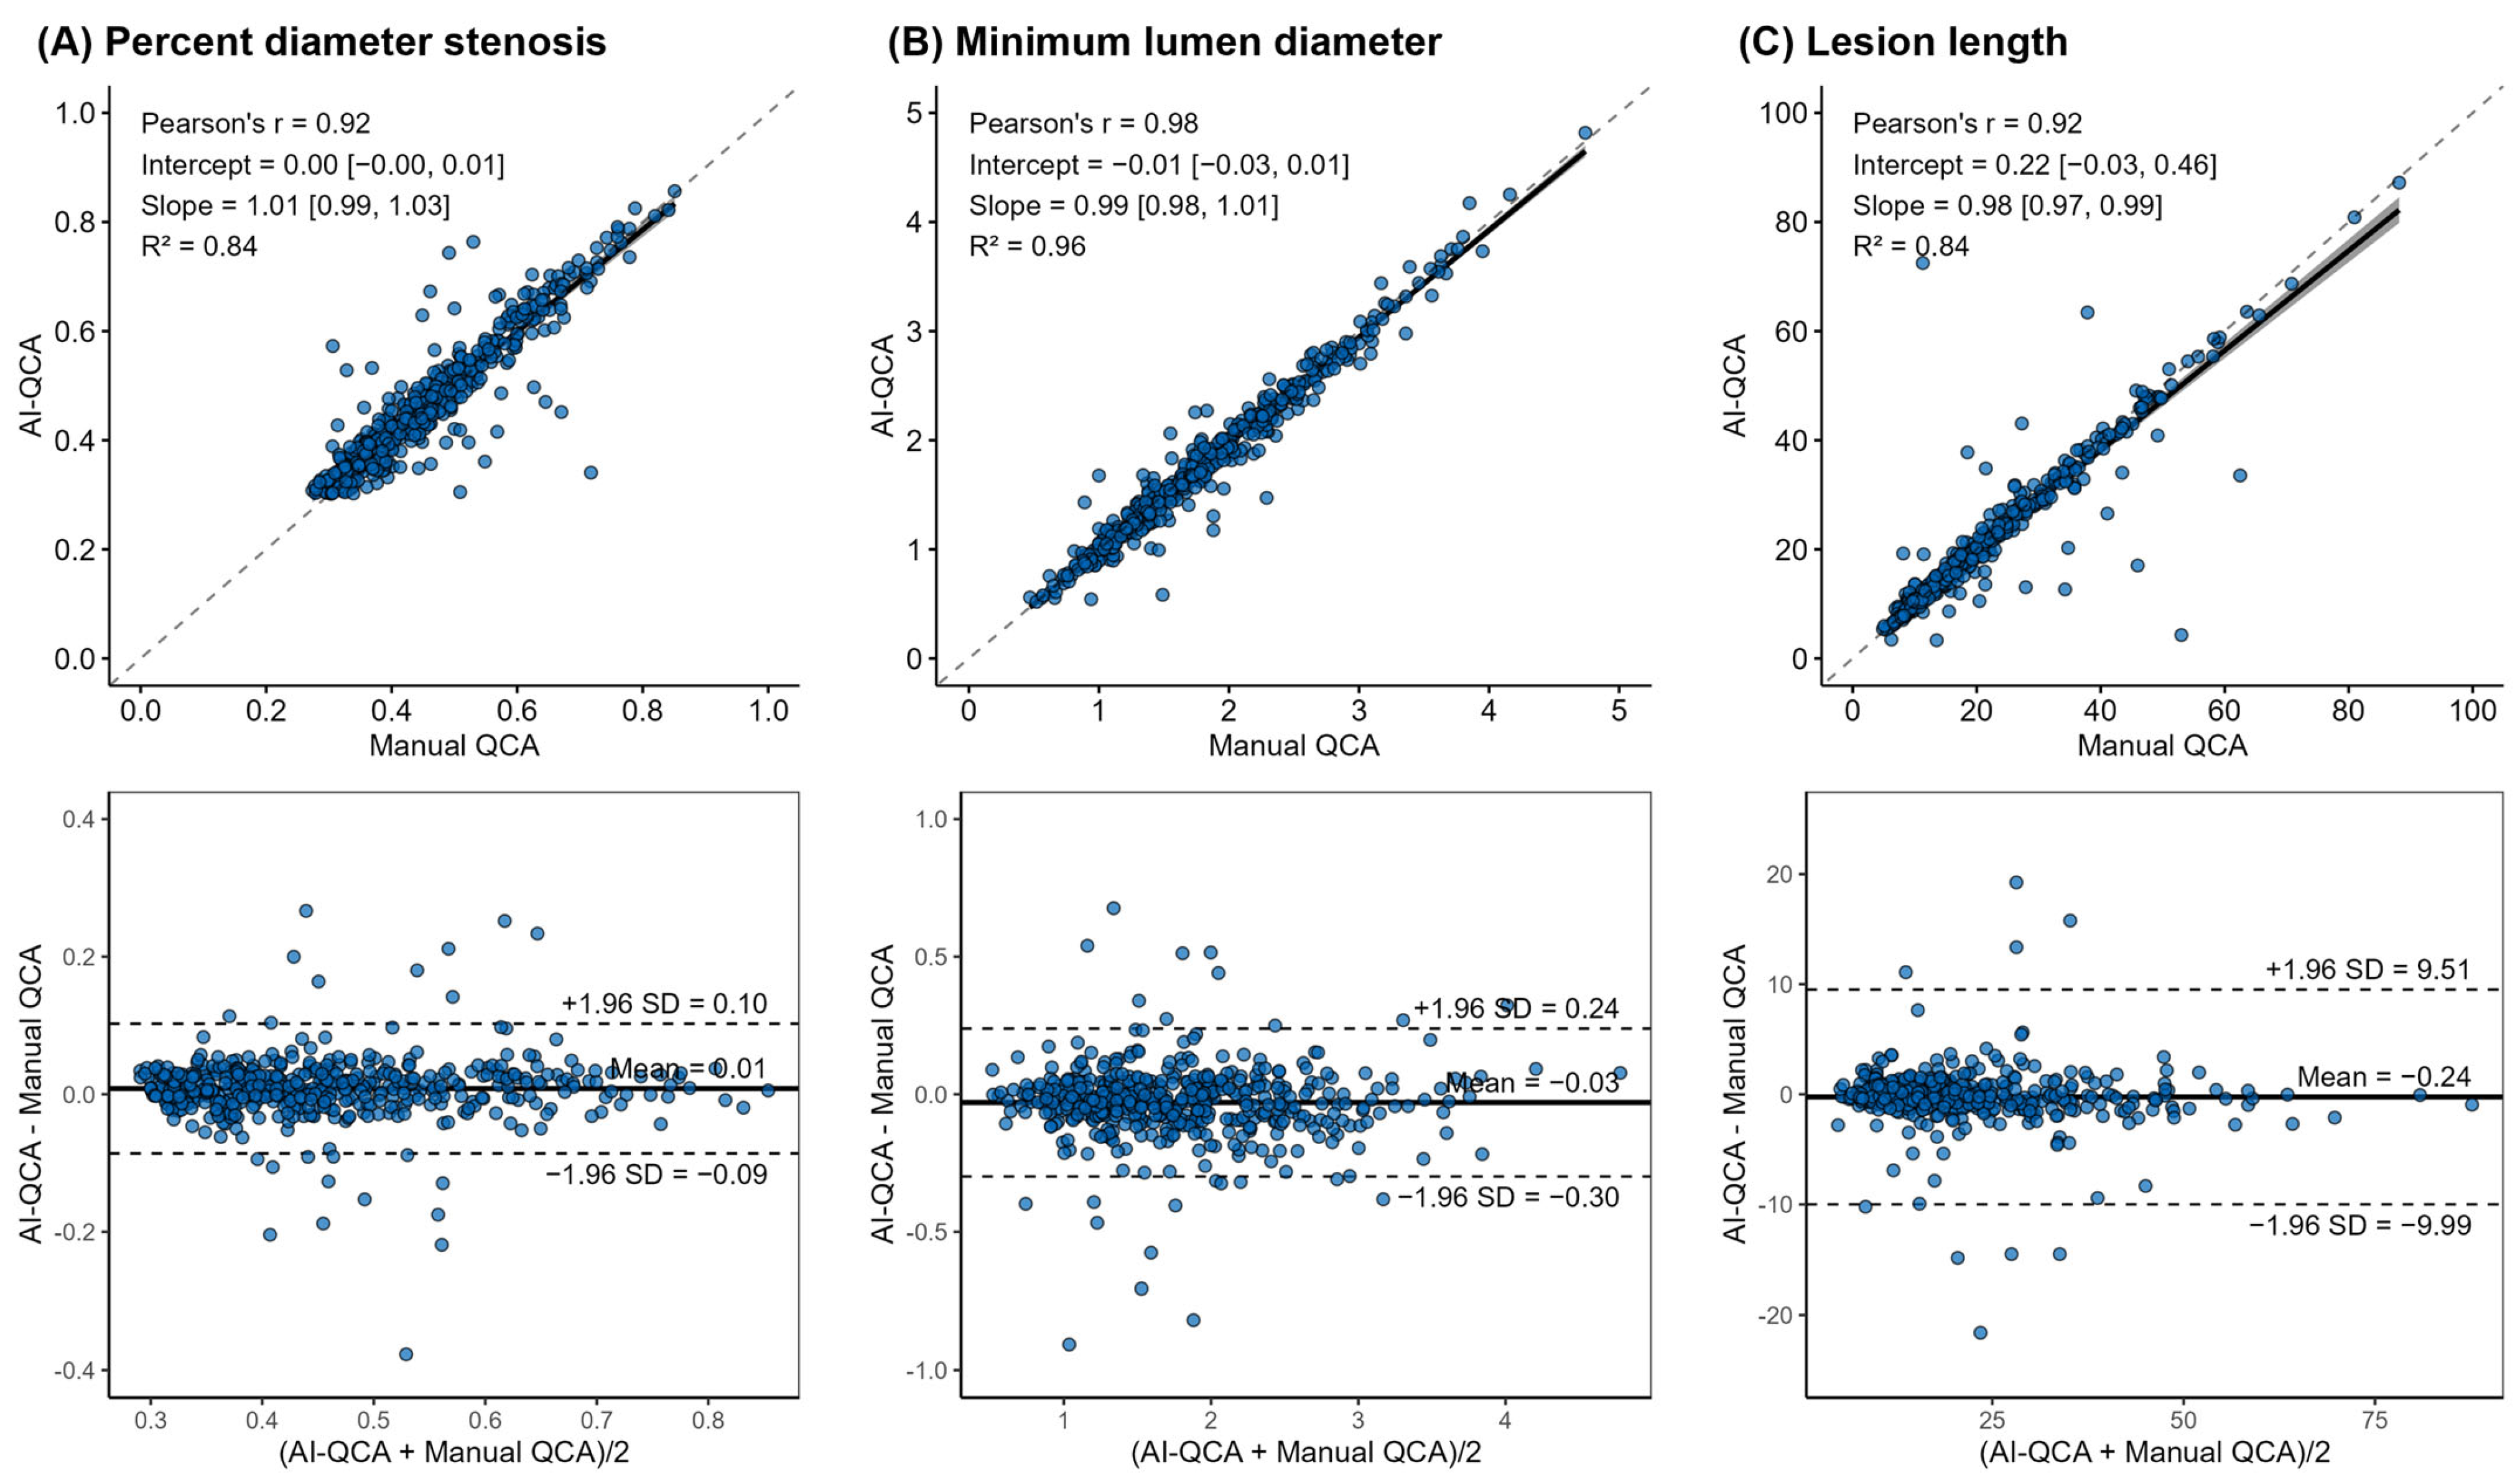
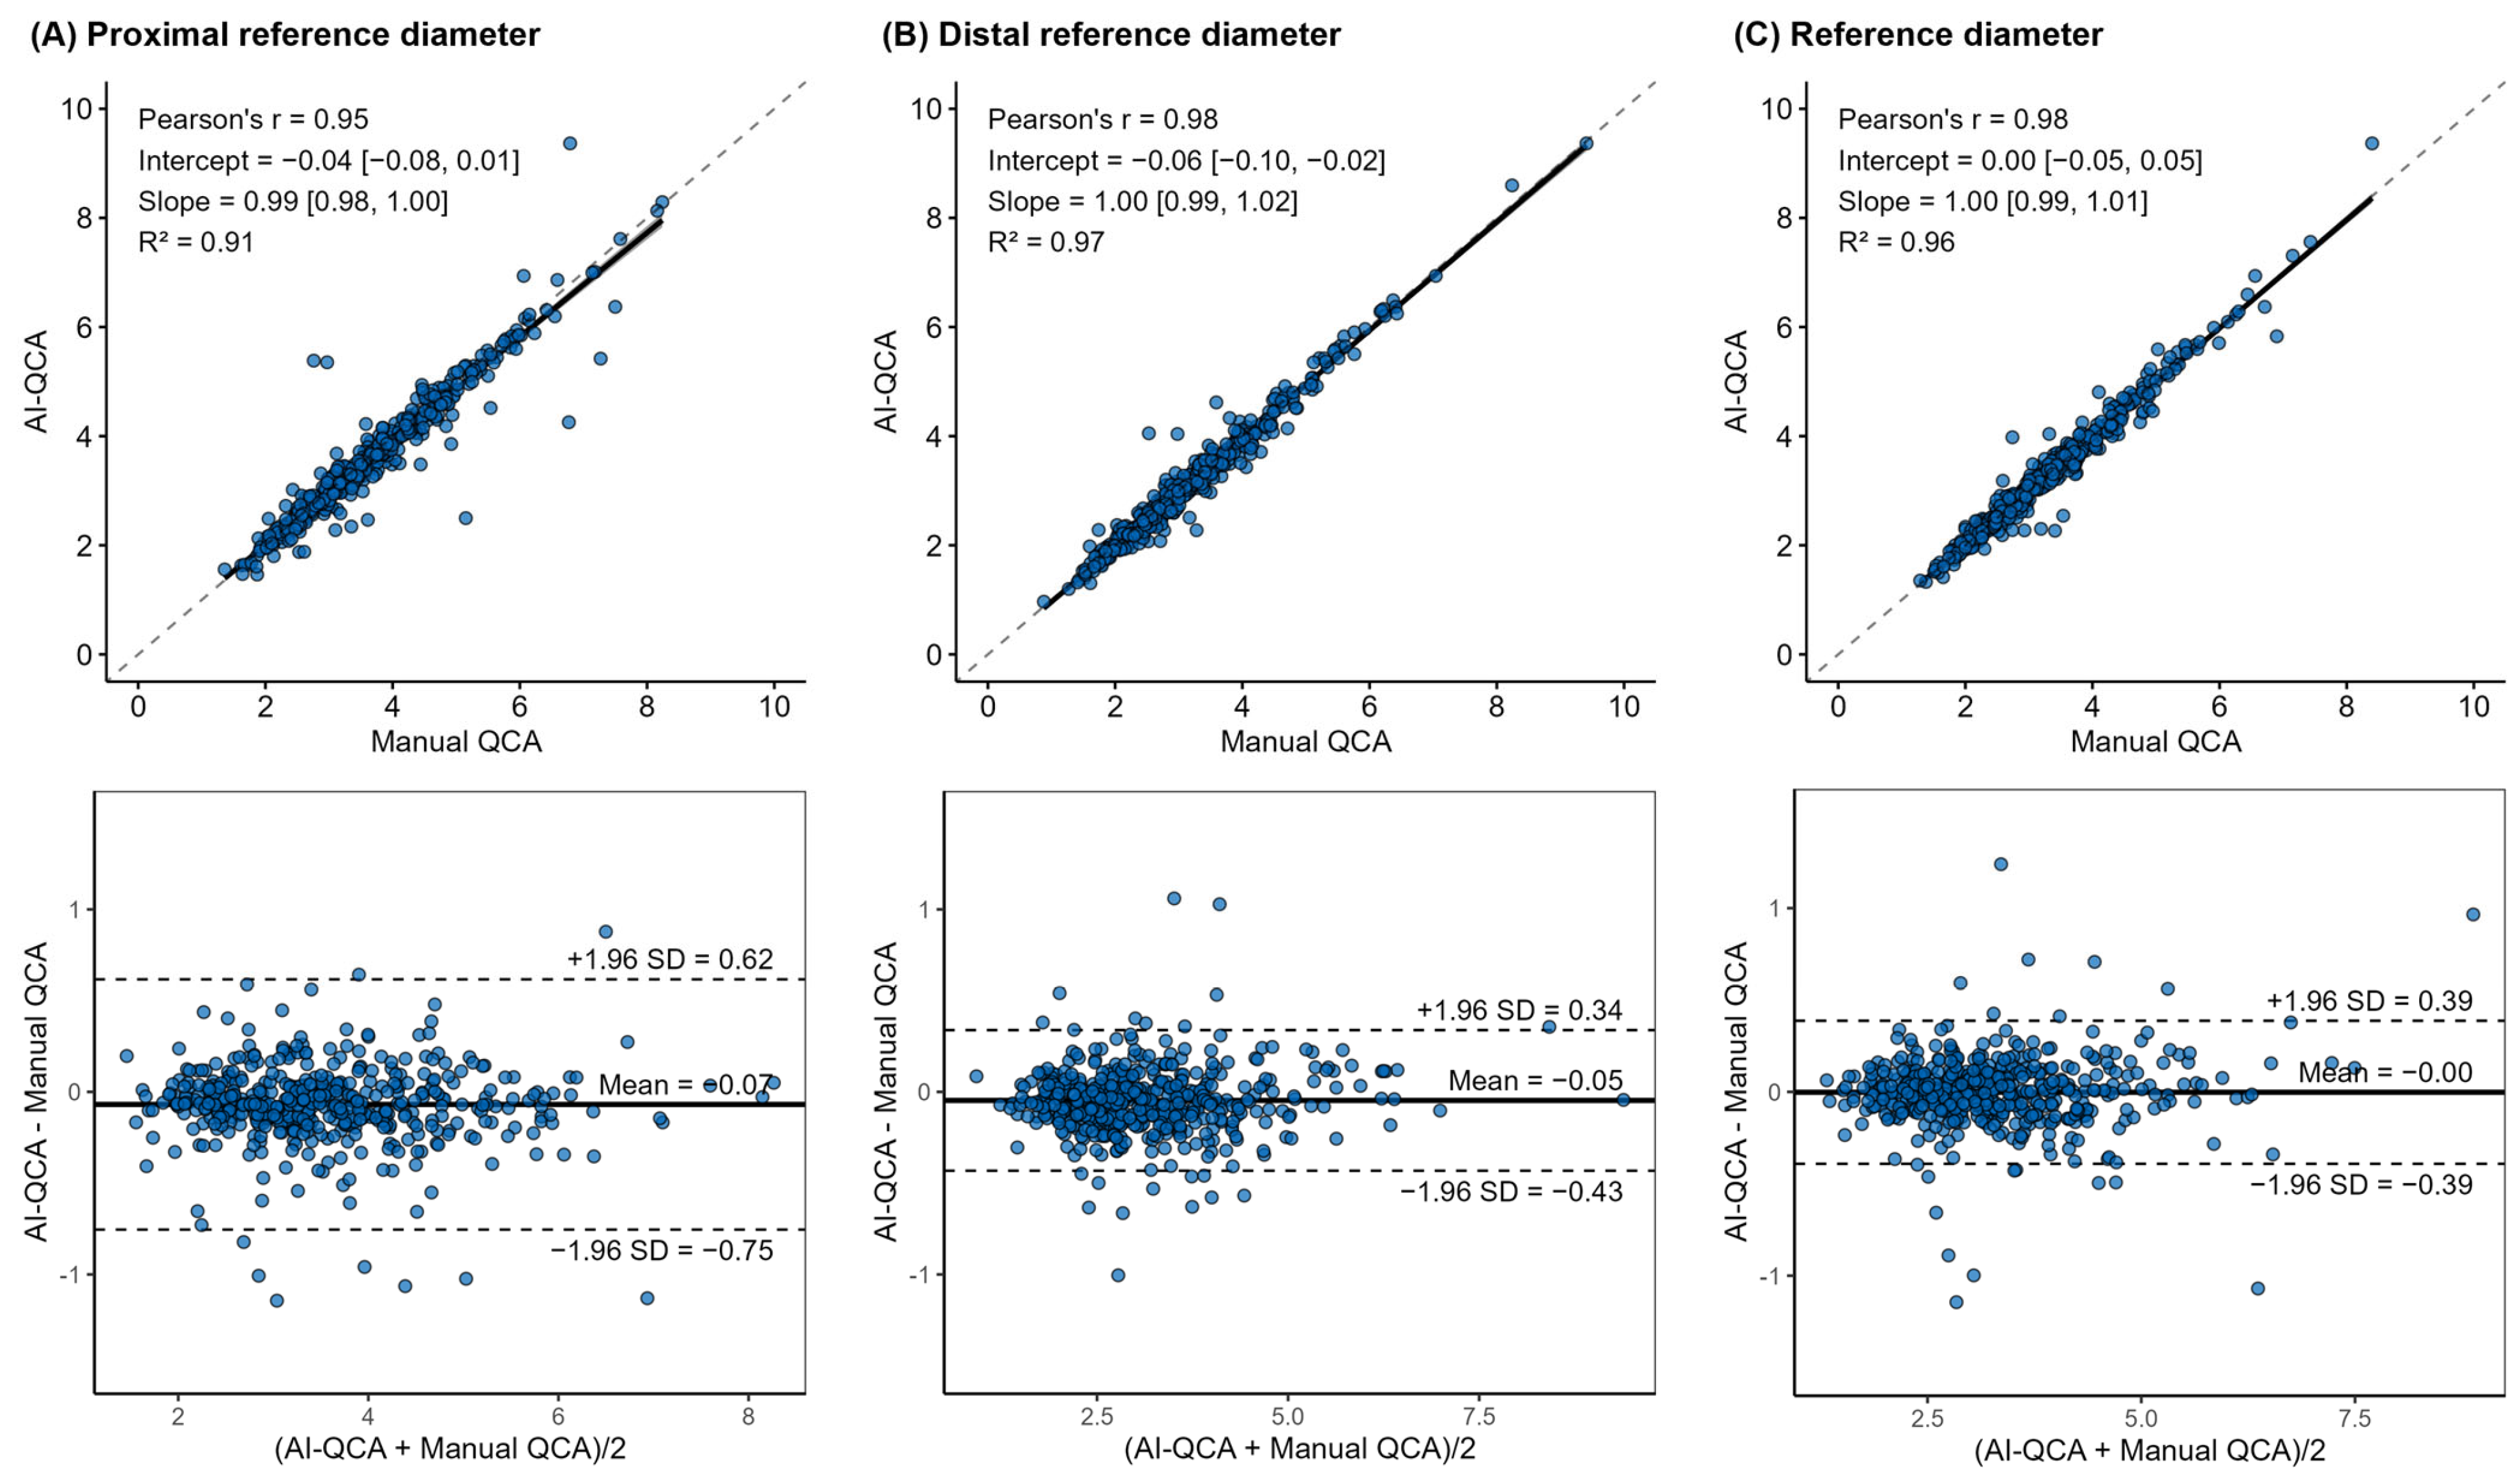
The results of Passing–Bablok regression are presented in Figure 3. All QCA measurements demonstrated coefficient of determination (R2) values greater than 0.8 (%DS, 0.84; MLD, 0.96; LL, 0.84; PRD, 0.91; DRD, 0.97; RD, 0.96; Figure A1). The confidence intervals for intercepts included zero, and the confidence intervals for slopes included one except for LL and DRD. Pearson correlation coefficients (r) were greater than 0.9 for all variables, with a mean of 0.9833. Subgroup analysis for %DS further demonstrated strong correlations between AI-QCA and manual QCA measurements when stratified by dataset, lesion location, %DS, and lesion length (Table A2).
In the Bland–Altman analysis, the 95% Limits of Agreement (LoA) half-width was less than 0.7 mm for DRD, PRD, MLD and RD, while LL showed a half-width of 9.7 mm (Figure 3, Figure A1). The %DS difference between the manual and AI-QCA was ≤10% in 460 lesions (96.0% of total lesions). Based on the %DS categorization, 433 lesions (90.3% agreement rate) were classified into the same category by both AI-QCA and manual QCA. A weighted κ of 0.832 (95% confidence interval, 0.743–0.922) was found between AI-QCA and manual QCA (Table A3). The vessel classification accuracy based on the automated frame selection achieved 100% across all lesions.

3.3. Evaluation Based on the Manual Frame Selection

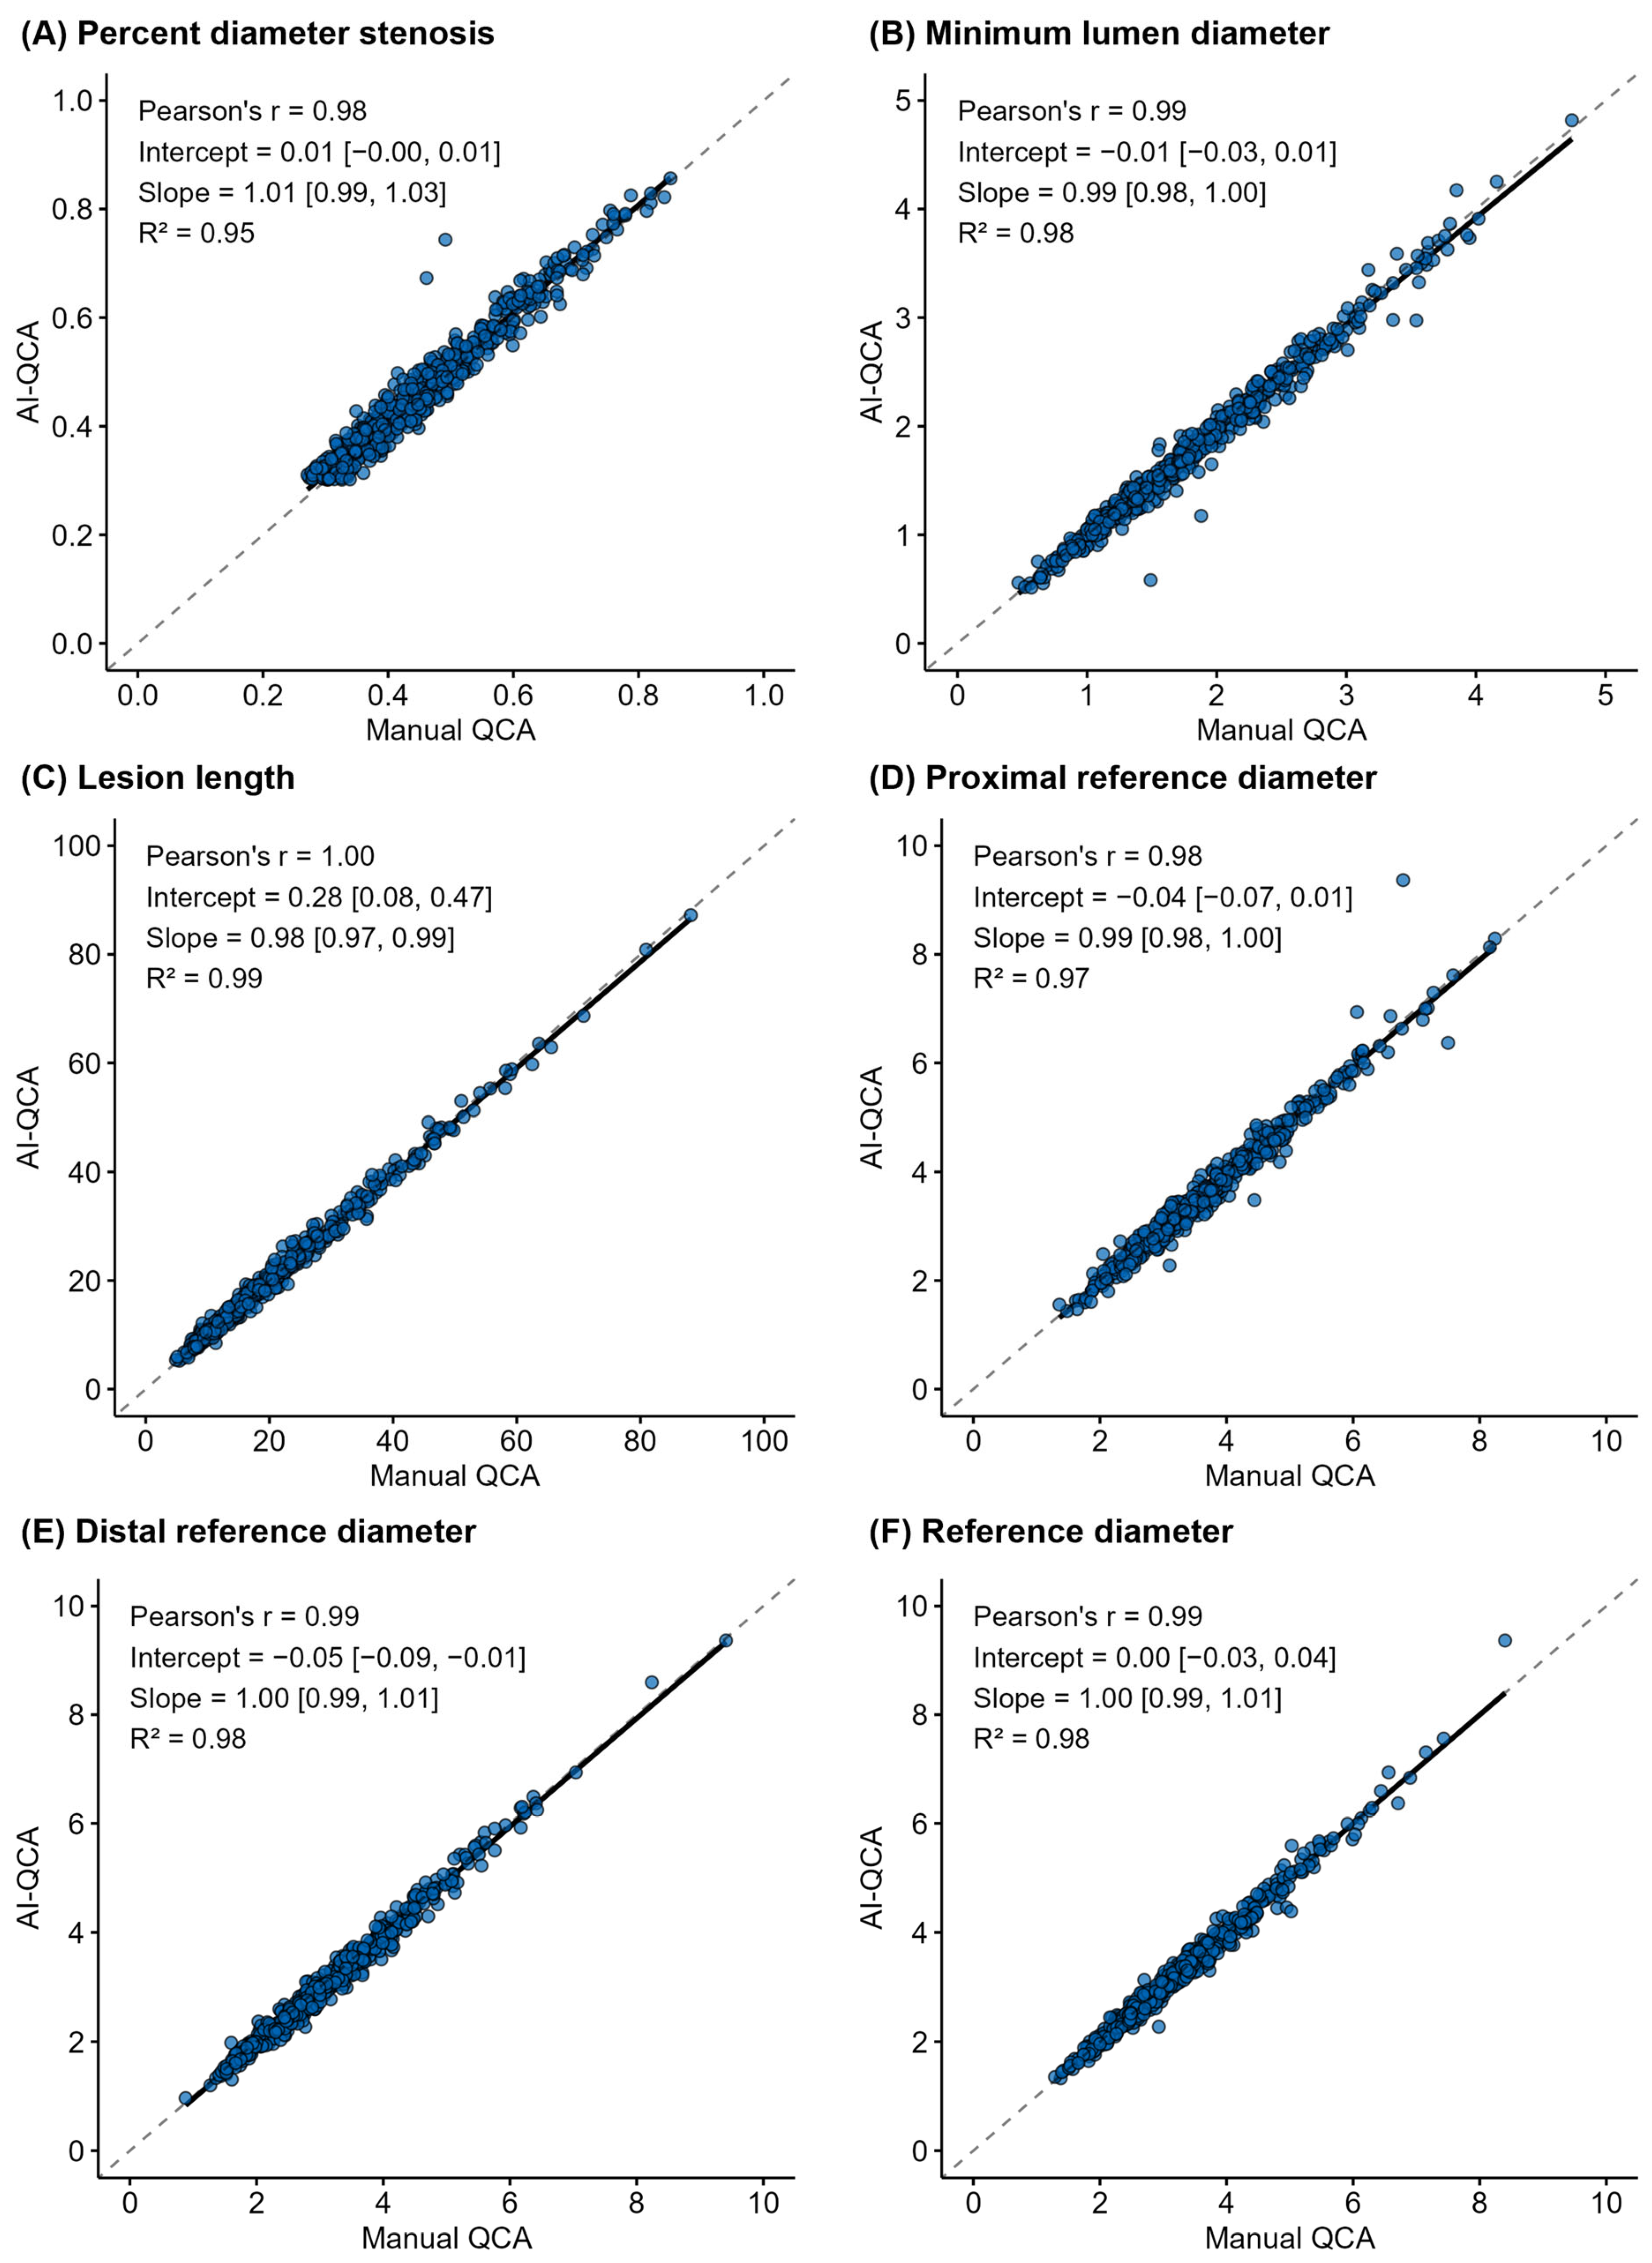
After manual frame adjustment for lesions with different frame selections and excluded lesions, AI-QCA successfully identified all 556 lesions that were detected by manual QCA. Quantitative analyses on the manual frame selection demonstrated strong agreement between AI-QCA and manual QCA measurements. Passing–Bablok regression analysis revealed R2 values exceeding 0.8 for all QCA measurements. The confidence intervals for intercepts included zero, and the confidence intervals for slopes included one except MLD, LL, and DRD. Pearson correlation coefficients (r) were greater than 0.95 for all variables (Table A4, Figure A2).
In the Bland–Altman analysis, the 95% LoA half-width was less than 0.4 mm for DRD, PRD, MLD and RD, while LL showed a half-width of 2.2 mm. (Table A5). The %DS difference between the manual and AI-QCA was ≤10% in 554 lesions (99.6% of total lesions). Based on the %DS categorization, 521 lesions (93.7% agreement rate) were classified into the same category by both AI-QCA and manual QCA. A weighted κ of 0.894 (95% confidence interval, 0.811–0.976) was found between AI-QCA and manual QCA (Table A3). The mean DSC, which quantifies the spatial overlap between AI-QCA and manual QCA segmentation, was 0.953. The vessel classification accuracy based on the manual frame selection achieved 100% across all lesions

4. Discussion

Our study is a comprehensive validation of AI-QCA performance using a European dataset, demonstrating its robust generalizability across different populations. To our knowledge, it is the first study to evaluate the quantitative performance of AI-QCA in both manual and automated frame selection. The results show that AI-QCA demonstrated high lesion detection rate with automated and manual frame selection. Quantitative measurements showed strong correlation with manual QCA across all parameters, with minimal systematic or proportional bias. AI-QCA demonstrated strong agreement with manual QCA based on Cohen’s weighted κ analysis.
Previous validation studies have expanded the scope of AI-QCA applications. An initial study by Kim, Y. I. et al. validated AI-QCA’s lesion detection capabilities and quantitative analysis accuracy in major vessels using the MPXA-1000 Version 1.0 software [17]. Chae, J. et al. extended this validation using the MPXA-2000 software to include side branches and additional angiographic views (LAO-caudal, RAO-caudal), demonstrating improved performance beyond the limitations of the initial model. In the same study, AI-QCA also outperformed visual estimation by cardiologists [18]. Our current study advances this validation sequence by confirming the effectiveness of AI-QCA in a demographically distinct European population. By utilizing data from both an ethnically diverse institutional database and a multicenter randomized controlled trial conducted across 37 European sites, we strengthen the evidence for its clinical utility across diverse patient populations.
Previous studies developing deep learning algorithms for CAG have primarily focused on vessel contour segmentation, assuming that optimal frames were pre-selected, with limited attention to the frame selection process itself [17,18,23,28]. Earlier investigations evaluated frame selection performance by identifying a single ground truth frame and measuring the distance between this frame and the one selected by the algorithm [29,30]. However, angiographic sequences typically encompass multiple cardiac cycles, containing several potentially optimal frames for quantitative analysis. Instead of directly assessing frame selection accuracy, this study evaluated whether reliable quantitative analysis could be attained even when different frames were selected by the automated system. Our findings demonstrate that AI-QCA maintained strong agreement with manual QCA even under automated frame selection.
Subgroup analyses based on automated frame selection revealed several key findings. First, the lesion detection rate for LM lesions was lower at 77%, primarily reflecting insufficient training data for LM cases in the current AI-QCA model [18]. Second, lesions with %DS ≥70% demonstrated comparable lesion detection rates to milder stenoses but exhibited lower correlation and agreement. This may be attributed to angiographic resolution constraints. In cases of severe stenoses with very narrow minimal lumen diameters, the inclusion or exclusion of even one or two pixels during segmentation can substantially alter the calculated %DS. Third, lesion length showed relatively low agreement under automated frame selection but improved significantly with manual frame selection. Lesion length is a measurement with high variability even in manual QCA [7]. This underscores the inherent limitation of two-dimensional QCA, where different angiographic projections can substantially alter the apparent lesion extent. However, as lesion extent influences reference diameter selection and clinical decision-making, it is important to reduce discrepancies in lesion length measurements under automated frame selection. These findings highlight the need for continued model refinement through larger, more diverse training datasets and the development of more robust algorithms capable of consistent performance across varying imaging conditions.
The potential for practical integration of AI-QCA into routine clinical workflows is supported by both our findings and emerging clinical trial evidence. The recent FLASH (Fully Automated Quantitative Coronary Angiography Versus Optical Coherence Tomography Guidance for Coronary Stent Implantation) trial demonstrated the non-inferiority of AI-QCA-assisted PCI compared to OCT-guided PCI in achieving minimal stent area [31], highlighting its potential as a bridge between conventional angiography-guided and imaging-guided interventions. Our demonstration of reliable AI-QCA performance with automated frame selection further supports its utility in real-time catheterization laboratory environments. The substantial agreement in %DS categorization based on clinical practice guidelines indicates that AI-QCA can assist in clinical decision-making during interventional procedures. Prospective studies are needed to evaluate the clinical benefits and real-world feasibility of AI-QCA when integrated into routine clinical practice.
Anatomical stenosis assessment alone has limitations in predicting the functional significance of coronary lesions, as demonstrated by physiological indices such as fractional flow reserve and instantaneous wave-free ratio [27,32]. However, with recent advancements in angiography-derived FFR technologies that can estimate FFR values without an invasive pressure wire [27,33], the importance of morphological analysis has become increasingly recognized. AI-QCA technology may contribute to this development by providing precise vessel segmentation, which serves as the foundation for computational physiology. Future studies should investigate whether AI-QCA–derived parameters can predict clinical outcomes following PCI and evaluate their performance when integrated with angiography-based physiological assessment tools.
Similar to the large-scale AI implementations in other medical fields [34], AI algorithms for angiographic analysis can be inherently influenced by the characteristics of their original training datasets. This highlights the importance of comprehensive validation across diverse clinical subgroups to enhance generalizability. Previous studies have documented inter-ethnic differences in vessel diameter and coronary atherosclerotic plaque composition between Asian and European populations, with Asian patients typically exhibiting smaller vessel diameters and a higher proportion of non-calcified plaque [21,22]. Despite these anatomical differences, our study demonstrates that the AI-QCA model, originally trained on a Korean dataset, performed equally well when applied to European patients. This result suggests that the deep learning algorithm has successfully captured fundamental angiographic features that remain consistent despite ethnic-specific anatomical variations.
The evolution of deep learning approaches in coronary angiography analysis has introduced several architectural innovations. Multi-instance learning frameworks utilizing attention mechanisms have been proposed to improve coronary artery stenosis detection on coronary CT angiography [11]. Similarly, spatial-temporal transformer networks have been developed for stenosis detection in X-ray angiography sequences, gathering spatio-temporal region-of-interest features for obtaining visual tokens within a local window [12]. These approaches enable models to focus on diagnostically relevant image regions, thereby enhancing interpretability and diagnostic precision. Despite these innovations, domain shift remains a pervasive challenge. Variations in imaging equipment, acquisition protocols, and patient demographics can substantially degrade model performance. Federated learning frameworks offer a promising solution by enabling collaborative model training across multiple institutions without centralizing sensitive patient data. For instance, FedStenoNet integrates personalized federated learning with histogram matching to harmonize image appearance distributions across clients, thereby mitigating inter-client domain shifts while preserving patient privacy [15]. The AI-QCA, while not explicitly employing federated learning, addresses generalizability through comprehensive validation. Future integration of recent paradigms and advanced domain adaptation techniques could further enhance the AI-QCA’s adaptability.
This study has several limitations. First, unlike previous research [3,17,18], which used end-diastolic frames appropriate for lesion visualization, our frame selection criteria focused on contrast clarity and suitability for manual contour delineation for manual QCA. Multiple suitable frames may exist within a single angiographic series, and the selection criteria used in this study may differ from those used in routine clinical practice. Consequently, the performance of AI-QCA may appear enhanced under these optimized conditions compared to real-world scenarios. Second, the exclusion of certain complex cases, such as total or subtotal occlusions, severe vessel overlap, and poor image quality, may limit the generalizability of the findings to broader clinical populations. Nevertheless, the inclusion of the MULTISTARS AMI dataset, which enrolled patients with STEMI and multivessel coronary artery disease, ensured adequate representation of other clinically relevant complex cases. Additionally, 77 lesions were excluded during the evaluation based on automated frame selection. This exclusion likely occurred because lesions identified as stenotic by manual QCA were not classified as pathological by AI-QCA due to the fixed stenosis detection threshold (Appendix A). Notably, this threshold can be adjusted by users in routine clinical practice. While these specific exclusions may result in an overestimation of AI-QCA performance in the most challenging scenarios, the real-world applicability of our findings remains reasonably preserved. Third, detailed clinical data, such as diagnoses and comorbidities, were not collected. As this study was designed to validate the technical performance of AI-QCA across diverse populations, it does not provide analysis of how AI-QCA results may differ according to specific clinical characteristics. Fourth, our study utilized institution-specific datasets without validation on public coronary angiography datasets. The scarcity of public data with complete angiographic sequences and comparable image quality precluded direct comparisons. Consequently, the reproducibility of AI-QCA on standardized public benchmarks remains to be established.

5. Conclusions

This study validated the performance of AI-QCA using a European dataset and demonstrated high lesion detection rate and its strong agreement with manual QCA in both manual and automated frame selection. The findings suggest the potential for generalizability and clinical applicability of AI-QCA across diverse populations and settings. While prospective studies are needed, the observed accuracy and real-time automated analysis indicate that AI-QCA may serve as a useful tool to support more standardized and efficient decision-making in catheterization laboratories.

Author Contributions

Conceptualization, A.C.; methodology, S.L.; formal analysis, S.L. and S.K. (Soyeon Kim); investigation, S.K. (Soyeon Kim) and S.K. (Soohyun Kim); data curation, S.K. (Soohyun Kim); writing—original draft preparation, S.L.; writing—review and editing, B.E.S. and A.C.; visualization, S.L.; supervision, B.E.S. and A.C.; project administration, B.K. and R.K. All authors have read and agreed to the published version of the manuscript.

Funding

This study was financially supported by Medipixel, Inc., Seoul, Republic of Korea, through a clinical study agreement.

Institutional Review Board Statement

The study was conducted in accordance with the Declaration of Helsinki, and approved by the Ethics Committee of the Canton of Zürich (BASEC-ID: 2024-00587).

Informed Consent Statement

Informed consent was obtained from all subjects, either through the General Consent USZ (Version 4, dated 1 December 2023) or the MULTISTARS AMI trial consent (BASEC-ID: 2016-01026, Version 5, dated 30 June 2021).

Data Availability Statement

Dataset available on request from the authors.

Conflicts of Interest

Sangmin Lee, Bora Kim, Soyeon Kim, and Soohyun Kim were employees of Medipixel, Inc. To mitigate potential bias, all angiographic data were de-identified by the Andreas Grüntzig Coronary Angiography and Physiology Core Laboratory before being transferred to Medipixel, Inc. After manual annotation by the analysts, AI-QCA was conducted by technicians blinded to the manual annotations. The remaining authors declare no competing interests.

Abbreviations

The following abbreviations are used in this manuscript:
AI-QCAArtificial intelligence-based quantitative coronary angiography
CAGCoronary angiography
DRDDistal reference diameter
LLLesion length
MLDMinimum lumen diameter
PRDProximal reference diameter
QCAQuantitative coronary angiography
RDReference diameter
%DSPercent diameter stenosis

Appendix A

Appendix A.1. Lesion Characteristics by Cardiac Phase

To assess potential systematic bias from cardiac phase selection in the manual QCA process, we compared lesion characteristics between those analyzed at end-diastolic frames and those at non-end-diastolic frames. Among the 556 analyzed lesions, 129 (23.2%) were assessed at end-diastolic frames and 427 (76.8%) at non-end-diastolic frames. For the 427 lesions analyzed at non-end-diastolic frames, the mean frame interval between the analyzed frame and the nearest end-diastolic frame was 3.2 ± 2.4 frames.
No systematic bias was observed in lesion characteristics, including vessel categorization, MLD, and %DS (all p > 0.05). Although lesion length showed statistical significance between groups (p = 0.04), the absolute difference was clinically negligible (end-diastolic, 22.9 mm vs. non-end-diastolic, 20.2 mm), indicating that our image quality-prioritized frame selection approach did not introduce systematic measurement bias.

Appendix A.2. Characteristics of Lesions Excluded from the Evaluation Based on the Automated Frame Selection

Among the 77 lesions excluded from the automated frame selection evaluation, quantitative analysis revealed no predominance of specific vessel types (RCA, 35.1%; LAD, 20.8%; LCX, 35.1%; LM, 9.1%). These excluded lesions demonstrated significantly lower mean %DS (42.2% ± 12.6 vs. 45.2% ± 11.9, p = 0.043) and larger MLD (2.00 ± 0.82 mm vs. 1.79 ± 0.70 mm, p = 0.023) compared to successfully analyzed lesions.
The primary pattern of exclusion involved cases where AI-QCA vessel segmentation was successful but target lesion detection failed. In these cases, lesions identified as stenotic by manual QCA were not classified as pathologic by AI-QCA due to the system’s fixed stenosis detection threshold of 30% diameter stenosis. Consequently, several borderline lesions with %DS approaching the normal range were recognized by manual QCA but not flagged by AI-QCA under this threshold setting.
Table A1. Quantitative comparison between artificial intelligence-based quantitative coronary angiography and manual quantitative coronary angiography across different categories.
CategoryManual QCAAI-QCA Based on the Automated Frame SelectionAI-QCA Based on the Manual Frame Selection
Number of Lesions%DSLLNumber of
Lesions Identified
%DS DifferenceNumber of
Lesions Identified
%DS Difference
All55644.8 ± 12.120.8 ± 12.1479 (86%)0.8 ± 4.8556 (100%)1.1 ± 2.7
Lesion location
 RCA17545.7 ± 1423.2 ± 12.6148 (85%)0.9 ± 3.8175 (100%)1.0 ± 2.3
 LAD17244.3 ± 11.523.3 ± 14.1156 (91%)1.2 ± 4.6172 (100%)1.2 ± 3.0
 LCX17944.9 ± 10.817.2 ± 8.5152 (85%)0.3 ± 5.2179 (100%)1.0 ± 2.9
 LM3041.9 ± 9.714.5 ± 6.123 (77%)1.1 ± 8.330 (100%)0.9 ± 2.1
Lesion length
 Discrete (<10 mm)7340.9 ± 8.708.30 ± 1.2265 (89%)1.7 ± 4.373 (100%)1.5 ± 2.3
 Tubular (10–20 mm)25643.8 ± 11.314.8 ± 2.89217 (85%)0.9 ± 4.6256 (100%)1.1 ± 2.8
 Diffuse (≥20 mm)22748.2 ± 12.832.5 ± 12.0197 (87%)0.5 ± 5.1227 (100%)0.9 ± 2.8
%DS
 <50%39538.4 ± 5.819.6 ± 11.2336 (85%)1.3 ± 4.0395 (100%)1.1 ± 2.8
 50% to <70%13857.9 ± 5.622.9 ± 13.1123 (89%)0.1 ± 5.8138 (100%)1.0 ± 2.5
 ≥70%2376.2 ± 4.328.9 ± 15.420 (87%)−1.8 ± 8.723 (100%)0.5 ± 2.0
Values are % (n) or mean ± standard deviation. ‘Number of lesions identified’ refers to the count of lesions where the MLD location determined by manual QCA falls within the lesion identified by AI-QCA. Abbreviations: QCA, quantitative coronary angiography; AI-QCA, artificial intelligence-based quantitative coronary angiography; %DS, percent diameter stenosis; RCA, right coronary artery; LAD, left anterior descending; LCX, left circumflex; LL, lesion length; LM, left main.
Table A2. Subgroup Analysis of Passing–Bablok regression analysis between artificial intelligence-based quantitative coronary angiography and manual quantitative coronary angiography for diameter stenosis based on the automated frame selection.
CategoryNumber of LesionsInterceptSlopeR2Pearson’s r
All4790.39 [−0.54, 1.40]1.01 [0.99, 1.03]0.8410.920
Dataset
 MULTISTARS AMI2910.36 [−1.04, 1.72]1.01 [0.98, 1.04]0.8680.933
 USZ General Consent1880.80 [−0.80, 2.33]1.00 [0.96, 1.04]0.7740.888
Lesion location
 RCA1561.94 [−0.11, 3.69]0.98 [0.94, 1.03]0.8450.920
 LAD1520.37 [−1.79, 2.38]1.01 [0.96, 1.05]0.7800.891
 LCX148−0.42 [−2.18, 0.91]1.03 [1.00, 1.07]0.9220.962
 LM23−1.39 [−8.69, 6.99]1.06 [0.82, 1.24]0.2490.678
%DS
 <50%336−1.09 [−3.25, 0.76]1.05 [1.01, 1.11]0.6440.811
 50% to <70%123−15.78 [−26.37, −8.37]1.29 [1.16, 1.46]0.4100.682
 ≥70%20−33.02 [−95.17, −0.24]1.44 [1.00, 2.28]0.3120.588
Lesion length
 Discrete (<10 mm)650.50 [−3.23, 3.36]1.03 [0.95, 1.11]0.7630.883
 Tubular (10–20 mm)2170.24 [−1.24, 1.75]1.02 [0.98, 1.05]0.8440.920
 Diffuse (≥20 mm)1970.46 [−0.97, 1.96]1.01 [0.98, 1.04]0.8390.920
USZ, University Hospital Zurich; RCA, right coronary artery; LAD, left anterior descending; LCX, left circumflex; LM, left main; %DS, percent diameter stenosis.
Table A3. Categorical agreement of percent diameter stenosis between artificial intelligence-based quantitative coronary angiography and manual quantitative coronary angiography.
Automated Frame Selection (n = 479)
%DS by AI-QCA%DS by Manual QCA
<50%50% to <70%≥70%Cohen’s Kappa (95% CI)
<50%3161510.832 [0.743, 0.922]
50% to <70%191002
≥70%1817
Manual frame selection (n = 556)
%DS by AI-QCA%DS by manual QCA
<50%50% to <70%≥70%Cohen’s kappa (95% CI)
<50%375600.894 [0.811, 0.976]
50% to <70%191252
≥70%1721
95% confidence intervals were estimated based on the asymptotic standard error of the weighted kappa statistic. Abbreviations: QCA, quantitative coronary angiography; AI-QCA, artificial intelligence-based quantitative coronary angiography; %DS, percent diameter stenosis.
Table A4. Results of Passing–Bablok regression analysis between artificial intelligence-based quantitative coronary angiography (AI-QCA) and manual quantitative coronary angiography (QCA) based on the manual frame selection.
QCA MeasurementsInterceptSlopeR2Pearson’s r
Percent diameter stenosis (%)0.005 [−0.003, 0.013]1.010 [0.994, 1.029]0.9500.975
Minimum lumen diameter (mm)−0.007 [−0.026, 0.010]0.986 [0.975, 0.996]0.9800.990
Lesion length (mm)0.276 [0.104, 0.461]0.980 [0.971, 0.988]0.9910.996
Proximal reference diameter (mm)−0.036 [−0.071, 0.003]0.990 [0.978, 1.001]0.9700.985
Distal reference diameter (mm)−0.047 [−0.086, −0.010]1.000 [0.987, 1.012]0.9830.991
Reference diameter (mm)0.003 [−0.031, 0.042]0.997 [0.986, 1.008]0.9820.991
Abbreviations: QCA, quantitative coronary angiography.
Table A5. Results of Bland–Altman analysis between artificial intelligence-based quantitative coronary angiography and manual quantitative coronary angiography based on the manual frame selection.
QCA MeasurementsMean Difference95% LoAHalf-Width of LoA
LowerUpper
Percent diameter stenosis (%)0.011−0.0430.0640.053
Minimum lumen diameter (mm)−0.038−0.2360.1590.198
Lesion length (mm)−0.073−2.2932.1472.220
Proximal reference diameter (mm)−0.065−0.4560.3270.391
Distal reference diameter (mm)−0.055−0.3290.2190.274
Reference diameter (mm)−0.002−0.2760.2710.274
Abbreviations: QCA, quantitative coronary angiography; LoA, limits of agreement.
Figure A1. Scatter plots and Bland–Altman plots between artificial intelligence-based quantitative coronary angiography (AI-QCA) and manual quantitative coronary angiography (QCA) for reference diameter measurements based on the automated frame selection.
Cardiovascmed 29 00010 g0a1
Figure A2. Scatter plots between artificial intelligence-based quantitative coronary angiography and manual quantitative coronary angiography based on the manual frame selection.
Cardiovascmed 29 00010 g0a2

References

  1. Nallamothu, B.K.; Spertus, J.A.; Lansky, A.J.; Cohen, D.J.; Jones, P.G.; Kureshi, F.; Dehmer, G.J.; Drozda, J.P.; Walsh, M.N.; Brush, J.E.; et al. Comparison of Clinical Interpretation with Visual Assessment and Quantitative Coronary Angiography in Patients Undergoing Percutaneous Coronary Intervention in Contemporary Practice: The Assessing Angiography (A2) Project. Circulation 2013, 127, 1793–1800. [Google Scholar] [CrossRef] [Scilit]
  2. Zhang, H.; Mu, L.; Hu, S.; Nallamothu, B.K.; Lansky, A.J.; Xu, B.; Bouras, G.; Cohen, D.J.; Spertus, J.A.; Masoudi, F.A.; et al. Comparison of Physician Visual Assessment with Quantitative Coronary Angiography in Assessment of Stenosis Severity in China. JAMA Intern. Med. 2018, 178, 239–247. [Google Scholar] [CrossRef] [Scilit] [PubMed]
  3. Campbell, P.T.; Mahmud, E.; Marshall, J.J. Interoperator and Intraoperator (in)Accuracy of Stent Selection Based on Visual Estimation: Visual Assessment of the Coronary Lesion Length. Cathet. Cardiovasc. Intervent 2015, 86, 1177–1183. [Google Scholar] [CrossRef] [Scilit]
  4. Shah, R.; Yow, E.; Jones, W.S.; Kohl, L.P.; Kosinski, A.S.; Hoffmann, U.; Lee, K.L.; Fordyce, C.B.; Mark, D.B.; Lowe, A.; et al. Comparison of Visual Assessment of Coronary Stenosis with Independent Quantitative Coronary Angiography: Findings from the Prospective Multicenter Imaging Study for Evaluation of Chest Pain (PROMISE) Trial. Am. Heart J. 2017, 184, 1–9. [Google Scholar] [CrossRef] [Scilit] [PubMed]
  5. Desmet, W.; Willems, J.; Lierde, J.V.; Piessens, J. Discrepancy between Visual Estimation and Computer-assisted Measurement of Lesion Severity before and after Coronary Angioplasty. Cathet.er. Cardiovasc. Diagn 1994, 31, 192–198. [Google Scholar] [CrossRef] [Scilit]
  6. Serruys, P.W.; Reiber, J.H.C.; Wijns, W.; Brand, M.V.D.; Kooijman, C.J.; ten Katen, H.J.; Hugenholtz, P.G. Assessment of Percutaneous Transluminal Coronary Angioplasty by Quantitative Coronary Angiography: Diameter versus Densitometric Area Measurements. Am. J. Cardiol. 1984, 54, 482–488. [Google Scholar] [CrossRef] [Scilit]
  7. Ito, S.; Kinoshita, K.; Endo, A.; Kami, R.; Kotake, Y.; Nakamura, M. Inter- and Intra-Core Laboratory Variability in the Quantitative Coronary Angiography Analysis for Drug-Eluting Stent Treatment and Follow Up. Ther. Adv. Cardiovasc. Dis. 2020, 14, 1–15. [Google Scholar] [CrossRef] [Scilit]
  8. Grundeken, M.J.; Ishibashi, Y.; Généreux, P.; Lasalle, L.; Iqbal, J.; Wykrzykowska, J.J.; Morel, M.A.; Tijssen, J.G.; De Winter, R.J.; Girasis, C.; et al. Inter-Core Lab Variability in Analyzing Quantitative Coronary Angiography for Bifurcation Lesions: A Post-Hoc Analysis of a Randomized Trial. JACC: Cardiovasc. Interv. 2015, 8, 305–314. [Google Scholar] [CrossRef] [Scilit]
  9. Tuinenburg, J.C.; Koning, G.; Hekking, E.; Desjardins, C.; Harel, F.; Bilodeau, L.; Van Weert, A.W.M.; Lespérance, J.; Reiber, J.H.C. One Core Laboratory at Two International Sites, Is That Feasible? An Inter-core Laboratory and Intra-observer Variability Study. Cathet. Cardio Interv. 2002, 56, 333–340. [Google Scholar] [CrossRef] [Scilit] [PubMed]
  10. Esteva, A.; Chou, K.; Yeung, S.; Naik, N.; Madani, A.; Mottaghi, A.; Liu, Y.; Topol, E.; Dean, J.; Socher, R. Deep Learning-Enabled Medical Computer Vision. NPJ Digit. Med. 2021, 4, 5. [Google Scholar] [CrossRef] [Scilit]
  11. Gupta, V.; Petursson, P.; Hilgendorf, L.; Rawshani, A.; Borén, J.; Råmunddal, T.; Omerovic, E.; Louca, A.; Angerås, O.; Schneiderman, J.; et al. Multi-Instance Learning with Attention Mechanism for Coronary Artery Stenosis Detection on Coronary Computed Tomography Angiography. Eur. Heart J. Digit. Health 2025, 6, 382–391. [Google Scholar] [CrossRef] [Scilit]
  12. Han, T.; Ai, D.; Li, X.; Fan, J.; Song, H.; Wang, Y.; Yang, J. Coronary Artery Stenosis Detection via Proposal-Shifted Spatial-Temporal Transformer in X-Ray Angiography. Comput. Biol. Med. 2023, 153, 106546. [Google Scholar] [CrossRef] [Scilit]
  13. Zhang, Y.; Gao, Y.; Zhou, G.; He, J.; Xia, J.; Peng, G.; Lou, X.; Zhou, S.; Tang, H.; Chen, Y. Centerline-Supervision Multi-Task Learning Network for Coronary Angiography Segmentation. Biomed. Signal Process. Control 2023, 82, 104510. [Google Scholar] [CrossRef] [Scilit]
  14. Li, C.; Chu, M.; Liu, X.; Yang, B.; Li, Y.; Li, G.; Tu, S. Straightening the Path to Clarity: A Subpixel-Level Vessel Segmentation Framework in X-Ray Coronary Angiography. Comput. Med. Imaging Graph. 2025, 125, 102634. [Google Scholar] [CrossRef] [Scilit]
  15. Di Cosmo, M.; Migliorelli, G.; Villani, F.P.; Francioni, M.; Muçaj, A.; Frontoni, E.; Moccia, S.; Fiorentino, M.C. FedStenoNet: Tackling Domain Shift in x-Ray Coronary Angiography through a Personalized Federated Detection Framework. Comput. Biol. Med. 2025, 198, 111172. [Google Scholar] [CrossRef] [Scilit]
  16. Liu, X.; Wang, X.; Chen, D.; Zhang, H. Automatic Quantitative Coronary Analysis Based on Deep Learning. Appl. Sci. 2023, 13, 2975. [Google Scholar] [CrossRef] [Scilit]
  17. In Kim, Y.; Roh, J.-H.; Kweon, J.; Kwon, H.; Chae, J.; Park, K.; Lee, J.-H.; Jeong, J.-O.; Kang, D.-Y.; Lee, P.H.; et al. Artificial Intelligence-Based Quantitative Coronary Angiography of Major Vessels Using Deep-Learning. Int. J. Cardiol. 2024, 405, 131945. [Google Scholar] [CrossRef] [Scilit] [PubMed]
  18. Chae, J.; Kweon, J.; Park, G.-M.; Park, S.; Yoon, H.J.; Lee, C.H.; Park, K.; Lee, H.; Kang, D.-Y.; Lee, P.H.; et al. Enhancing Quantitative Coronary Angiography (QCA) with Advanced Artificial Intelligence: Comparison with Manual QCA and Visual Estimation. Int. J Cardiovasc. Imaging 2025, 41, 559–568. [Google Scholar] [CrossRef] [Scilit]
  19. Moreno-Torres, J.G.; Raeder, T.; Alaiz-Rodríguez, R.; Chawla, N.V.; Herrera, F. A Unifying View on Dataset Shift in Classification. Pattern Recognit. 2012, 45, 521–530. [Google Scholar] [CrossRef] [Scilit]
  20. Yu, A.C.; Mohajer, B.; Eng, J. External Validation of Deep Learning Algorithms for Radiologic Diagnosis: A Systematic Review. Radiol. Artif. Intell. 2022, 4, e210064. [Google Scholar] [CrossRef] [Scilit] [PubMed]
  21. Skowronski, J.; Cho, I.; Mintz, G.S.; Wolny, R.; Opolski, M.P.; Cha, M.J.; Lee, W.S.; Michalowska, I.; Kepka, C.; Kruk, M.; et al. Inter-Ethnic Differences in Normal Coronary Anatomy between Caucasian (Polish) and Asian (Korean) Populations. Eur. J. Radiol. 2020, 130, 109185. [Google Scholar] [CrossRef] [Scilit]
  22. Villadsen, P.R.; Petersen, S.E.; Dey, D.; Zou, L.; Patel, S.; Naderi, H.; Gruszczynska, K.; Baron, J.; Davies, L.C.; Wragg, A.; et al. Coronary Atherosclerotic Plaque Burden and Composition by CT Angiography in Caucasian and South Asian Patients with Stable Chest Pain. Eur. Heart J.—Cardiovasc. Imaging 2017, 18, 556–567. [Google Scholar] [CrossRef] [Scilit]
  23. Nobre Menezes, M.; Silva, J.L.; Silva, B.; Rodrigues, T.; Guerreiro, C.; Guedes, J.P.; Santos, M.O.; Oliveira, A.L.; Pinto, F.J. Coronary X-Ray Angiography Segmentation Using Artificial Intelligence: A Multicentric Validation Study of a Deep Learning Model. Int. J. Cardiovasc. Imaging 2023, 39, 1385–1396. [Google Scholar] [CrossRef] [Scilit]
  24. Fischell, T.A.; Maheshwari, A.; Mirza, R.A.; Haller, S.; Carter, A.J.; Popma, J.J. Impact of Frame Selection on Quantitative Coronary Angiographic Analysis after Coronary Stenting. Cathet. Cardio Interv. 2005, 64, 460–467. [Google Scholar] [CrossRef] [Scilit]
  25. Ito, S.; Kinoshita, K.; Endo, A.; Nakamura, M. Impact of Cine Frame Selection on Quantitative Coronary Angiography Results. Clin. Med. Insights Cardiol. 2019, 13, 1–10. [Google Scholar] [CrossRef] [Scilit] [PubMed]
  26. Yang, S.; Kweon, J.; Roh, J.-H.; Lee, J.-H.; Kang, H.; Park, L.-J.; Kim, D.J.; Yang, H.; Hur, J.; Kang, D.-Y.; et al. Deep Learning Segmentation of Major Vessels in X-Ray Coronary Angiography. Sci. Rep. 2019, 9, 16897. [Google Scholar] [CrossRef] [Scilit] [PubMed]
  27. Vrints, C.; Andreotti, F.; Koskinas, K.C.; Rossello, X.; Adamo, M.; Ainslie, J.; Banning, A.P.; Budaj, A.; Buechel, R.R.; Chiariello, G.A.; et al. 2024 ESC Guidelines for the Management of Chronic Coronary Syndromes. Eur. Heart J. 2024, 45, 3415–3537. [Google Scholar] [CrossRef] [Scilit]
  28. Nobre Menezes, M.; Silva, B.; Silva, J.L.; Rodrigues, T.; Marques, J.S.; Guerreiro, C.; Guedes, J.P.; Oliveira-Santos, M.; Oliveira, A.L.; Pinto, F.J. Segmentation of X-ray Coronary Angiography with an Artificial Intelligence Deep Learning Model: Impact in Operator Visual Assessment of Coronary Stenosis Severity. Cathet. Cardio Interv. 2023, 102, 631–640. [Google Scholar] [CrossRef] [Scilit]
  29. Moon, J.H.; Lee, D.Y.; Cha, W.C.; Chung, M.J.; Lee, K.-S.; Cho, B.H.; Choi, J.H. Automatic Stenosis Recognition from Coronary Angiography Using Convolutional Neural Networks. Comput. Methods Programs Biomed. 2021, 198, 105819. [Google Scholar] [CrossRef] [Scilit]
  30. Cong, C.; Kato, Y.; Vasconcellos, H.D.; Lima, J.; Venkatesh, B. Automated Stenosis Detection and Classification in X-Ray Angiography Using Deep Neural Network. In Proceedings of the 2019 IEEE International Conference on Bioinformatics and Biomedicine (BIBM), San Diego, CA, USA, 18–21 November 2019; pp. 1301–1308. [Google Scholar]
  31. Kim, Y.; Yoon, H.-J.; Suh, J.; Kang, S.-H.; Lim, Y.-H.; Jang, D.H.; Park, J.H.; Shin, E.-S.; Bae, J.-W.; Lee, J.H.; et al. Artificial Intelligence–Based Fully Automated Quantitative Coronary Angiography vs Optical Coherence Tomography–Guided PCI (FLASH Trial). JACC Cardiovasc. Interv. 2024, 18, 187–197. [Google Scholar] [CrossRef] [Scilit] [PubMed]
  32. Lawton, J.S.; Tamis-Holland, J.E.; Bangalore, S.; Bates, E.R.; Beckie, T.M.; Bischoff, J.M.; Bittl, J.A.; Cohen, M.G.; Dimaio, J.M.; Don, C.W.; et al. 2021 ACC/AHA/SCAI Guideline for Coronary Artery Revascularization: A Report of the American College of Cardiology/American Heart Association Joint Committee on Clinical Practice Guidelines. Circulation 2022, 145, E18–E114. [Google Scholar] [CrossRef] [Scilit] [PubMed]
  33. Ninomiya, K.; Serruys, P.W.; Kotoku, N.; Zhou, J.; Kageyama, S.; Masuda, S.; Revaiah, P.C.; Wang, B.; He, X.; Tsai, T.-Y.; et al. Anonymous Comparison of Various Angiography-Derived Fractional Flow Reserve Software with Pressure-Derived Physiological Assessment. JACC Cardiovasc. Interv. 2023, 16, 1778–1790. [Google Scholar] [CrossRef] [Scilit] [PubMed]
  34. Eisemann, N.; Bunk, S.; Mukama, T.; Baltus, H.; Elsner, S.A.; Gomille, T.; Hecht, G.; Heywang-Köbrunner, S.; Rathmann, R.; Siegmann-Luz, K.; et al. Nationwide Real-World Implementation of AI for Cancer Detection in Population-Based Mammography Screening. Nat. Med. 2025, 31, 917–924. [Google Scholar] [CrossRef] [Scilit] [PubMed]
Figure 1. Flow chart of this study.
Cardiovascmed 29 00010 g001
Figure 2. Representative examples comparing artificial intelligence-based quantitative coronary angiography (AI-QCA) and manual quantitative coronary angiography (QCA) with automated frame selection: (a) AI-QCA and manual QCA detected the same lesion in the identical frame; (b) AI-QCA and manual QCA detected the same lesion in different frames; (c) AI-QCA failed to detect target lesions. (d) Schematic illustration of QCA measurements.
Cardiovascmed 29 00010 g002
Figure 3. Scatter plots and Bland–Altman plots between artificial intelligence-based quantitative coronary angiography (AI-QCA) and manual quantitative coronary angiography (QCA) based on the automated frame selection. Upper panels: In the scatter plots, the solid line represents the regression line derived from the slope and intercept calculated using Passing–Bablok regression. Lower panels: In the Bland–Altman plots, the x-axis represents the mean of the two measurements, and the y-axis represents the difference (AI-QCA minus manual QCA).
Cardiovascmed 29 00010 g003
Table 1. Baseline characteristics and quantitative coronary angiography measurements.
Demographic VariablesMULTISTARS AMI
(n = 112)
USZ General Consent
(n = 140)
p Value
Race/Nationality 0.968
 Caucasian109 (97.3%)135 (96.4%)
 Non-Caucasian3 (2.7%)5 (3.6%)
Sex 1.000
 Male20 (17.9%)25 (17.9%)
 Female92 (82.1%)115 (82.1%)
Age63.5 ± 12.165.6 ± 12.50.179
BMI27.6 ± 5.028.1 ± 5.30.399
Angiographic characteristics
Manual QCA
 Number of lesions334222
 %DS46.5 ± 12.542.3 ± 10.9<0.001
 LL20.5 ± 11.921.3 ± 12.30.439
AI-QCA based on the automated frame selection
 Number of lesions identified291 (87%)188 (85%)0.490
 %DS difference1.0 ± 4.60.5 ± 5.10.276
AI-QCA based on the manual frame selection
 Number of lesions identified 1334 (100%)222 (100%)1.000
 %DS difference1.1 ± 2.91.0 ± 2.50.488
Values are % (n) or mean ± standard deviation. 1 ‘Number of lesions identified’ refers to the count of lesions where the MLD location determined by manual QCA falls within the lesion identified by AI-QCA. Abbreviations: USZ, University Hospital Zurich; BMI, Body Mass Index; QCA, quantitative coronary angiography; AI-QCA, artificial intelligence-based quantitative coronary angiography; %DS, percent diameter stenosis; LL, lesion length.
Disclaimer/Publisher’s Note: The statements, opinions and data contained in all publications are solely those of the individual author(s) and contributor(s) and not of MDPI and/or the editor(s). MDPI and/or the editor(s) disclaim responsibility for any injury to people or property resulting from any ideas, methods, instructions or products referred to in the content.