Two-dimensional speckle tracking echocardiography (2DSTE) has been recommended as a helpful tool for quantifying left ventricular (LV) function and for prognosis [1–3]. By angle-independent tracking of small myocardial features frame to frame within grayscale B-mode images, local displacement is used to measure myocardial deformation (strain), strain rate and myocardial velocities, in any direction within the image plane [4]. This new method has been validated against sonomicrometry [4,5], tagged magnetic resonance imaging [6] and clinically against Doppler tissue imaging (DTI) [7].
Using the 16- to 18-segment bullseye map, regional as well as global average strain can be evaluated [1]. Longitudinal strain, especially global longitudinal strain (GLS), has shown excellent reproducibility [8,9]. GLS has been recommended for diagnosis of coronary artery disease and myocardial ischaemia, especially in combination with wall motion score index [10,11], to evaluate prognosis in patients with heart failure [12–14], to diagnose amyloid heart disease [15] and to assess myocardial function in patients with diabetes [16], various cardiomyopathies including hypertrophic cardiomyopathy, valvular heart disease [17,18], or congenital heart disease [8,19].
Even though a GLS value of >19.7% was considered a normal value in a recent meta-analysis [20], a GLS value of >16–18% has been recommended as the cut-off limit for normal versus abnormal [21,22]. However, there is no official cut-off recommended in the recently published guidelines [23]. Little is known about the feasibility, impact and reproducibility of 2DSTE in daily practice [24].
The aim of this study was to evaluate feasibility and intra- and interobserver variability of 2DSTE in daily practice in consecutive patients, to analyse its clinical impact when used by experienced physicians in their daily work with patients, and to identify reasonable and advisable cutoffs of average GLS for routine practice.
Methods
Study Population
All consecutive patients undergoing standard transthoracic echocardiography at the Cardiovascular Centre Zürich, Klinik Im Park, Zürich, Switzerland, between 1 October 2013 and 31 January 2014 were included in this study. There were 482 patients, and every patient was included only once, even if they were examined several times (in which case, only the last study was included).
Demographic and clinical characteristics including age and gender, clinical parameters such as body mass index (BMI), cardiovascular risk factors (arterial hypertension, coronary artery disease and diabetes) and additional information (rhythm, bundle-branch block, pacemaker rhythm) were acquired from the patient’s medical record.
The study was approved by the local ethics committee and patient consent forms were present according to its guidelines.
Echocardiographic Image Acquisition
Echocardiographic Parameters
Standard transthoracic echocardiography was performed on all patients at rest in the supine position, according to guidelines [25]. Left ventricular end-diastolic diameter, end-diastolic volume, end-systolic diameter, shortening fraction, muscle mass index and ejection fraction, regional wall motion and diastolic function were measured and assessed as recommended by the European Association of Echocardiography [25–27]. Pulmonary hypertension was defined as an estimated systolic right ventricular pressure of ≥36 mm Hg and measured as previously recommended [28].
Acquisition of Myocardial Strain Images
In addition, 2DSTE was attempted from the three apical views, resulting in average GLS values. The frame rate was at least 50 frames per second as recommended [29]. GLS, which analyses myocardial deformation (relative length change of the LV myocardium between end-diastole and end-systole), was evaluated using the three apical views (apical long axis, apical two-chamber and apical four-chamber view). GLS was calculated by averaging the peak strain values of the 18 segments [30]. The semi-automatic AFI algorithm (Automated Function Imaging, GE Healthcare, Horten, Norway) was used.
All diagnoses, echocardiographic parameters and image quality (excellent, average, poor) were prospectively collected and analysed.
If two or more of the 18 segments could not be analysed, GLS was defined as not feasible. All studies were done with the GE Vingmed System E9 4D BT12 and analysed during the study (or offline for inter- and intra- observer reliability on the Echopac system).
Reproducibility of 2D Speckle Tracking Echocardiographic Study Data
In order to assess intraobserver variability, 2DSTEs and measurements of GLS were repeated in 54 randomly selected subjects. For interobserver variability, 2D strain was analysed in 60 patients by a second experienced observer who was unaware of the results of the first observer. These 60 patients were selected to be a balanced sample representative of the three classes of image quality.
Statistical Analysis
Continuous data are expressed as means and standard deviations, nominal data as frequencies with percentages. Results are displayed in tables or as correlation plots in the figures. Student’s t test was used to compare continuous data. A p-values of <0.05 was considered statistically significant. Inter- and intraobserver reliability was assessed using intraclass correlation coefficient (ICC) in a two-way mixed model (absolute agreement). The confidence interval (CI) was indicated where necessary. Categorical data are compared using the chi-square test or Fisher’s exact test as appropriate. With stepwise linear regression analysis, image quality, coronary artery disease, hypertension, diabetes, presence of scar, presence of left ventricular hypertrophy, ejection fraction, systolic blood pressure, heart rate and BMI were included in a stepwise manner, to see if the influence of these parameters on GLS remains an independent predictor of GLS (441 patients). The correlation of GLS with ejection fraction was calculated.
Statistical analysis was performed using IBM SPSS Statistics, version 22 (IBM Corp., Armonk, NY, USA).
Results
It was possible to do 2DSTE in 447 cases (92.7%). The most important reasons for inability to do 2DSTE in 35 patients (7.3%) were higher BMI (17 patients), poor image quality (14 patients, 7 of whom were obese), and/ or atrial fibrillation (11 patients). In 56% of patients with poor echoquality, GLS could not be done. In 23 of the 447 patients (5%), one or two myocardial segments could not be analysed.
The mean GLS was 17.4 ± 4.6% A GLS of less than 16% was present in 124 patients (27.7%) and of less than 18% in 211 patients (47.2%).
The baseline characteristics of the included patients (2DSTE possible) are listed in
Table 1. There were slightly more males. Mean age was 63 ± 16 years. Obesity (BMI >30 kg/m2) was present in 13%. There was a high prevalence of arterial hypertension and known coronary artery disease. Atrial fibrillation was present in 5.6% of patients. Hypertrophic cardiomyopathy and amyloidosis were rare. GLS correlated best with left ventricular ejection fraction (
Figure 1). In patients with GLS <18%, a higher age, male gender, hypertension, obesity, left bundle-branch block, coronary artery disease, diabetes and arrhythmias were more prevalent.
The echocardiographic parameters are displayed in
Table 2. Echocardiographic image quality had a significant impact on GLS: in patients with excellent image quality GLS was 18.9 ± 3.2% versus 16.4 ± 4.5% in those with poor image quality; p = 0.006. A higher BMI had an impact on image quality. In
Table 3, multivariate regression shows that GLS correlates independently with the ejection fraction, left ventricular hypertrophy, heart rate and the presence of scarring. There was no correlation of GLS with systolic blood pressure in our series.
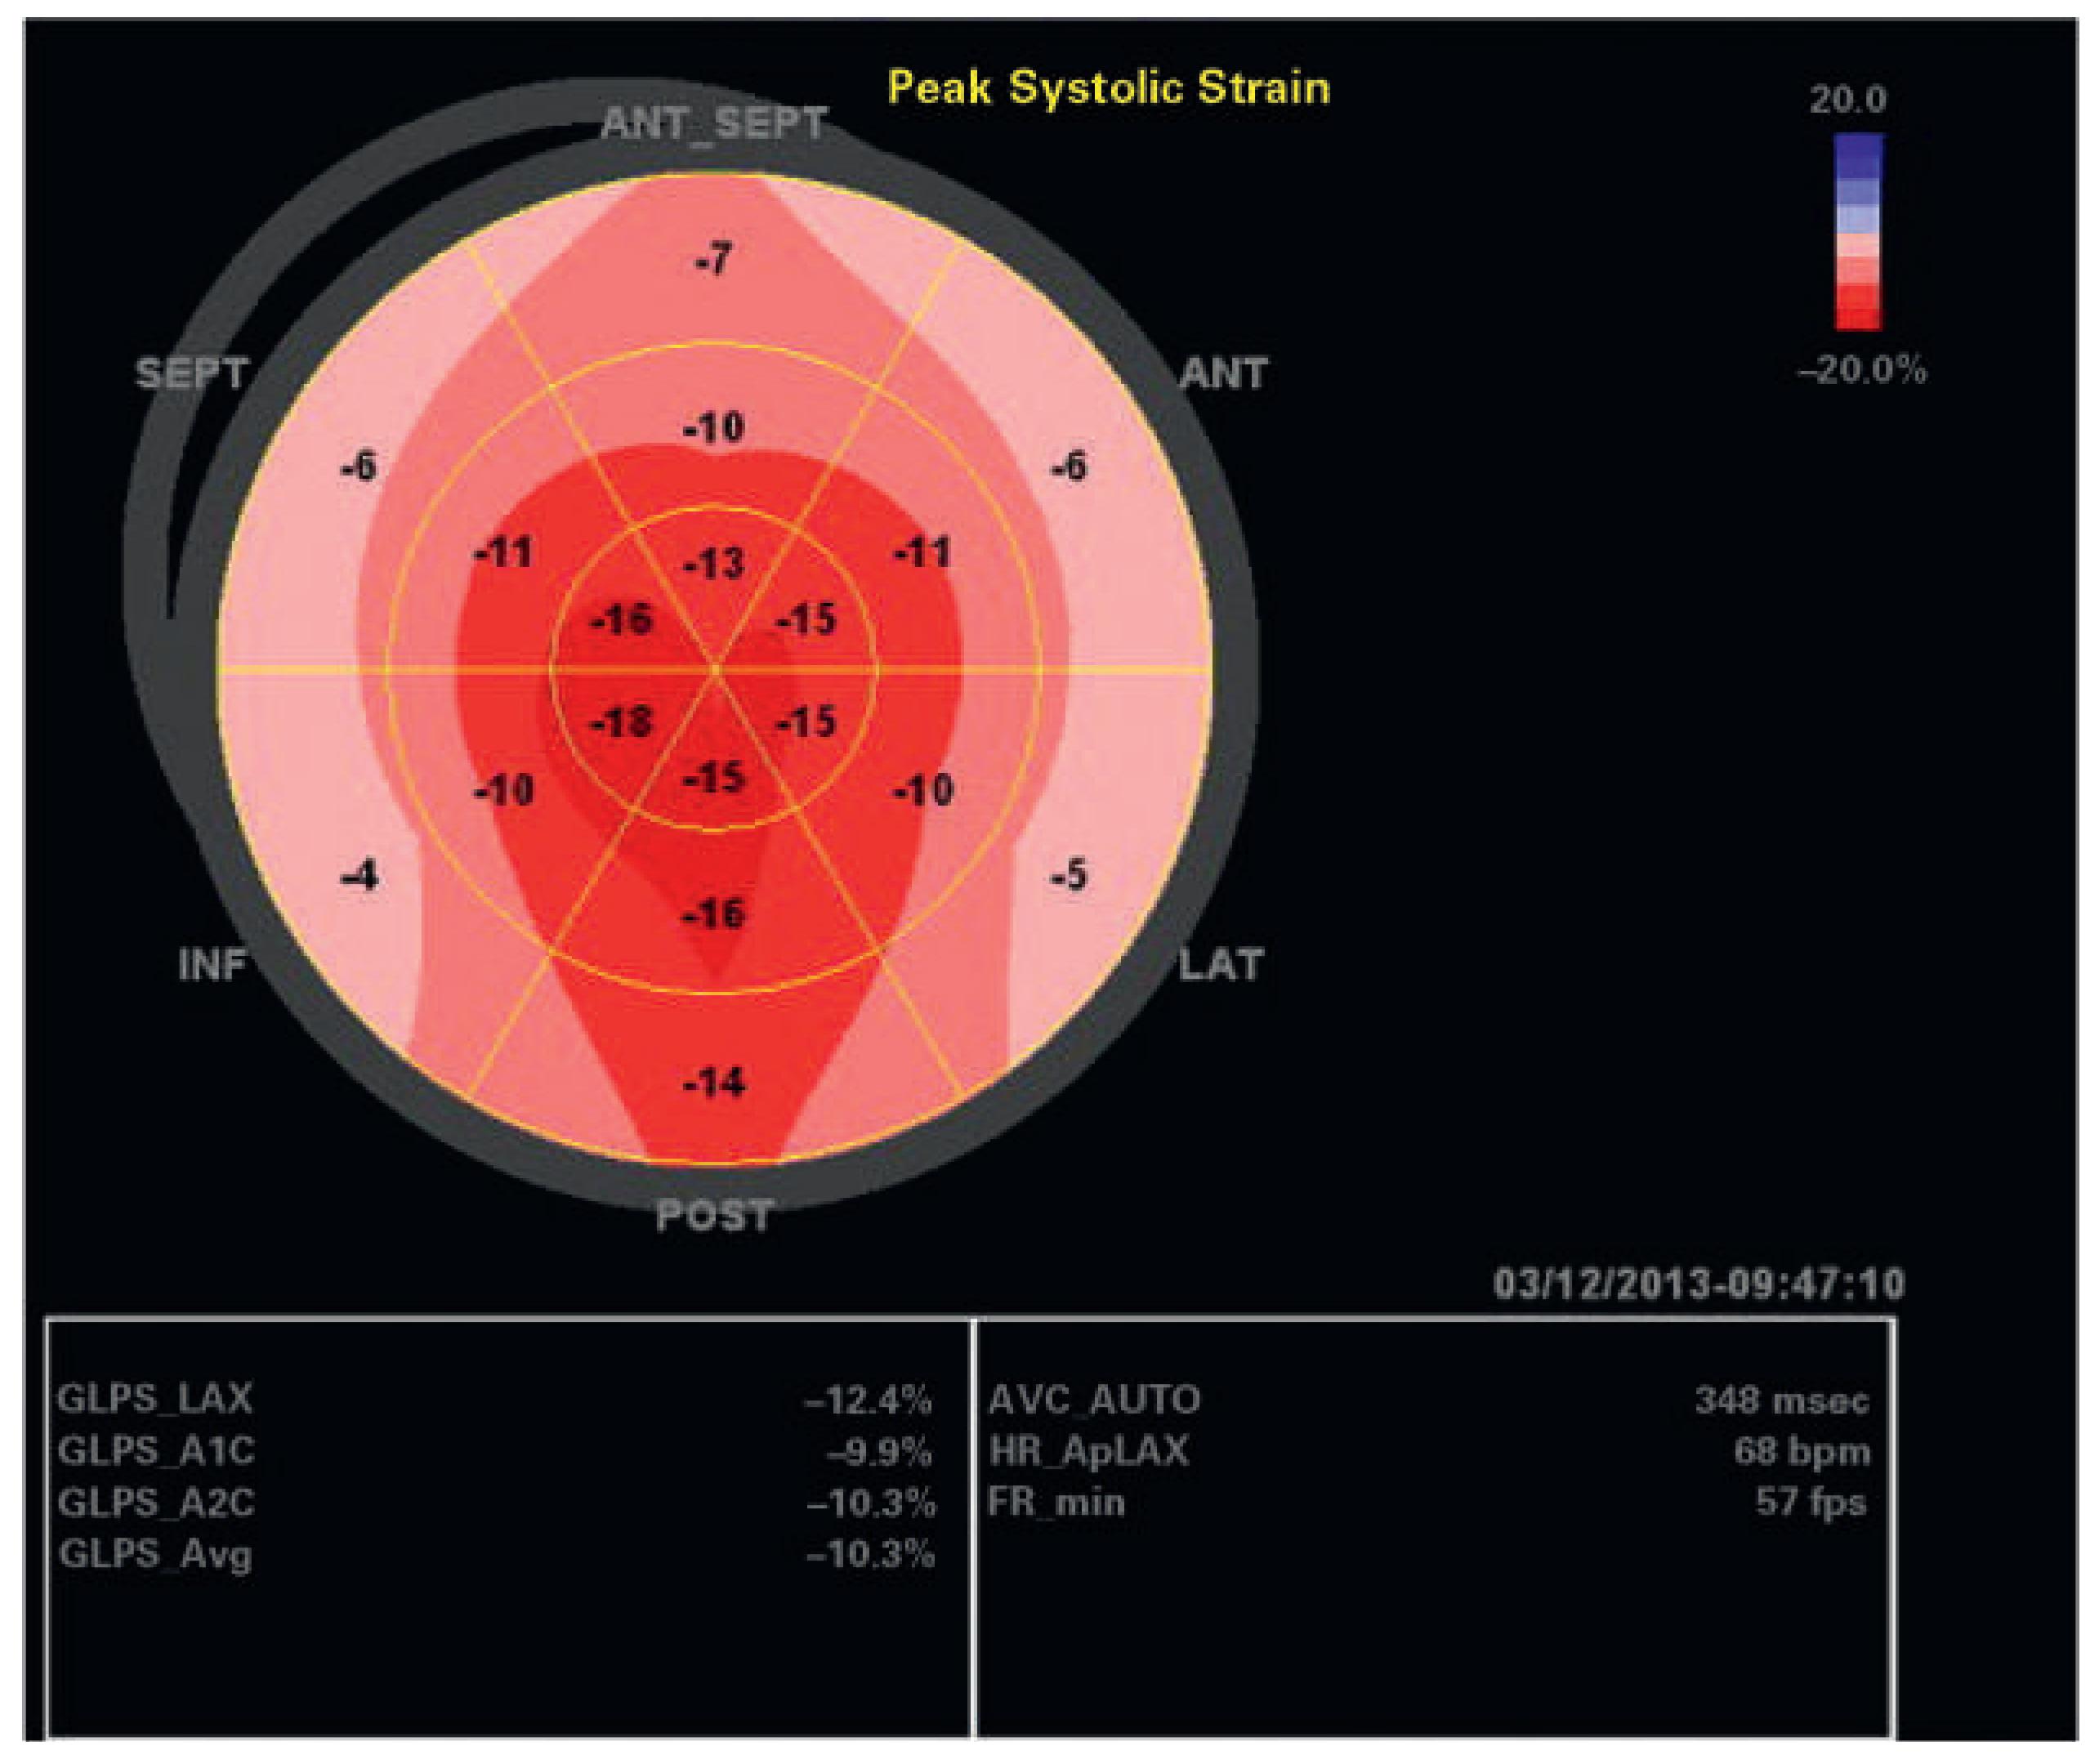
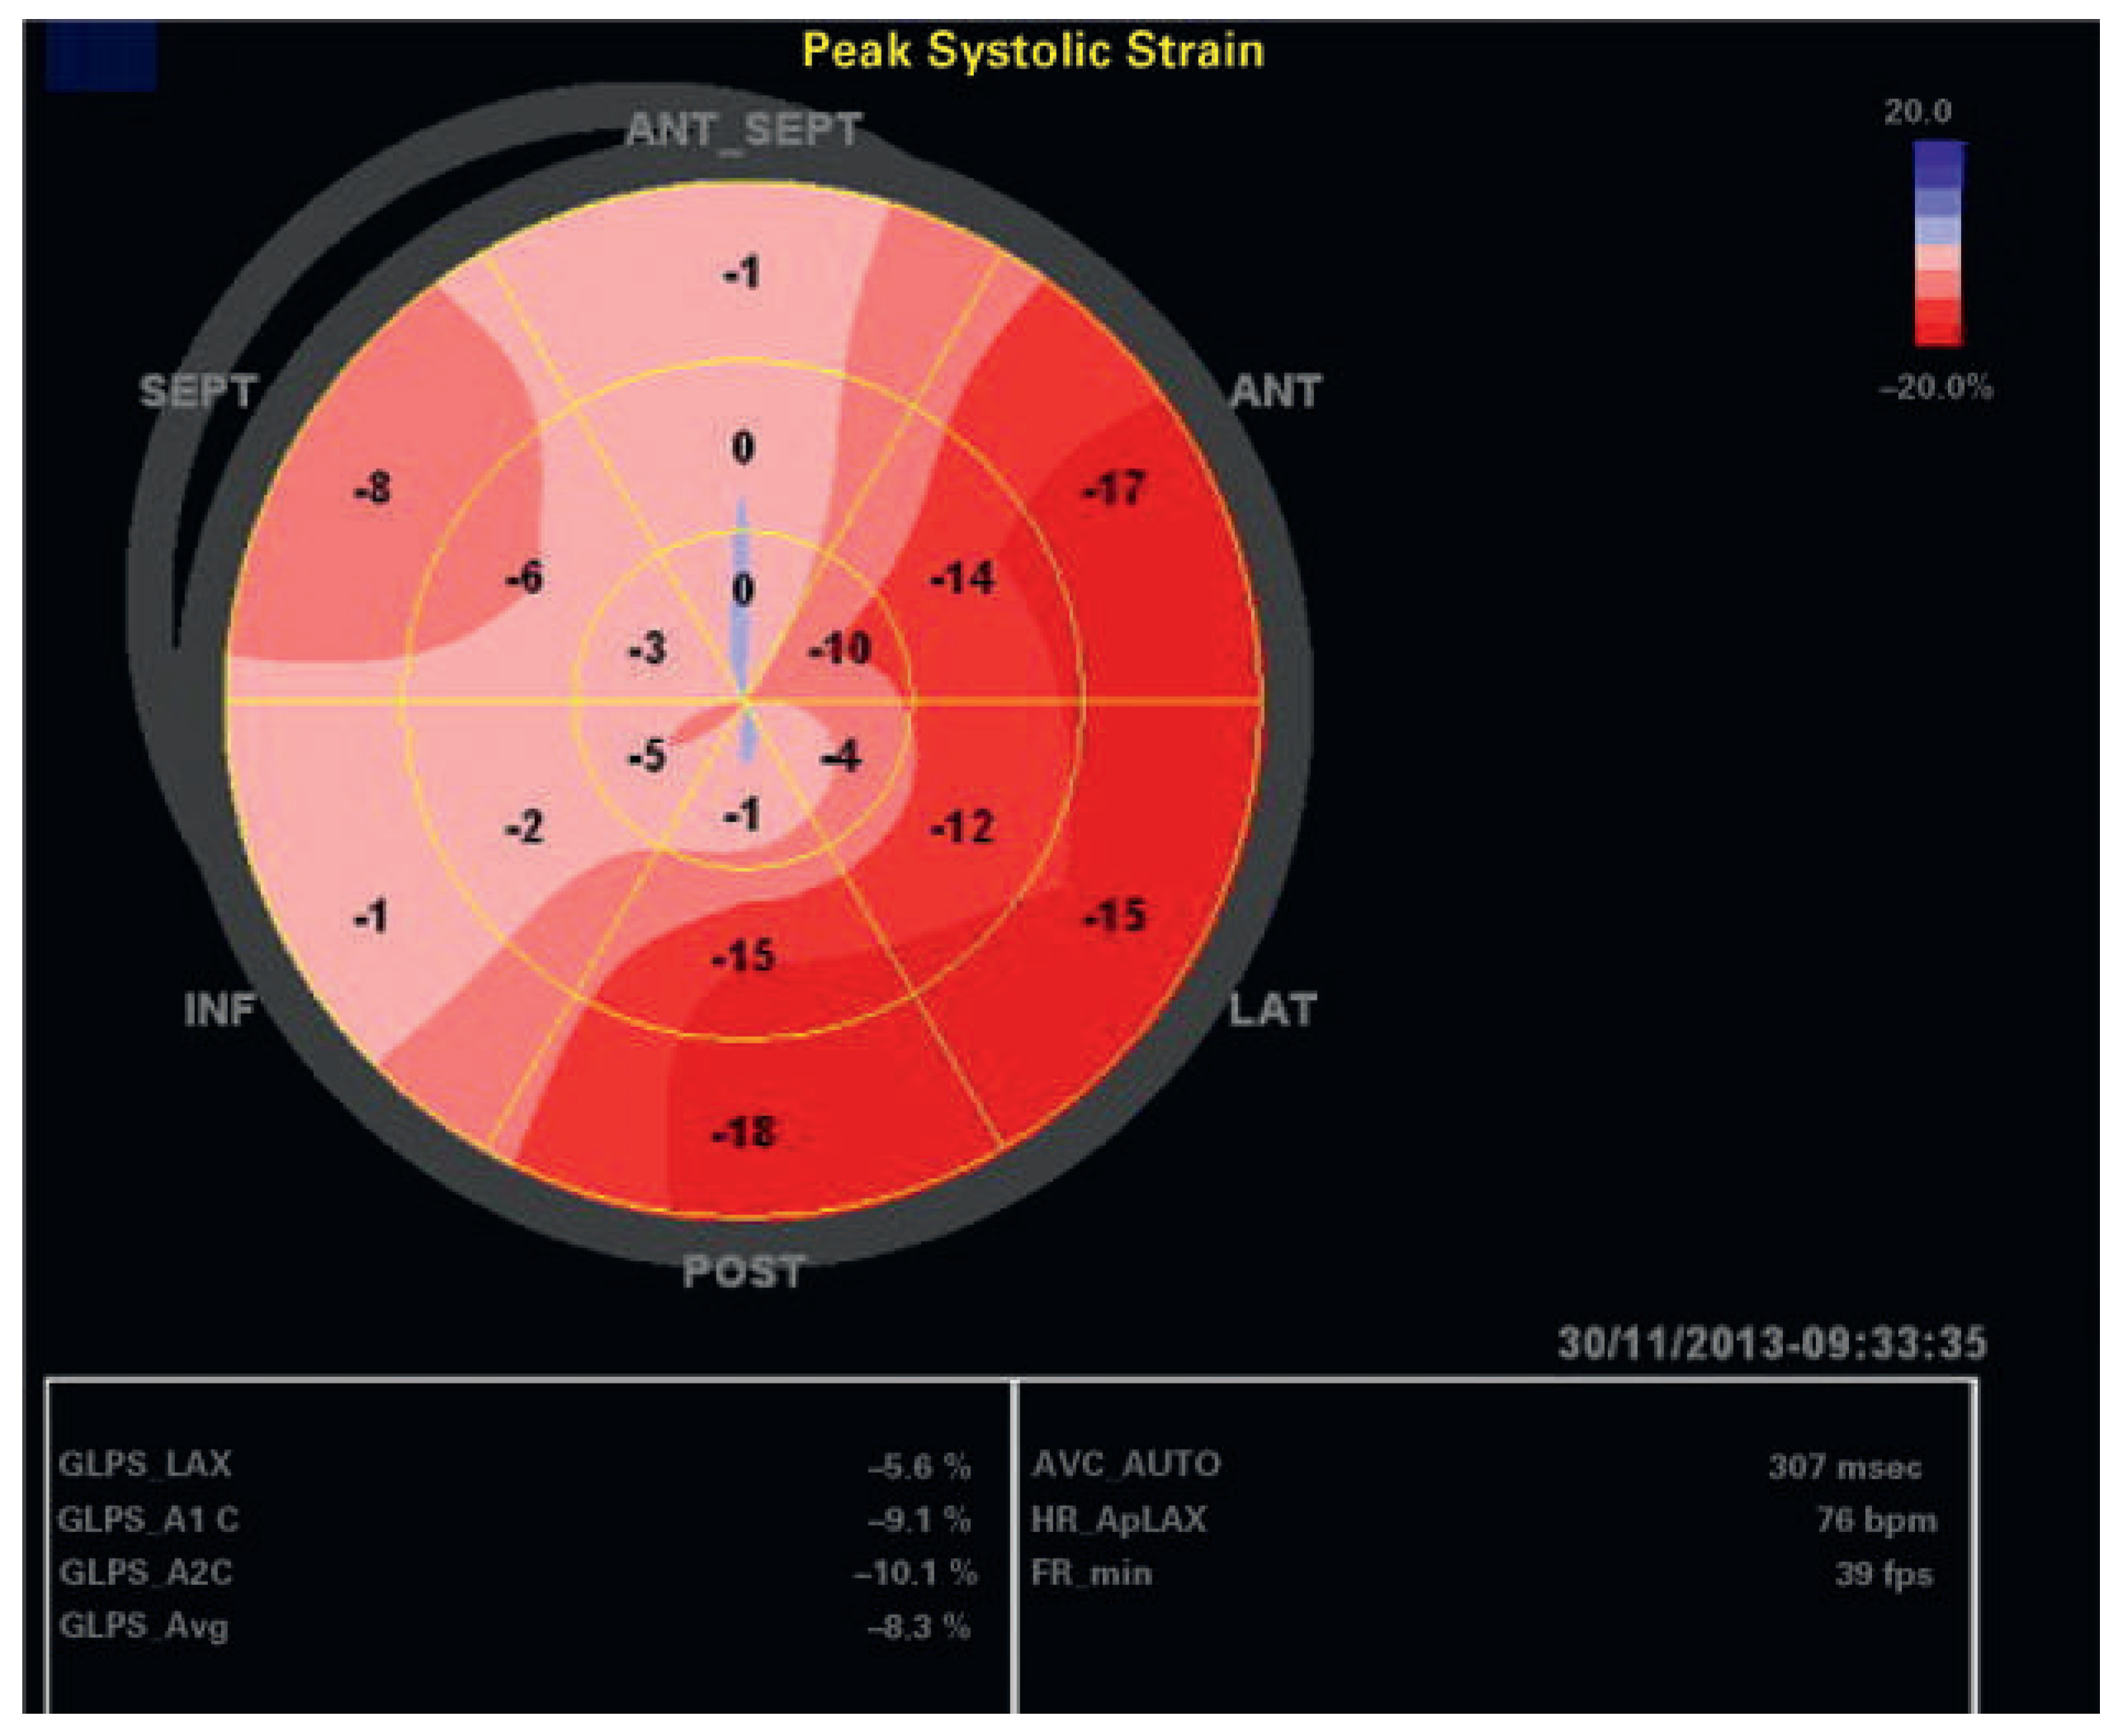
An echocardiographic examination showed a normal left ventricle (no regional wall motion abnormalities RWMA, no hypertrophy), normal diastolic function, normal heart valves and normal pulmonary artery pressure in 81 patients. In 12 of these 81 patients, GLS was <18% (15%); these patients were significantly older (p <0.001), they had significantly more often hypertension (p = 0.0002) and coronary artery disease (p = 0.02); however, there was no correlation with obesity, gender, or diabetes in this patient group. In the whole patient group, mean ejection fraction was 58 ± 10%; regional wall motion abnormalities were present in 139 patients (31%), left ventricular hypertrophy in 78 patients (17%), hypertrophy of the basal septum in 15%, and abnormal diastolic function in 164 of 396 patients (41%). Examples of individual patients are shown in
Figure 2,
Figure 3,
Figure 4 and
Figure 5. In 136 patients (30.4%), GLS provided additional information such as signs for abnormal myocardial regions (126 patients) including patients with segmental wall abnormalities of unknown aetiology and/or possible dyssynchrony, or indirect signs for possible amyloidosis (10 patients), which so far has been confirmed by myocardial biopsy in four of these patients.
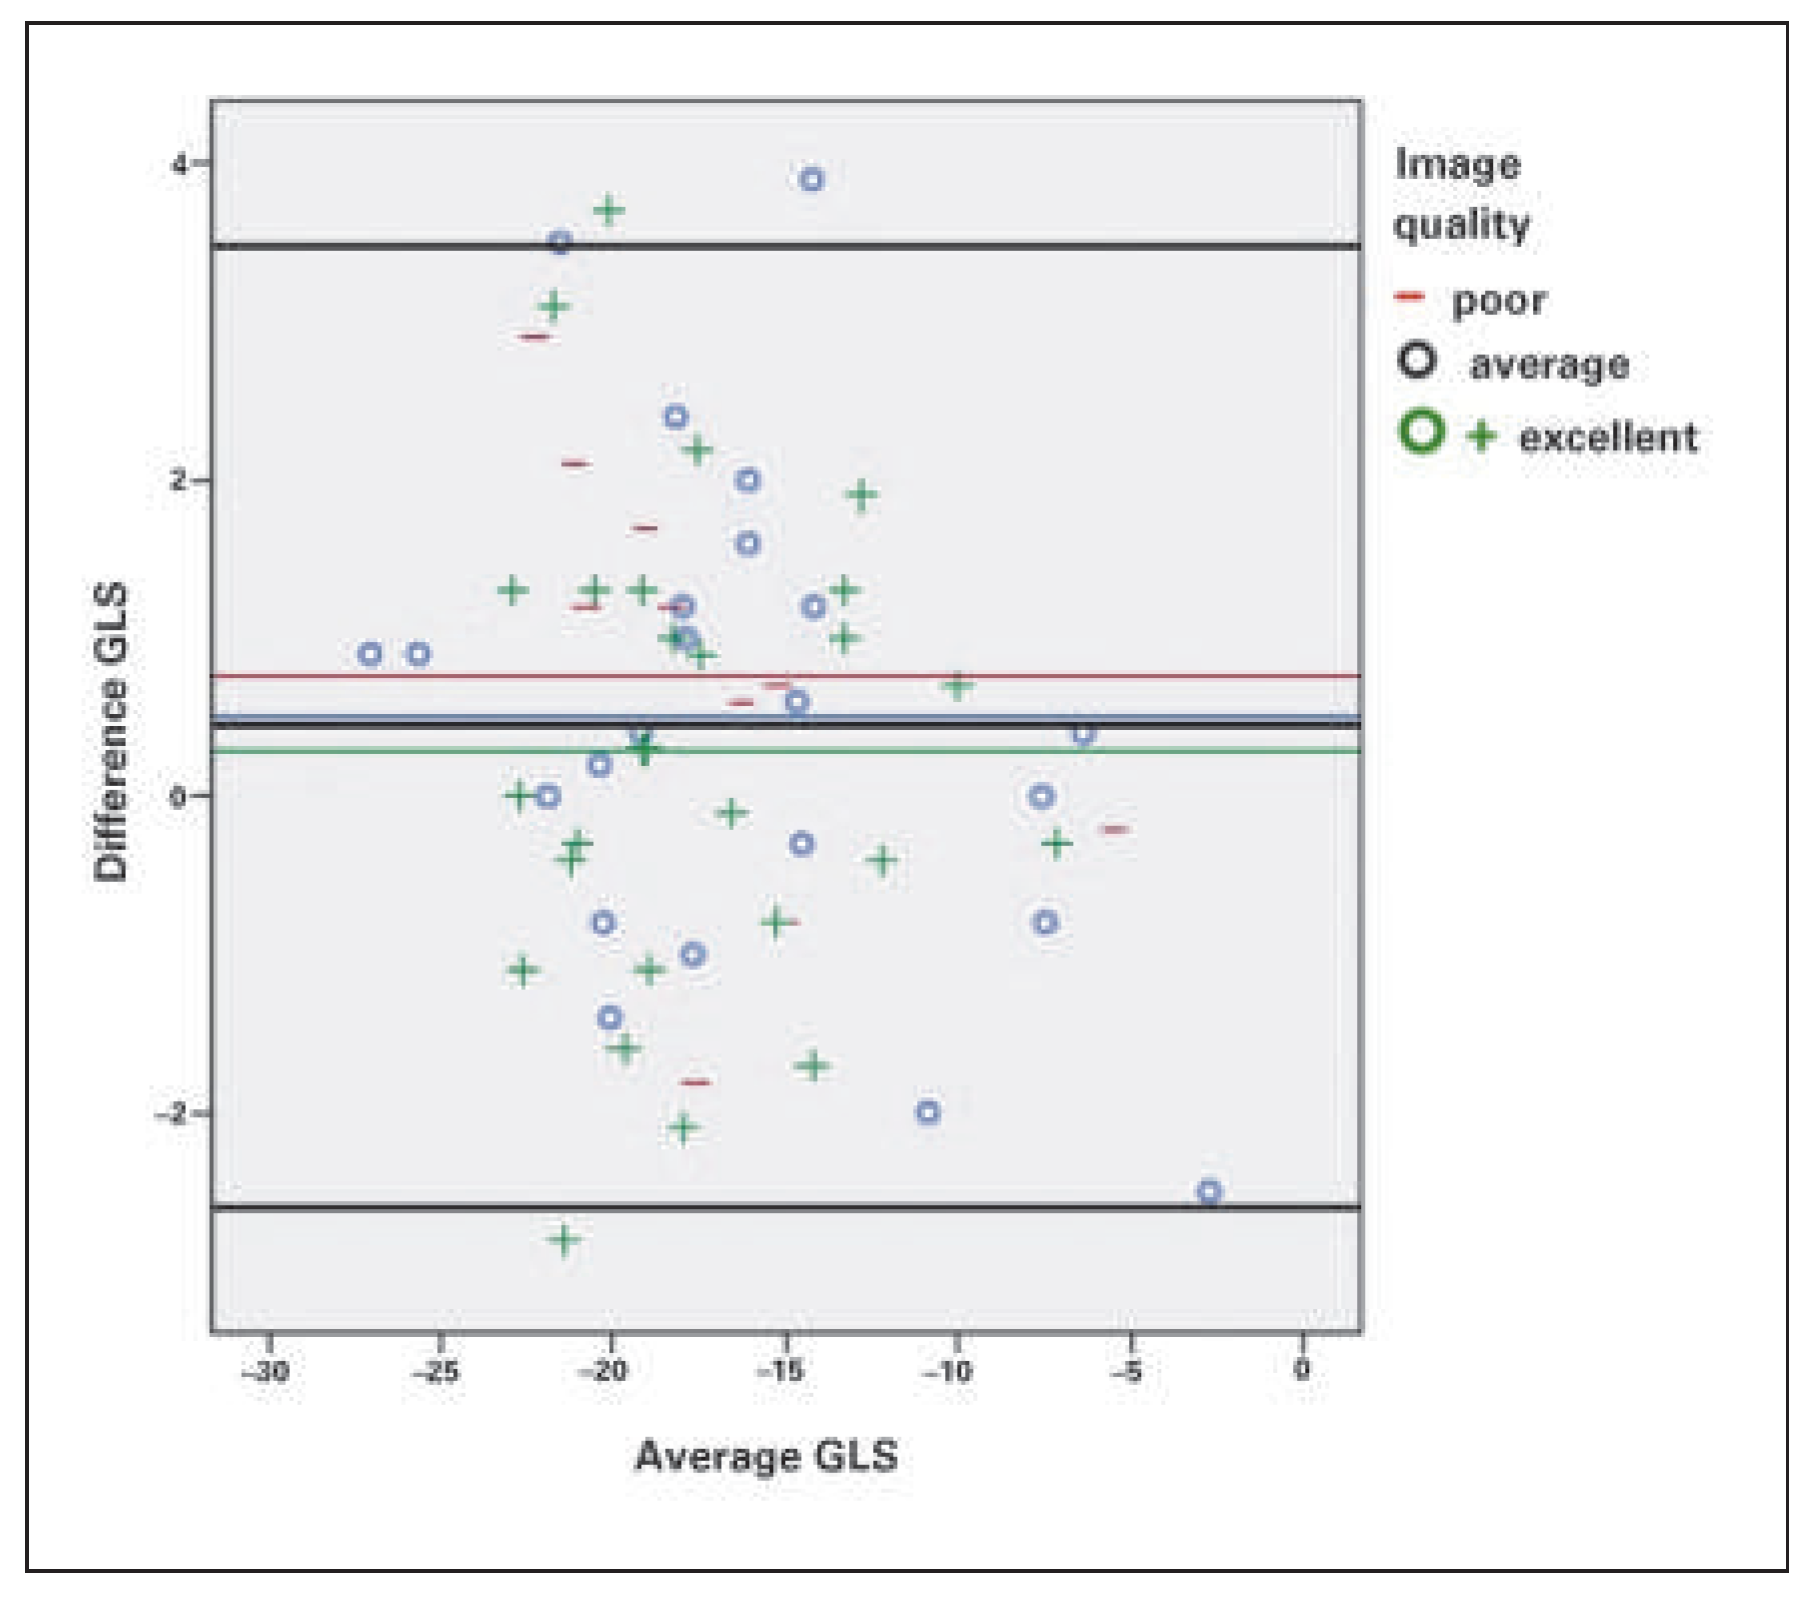
Interobserver variability was 0.952 (95% CI 0.919–0.972) and no correlation with echocardiographic quality could be seen (
Figure 6). Intraobserver variability for GLS was 0.92 (95% CI 0.861–0.952).
Discussion
Assessment of GLS with 2DSTE is feasible in most patients. Feasibility is critically dependent on image quality, BMI and the presence of atrial fibrillation. Reproducibility is good, with acceptable intra- and inter- observer variablity, and not dependent on image quality. To use any cut-off may not be reasonable as decreased values can be observed in normal hearts due to diminished image quality and abnormal segments can be present even in hearts with a rather high and thus “normal” GLS. In some patients with otherwise normal echocardiographic findings, GLS may identify subtle myocardial changes not identifiable otherwise. We are convinced that GLS provides useful additional information and should be integrated into routine practice.
Feasibility and Reproducibility
Feasibility of GLS in our patient group was excellent, at 92.7%. We could also confirm the fair correlation of GLS with left ventricular ejection fraction as previously reported. However, in patients with increased body weight, diminished echocardiographic image quality and atrial fibrillation with a high beat-to-beat heart rate variability, feasibility was diminished. Surprisingly, in patients with a limited acoustic window, assessment of longitudinal strain by speckle tracking may be more accurate than assessment of left ventricular ejection fraction, as seen in a study comparing cardiac magnetic resonance with echocardiography [34]. Thus we recommend attempting analysis of GLS in all patients, independently of image quality.
Among 36 patients with atrial fibrillation, in 25 patients, with lower beat-to-beat variability of the heart rate, GLS analysis was feasible, which results in a feasibility of 69%. Nowhere in the literature – at least according to our knowledge – has the problem of LV global longitudinal strain assessment in atrial fibrillation been discussed. In a study on the predictive value of GLS in patients undergoing mitral valve repair, 31% of the patients had atrial fibrillation [35], but there was no discussion of GLS assessment in these patients. In another study involving 507 patients, there were 36 patients with atrial fibrillation: in 19 patients with atrial fibrillation the beat-to-beat variability was too high and GLS could not be analysed, resulting in a feasibility of 47% [36]. However, in the small group of 17 patients with atrial fibrillation the correlation of GLS with left ventricular ejection fraction was excellent [36]. In our study, apart from the decreased feasibility of GLS in patients with atrial fibrillation, it was also much more time-consuming to do the analysis in these patients with atrial fibrillation, as three beats with comparable RR-intervals have first to be found. According to the literature, interobserver reproducibility of GLS measurement is quite good and definitely better than for left ventricular ejection fraction [36,37]. In our study, interobserver and intraobserver variability were quite good. However, it has to be noted that GLS may vary ±2 to ±5% depending on the reader or vendor, thus this also impacts the recommended GLS value as a cut-off for normal [38].
Depending on the underlying heart disease there are several deformation patterns suggestive of some kind of cardiac disease such as amyloidosis [32], left bundle-branch block with dyssynchrony and hypertensive heart disease [39,40]. Some deformation patterns are also typical of Fabry disease [41]. In a few patients (such as the patient of
Figure 3 with AL amyloidosis) the GLS pattern helped to diagnose the underlying condition in the study group. However, in most patients, in whom myocardial deformation was not completely normal despite an otherwise normal echocardiographic examination, it remained unclear what cardiac disease could cause the abnormality. Arterial hypertension was common in our study group, and in mild hypertensive heart disease abnormal speckle tracking with reduced myocardial velocities can occur early in the disease prior to other visible changes [42]. We have no correlation with findings of gadolinium enhancement of cardiac magnetic resonance imaging in this study group to prove or exclude, for example, underlying myocardial fibrosis. We also did not have any genetic testing performed in these patients to rule out, for example, occult hypertrophic cardiomyopathy, neuromuscular disease or Fabry disease. It is known that strain patterns in genotype-positive patients with hypertrophic cardiomyopathy can be abnormal [43] prior to echocardiographic changes. In the 81 patients with a completely normal echocardiographic examination, 5.7% had a GLS value of less than 18% and 1.6% a GLS value of less than 16%. So cut-off values might not be reasonable for every-day practice. Fourteen patients with a seemingly normal echocardiographic examination had a history of hypertension, coronary artery disease and/or diabetes; only two of these had a GLS of less than 18%, at 17.7% and 16.8%.
Limitations
During the study period, we did not routinely perform three-dimensional strain imaging in our routine practice, therefore these data apply only for two-dimensional strain imaging. Two-dimensional speckle tracking echocardiography (2DSTE) is limited as it does not track tissue motion in three dimensions; however, feasibility may be higher in two-dimensional speckle tracking than three-dimensional speckle tracking although three-dimensional speckle tracking might be less time-consuming and more exact [44]. Our data do not apply for three-dimensional strain imaging.
Image quality was graded prospectively during the echocardiographic examination as excellent, average or poor. Most examinations were classified at that time as “average”, therefore the range of “average” is wider as the goal was not to make three groups of comparable size. This may have an impact on the results as the influence of diminished image quality might be underestimated.
Currently, there are no clear guidelines how to further evaluate patients in whom speckle tracking imaging identifies abnormal myocardial segments not explained by the conventional echocardiographic findings, with the exception of patients in whom a pattern typical for cardiac amyloidosis is found where we usually recommend further evaluation including cardiac magnetic resonance imaging and/or myocardial biopsy.
There is also a known small, statistically significant vendor dependency in assessment of GLS, which can vary up to 3.7% strain units [37]. For this study, we only used Vingmed System E9 4D BT12 [45]. Our results may thus not be applied completely to other vendors.
Conclusion
Increasingly, longitudinal global strain assessment is routine for echocardiographic assessment. Analysis of left ventricular GLS with speckle tracking echocardiography 2DSTE is feasible in most patients; however, its assessment is influenced by image quality, BMI and atrial fibrillation. Reproducibility is high, with acceptable intra- and interobserver variablity. GLS can provide additional information on left ventricular abnormalities not otherwise recognised. However, abnormal discrepancies can occur – especially in the presence of suboptimal image quality. For everyday practice, reporting the mean 2DSTE-derived GLS with a comment on abnormal segments is recommended.


