Radiofrequency catheter ablation (RFA) is recommended as treatment of choice in patients with symptomatic atrioventricular nodal reentrant tachycardia (AVNRT) or orthodromic AV reentrant tachycardia (AVRT) [
1,
2]. Typical AVNRT has the electrocardiographic feature of a regular narrow complex tachycardia (unless there is a preexisting or rate dependent bundle branch block) without a visible P-wave or an in-verted P-wave at the tail of the QRS complex. In AVRT with strictly retrograde conduction (orthodromic AVRT, “concealed” pathway), the P-wave is usually separated from the QRS complex, but may also be “buried” in the T-wave [
3]. Although AVNRT can usually be ablated via a right-sided approach, >50% of AVRT ablations target left-sided pathways [
4]. This necessitates transseptal puncture or, in some cases, can entail retrograde access through the aorta and the aortic valve. Both procedures are associated with rare, but potentially severe complications.
The aim of the study was to evaluate the usefulness of careful interpretation of a 12-lead ECG recorded during tachycardia and specific history taking to differentiate between AVNRT and AVRT.
Methods
The study consisted of two parts. In the first part we analysed how unerringly AVNRT can be distinguished from AVRT based only on the 12-lead ECG recording of the tachycardia. From the database of the University Hospital of Basel, patients who underwent RFA for a reentrant tachycardia between October 2011 and July 2013 were screened. One of the authors (J.S.) identified 116 patients with a definite diagnosis of either AVNRT or orthodromic AVRT, as it was noted in the ablation protocol. In 50 patients, a 12-lead ECG recorded during a previous arrhythmia episode could be extracted from the charts by one of the authors (J.S.) and included in the analysis. All 50 ECGs were then presented in a blinded way to three physicians on a different training level: to an attending electrophysiologist (B.S.), to a fellow working in the electrophysiology unit (F.R.) and to a fellow with a specific interest in ECGs of patients with tachycardias (S.G.). To reach a diagnosis of AVNRT, S.G. used meticulously specific criteria that she took from the guideline paper [
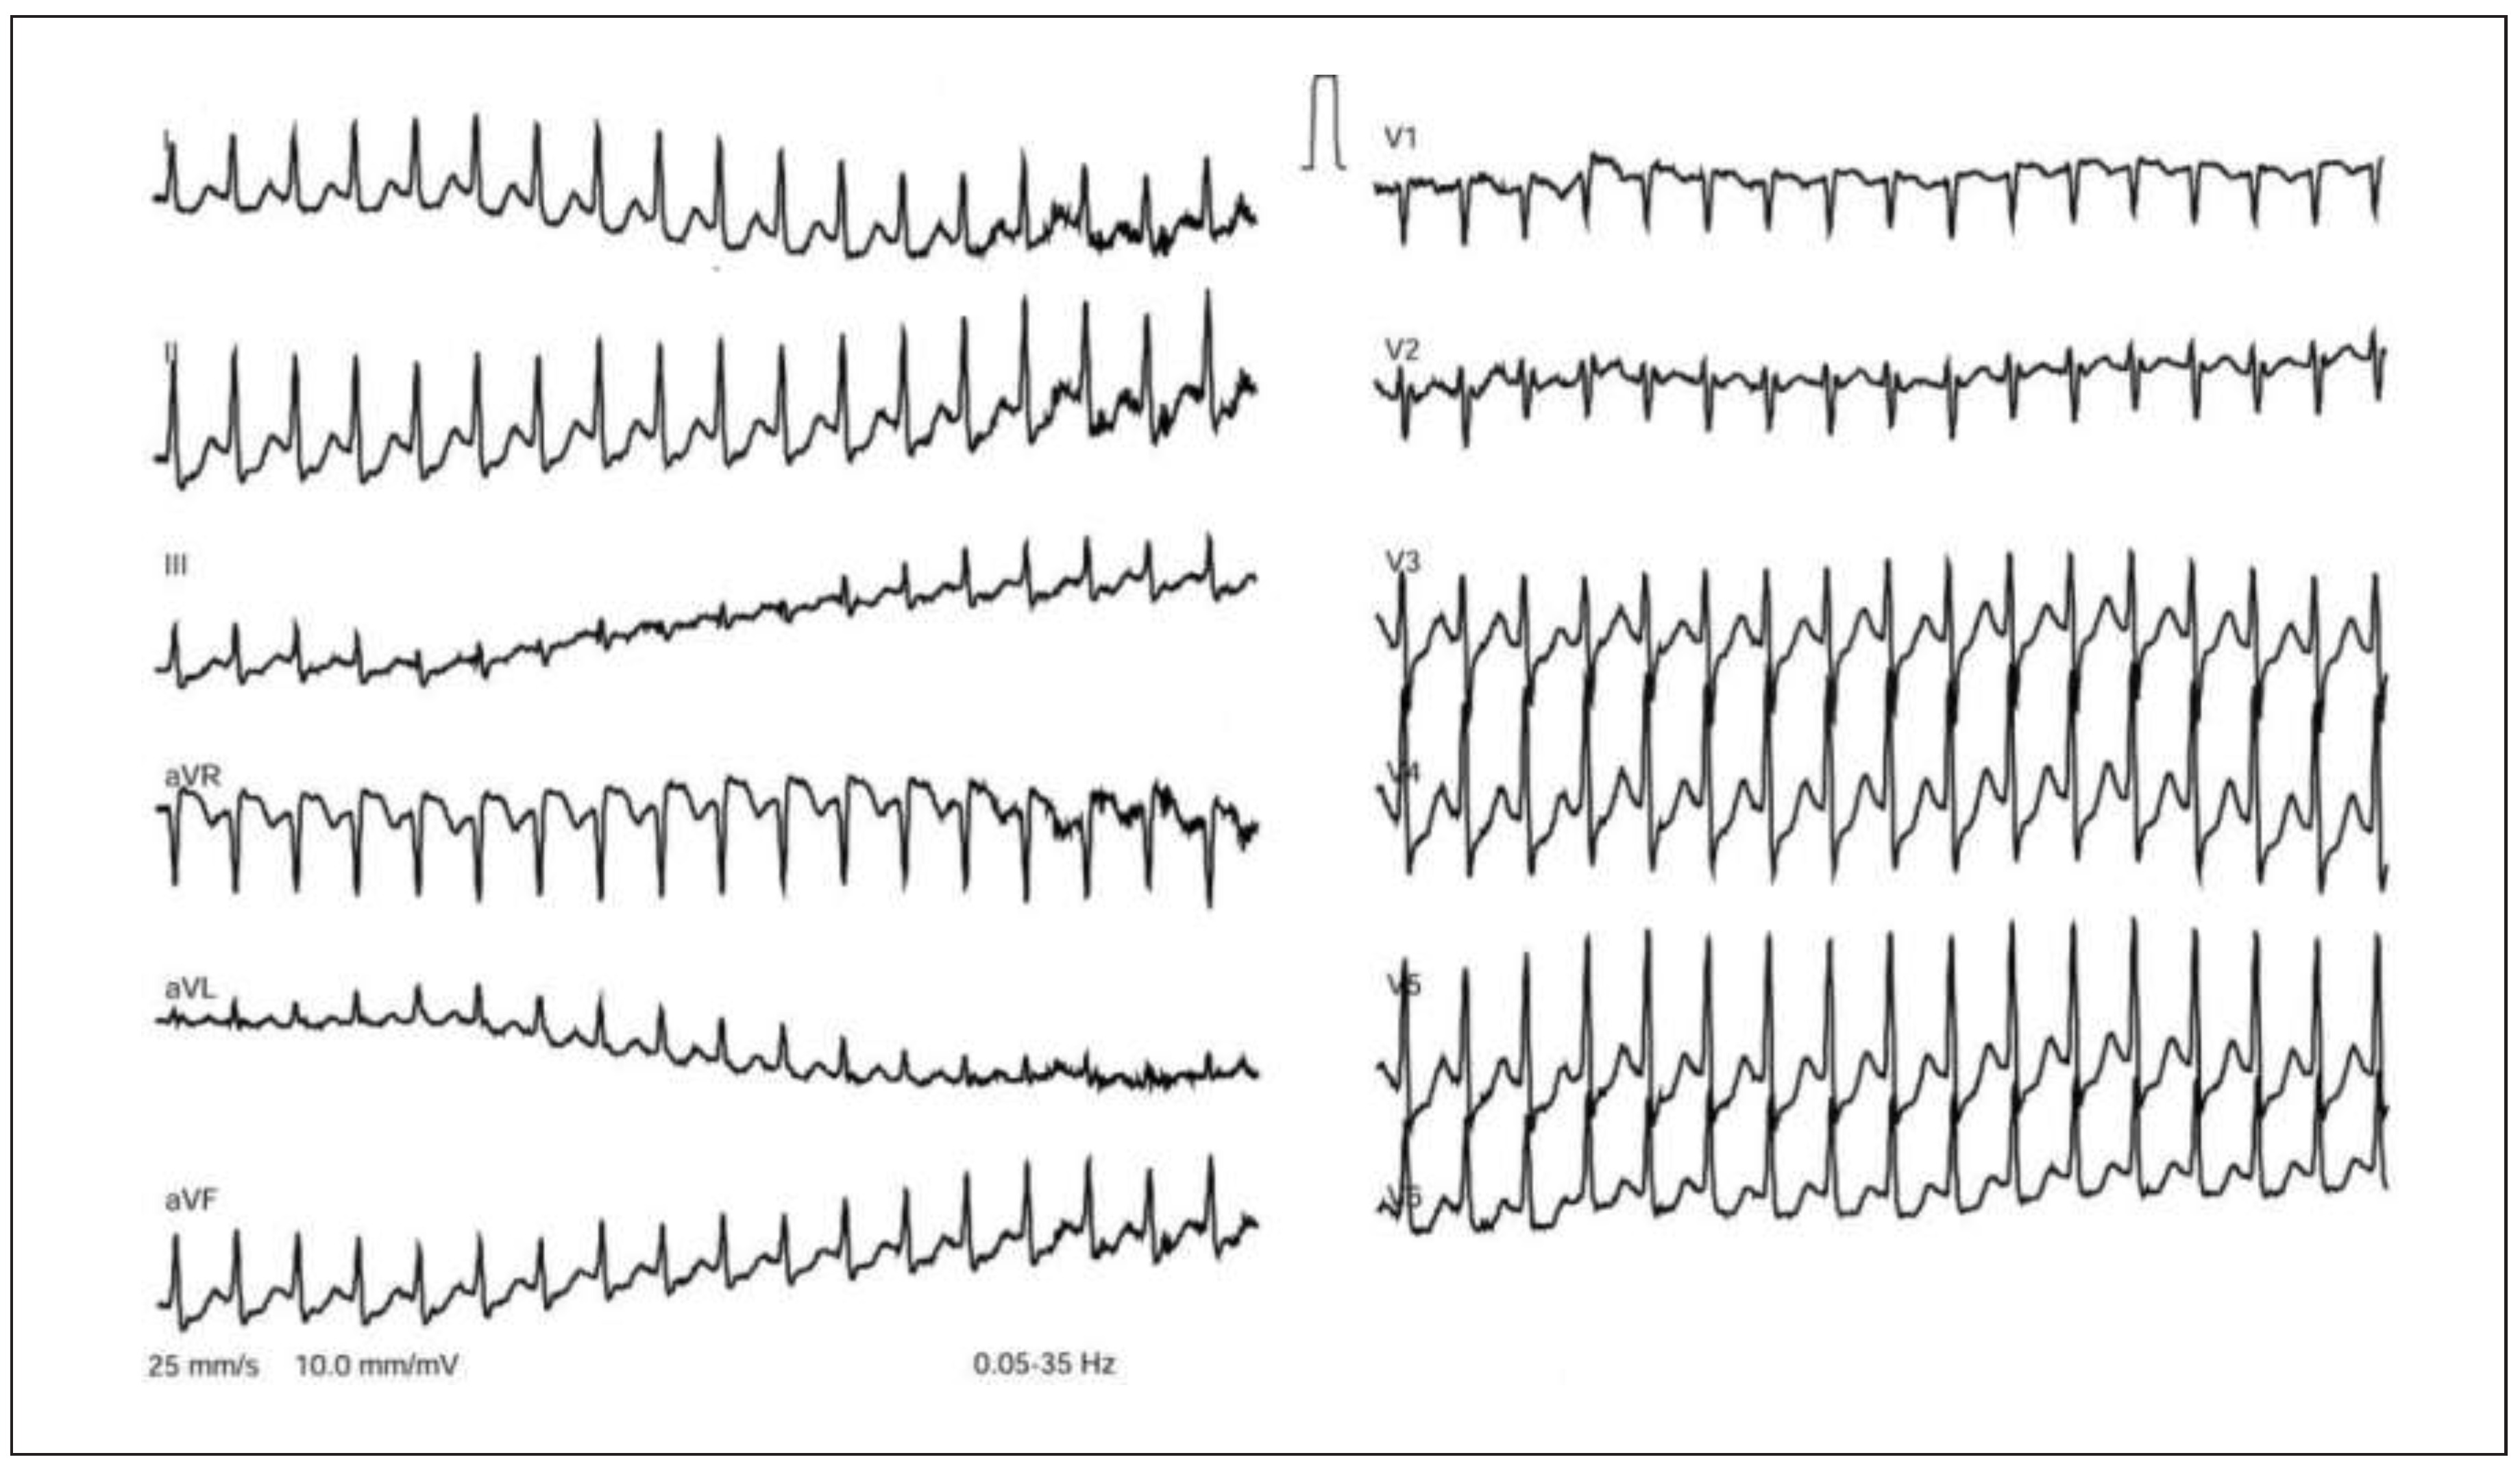
1]. They included a short RP interval of <70 ms, presence of a pseudoR in V1, a pseudoS in V1 or the inferior leads and a P-wave duration of <40 ms. However, individual decisions were taken as well. B.S. and F.R. made their diagnosis to the best of their knowledge probably with implicit application of some features just mentioned. Of note, no flow chart was given to the three physicians. Some of the features mentioned will be discussed with the three tutorial ECGs in
Figure 2,
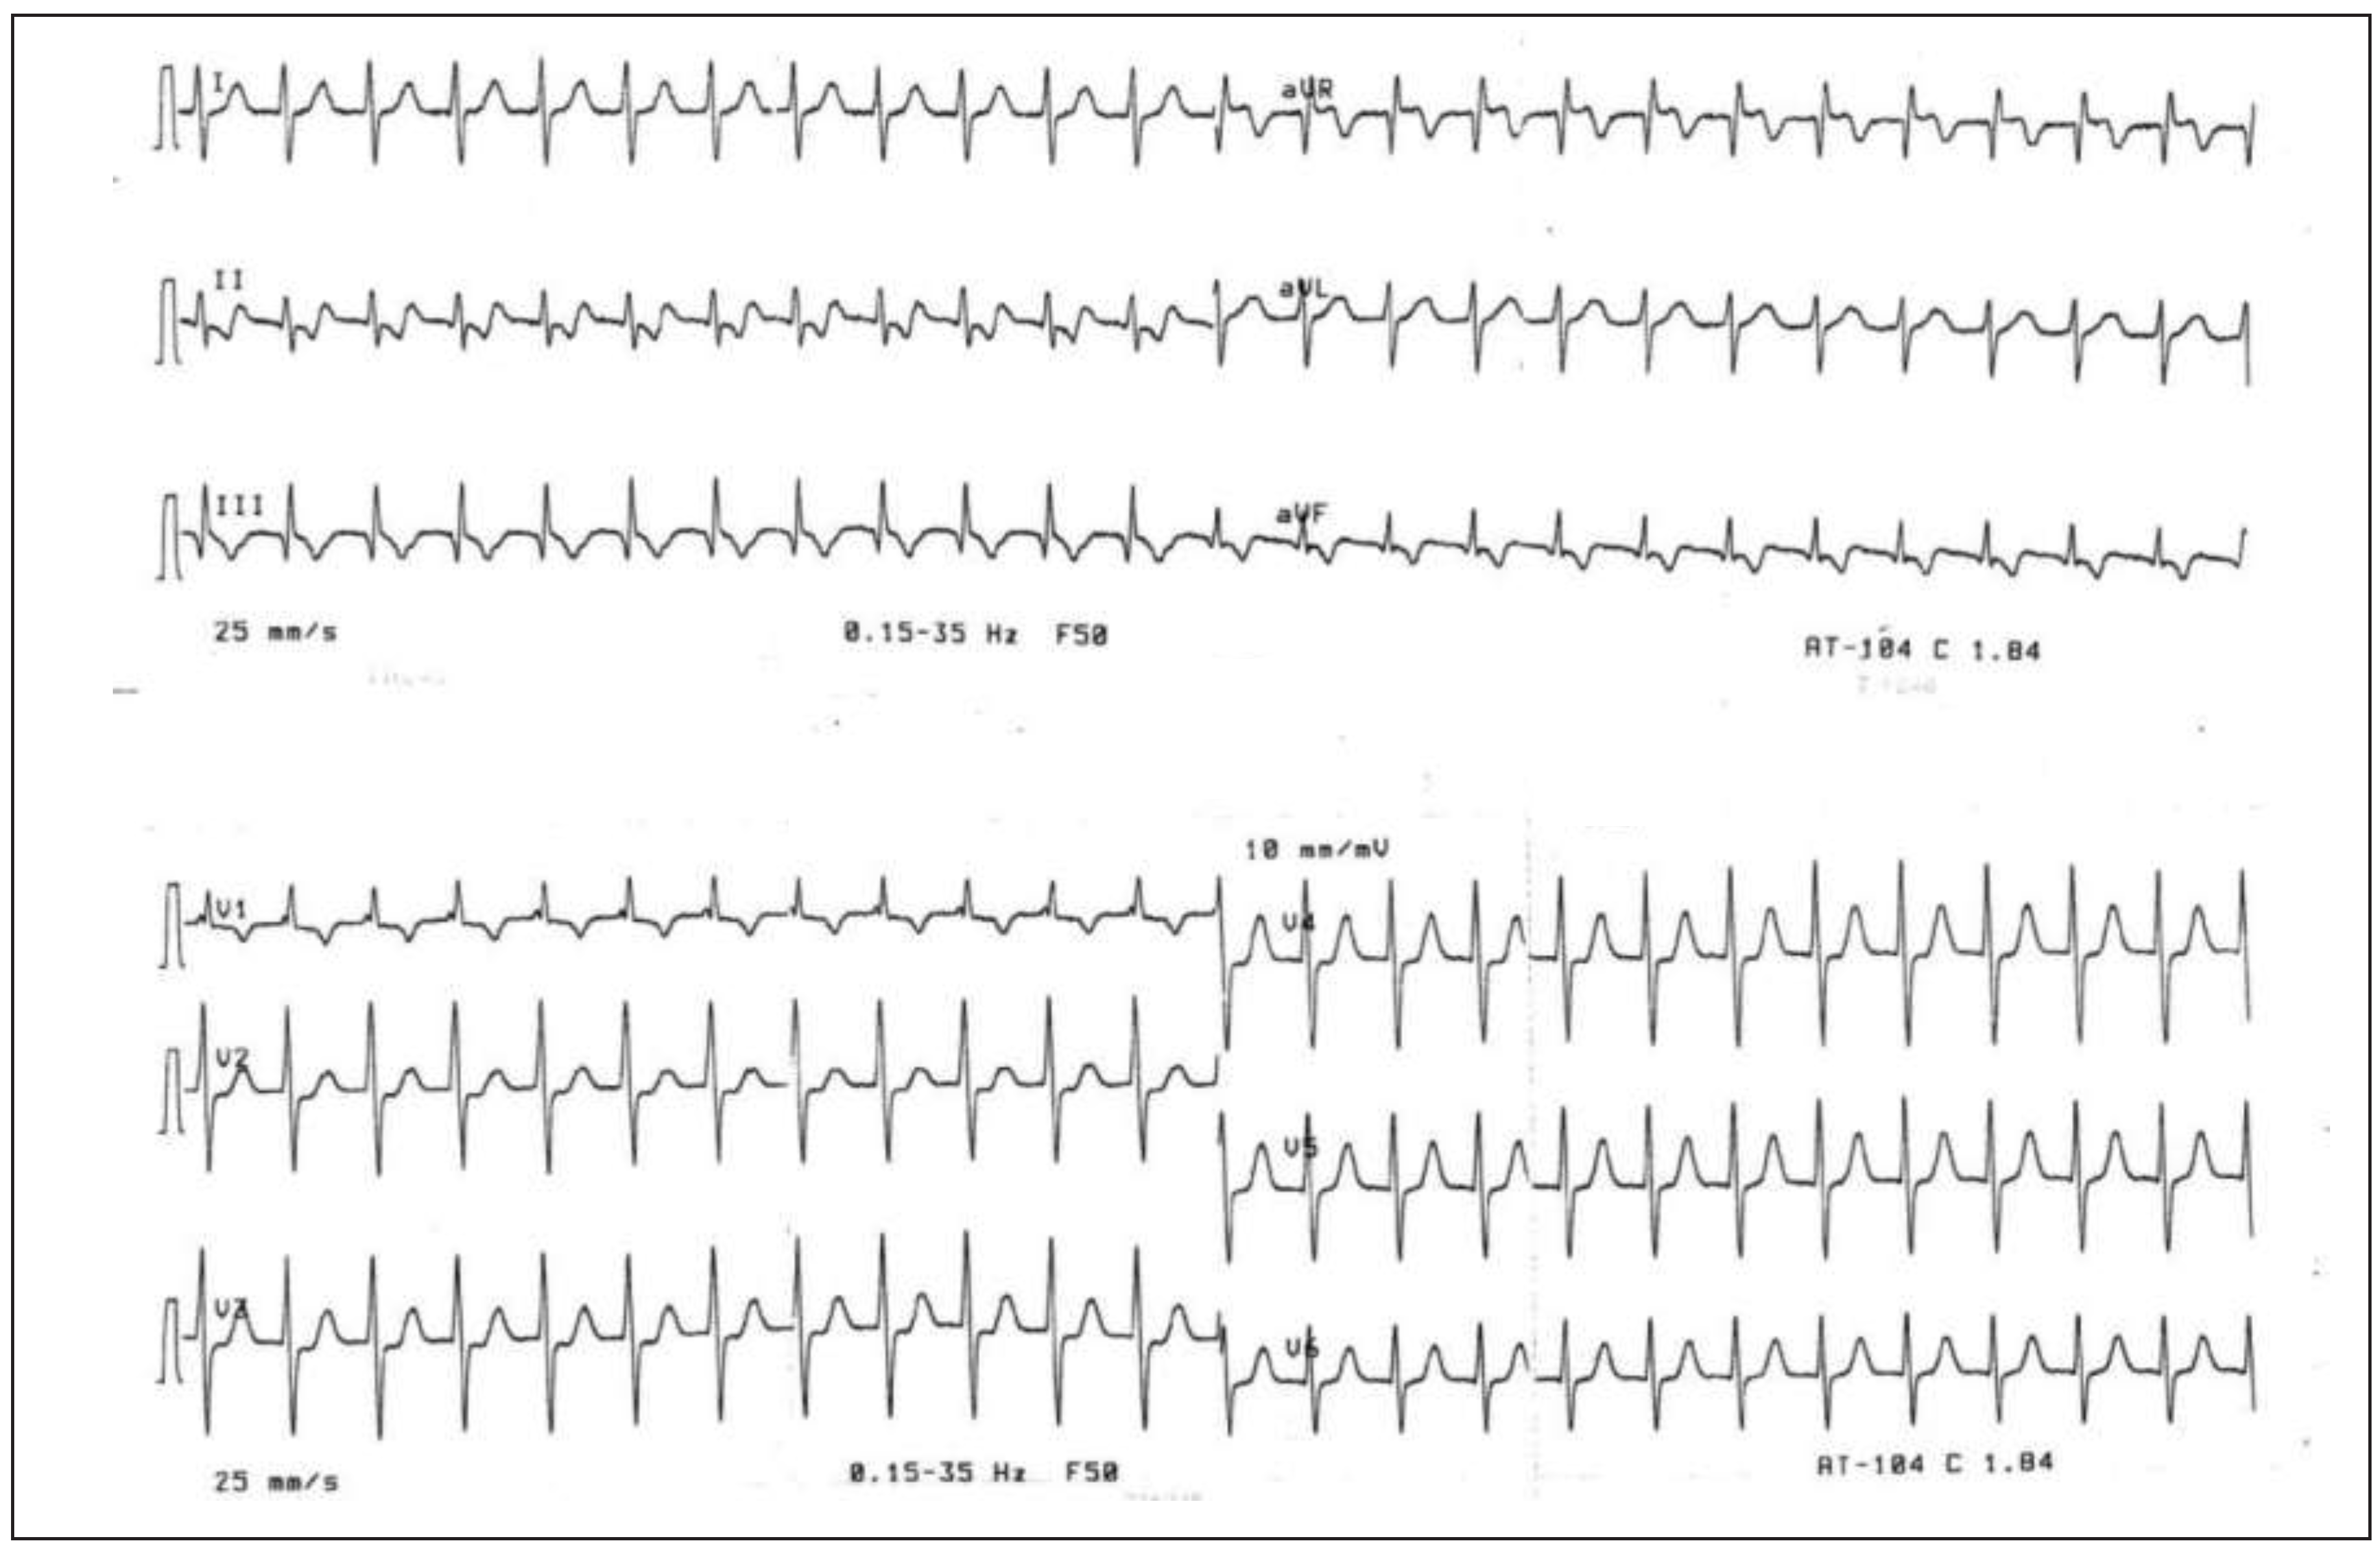
Figure 3 and
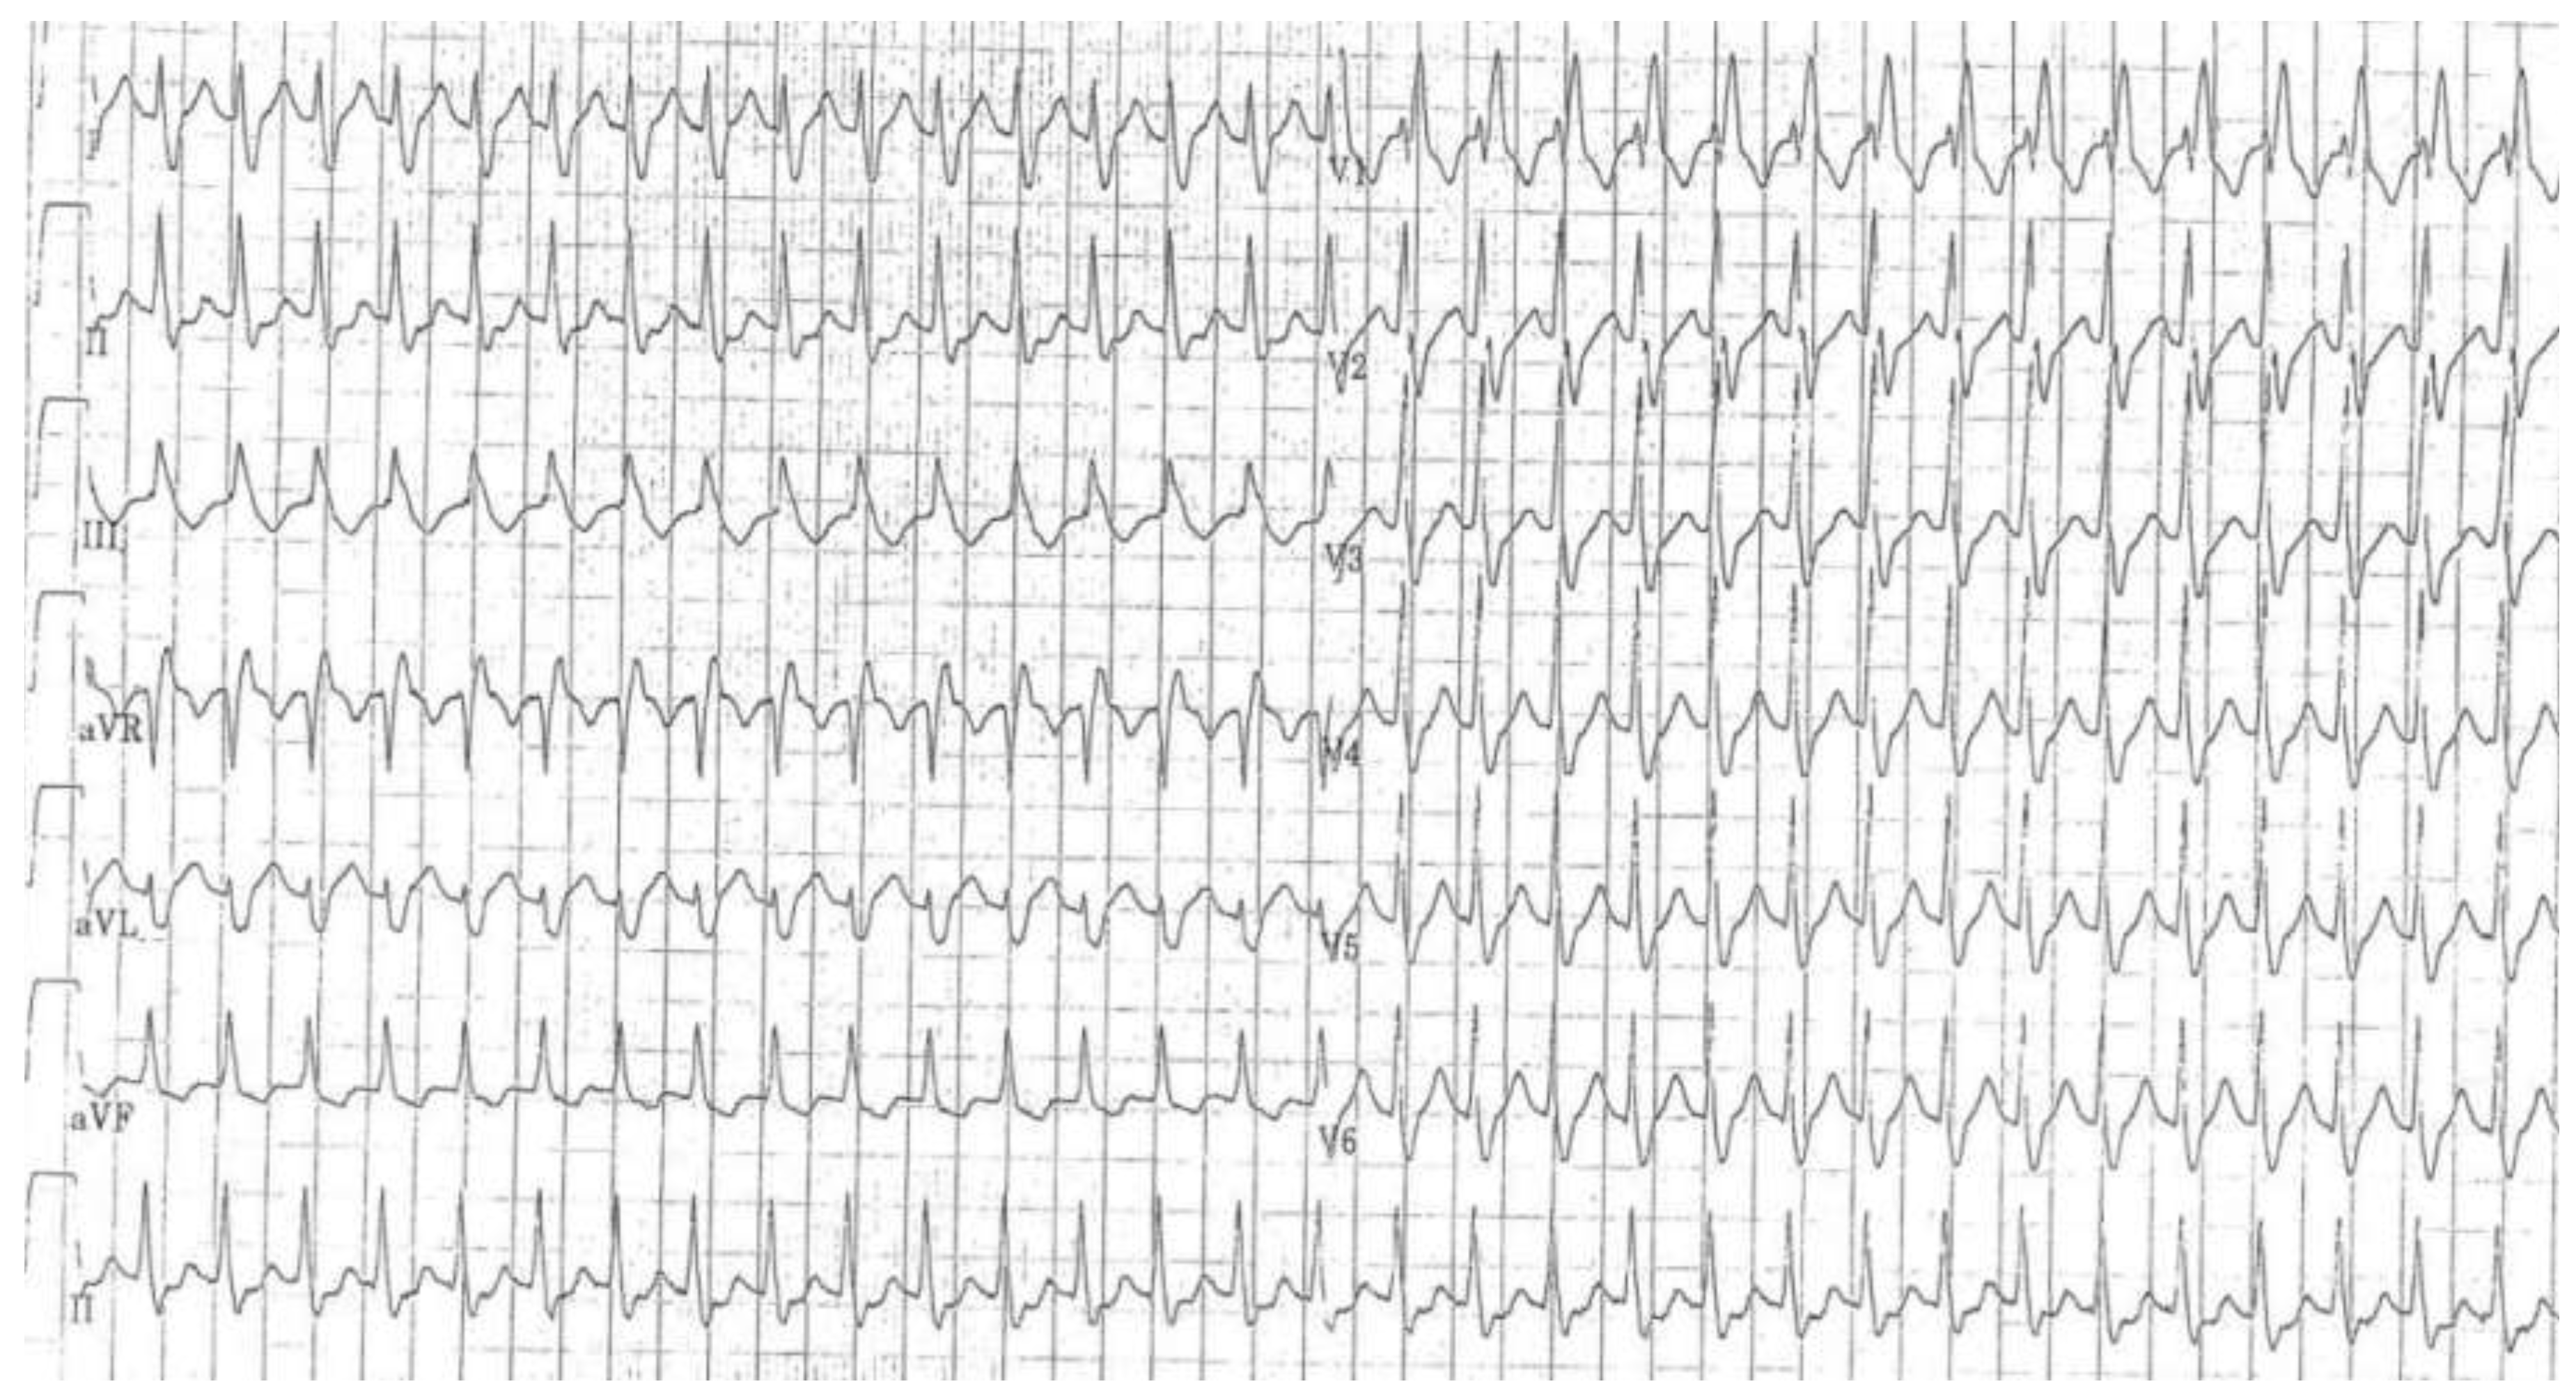
Figure 4. All had to choose a diagnosis of either AVNRT or AVRT based solely on the ECG. They were unaware of the correct diagnosis, age, gender and symptoms of the patients.
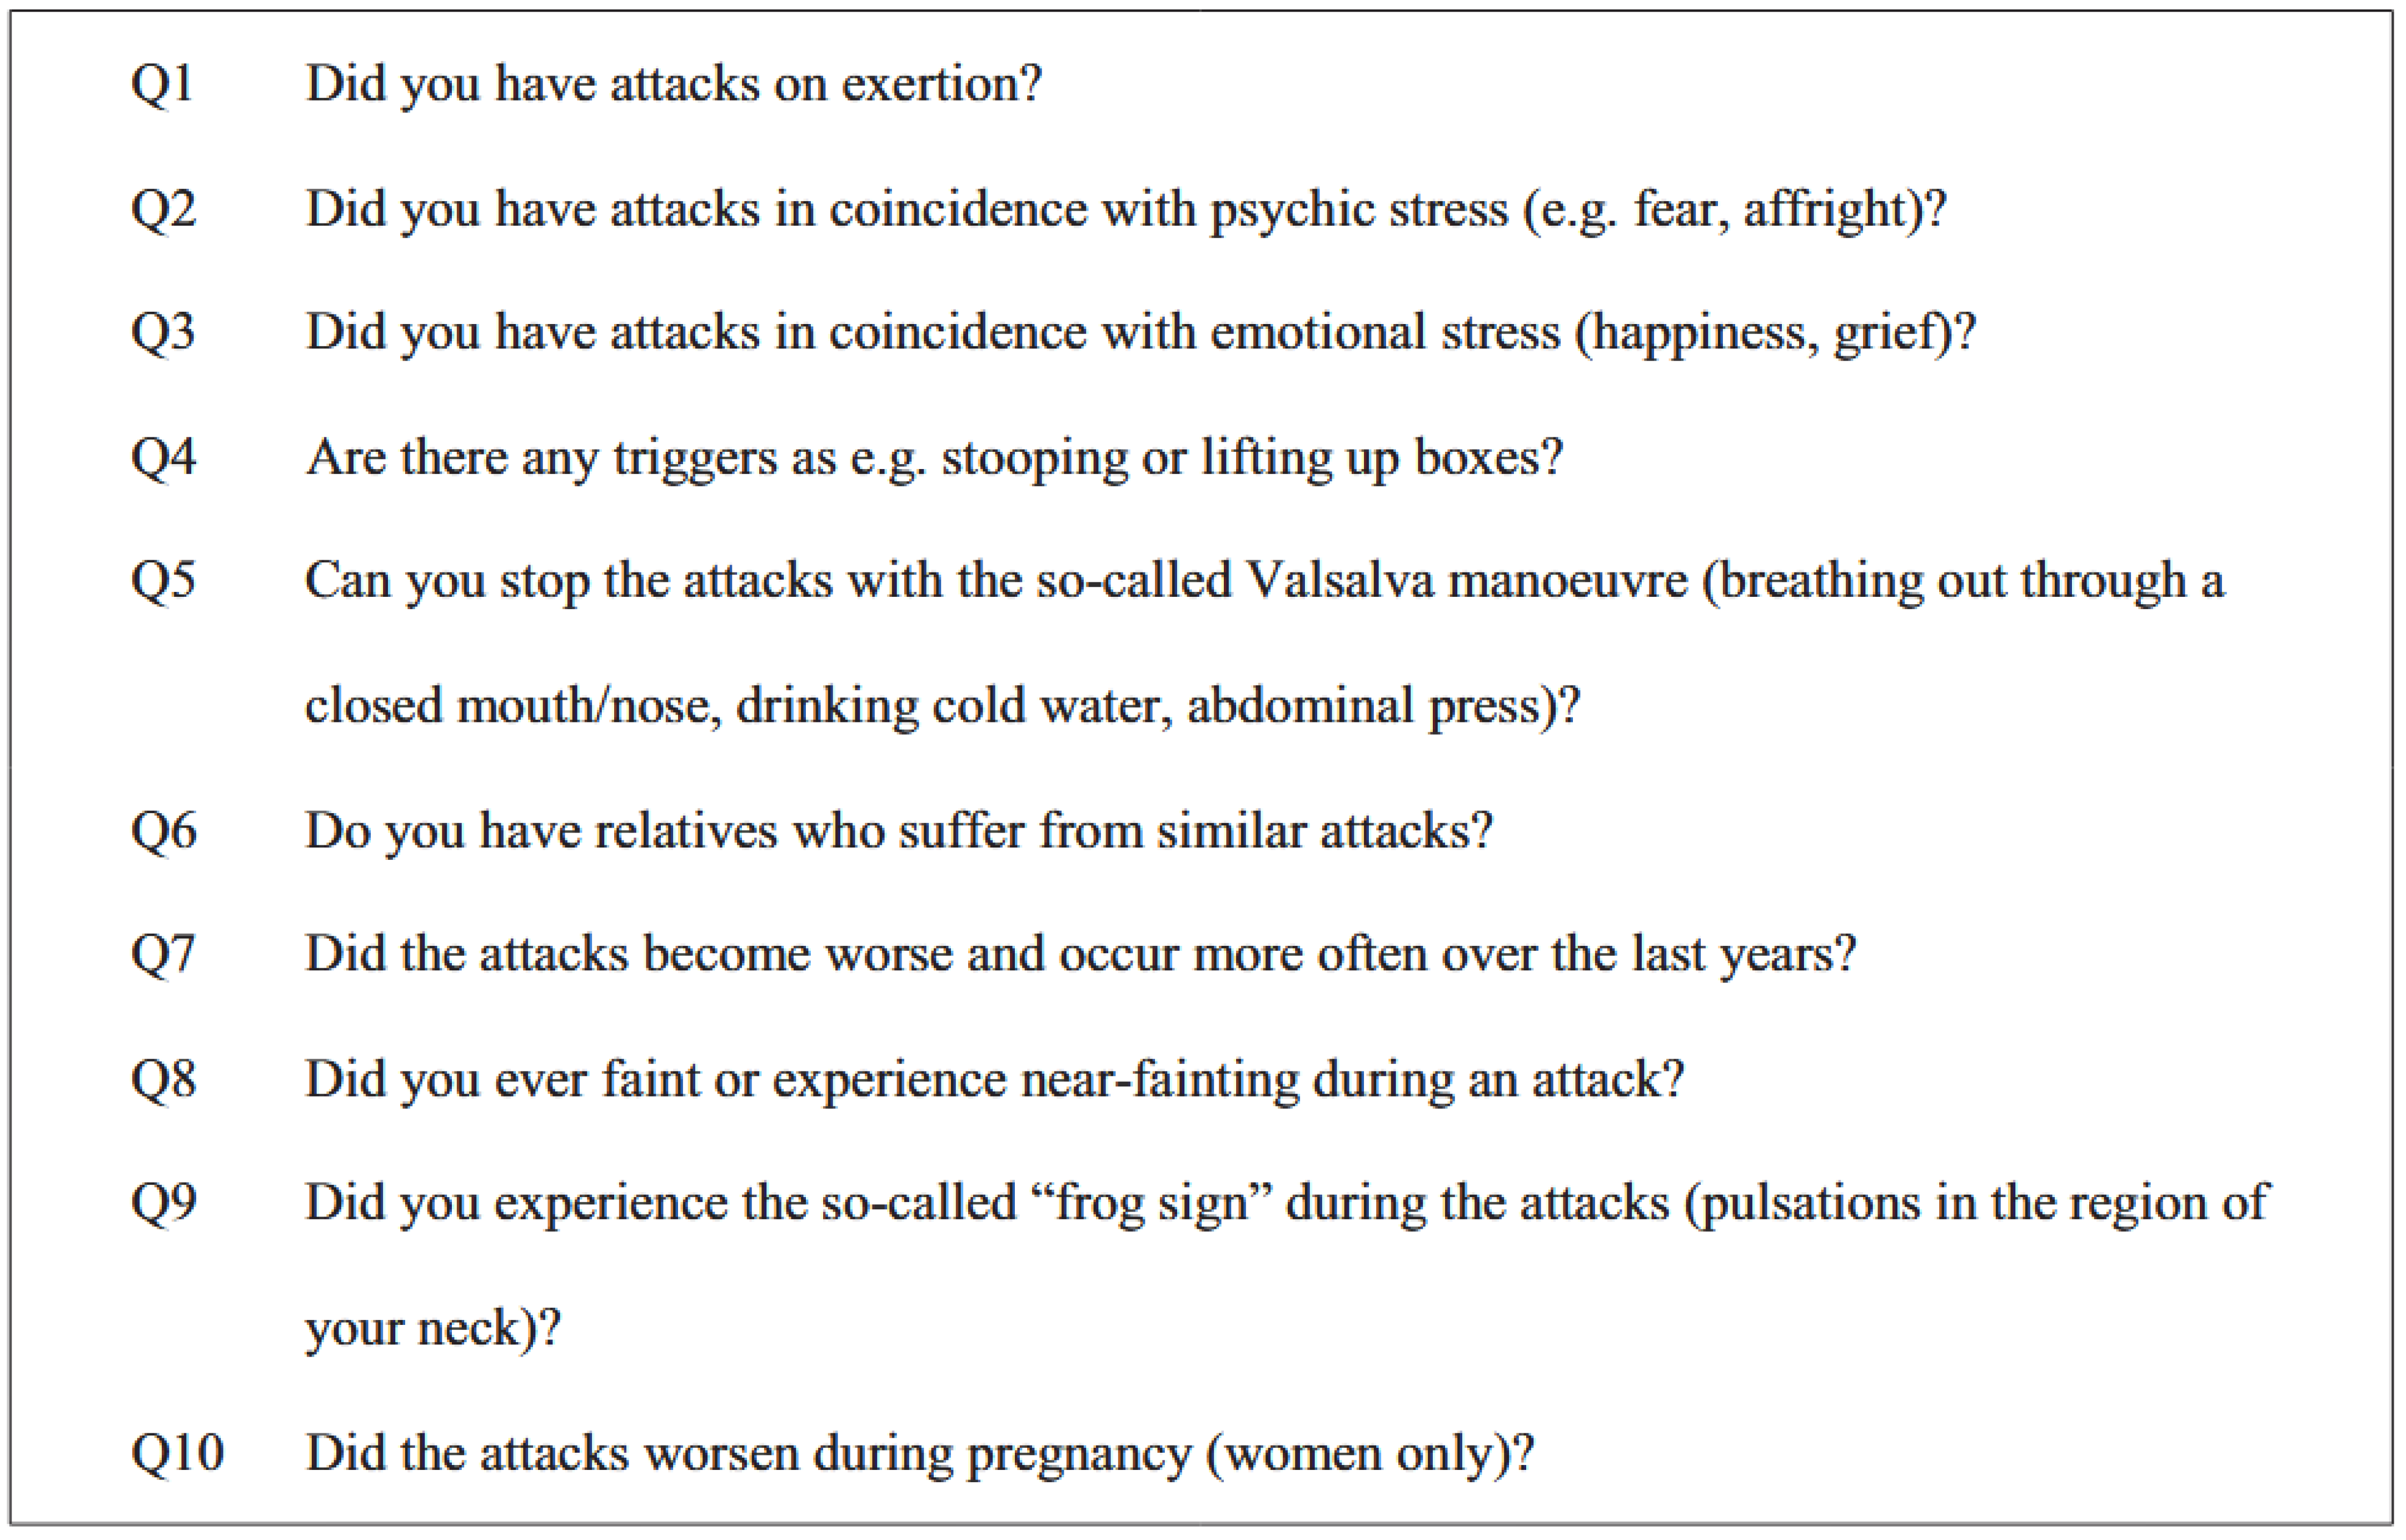
In the second part, we examined whether AVNRT can be distinguished from AVRT on the basis of symptoms and the circumstances of the tachycardia. For this purpose, we used a questionnaire with 10 short questions. As there are no existing questionnaires to date, a new one was developed based on the long-standing personal experience (B.S.) in history taking in such patients. Questions related to trigger factors, relief and concomitant symptoms of the attacks, frequency of occurrence and familial clustering. The questionnaire is shown in an English translation in
Figure 1. The first 5 questions could be answered with
virtually ever; by the majority; by the minority; hardly ever. The questions 6 to 10 could be answered with
yes or
no. At first we recruited patients on the day of RFA when they were asked by a study nurse whether they wanted to participate and complete the questionnaire. All patients were advised that the questionnaire was voluntary and would not affect their treatment in any way. Due to poor return up to September 2013, we then decided to include also patients retrospectively and thus sent the questionnaire in September 2013 and again in December 2013 to 108 consecutive patients who had had a RFA between November 2012 and December 2013. We were able to analyse 55 completed questionnaires and link them to the corresponding diagnosis. As the number of returned questionnaires was too low to analyse four different answer categories, we divided the answers into a positive and a negative response group. Response options
virtually ever and
by the majority were grouped to “positive” and
by the minority and
hardly ever to “negative”.
Figure 1.
Translation of the questionnaire (originally in German).
Figure 1.
Translation of the questionnaire (originally in German).
Figure 2.
Tutorial ECG 1. This ECG shows a fast narrow complex tachycardia with a heart rate of 205 beats/min. The differential diagnosis includes AVNRT, AVRT and ectopic atrial tachycardia. A narrow P-wave is visible at the tail of the QRS complex, best seen in V1 (pseudo rSr’), but also in the inferior leads and in aVR. The presence of a P-wave at the end of the QRS complex corresponds to a very short ventriculo-atrial conduction (short VA-time) and suggests AVNRT. Such a short VA-time is not compatible with AVRT because retrograde conduction over an accessory pathway is not that rapid. However, atrial tachycardia is not ruled out. In this case, all three ECG readers had the correct diagnosis, most likely due to the ECG clue of the short VA-time.
Figure 3.
Tutorial ECG 2. In this ECG showing a regular narrow complex tachycardia with a heart rate of 150 beats/min, the responses were nonhomogeneous. No clearly discernible P-wave is present at first sight. However, closer analysis of the Twave (lead III) shows a “bump” corresponding to a relatively narrow inverted P-wave. Based on the longer VA-time, consistent with retrograde conduction via an accessory pathway, two out of three ECG readers suspected the correct diagnosis of AVRT. However, it should be noted that atrial tachycardia or atypical AVNRT with slow retrograde conduction are not ruled out by the finding of the described P-wave.
Figure 4.
Tutorial ECG 3. This ECG shows a wide complex tachycardia with right bundle branch block morphology and a heart rate of 150 beats/min. The pattern is consistent with supraventricular tachycardia with right bundle branch block aberrancy or preexisting right bundle branch block. Possibly due to the fact that no P-wave is visible, all three ECG readers suspected AVNRT with aberrancy. However, in this case, the correct diagnosis was AVRT. Even with closer examination of the ECG, the retrograde atrial activation with a longer VA-time, consistent with (but, as mentioned with ECG 1 ,not diagnostic for) retrograde conduction over an accessory pathway, is difficult to identify in the ECG, but may be suspected in the T-wave in leads III and aVL.
The statistical analyses were made using Office Excel 2011, “JMP 11” and “R”. For the calculation of statistical significance of the ECG analysis the kappa coefficient was calculated. This coefficient indicates, if >0, that the judgments of the three physicians were better than if they had taken their decisions at random. The kappa coefficient takes into account the frequencies of the different tachycardia types. The questionnaire was analysed with a binary regression (logit model). This assigns probabilities to the answers of the questionnaire. It helps to determine whether a question was more crucial than the others for one of the two diagnoses.
To evaluate the quality of the questionnaire and to determine if the questions were representative for discrimination of the two arrhythmias, we calculated the root mean squared error (RMSE). The RMSE measures the average deviation of the prediction model from its “real” value. To determine the RSME, the difference between the prediction of the model based on the answers of the various questions and the real value, i.e. 1 for AVNRT and 0 for AVRT, was calculated. The difference was squared and then the square root drawn. Finally, the mean of the root squared differences, i.e. the root mean squared error was determined. A RMSE of <0.5 is considered to indicate appropriate quality of the model.
The protocol was approved by the “Arbeitsgruppe Masterarbeiten” of the faculty of medicine of the University of Basel and thus by default no formal approval of the local ethical committee was necessary. All patients who filled out the questionnaire gave written informed consent.
Results
ECG analysis
From the 50 ECGs, we excluded 1 ECG of an ectopic atrial tachycardia that was erroneously included into the series. We thus assessed a total of 49 ECGs. Of these, 31 were recorded in patients with AVNRT and 18 in patients with AVRT.
Overall, 59% of the ECGs were correctly assigned. AVNRT was more often correctly identified than AVRT (76% vs 28%, p-value <0.05). There was no significant difference between the three physicians. B.S. was correct in 59% overall, with 77% of AVNRT ECGs and 28% of AVRT ECGs. F.R. was correct in 55% overall, with 74% of AVNRT ECGs and 21% of AVRT ECG. S.J. was correct in 61% overall, with 77% of AVNRT ECGs and 33% of AVRT ECG. Twelve of 31 AVNRT ECGs (39%) were correctly assigned by all three physicians and 3 (10%) incorrectly by two. The remaining 16 AVNRT ECGs were correctly assigned by two physicians in different combinations. A correct diagnosis was less frequently assigned for AVRT ECGs. In only 5 of 18 AVRT ECGs (28%), all three physicians made the correct diagnosis. In 8 AVRT ECGs (44%), all three were wrong. The remaining 5 AVRT ECGs were in each case assigned correctly by only one physician. The following kappa values and 95% confidence intervals were calculated: B.S. 0.49 (0.24–0.74); F.R. 0.5 (0.25–0.74); S.J. 0.44 (0.18–0.7).
As a tutorial, three ECGs with typical features are shown and suggestions are provided as to why the group assignment might have been such-and-such (
Figure 2,
Figure 3 and
Figure 4). Comments are given by one of the authors (M.K.).
Evaluation of the 55 questionnaires
Mean age of the patients was 55 ± 18 years, 26 were female (47%). During evaluation it turned out that all female patients responded to question 10 with “no”. This question was therefore excluded from further analysis. The percentages of positive answers to the questions are shown in
Table 1. For questions 5 and 8, the model (
Table 2) shows a significant predictive effect as to whether a patient has AVNRT or AVRT. This means that if the answer to question 5 is “yes” the model assigns an increased average probability of 45% that the patient has AVNRT and the negative complementary probability if the answer is “no”, provided that the answers to the other eight questions do not change. The opposite is true for question 8, where a positive answer decreases the average probability of AVNRT by 29%.
There was a significant difference with regard to two questions, but in both the higher positive value was still below 50%. The RMSE was calculated to be 0.32 for AVRT and 0.68 for AVNRT.
We then analysed whether a combination of two or three questions (answers either positive or negative) resulted in a higher accuracy. Combining Q1/5/8 resulted in three significant combinations (Q1 and Q8 positive AVNRT 38%, AVRT 6%; Q5 positive / Q8 negative AVNRT 38%, AVRT 6%; Q1 and Q5 negative / Q8 positive AVNRT 31%, AVRT 0%, all p-values <0.05). However, because the percentages are <50%, they are not clinically applicable. Combining Q2/8/9 resulted in two significant combinations (Q2 and Q8 negative AVRT 75%, AVNRT 41%, p-value 0.04; Q2, Q8 and Q9 negative AVRT 69%, AVNRT 33%, p-value 0.03). No other combination yielded any significant results.
Discussion
If interpreting physicians relied only on their clinical judgement and implicit application of criteria to differentiate between the two forms of tachycardia, the overall diagnostic accuracy of ECG interpretation in patients with AVNRT or AVRT was modest. In our population, diagnostic accuracy was only 60% and AVNRT was identified more frequently than AVRT.
With the strict use of a relatively simple algorithm [
6,
7], two experienced electrophysiologists in another study [
6] achieved an overall accuracy of 81% and were better regarding AVRT diagnosis than AVNRT (88% and 76%). Similar results (75%; 82% and 63%, respectively) were reported in the study by Kay et al. [
8]. After a meticulous interpretation of five specific ECG patterns, four experienced electrophysiologists had to decide on a final diagnosis. However, results were not different whether implicit application of criteria or the algorithm proposed by Bar et al. [
3] were used. All presented ECGs were recorded during an electrophysiological study under excellent conditions. General application of both algorithms is impaired by the fact that not all comers were studied, as patients with bundle branch block and ST-segment alterations in the 12-lead resting ECGs, which were presented to the ECG readers as well, were excluded.
Several individual ECG criteria have been tested similarly. QRS alternans was not significantly predictive of AVRT in one study [
9], whereas two other studies found a correlation with AVRT that was present in fewer than 50% of AVRT ECGs and thus not clinically useful [
10,
11]. Pseudo r’ is the most important feature of the algorithm by Arya, but was shown to be present in only 40%–52% of AVNRTs [
6,
10,
11]. Visible P-waves as a hallmark of AVRT are present in 60%–70% of cases [
10,
11], but considered to be unreliable as a feature to diagnose AVRT because of a limited intra- and interobserver concordance of 80% [
10]. Finally, the evidence of ST-segment depression, either its presence in at least six leads or with a horizontal depression of >2 mm, is controversial for diagnosis of AVRT [
6,
10,
11,
12].
The modest performance of the three cardiologists involved in ECG diagnosis in this study may be explained by some particular facts. As a result of the in retrospect imperfect design, they had to rely only on the ECG showing tachycardia; a resting ECG was not made available. This hampers the interpretation of a pseudo r’ especially. The quality of an ECG recorded during an attack is usually worse than an ECG in the electrophysiology laboratory, hampering the visibility of a P-wave. And finally, an all-comer population was studied, which included patients with bundle branch block and ST-segment changes. The role of implicit use of some of the mentioned features in decision making by an experienced physician is undetermined. All referenced studies, as well as ours, did not account for atypical AVNRT and the location of the accessory pathway in AVRT. To conclude this part of the study, acceptable accuracy can only be obtained by using an algorithm such as the one proposed by Arya et al. [
6], with consideration of its limitations discussed above.
The results regarding the questionnaire are not highly encouraging. Based on our clinical experience, we hypothesised that it might be possible to have a clinically meaningful and superior differentiation either by single questions or at least by a combination of some of them. Even though the questions regarding termination by use of the Valsalva manoeuvre or fainting were significantly different and occurrence during exertion at least showed a trend for AVNRT or AVRT, these questions are not applicable in daily practice because of the low predictive value (46%) of positive answers. At least a combination with negative answers to the questions regarding no coincidence with psychic stress, no fainting and no “frog sign” was significant and also clinically meaningful. Nevertheless, it only achieved 69% accuracy for AVRT compared with 33% for AVNRT. Of course the choice of the 10 items of the questionnaire can be challenged. For lack of an existing and validated questionnaire, a new one had to be created. However, it was based on our experience in examining such patients, encompasses important symptoms and circumstances of AVNRT and AVRT and showed a good RMSE value. Further limitations are a relatively small number of patients, a certain referral bias of highly symptomatic patients and the decision the reduce the analysis of questions 1 to 5 from originally four possible answers to only “yes” or “no”.


