Article

The Nrf2-Related Pathways and the Antiandrogenic Effects Are Enhanced In Vitro and In Silico by the Combination of Graminex®G96® Pollen and Teupol 25P in Cell Models of Benign Prostate Hyperplasia

1
Department of Pharmacy, “G. d’ Annunzio” University of Chieti-Pescara, 66100 Chieti, Italy
2
Department of Drug and Health Sciences, University of Catania, 95125 Catania, Italy
3
CERNUT—Research Centre for Nutraceuticals and Health Products, University of Catania, 95125 Catania, Italy
4
IDI Integratori Dietetici Italiani S.r.l., Via Goffredo Mameli, 12, 95020 Aci Bonaccorsi, Italy
5
Ud’A Techlab, “G. d’Annunzio” University of Chieti-Pescara, 66100 Chieti, Italy
6
University of Sarajevo—Faculty of Pharmacy, 71000 Sarajevo, Bosnia and Herzegovina
*
Author to whom correspondence should be addressed.
These authors contributed equally to this work.
Nutraceuticals 2025, 5(3), 17; https://doi.org/10.3390/nutraceuticals5030017
Submission received: 19 May 2025 / Revised: 20 June 2025 / Accepted: 7 July 2025 / Published: 10 July 2025
(This article belongs to the Special Issue Nutraceuticals and Their Anti-inflammatory Effects)

Abstract

Inflammation, oxidative stress, and androgen activity are key features in benign prostate hyperplasia (BPH). Risks associated with the long-term use of 5α-reductase inhibitors have led to the search for alternative therapies, including food supplements. This study investigates the effectiveness of the combination of pollen extracts, namely Graminex®G96® (G) and Teupol 25P (T), towards oxidative stress and inflammation on human macrophages and benign prostate hyperplasia cells (BPH-1), both of which are LPS stimulated. The Nrf2-dependent antioxidant intracellular cascade as well as the NF-ĸB-driven inflammatory cascades were analyzed. The anti-proliferative effect of G and T, alone and in association, were evaluated on prostatic adenocarcinoma cells (PC-3) and BPH-1 cells. Finally, the inhibitory activity of GT on 5α-reductase was investigated in PC-3 cells by measuring epiandrosterone amounts, with the 5α-reductase inhibitor finasteride administered for comparison. All experiments were conducted in triplicate; data are presented as mean values ± standard deviations. Statistical analysis was performed using one-way analysis of variance. Our work demonstrates that GT promotes Nrf2-dependent antioxidant responses and counteracts the NF-ĸB-driven pathway in macrophages. GT is effective in counteracting the expression of pro-inflammatory cytokines and the generation of reactive oxygen species by promoting HO-1-dependent antioxidant responses in BPH-1 cells. GT reduces PC-3 and BPH-1 proliferation when associated with finasteride through a statistically significant inhibition of 5α-reductase activity. Data obtained in vitro and in silico demonstrate the potential efficacy of a multitargeted approach in the treatment of BPH.

1. Introduction

Benign prostate hyperplasia (BPH) affects 50% of the male population aged between 51 and 60 worldwide. It is caused by a dysregulated proliferation of cells in the connective tissue, smooth muscle, and glandular epithelium within the prostate transition zone, causing lower urinary tract symptoms (LUTSs) which can become disabling as the disease progresses [1]. Besides aging, another relevant factor for BPH development is androgenic activity, whose role is still debated.
Testosterone is the most common androgen responsible for prostate growth. It is converted by the 5α-reductase in dihydrotestosterone (DHT), a metabolite strictly involved in BPH and prostate cancer occurrence [2]. To date, first-line treatment is represented by 5α-reductase inhibitors, suited for long-term therapy in patients with a predominantly voiding dysfunction. Finasteride and dutasteride are the main drugs prescribed. They inhibit the enzymatic conversion of testosterone in DHT and induce apoptosis in epithelial cells, reducing prostate size and the progression of hyperplasia [3]. The most common adverse effects are erectile dysfunction and reduced libido. However, the main concern is about the risks associated with long-term use including insulin resistance, potential kidney dysfunction, non-alcoholic fatty liver disease, and type 2 diabetes [4].
In this scenario, innovative therapeutic approaches exploiting alternative molecular mechanisms implicated in BPH development, such as inflammation, oxidative stress, and enzymatic and dietary factors, are still needed. The increasing oxidative state in many tissues, typical of advanced age, plays a fundamental role in BPH and prostate cancer occurrence, making these pathologies prevalent in elderly men. In this population, levels of antioxidant enzymes have been found to be significantly decreased, thus leading to a pro-oxidant condition which promotes the disease’s progression. Recently, it has been reported that nuclear factor erythroid 2–related factor 2 (Nrf2) target genes are down-regulated in BPH [5]. Nrf2 is considered the key regulator of the intracellular antioxidant response, being the master regulator of the transcription of genes involved in cellular defense mechanisms and redox homeostasis maintenance by counteracting the nuclear factor kappa-light-chain-enhancer of activated B cells (NF-ĸB)-driven inflammatory response and regulating apoptotic genes expression. In the prostate gland, inflammation promotes the production of free radicals, reactive oxygen species (ROS), and reactive nitrogen species (RNS), a self-sustaining process which culminates in chronic inflammation and prostate hypertrophy [6]. It was found that the infiltration of pro-inflammatory macrophages in the transition zone (TZ) of the gland plays a key role in the pathogenesis of BPH by inducing an increase in stromal proliferation [7]. An increasing interest in the use of phytotherapies and dietary supplements in BPH prevention has been registered. The most studied and used medicinal plants are Serenoa repens, Pygeum africanum, Urtica dioica, Cucurbita pepo, and Secale cereale. Products containing Serenoa repens extracts are the most frequently used because of their anti-inflammatory, antiandrogenic, and anti-proliferative properties [8,9]. The large plethora of Serenoa-based commercial formulations usually contains an amount of this plant material obtained through different extraction techniques, thus hampering the reproducibility of the clinical studies and the assessment of the proper efficacious dose [10]. Conversely, Graminex®, alone or in combination with other natural substances, is usually obtained by the same procedures and it is a certified natural material standardized in specific components (phytosterols and α-amino acids). In addition, we have also further characterized its phytochemistry, antioxidant activity, and anti-inflammatory effects in our previous papers [11,12], thus improving the correlation between biological activity and chemical profile. Lastly, Di Pasquale et al. have clinically assessed the ameliorative role of Graminex® in patients treated with greenlight laser XPS photovaporization of the prostate [13], whereas Cai et al. have reported the antiproliferative role of Graminex® against prostate cancer cells (especially in hormone-independent models such as PC-3) [14].
Teupolioside, also known as Lamiuside A, is a phenylpropanoid glycoside found in Ajuga reptans: it is a secondary metabolite endowed with antioxidant properties and other pharmacological activities [15,16,17]. Recently, it was suggested to have an indirect role in suppressing androgen activity by interfering with the 5α-reductase activity that looks promising for BPH treatment [18]. Building upon the provided information, the current study aims to investigate whether the combination of Graminex®G96® Pollen and Teupol 25P (a pesticide- and diterpenoid-free crop production standardized in 25% phenylpropanoids with a teupolioside content >97% w/w and biotechnologically produced by the IRBN22 A. reptans cell line) might demonstrate a synergistic effect in terms of the anti-inflammatory effect on LPS-stimulated human macrophages and the anti-proliferative action on human prostate cancer cells (PC-3) sensitive to the inhibition of 5α-reductase. The concentrations of Graminex® G96® Pollen and Teupol 25P were adjusted to maintain a fixed ratio of 8.33 (GT), reflecting the precise formulation present in the commercially available dietary supplement. This ratio was specifically chosen to ensure the experimental conditions closely align with real-world usage, thereby enhancing the relevance and applicability of the findings. The NF-ĸB and Nrf2 signaling pathways were monitored and the antioxidant power was investigated through the observation of the catalase activity.
Additionally, to evaluate the antioxidant and anti-inflammatory effects of Graminex®G96® (G), Teupol 25P (T), and their combination (GT), an immortalized human cell line representative of benign prostatic hyperplasia (BPH-1) was used to perform further experiments. In conclusion, the activity on the 5α-reductase enzyme was checked through the measurement of epiandrosterone, a metabolite of dehydroepiandrosterone (DHEA) via the 5α-reductase enzyme. Finasteride was used as a reference compound. In silico studies corroborated this inhibitory action.

2. Materials and Methods

2.1. Cell Cultures

Undifferentiated human monocytes (CRL-9855™) and human prostatic adenocarcinoma cells (PC-3™ cell line) were purchased from ATCC® (American Type Culture Collection) through the LGC Standards S.r.l. (Sesto San Giovanni, Milano, Italy) and benign prostatic hyperplasia (BPH-1) epithelial cells were purchased from Deutsche Sammlung Von Mikroorganism Und Zellkulturen-GmbH [DSMZ-GmbH, Science Campus Braunschweig-Süd, Germany]. Cells were sub-cultured in RPMI 1640 (Merck, Darmstadt, Germany) supplemented with 10% heat-inactivated fetal bovine serum (FBS), 1% penicillin/streptomycin, and 1% sodium pyruvate (all from Gibco, Invitrogen, Life Technologies, Carlsbad, CA, USA) at 37 °C and 5% CO2.
For differentiation into macrophages, monocytes were seeded in multi-well culture plates and stimulated with 100 ng/mL of PMA (phorbol-12-myristate-13-acetate, purchased from Merck, Darmstadt, Germany, stock solution 1 mM in DMSO) in complete RPMI for 48 h at 37 °C and 5% CO2.

2.2. Establishment of the Inflamed Environment and Cell Treatments

In the first set of experiments, macrophages under basal conditions and after LPS stimulation (LPS 0.5 µg/mL, lipopolysaccharide from E. coli, purchased from Merck, Darmstadt, Germany, stock solution 1 mg/mL in water) were exposed to increasing concentrations of Graminex® G96® (G) (a solvent-free 15:1 ratio of a water-soluble pollen extract and a lipid-soluble pollen extract) and Teupol 25P (T) (an Ajuga reptans (Lamiaceae) cell culture extract, standardized in phenylpropanoids, mixed with maltodextrins that guarantees a titration of at least 25% teupolioside), which were kindly provided by IDI (Integratori Dietetici Italiani S.r.l., Aci Bonaccorsi, CT, Italy). These were diluted in complete growth medium at the ratio of 8.33 (GT), according to the mixture percentages in the commercial product Xipag® for 24 h. G and T were mixed as follows: 500 µg/mL and 60.2 µg/mL (GT1), 250 µg/mL and 30.1 µg/mL (GT2), 125 µg/mL and 15 µg/mL (GT3), 62.5 µg/mL and 7.5 µg/mL (GT4), 31.25 µg/mL and 3.75 µg/mL (GT5), and 15.6 µg/mL and 1.87 µg/mL (GT6). In parallel, cells were exposed to G and T separately at the same concentrations used in the mixtures. Untreated cells were used as control (CTRL).
In a second set of experiments, PC-3 cells were exposed to concentrations of G, T, or GT selected from previously performed experiments on human macrophages, or rather GT2, GT3, or GT4 and G or T separately at the same concentrations used in the mixtures. In parallel, the 5α-reductase inhibitor finasteride was used as a comparison. PC-3 cells were exposed to increasing concentration of finasteride (0.1–10 µM) and processed for further experiments.
In a third set of experiments, to evaluate the anti-inflammatory effect of the most promising combination (GT2), an in vitro model of inflammation was established using lipopolysaccharide (LPS) at 10 µg/mL in BPH-1 cells.

2.3. Cell Metabolic Activity (MTT)

The MTT test was performed in 96-well plates (Thermo Fisher Scientific, Waltham, MA, USA) as a measure of cell metabolic activity. Cells were seeded at 0.5 × 10⁵ (macrophages), 0.8 × 10⁵ (PC-3 cells) cells/well, and 7 × 10³ (BPH-1 cells) cells/well treated as previously described. At the established time point (24 or 48 h), the incubation medium was harvested for further analyses and complete RPMI containing MTT [3-(4,5-dimethylthiazol-2-yl)-2,5-diphenyltetrazolium bromide, purchased from Merck, Darmstadt, Germany] at a concentration of 0.5 mg/mL was added to each well. Cells were incubated for 4 h at 37 °C and 5% CO2. After that, absorbance was measured at 540 nm using a spectrophotometer (Multiscan GO, Thermo Fisher Scientific, Waltham, MA, USA). The percentage of metabolically active cells in treated cultures was calculated, setting the untreated control (CTRL) to 100%. The assay was performed in triplicate for each experimental condition in two independent experiments (n = 6).

2.4. LDH Released (Cytotoxicity Assay)

The release of LDH from human macrophages into cell supernatants was quantified by the CytoTox 96® nonradioactive assay (Promega Corporation, Fitchburg, WI, USA) to assess cytotoxicity in macrophages after a 24 h exposure period. Cell supernatants to be analyzed were collected from cultures set up for the MTT. After the exposure time, cell supernatants were collected, centrifuged at 450× g for 4 min, and stored on ice. Supernatants (50 µL) were pipetted into a 96-well plate with a flat bottom (Falcon®, Corning Incorporated, New York, NY, USA) and the volume was doubled by adding the LDH reaction mixture. After 30 min of incubation at room temperature in the dark, 50 µL of stop solution was added and the optical density (O.D.) was measured at 490 and 690 nm by means of a spectrophotometer (Multiscan GO, Thermo Fisher Scientific, Waltham, MA, USA). The obtained O.D. was normalized with that related to the positive control (lysed cells) set as 100%. An assessment of cytotoxicity was calculated according to the following formula: %LDH released = [(A − B)/(C − B)] × 100, with A = LDH activity of sample, B = LDH activity of untreated cells, and C = LDH activity of the positive lysed control. The assay was performed in triplicate for each experimental condition (n = 3).

2.5. Catalase Activity Assay

An analysis of the antioxidant enzyme catalase activity in human macrophages was carried out using an Amplex® Red Catalase Assay Kit (Molecular Probes, Invitrogen Corporation, CA, USA). Catalase is a heme-containing redox protein which prevents an excess of intracellular hydrogen peroxide (H2O2) by converting this compound to water and oxygen. In the assay, catalase—if working in samples—firstly reacts with H2O2 to produce water and oxygen (O2). Next, the Amplex Red reagent reacts with a 1:1 stoichiometry with any unreacted H2O2 in the presence of a horseradish peroxidase (HRP) to produce the highly fluorescent oxidation product resorufin. Therefore, as catalase activity increases, the signal from resorufin decreases. The absorbance was measured at 560 nm in a microplate reader (Multiskan GO, Thermo Scientific, Waltham, MA, USA). The results are typically plotted by subtracting the observed fluorescence from that of a no-catalase control (complete RPMI medium). Assessment of the relative catalase activity (mU/mL) was calculated using a curve generated with specific standards provided by the manufacturers.

2.6. Protein Extraction

For the analysis of protein expression, macrophages were seeded in 50 mm cell culture dishes (Falcon®, Corning Incorporated, New York, NY, USA) at a density of 0.1 × 10⁷ cells/dish. To obtain a positive control for the Nrf2 translocation, macrophages were exposed to xanthostigmine, a cell-permeable, direct, non-covalent inhibitor of the Keap1–Nrf2 protein interaction (Kd = 1 μM) that causes the dissociation of Nrf2 from Keap1 in the cytosol (MilliporeSigma™ Calbiochem™ Keap1-Nrf2 Interaction Probe, Merck, Darmstadt, Germany). After 24 h, the exposure was stopped by collecting the exposure media and floating cells. Adherent cells were washed with ice-cold PBS, detached with trypsin/5 mM EDTA (EuroClone, Milan, Italy), and collected by centrifugation. The cell pellet was resuspended and washed twice in ice-cold PBS. Next, nuclear and cytosolic extracts were separated using different lysis buffers, as previously described [19]. The protein concentration was determined using a bicinchoninic acid assay (QuantiProTM BCA Assay kit for 0.5–30 mg/mL protein, Merck, Darmstadt, Germany) following the manufacturer’s instructions. The procedure was performed in triplicate for each experimental condition (n = 3).

2.7. Immunoblotting (Western Blot)

Nuclear and cytosolic proteins (20 µg per lane) were separated and transferred as already described [19]. Nitrocellulose membranes were then blocked in 5% of non-fat milk or 5% of BSA, 10 mmol/L Tris pH 7.5, 100 mM NaCl, and 0.1% Tween 20 and probed overnight at 4 °C under gentle shaking with rabbit polyclonal anti-Nrf2 (primary antibody dilution 1:750), mouse monoclonal anti-HO-1 purchased from Santa Cruz Biotechnology (Santa Cruz, CA, USA), mouse monoclonal anti-NF-ĸB-p65 subunit (primary antibody dilution 1:1000) purchased from Chemicon® (Merck, Darmstadt, Germany), mouse monoclonal anti-β-actin (primary antibody dilution 1:5000), and mouse monoclonal anti-laminin A/C (primary antibody dilution 1:1000) all purchased from Merck, Darmstadt, Germany. Afterwards, membranes were incubated in the presence of specific IgG horseradish peroxidase (HRP)-conjugated secondary antibodies. Immunoreactive bands were identified using the ECL detection system (LiteAblot Extend Chemiluminescent Substrate, EuroClone S.p.A., Milan, Italy) and analyzed by densitometry. Densitometric values, expressed as integrated optical intensity (IOI), were estimated in the CHEMIDOC XRS system using the QuantiOne 1-D analysis software 2.0 (BIORAD, Richmond, CA, USA). The values obtained were normalized based on densitometric values of internal cytosolic actin or nuclear laminin and were expressed as relative expressions of proteins (n = 3).

2.8. Measurement of Epiandrosterone Concentration

Amounts of epiandrosterone (ng/mL) from PC-3 cells exposed to G, T, or GT combinations were measured using a commercial competitive ELISA kit purchased from Invitrogen (Thermo Fisher Scientific, Waltham, MA, USA). The epiandrosterone as the standard was also provided to generate a curve for the assay and all samples were read off this user-generated standard curve. Standards or diluted samples were pipetted into a clear microtiter plate coated with anti-rabbit IgG antibodies. Anti-rabbit epiandrosterone antibodies and an epiandrosterone–peroxidase conjugate were added to the wells. The epiandrosterone–peroxidase conjugate and any epiandrosterone in the sample will compete to bind to the anti-rabbit epiandrosterone antibodies. After incubation the plate was washed and the substrate was added. The substrate reacted with the bound epiandrosterone–peroxidase conjugate. After 30 min of incubation the reaction was stopped, and the intensity of the generated color was detected in a microtiter plate reader at 450 nm.

2.9. Determination of HO-1 and IL-6 Levels in BPH-1 Cells

HO-1 and IL-6 levels were assessed using a Simple Step ELISA (ab207621, ab46027, Abcam, Cambridge, UK) according to the manufacturer’s instructions. A microplate reader was used to measure the absorbance (OD) at λ = 450 nm. All samples were measured in triplicate and the results are expressed as pg/mL.

2.10. RNA Extraction and Quantitative Real-Time PCR Analysis

After treatments BPH-1 cells were harvested and RNA extraction and subsequent cDNA synthesis were performed as previously described [20]. Quantitative RT-PCR analysis was performed in Step One Fast Real-Time PCR System Applied Biosystems using the SYBR Green PCR Master Mix (Life Technologies, Monza, MB, Italy) to evaluate gene expression of cyclooxygenase-2 (COX-2), interleukin-1β (IL-1β), tumor necrosis factor-α (TNF-α), and interleukin-6 (IL-6). Results were normalized with the housekeeping gene GAPDH using a comparative 2−ΔΔCt method.

2.11. Cell-Free Evaluation of Antioxidant Capacity

The free-radical scavenging activity of T was evaluated using a DPPH (2,2-diphenyl-1-picrylhydrazyl) test. The reaction mixtures contained 86 µM DPPH, solubilized in ethanol, and different concentrations of T (3.75, 7.5, 15, 30.1, 60, and 120 µg/mL). After 10 min at room temperature, the absorbance at λ = 517 nm was recorded.
A Ferric Reducing Antioxidant Power (FRAP) Assay (MAK369, Sigma Aldrich, St. Louis, MO, USA) was used to measure the antioxidant potential in which Fe3+ is reduced to Fe2+ by antioxidants. The resulting Fe2+ specifically forms a colored complex with a chromogen. Experiments were carried out following the manufacturer’s instructions. Absorbance was measured spectrophotometrically at 590 nm and also used color intensity results proportional to FRAP in the sample. Results are expressed as µM ferrous equivalents.

2.12. ROS Measurement

Levels of reactive oxygen species (ROS) were determined using fluorescent probe 2′,7′-dichlorofluorescein diacetate (DCFH-DA). A 0.1% Triton solution was used to wash cells and enhance cellular probe permeation, then 100 µL of a DCFH-DA working solution (200 µM) was added to each well and incubated at 37 °C for 30 min. Fluorescence was measured in a microplate reader (excitation, λ = 488 nm; emission, λ = 525 nm) following incubation time. Eight replicate wells were used for each group. The results are expressed as fluorescence intensity (AU)/proteins (mg/mL).

2.13. Homology Modeling of Human 5α-Reductase 1

The homology modeling was performed using the software YASARA Structure 23.9.29 [21,22]. The target sequence of human 5α-reductase 1 was obtained from UniProt Knowledgebase under the entry number P18405 (entry name: S5A1_HUMAN). The sequence contained 259 residues in 1 molecule. The following parameters have been chosen for this target: modeling speed: slow; num. of PSI-BLAST 2.2.24 iterations in template search: 3; max. allowed (PSI-)BLAST E-values to consider template: 0.1; max. num. of templates to be used: 5; max. num. of templates with same sequence: 1; max. oligomerization state: 4 (tetrameric); max. num. of alignment variations per template: 5; max. num. of conformations tried per loop: 50; and max. num. of residues added to the termini: 10. YASARA Structure was also used for image production of the modeled human 5α-reductase 1.

2.14. Molecular Docking Study

The molecular docking study was performed using YASARA Structure 23.9.29 implementing the AutoDock 4.2 protocol [23]. The crystal structure of human steroid 5α-reductase 2 in complex with finasteride (PDB: 7BW1) [24] was downloaded from the RCSB Protein Data Bank (https://www.rcsb.org accessed on 21 January 2025) and prepared for docking analysis by removing water molecules and adding polar hydrogen atoms and was optimized in the AMBER14 force field [25]. Previously modeled human steroid 5α-reductase 1 was prepared following the same protocol. The molecular docking was conducted in the area defined by setting up the cuboid search box around a specific binding pocket where finasteride used to be complexed within the 5α-reductase enzyme. Three ligands were chosen for this study: teupolioside as the ligand of interest; testosterone as the natural substrate, for the comparison of affinity; and finasteride, as an approved 5α-reductase inhibitor drug, for benchmarking. For the ligands, the energies were minimized, and the geometries were optimized on the 3D structures also using an AMBER14 force field. The Lamarckian genetic algorithm was employed with the following parameters: 25 docking runs with a maximum of 15,000,000 energy evaluations and 27,000 generations for each run, with a grid point spacing of 0.375 Å, providing in this way the lowest energy (kcal/mol) and dissociation constants (μM) for the docked poses. Discovery Studio Visualizer v24.1.0.23298 [26] was used for the visualization of the ligand–enzyme complex and image production.

2.15. Statistical Analysis

Data are presented as the mean values ± S.D. of three independent experiments. Statistical differences were determined by one-way ANOVA and post hoc Tukey multiple comparison tests using Prism software (version 5.0, GraphPad Software 8.0, San Diego, CA, USA). p values < 0.05 were considered statistically significant.

3. Results

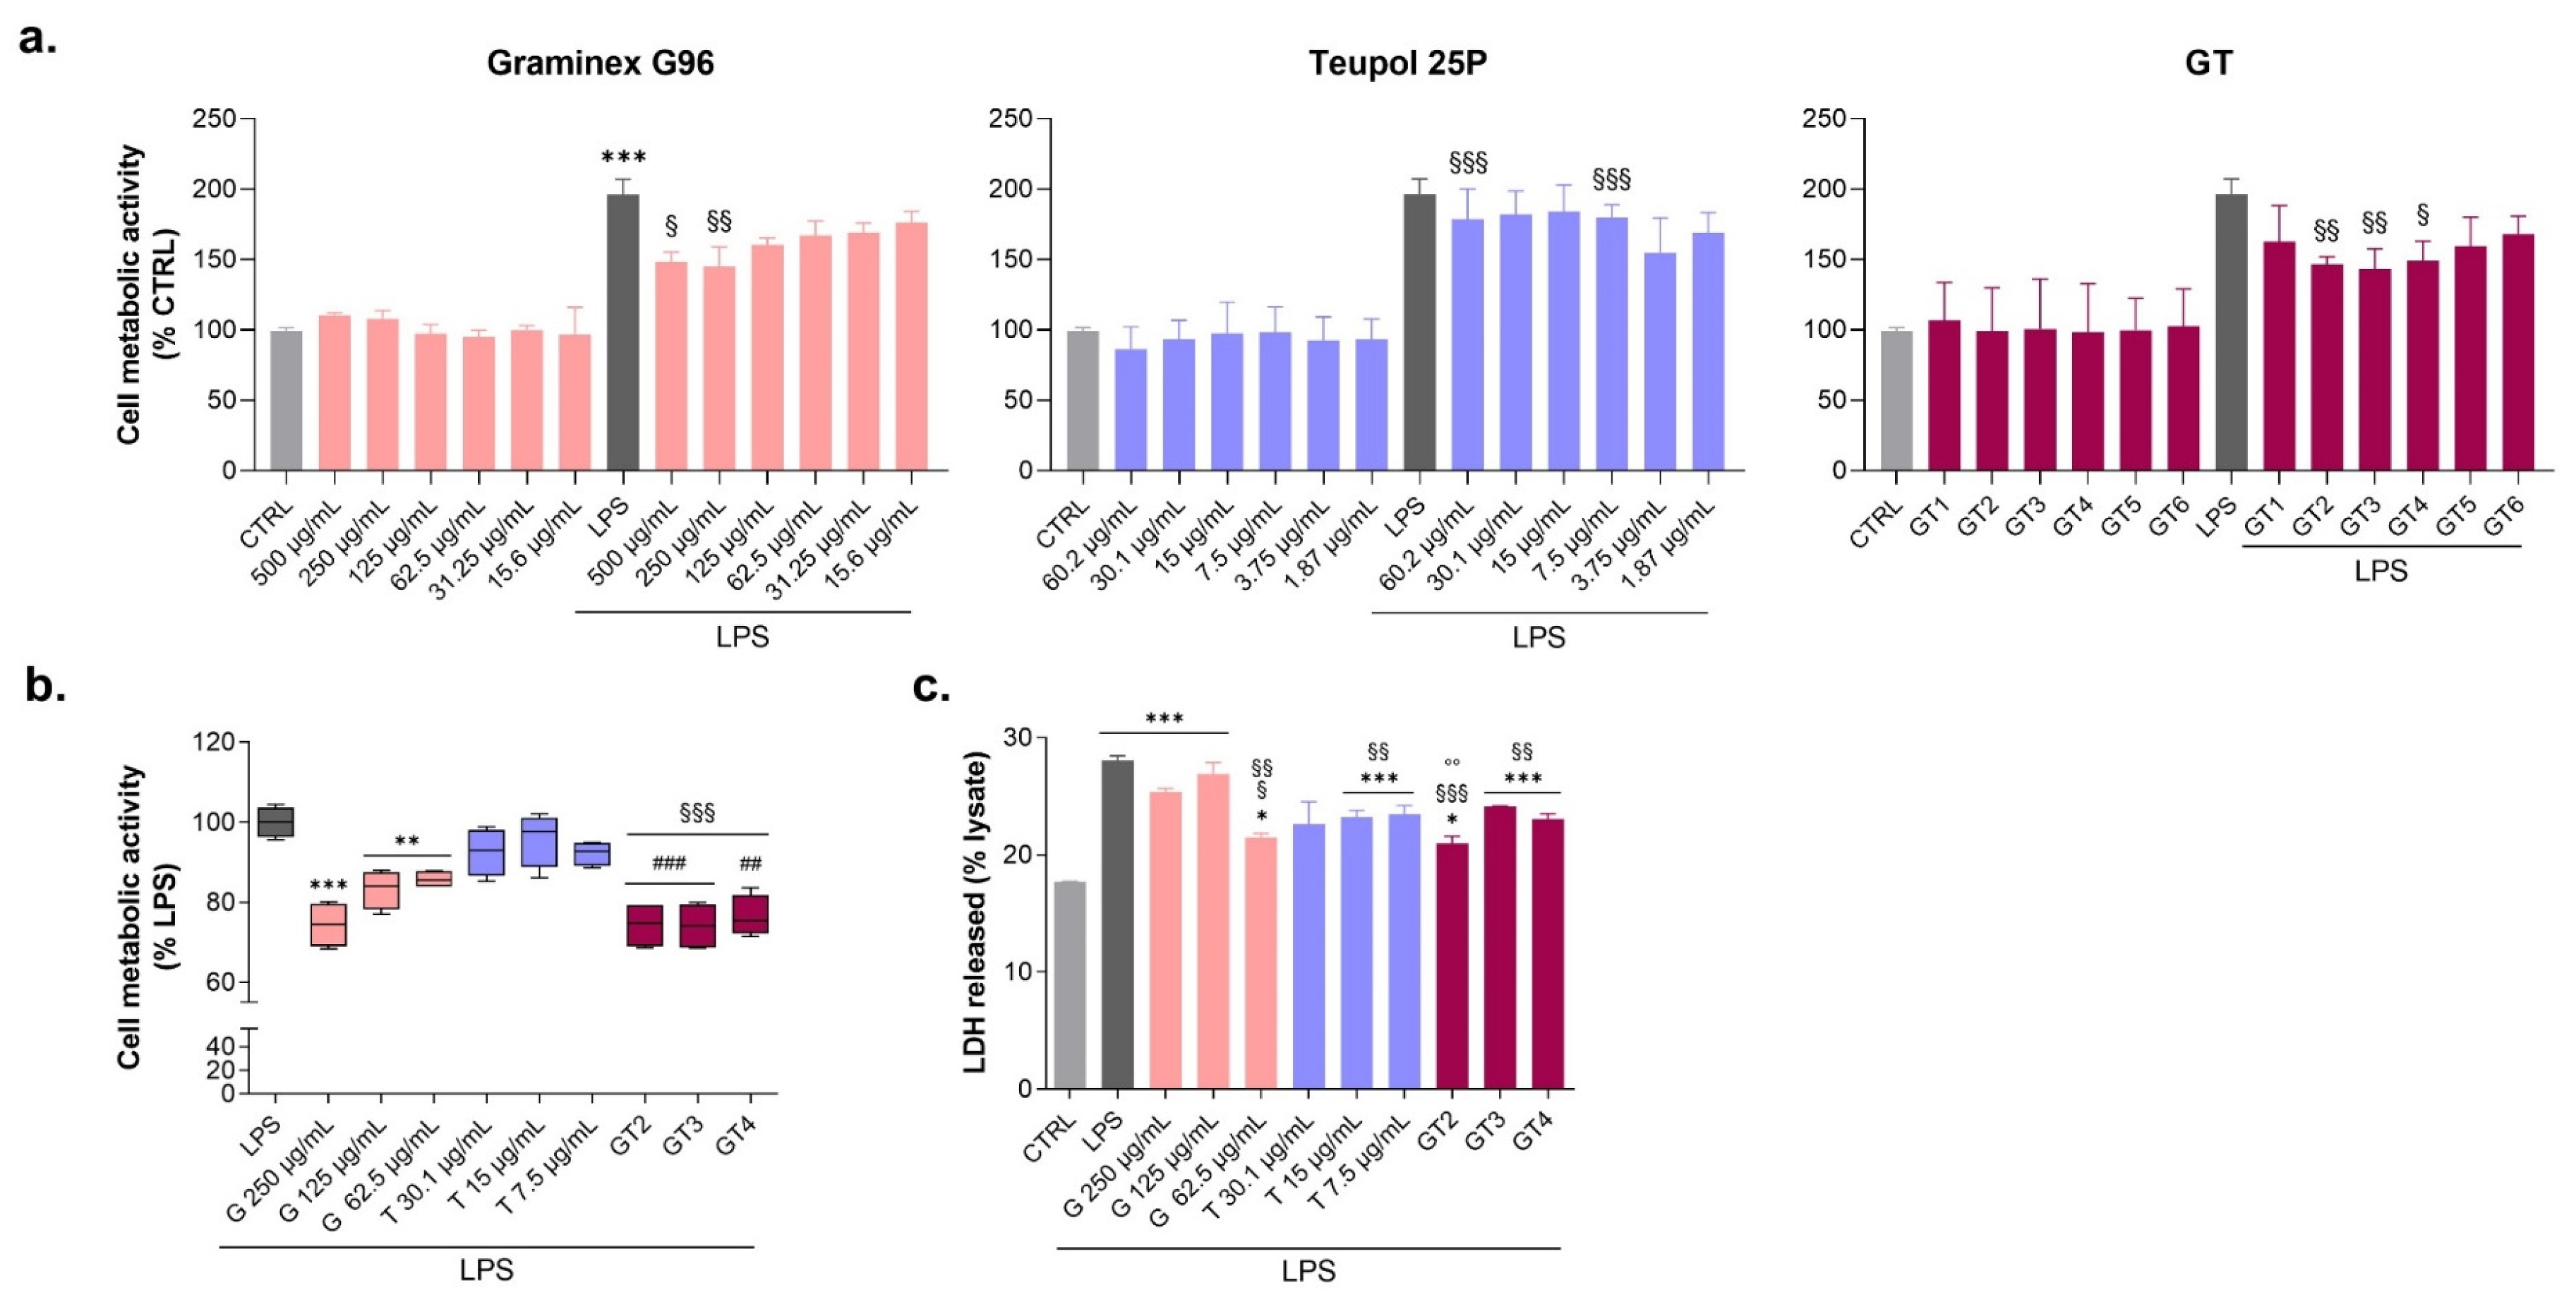
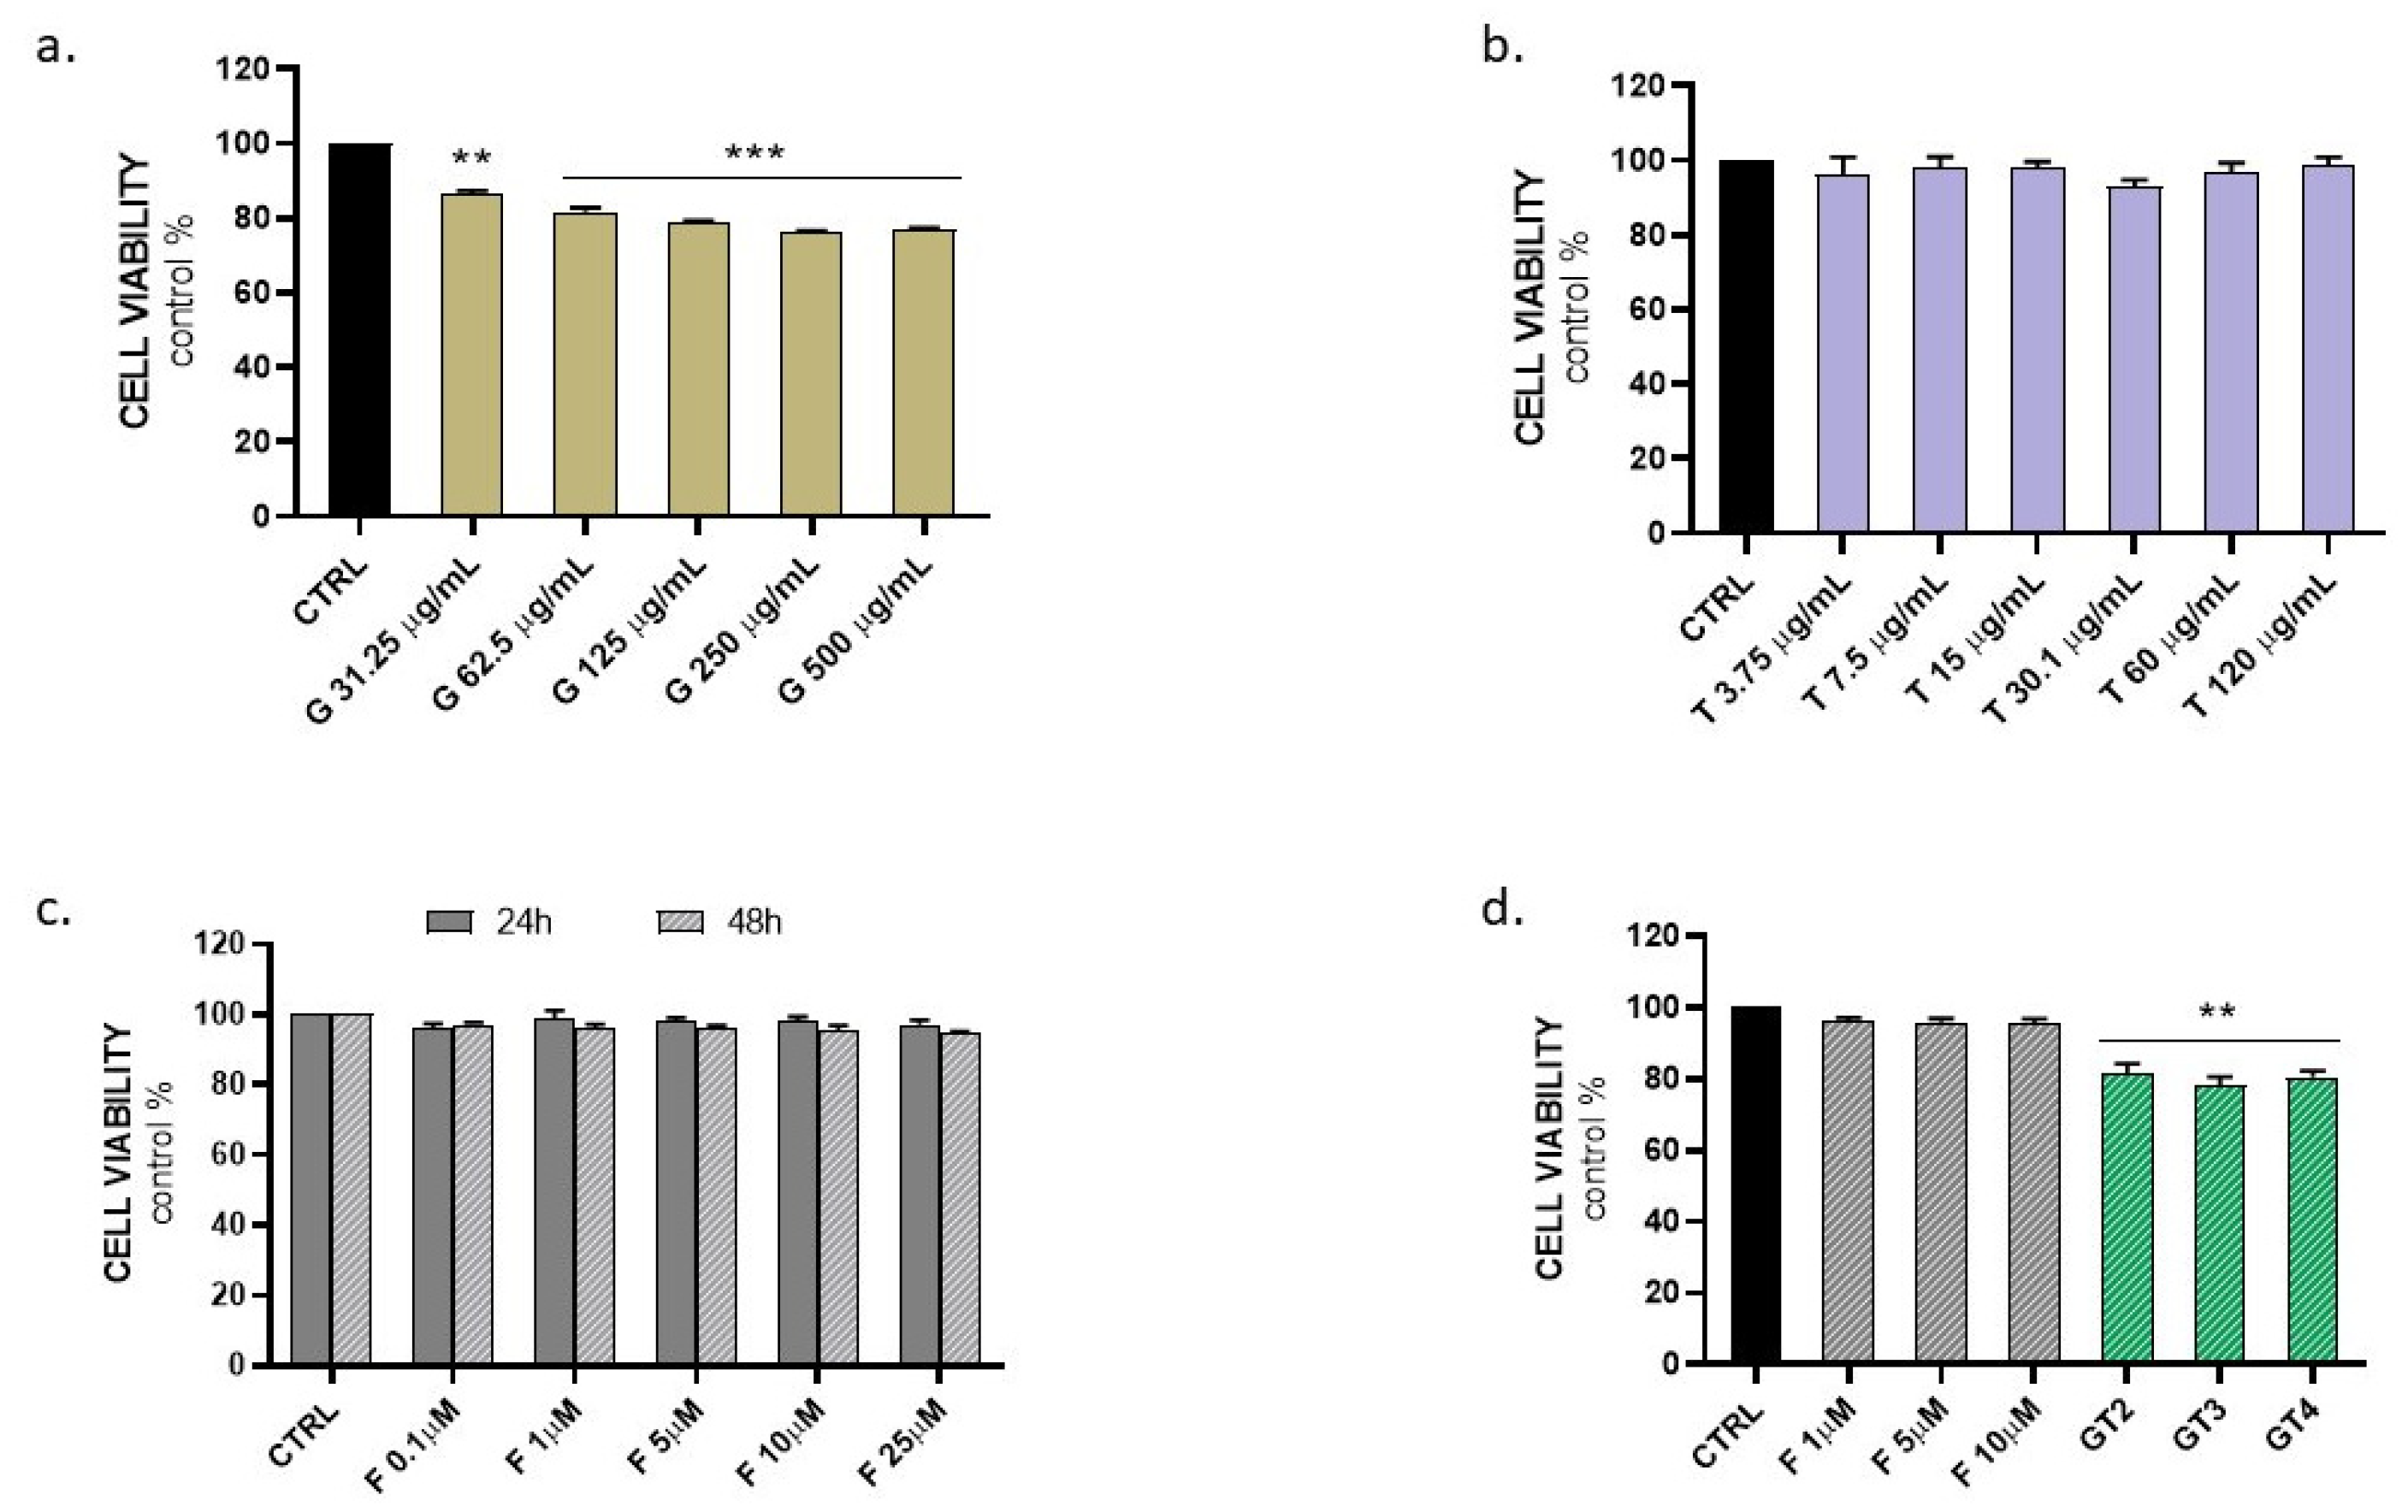
3.1. Evaluation of Graminex®G96® and Teupol 25P Cytotoxicity and Their Effect on the Cell Metabolic Activity of LPS-Stimulated Macrophages

After 24 h, both G, T, and their combinations are found to be well tolerated by unstimulated macrophages (Figure 1a). As expected, the metabolic activity of LPS-stimulated cells is almost doubled when compared to untreated samples in cells as a sign of immunostimulation and inflammation [27,28]. In parallel, G, T, or their combinations slightly decrease LPS-stimulated macrophages metabolic activity, mainly in the presence of G at 500 and 250 µg/mL and T at 60.2 and 7.5 µg/mL. The best combinations in decreasing the LPS-stimulation of cell metabolic activity are GT2, GT3, and GT4. In more detail, the GT combinations significantly decrease the cell metabolic activity of LPS-stimulated macrophages if compared to G and T alone at the same concentrations (p < 0.0001 for GT2 and GT3) (Figure 1b). Likewise, LPS causes cytotoxicity, as revealed by the LDH assay performed on macrophages (Figure 1c). On the contrary, all the treatments can decrease the release of LDH in all the experimental conditions.

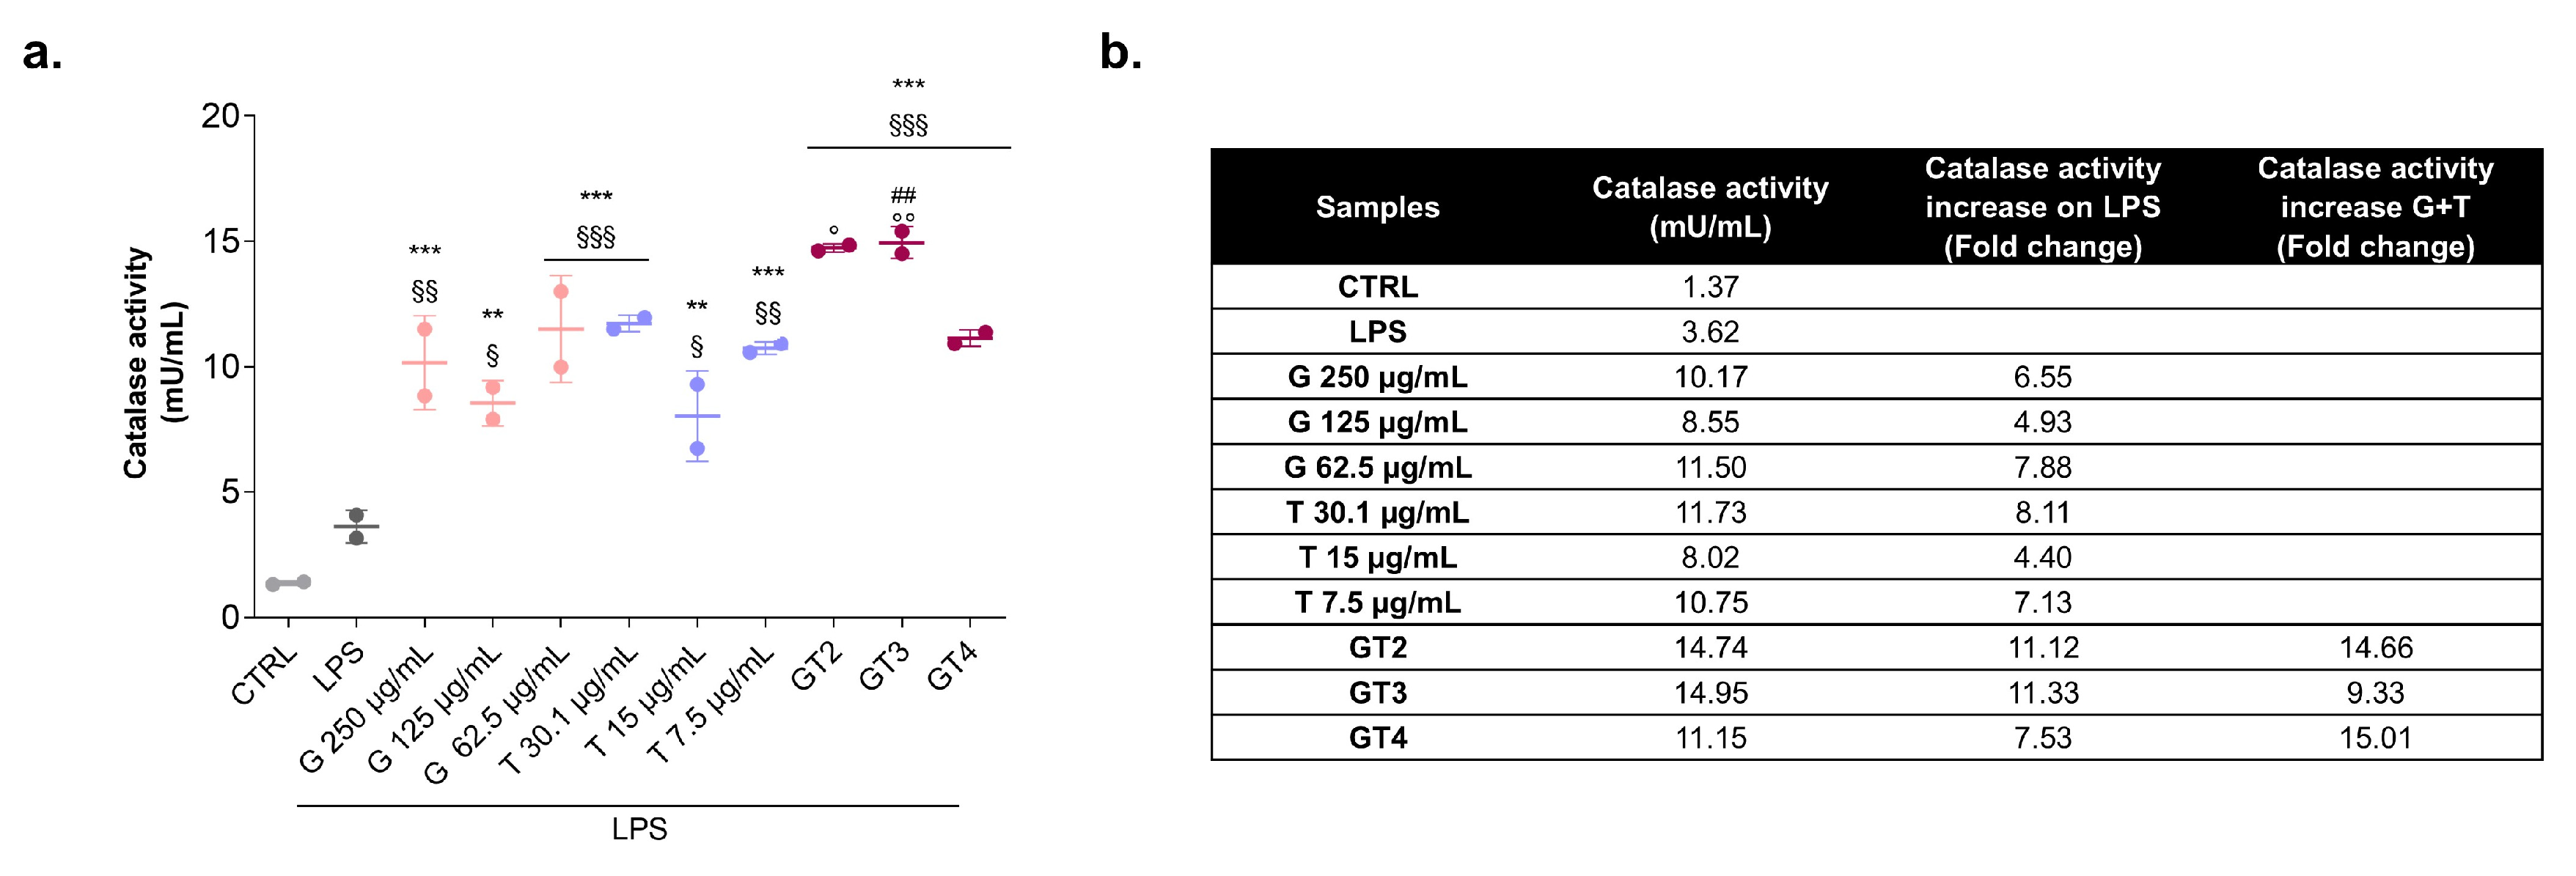
3.2. Catalase Activity in the Presence of Graminex®G96® and Teupol 25P in LPS-Stimulated Macrophages

At the established experimental time point (24 h), macrophages show no signs of antioxidant catalase activation at basal conditions (1.37 mU/mL), whereas the LPS-stimulation slightly but notably increases the enzymatic activity (3.62 mU/mL) (Figure 2). G and T can raise catalase activity up to 8.11 mU/mL (T 30.1 µg/mL). The combination of G and T (mainly GT3) are even more effective on the increase in the enzymatic rate (Figure 2b).

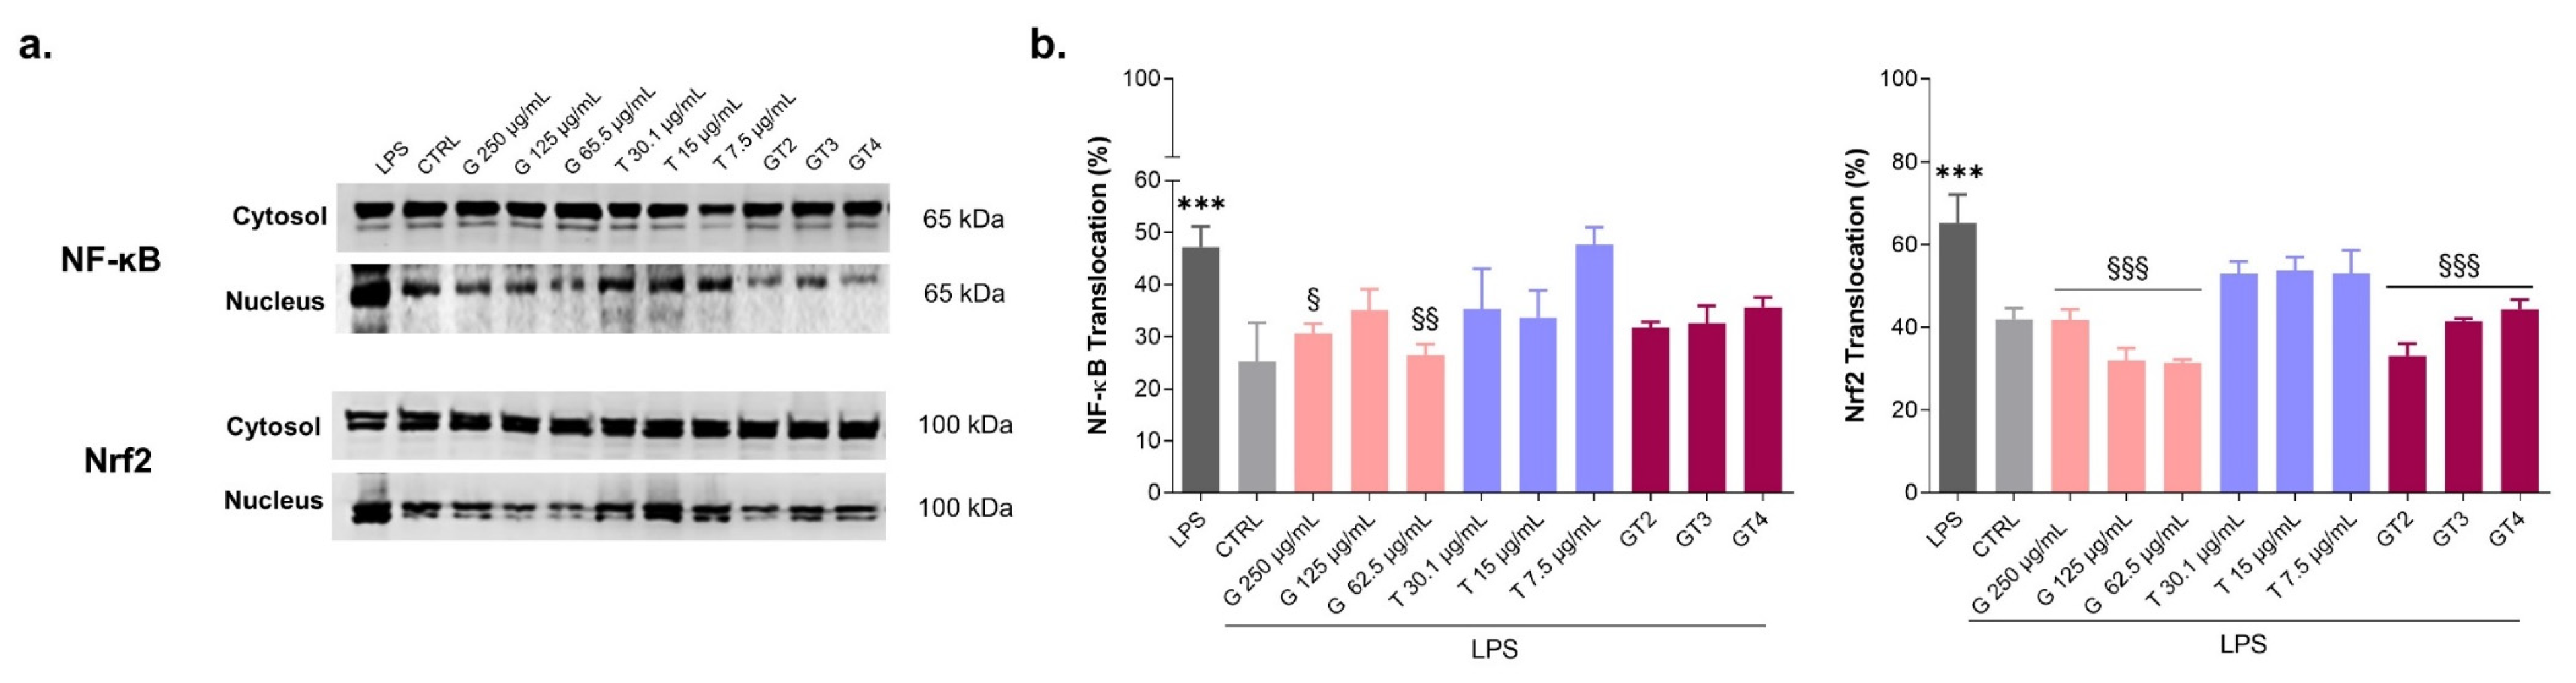
3.3. Levels of Expression of NF-ĸB and Nrf2 in LPS-Stimulated Macrophages in the Presence of Graminex®G96® and Teupol 25P

As expected, NF-ĸB and Nrf2 are found both translocated from cytosols to nuclei of macrophages stimulated with LPS (Figure 3a,b), which is a sign of inflammation. G can decrease NF-ĸB translocation to the level of untreated control. In parallel, the translocation of Nrf2 is even more inhibited by G in a dose-dependent manner. On the other hand, T is only slightly capable of suppressing both NF-ĸB and Nrf2 translocation compared to G. As for GT combinations, NF-ĸB translocation is not affected since it is comparable to G alone whereas nuclear Nrf2 levels are found to slightly but significantly increase in the presence of GT in a dose-dependent manner (p < 0.0001).

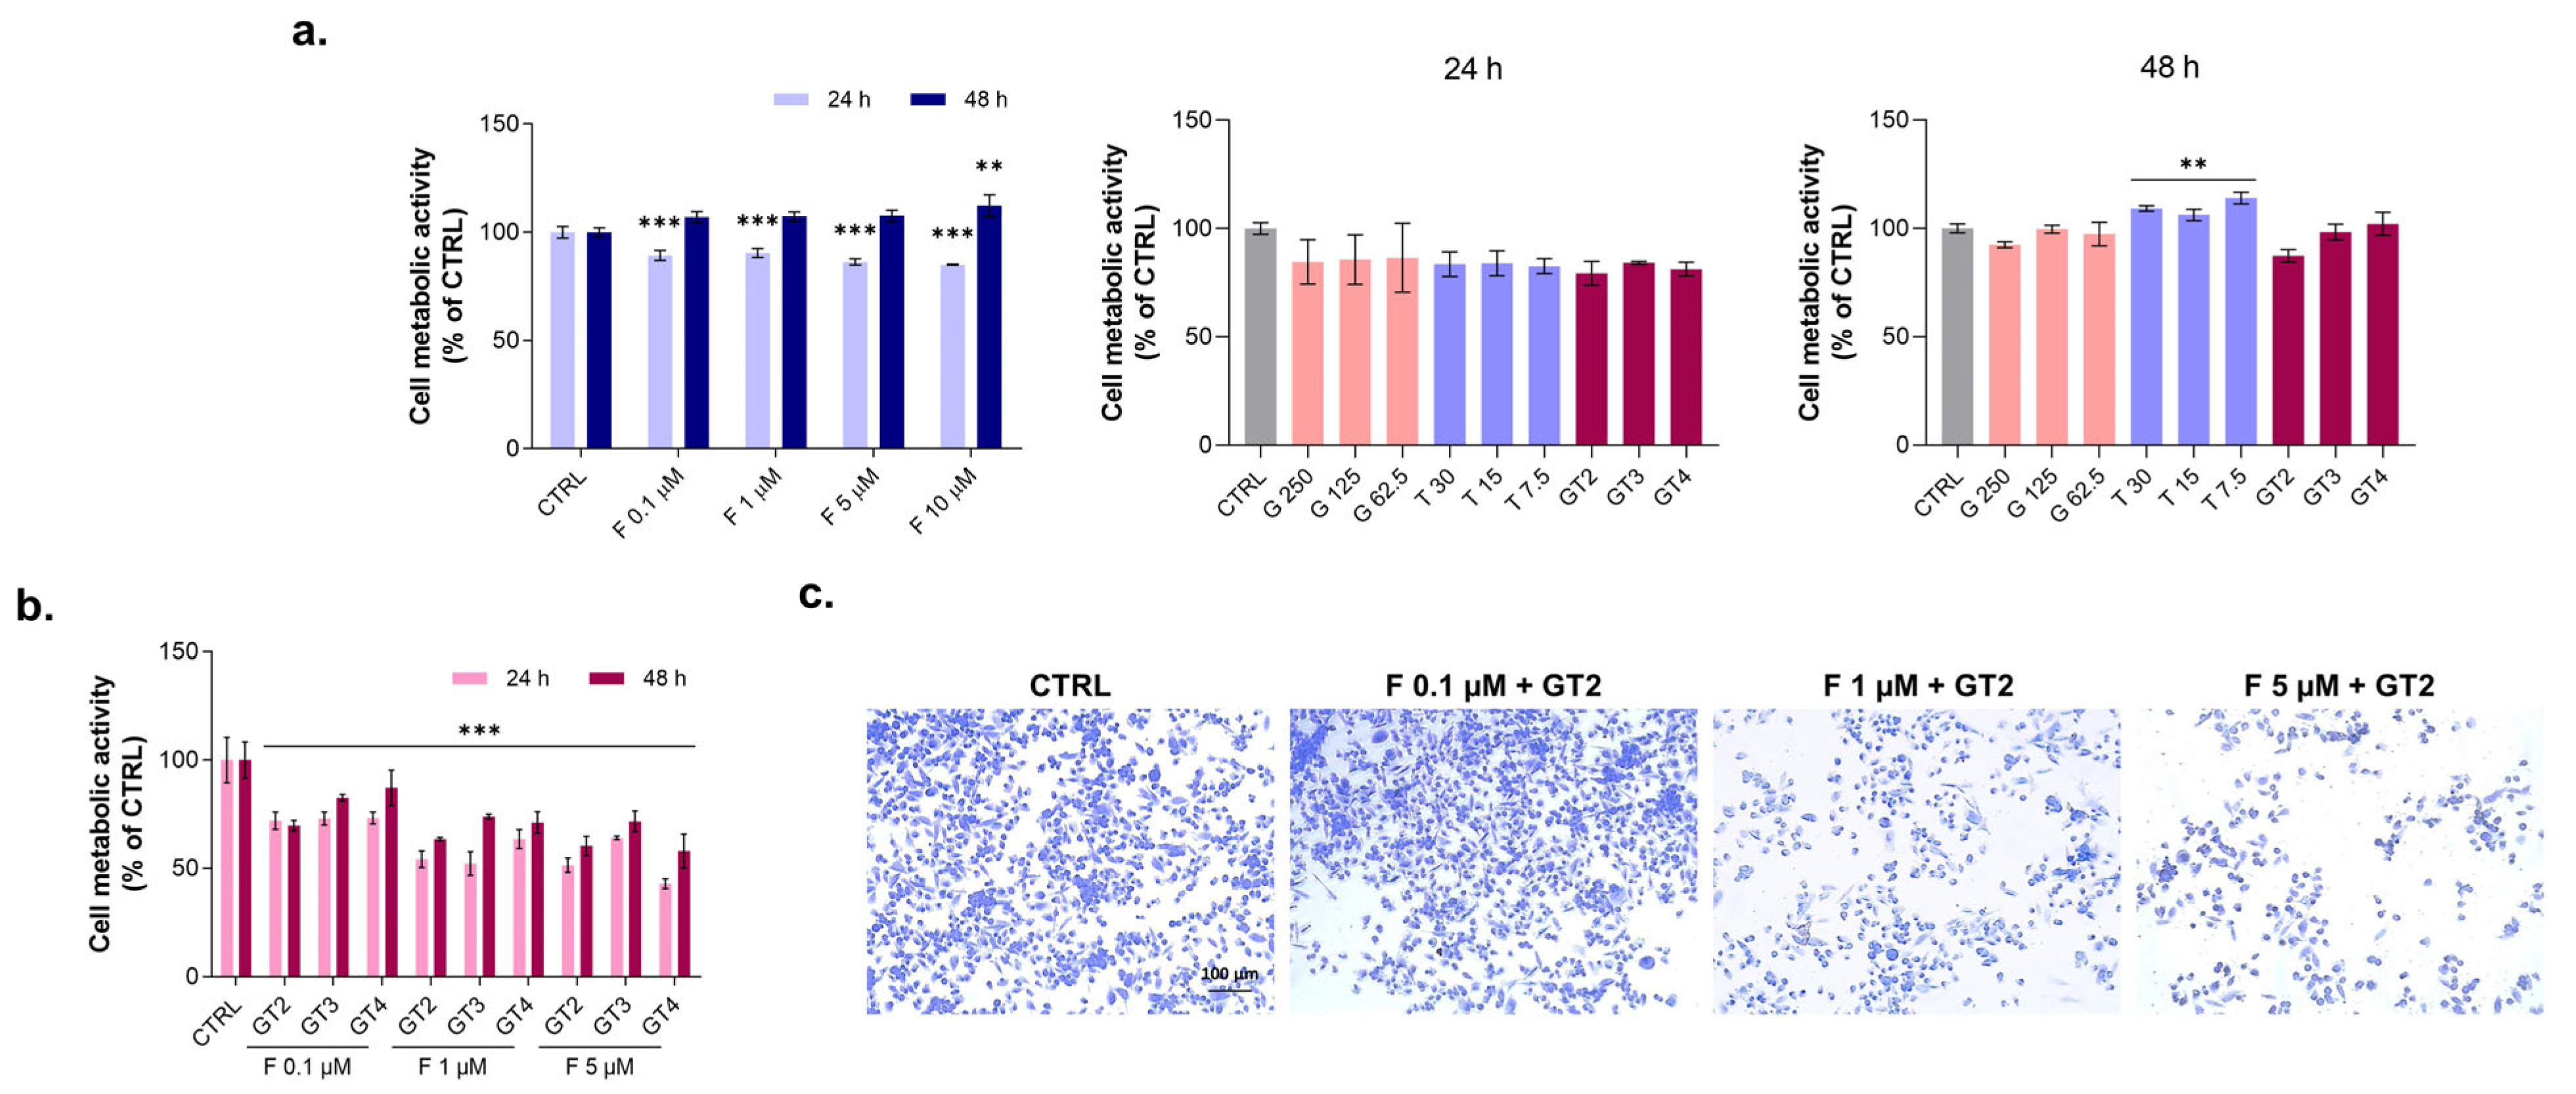
3.4. Evaluation of Graminex®G96® and Teupol 25P Effect on Cell Metabolic Activity of PC-3 Cells in the Presence of Finasteride

PC-3 cells were here used as a cell model expressing the 5α-reductase enzyme [8]. After 24 h of treatment, F affects PC-3 cell metabolic activity in a dose-dependent manner (Figure 4a). In parallel, a 48 h exposure is ineffective. G and T alone are not effective on the metabolic activity of PC-3 cells both after 24 and 48 h. The only exception is T at 48 h, which can activate cells in a significant manner (p < 0.001). On the other hand, when PC-3 cells are exposed to GT and F in several combinations (Figure 4b), the cell metabolic activity dramatically decreases both at 24 and 48 h. In detail, cell metabolic activity percentages decrease in dependance of the F and the GT concentration and are found to be more minor than F, G, or T alone. The best GT combination is the GT2 one, as also demonstrated by Crystal Violet images, which highlights the fall in cell density paralleled by a decreased staining uptake and the presence of round-shaped, almost-detached cells (Figure 4c).

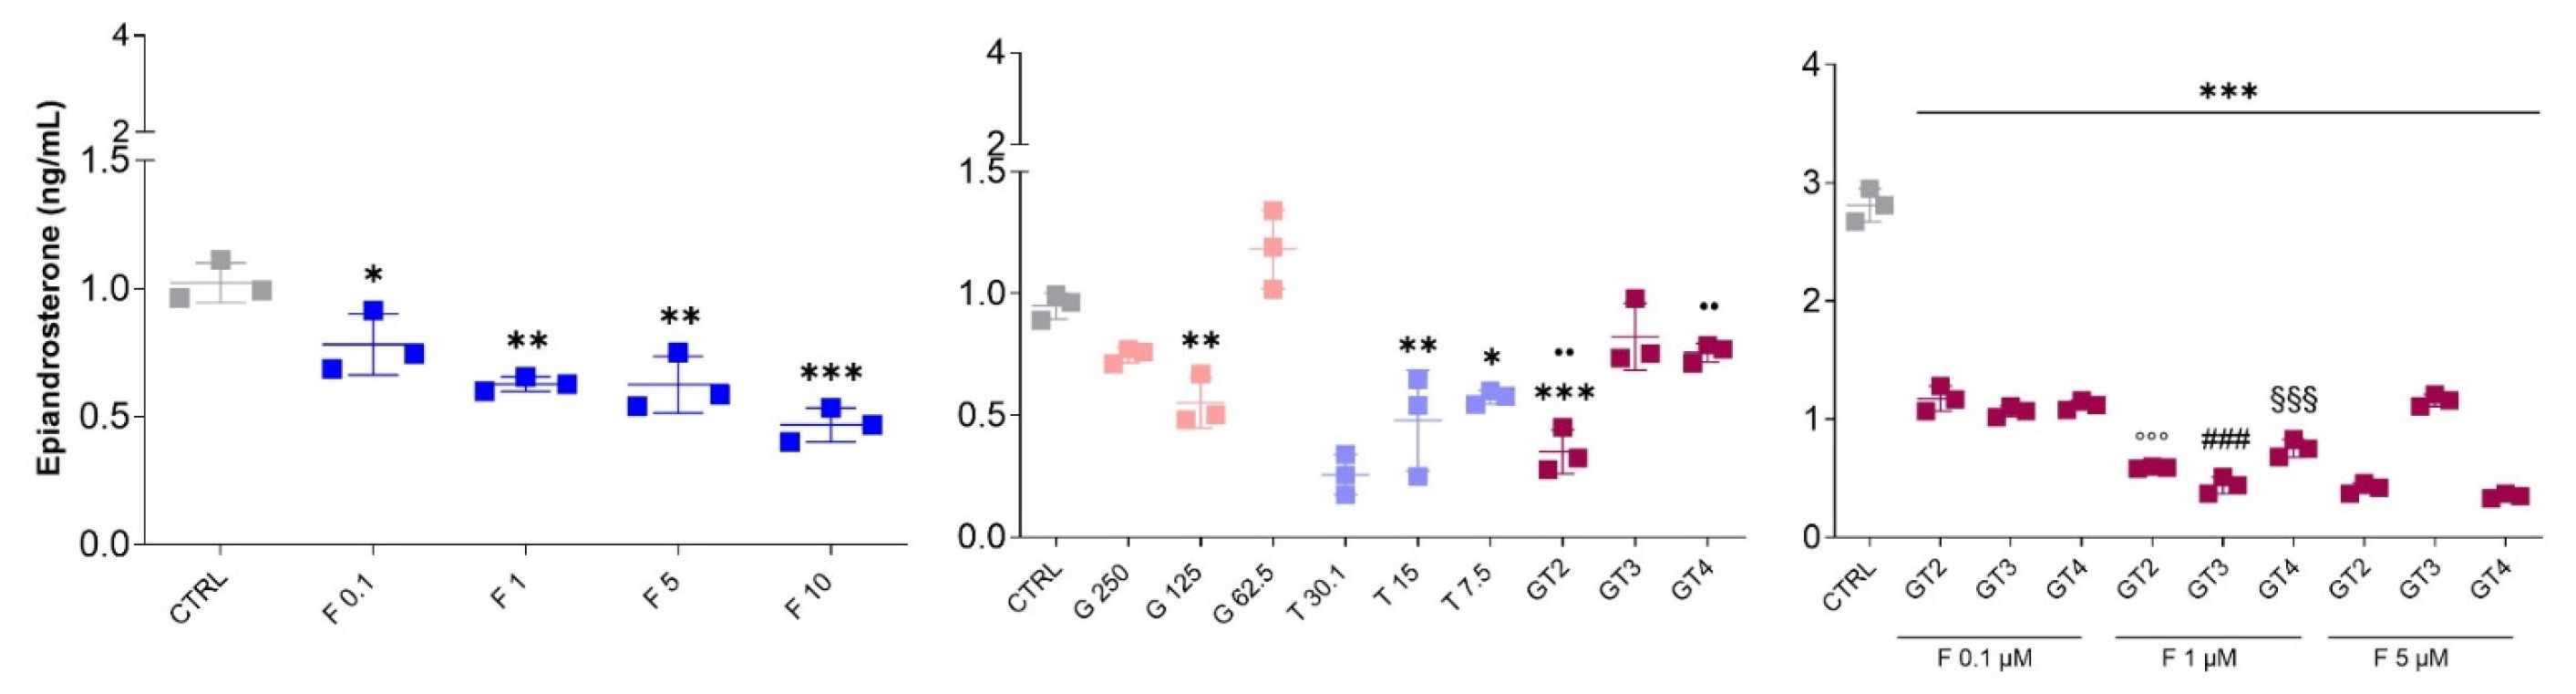
3.5. Epiandrosterone Detection in PC-3 Cells in the Presence of Graminex®G96®, Teupol 25P, or Finasteride

As expected, F decreases the amounts of epiandrosterone in a dose-dependent manner (Figure 5). In the presence of G alone, epiandrosterone levels only decrease significantly at 125 µg/mL (p < 0.001). In parallel, T can reduce epiandrosterone amounts dramatically and in a dose-dependent manner. GT combinations decrease epiandrosterone, but values registered are not significant compared to T alone at the same concentrations. On the contrary, when F is added to the system, epiandrosterone concentrations undergo a general fall, mainly with F at 1 µM.

3.6. Evaluation of Graminex®G96® and Teupol 25P Cytotoxicity in Benign Prostatic Hyperplasia Cells

Cell viability determined by MTT shows a slight decrease following G treatment after 48 h at different concentrations (G 31.25, 62.5, 125, 250, and 500 µg/mL) (Figure 6a), while no evident change is observed following T treatment in the same conditions at different concentrations (T 3.75, 7.5, 15, 30.1, 60, and 120 µg/mL) (Figure 6b). Finasteride (F) was also used as a positive control as it represents the gold standard for BPH treatment. After 24 and 48 h no significant reduction in cell viability is observed for the following tested concentrations: 0.1, 1, 5, 10, and 25 µM (Figure 6c). Subsequently, three combination treatments of G and T, namely GT2, GT3, and GT4, were administered for 48 h and compared to finasteride treatment alone. Results show a significant decrease in cell proliferation after GT2, GT3, and GT4 treatment (p < 0.005) (Figure 6d).

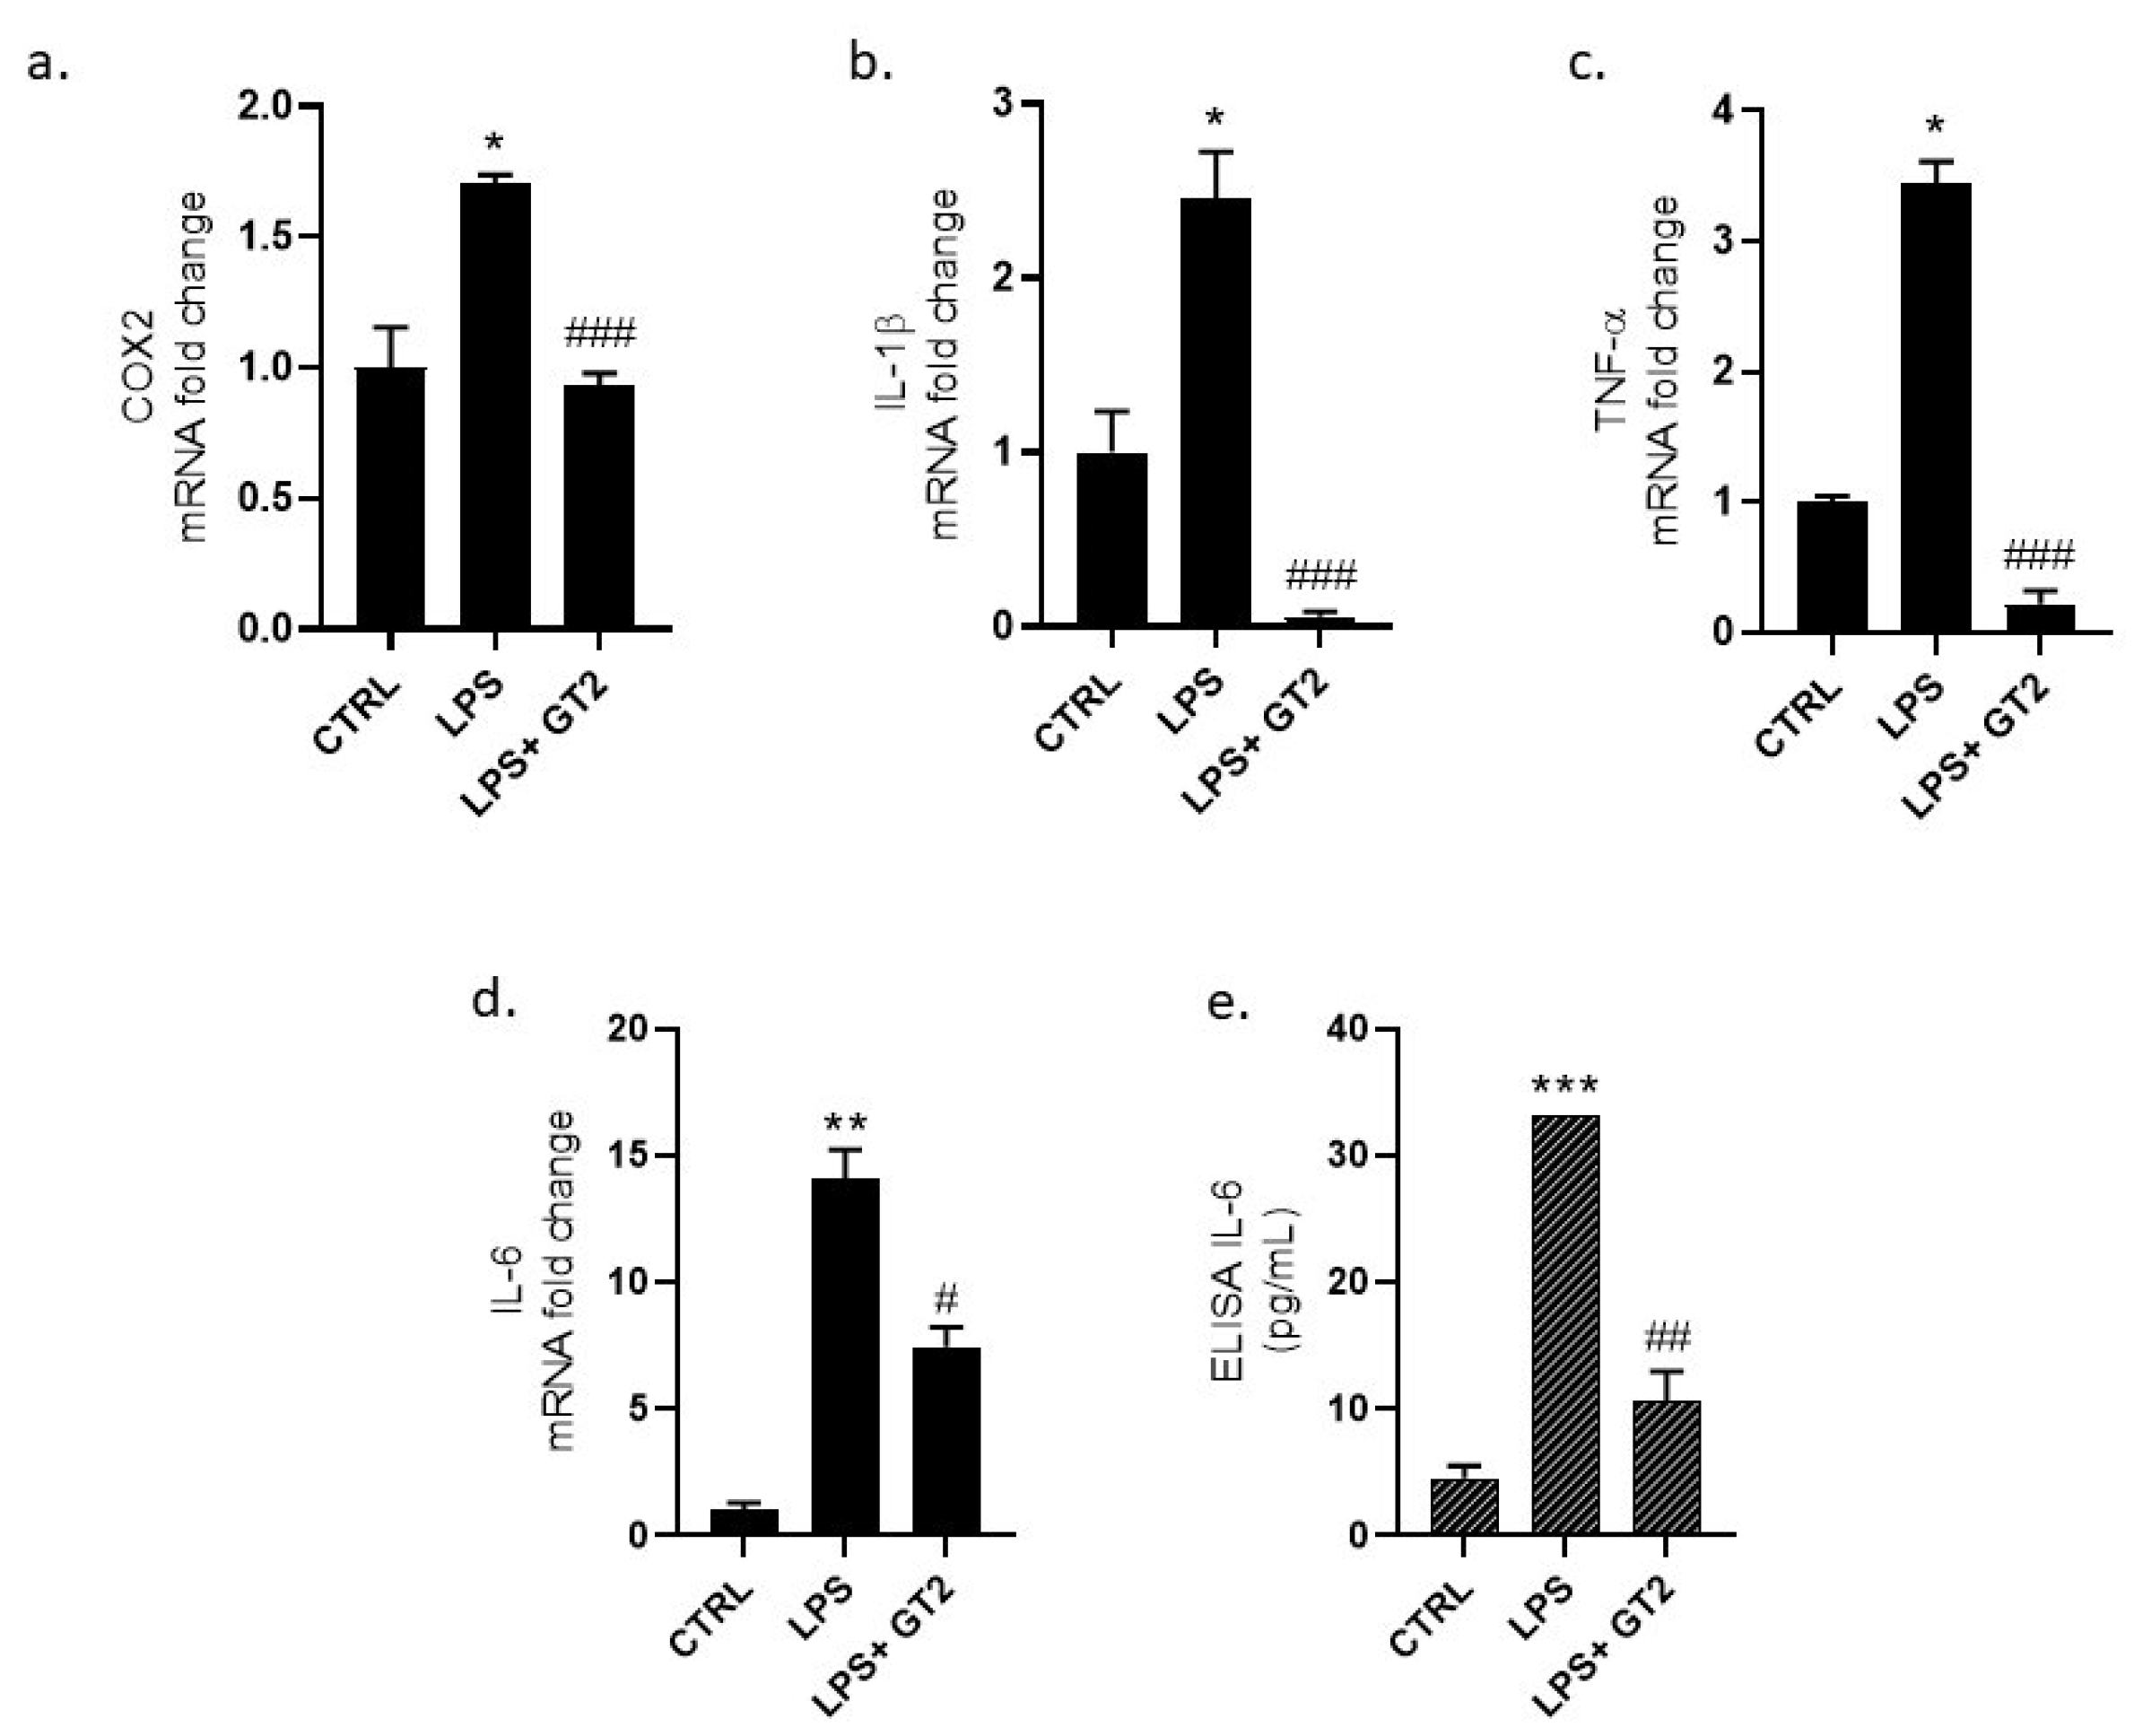
3.7. Evaluation of GT Anti-Inflammatory Activity

A combination of G and T, particularly GT2, was used for further experiments in order to study the anti-inflammatory effects on BPH-1 cells challenged with LPS. Indeed, GT2 was the more convenient dose combination in previous sets of experiments, showing an ability to modulate antioxidant response systems and reduce not only macrophages activation but also PC-3 proliferation. Thus, a more in-depth investigation was conducted on BPH-1 cells using the selected combination. Co-treatment of LPS and GT2 for 24 h show a significant reduction in terms of the pro-inflammatory markers mRNA levels, in particular cyclooxygenase-2 (COX-2) (p < 0.0005), interleukin-1β (IL-1β) (p < 0.0005), tumor necrosis factor-α (TNF-α) (p < 0.0005), and interleukin-6 (IL-6) (p < 0.05) were analyzed (Figure 7a–d). To further confirm anti-inflammatory activity, IL-6 cytokine release was measured in the conditioned media of BPH-1 cells following treatment with LPS + GT2 for 24 h by an ELISA immunoassay. Results show a significant (p < 0.005) decrease in the main pro-inflammatory marker compared to LPS treatment alone (Figure 7e).

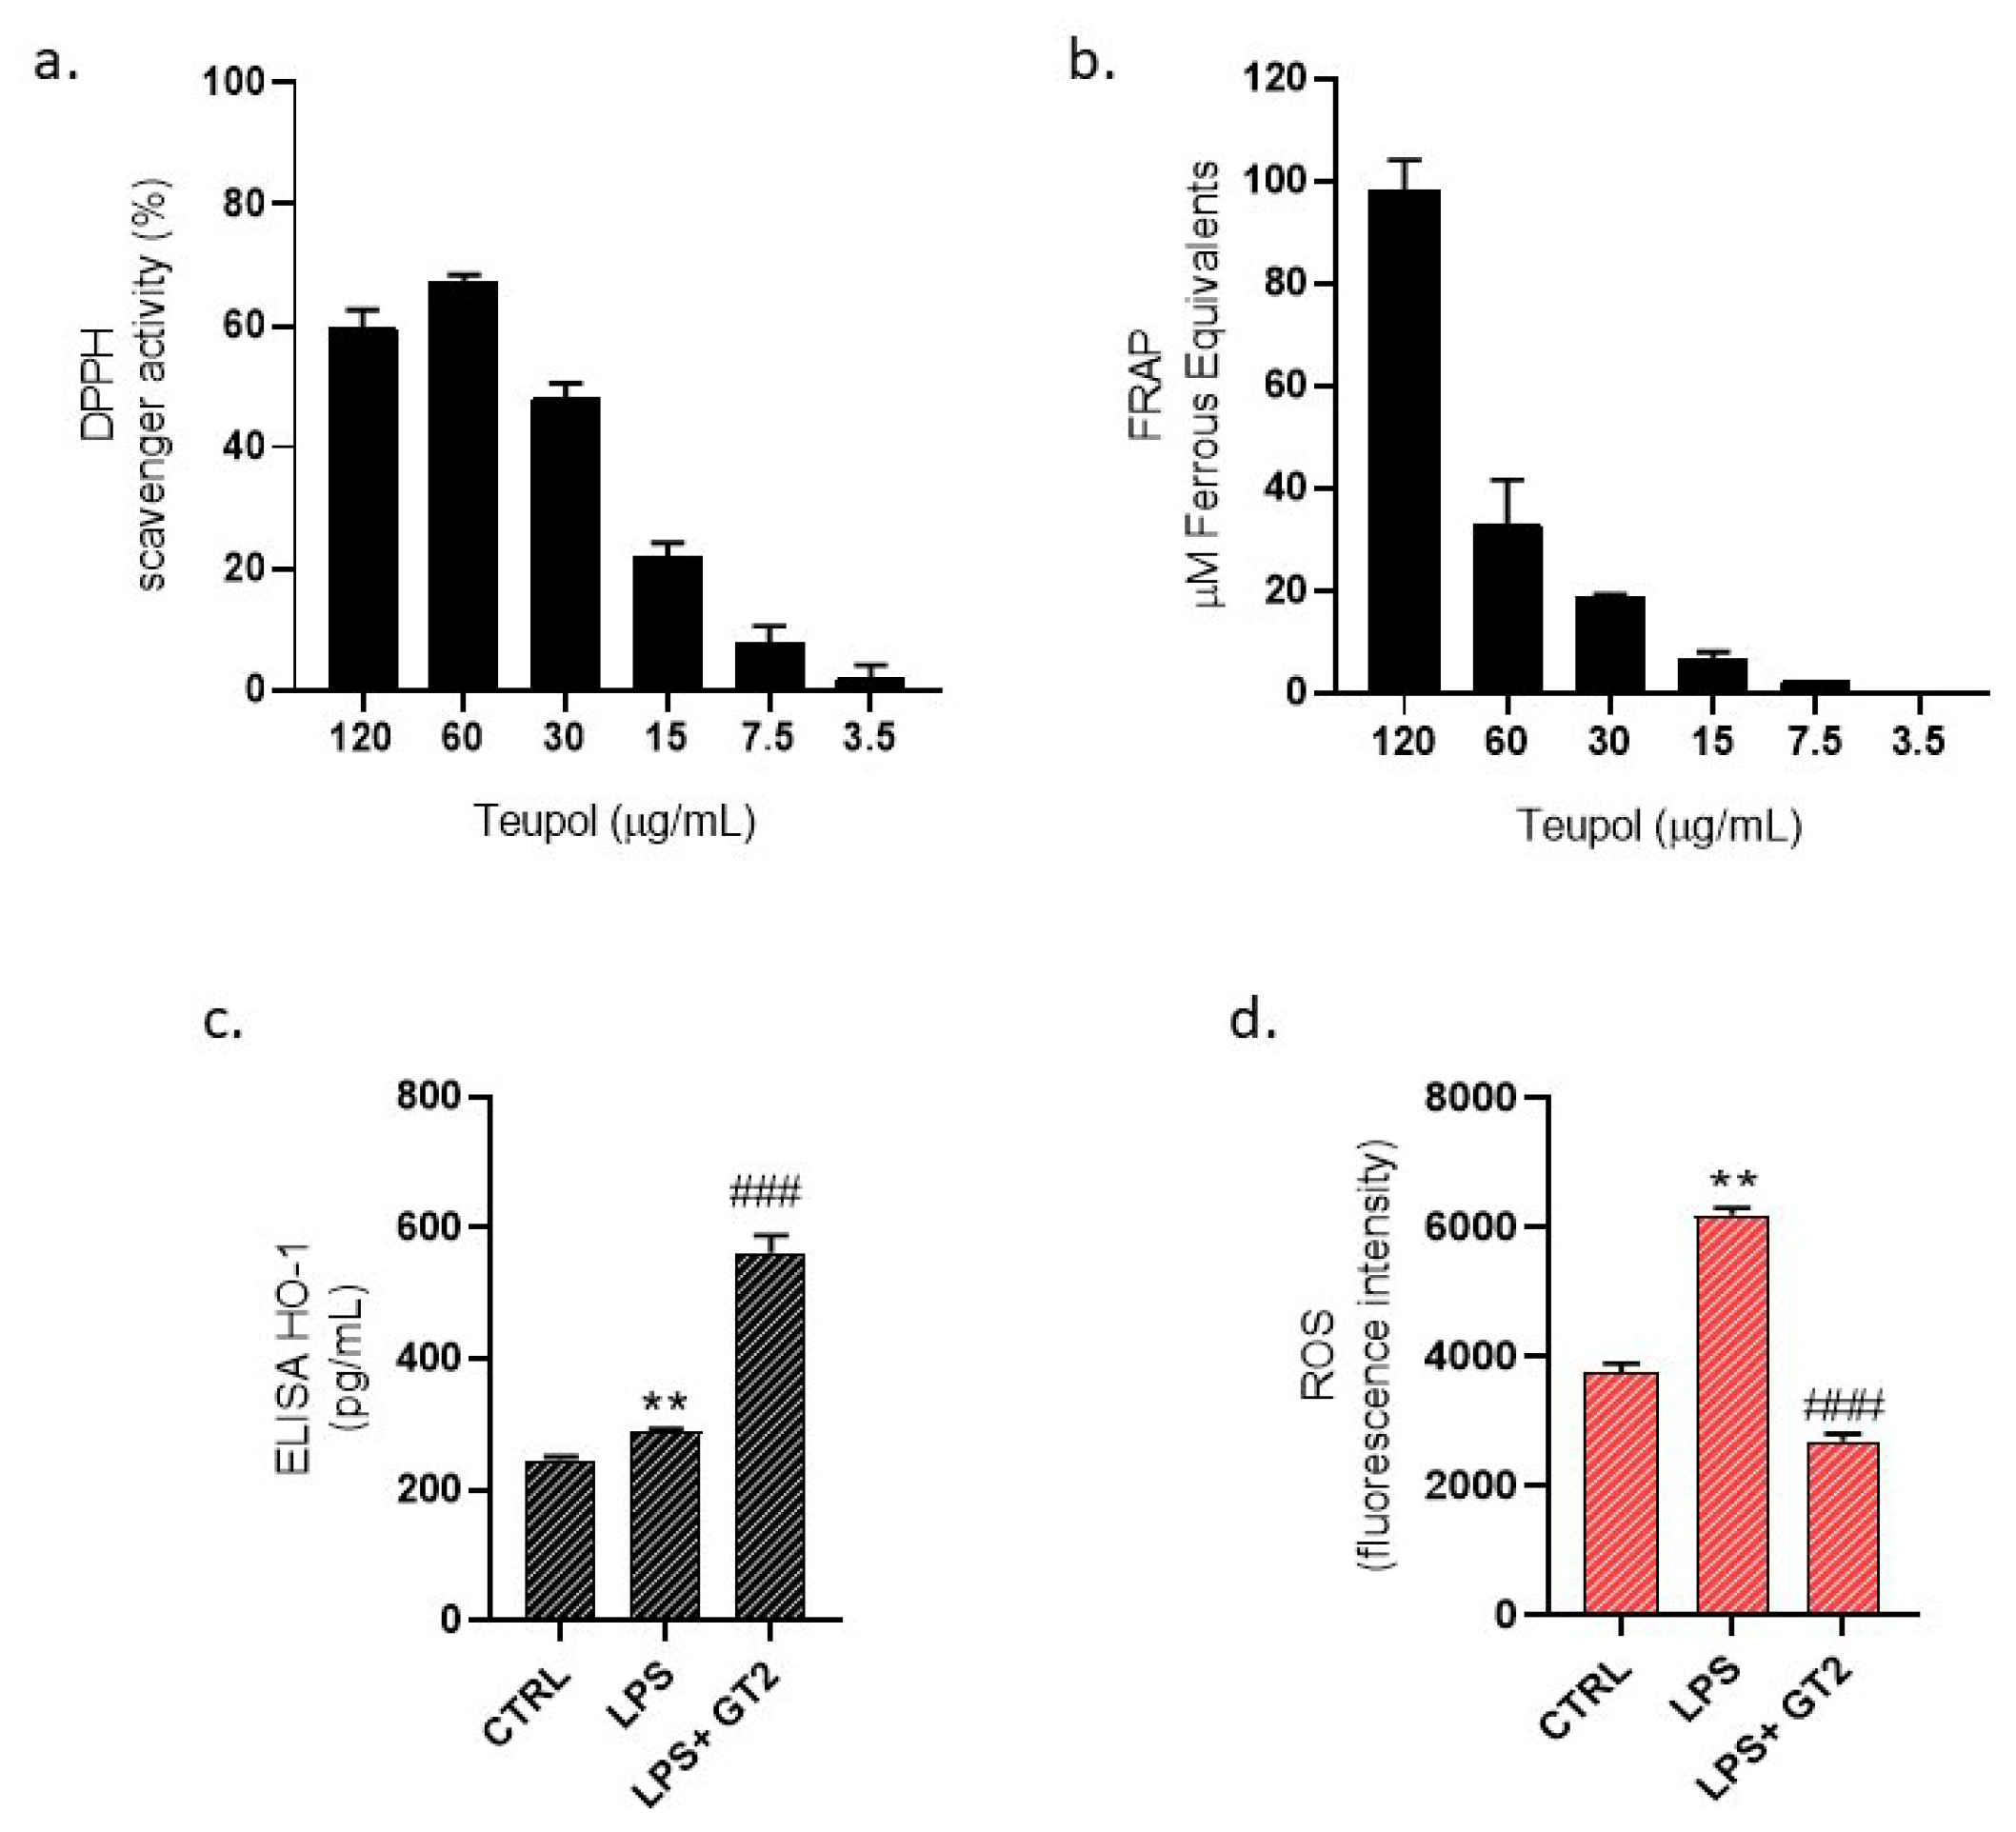
3.8. Evaluation of GT Antioxidant Activity

Cell-free evaluation of antioxidant capacity was performed, indeed DPPH assay and FRAP assay were used, respectively, for the scavenger capacity and iron reducing activity measurements of G and T. In the cell-free model no significant data were obtained for G (as also previously reported) [11], however a strong antioxidant capacity overall for T is appreciable in a dose-dependent manner (Figure 8a,b). Additionally, cytoprotective and antioxidant protein Heme-oxygenase-1 (HO-1) levels were also evaluated in BPH-1 cultured cells by an ELISA immunoassay, showing the GT2 ability of increasing HO-1 expression (p < 0.0005) in the presence of LPS after 24 h (Figure 8c). These data suggest a potential antioxidant effect of G and T. Subsequently, in vitro measurement of reactive oxygen species (ROS) using fluorescent probe 2′,7′-dichlorofluorescein diacetate (DCFH-DA) was performed (Figure 8d) to evaluate the antioxidant capacity of the combination treatment. LPS alone and co-treatment of LPS+ GT2 were administered for the measurement of ROS in vitro. Indeed, LPS shows a marked increase in ROS production after 6 h while co-treatment with GT2 was able to dampen free radicals and significantly (p < 0.0005) reduce intracellular oxidative stress (Figure 8d).

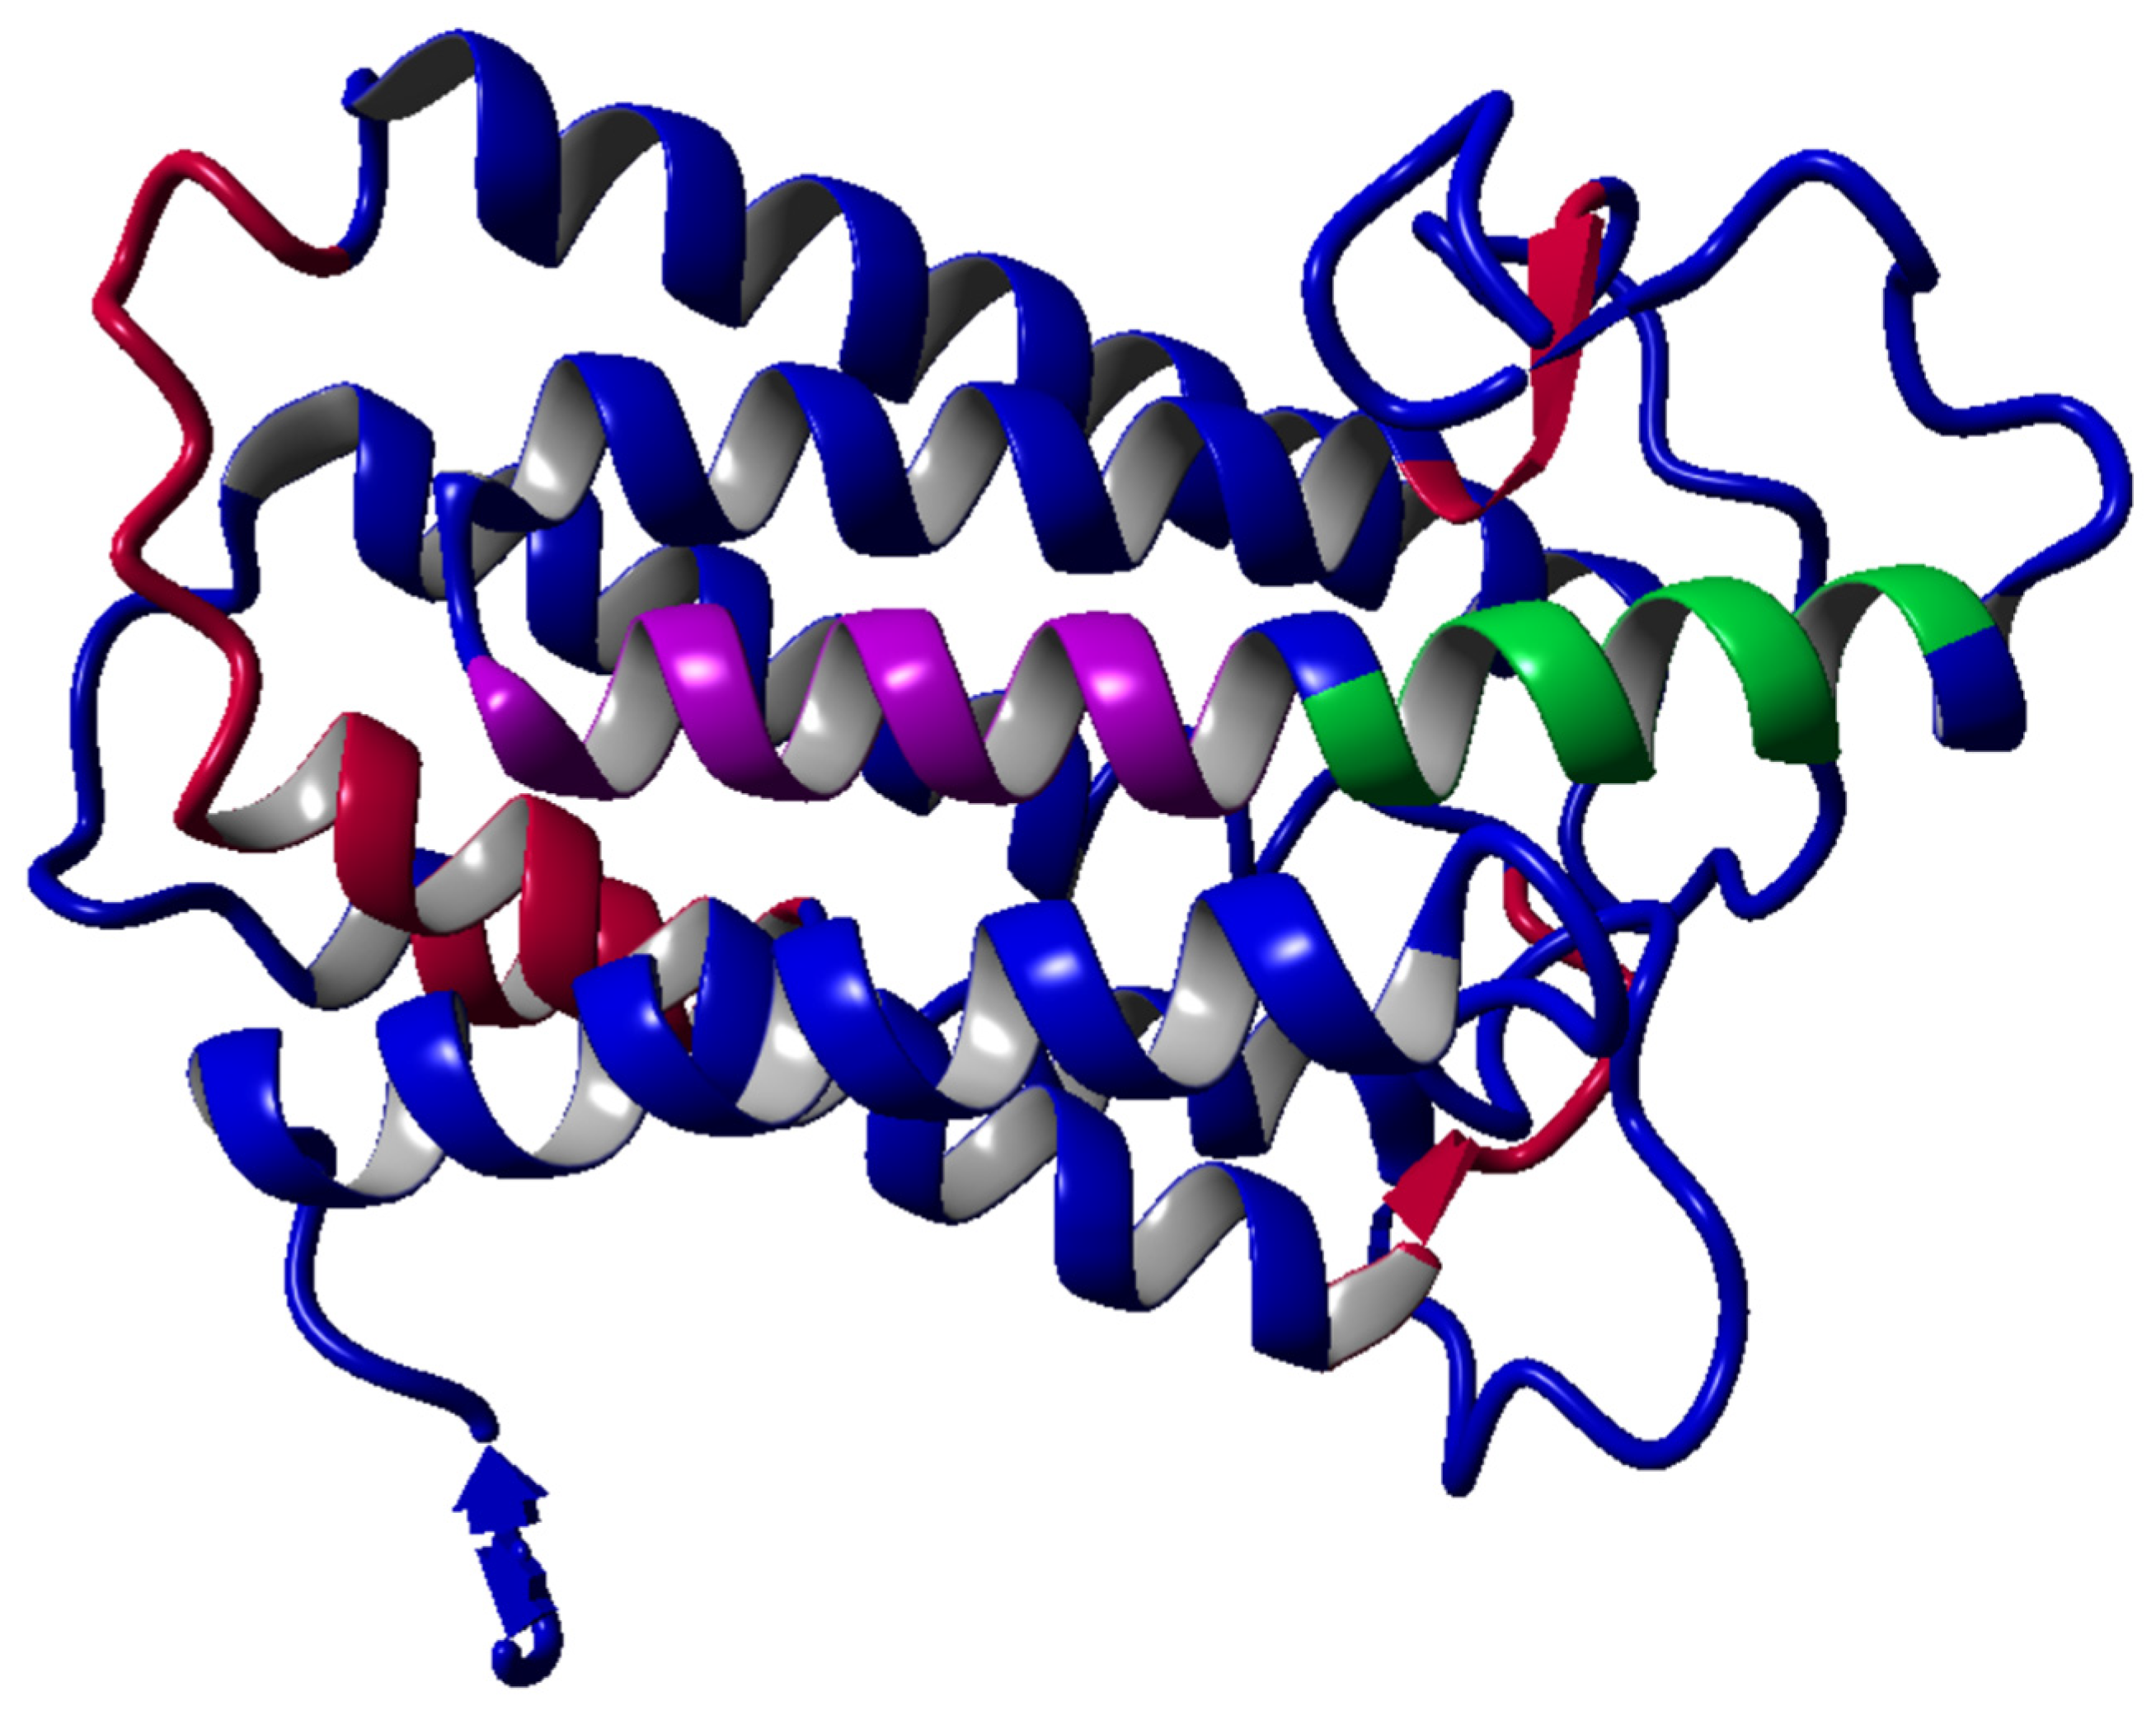
3.9. The Homology Modeling for Target Human 5α-Reductase 1

Since there was no 3D structure of human 5α-reductase 1 available in the RCSB Protein Data Bank (https://www.rcsb.org accessed on 21 January 2025), the 3D structure of the 5α-reductase 1 target sequence has been predicted by YASARA’s homology modeling experiment. The target sequence contains 259 residues in one molecule. Since the target sequence was the only available information, possible templates were identified by running 3 PSI-BLAST iterations to extract a position specific scoring matrix (PSSM) from UniRef90, and then searching the PDB for a match (i.e., hits with an E-value below the homology modeling cutoff 0.1). The two hits found are shown in Table 1.
To aid alignment correction and loop modeling, a secondary structure prediction for the target sequence had to be obtained. This was achieved by running PSI-BLAST to create a target sequence profile and feeding it to the PSI-Pred secondary structure prediction algorithm [29]. The best parts of the seven models were combined to obtain a hybrid model, aiming to increase the accuracy beyond each of the contributors. The resulting hybrid model obtained the quality Z-scores shown in Table 2 (the score includes floppy terminal tails).
The following Figure 9 shows the initial model in blue, and all hybridized parts in a different color. This hybrid model with a Z-score of −0.269 was saved as the final one.

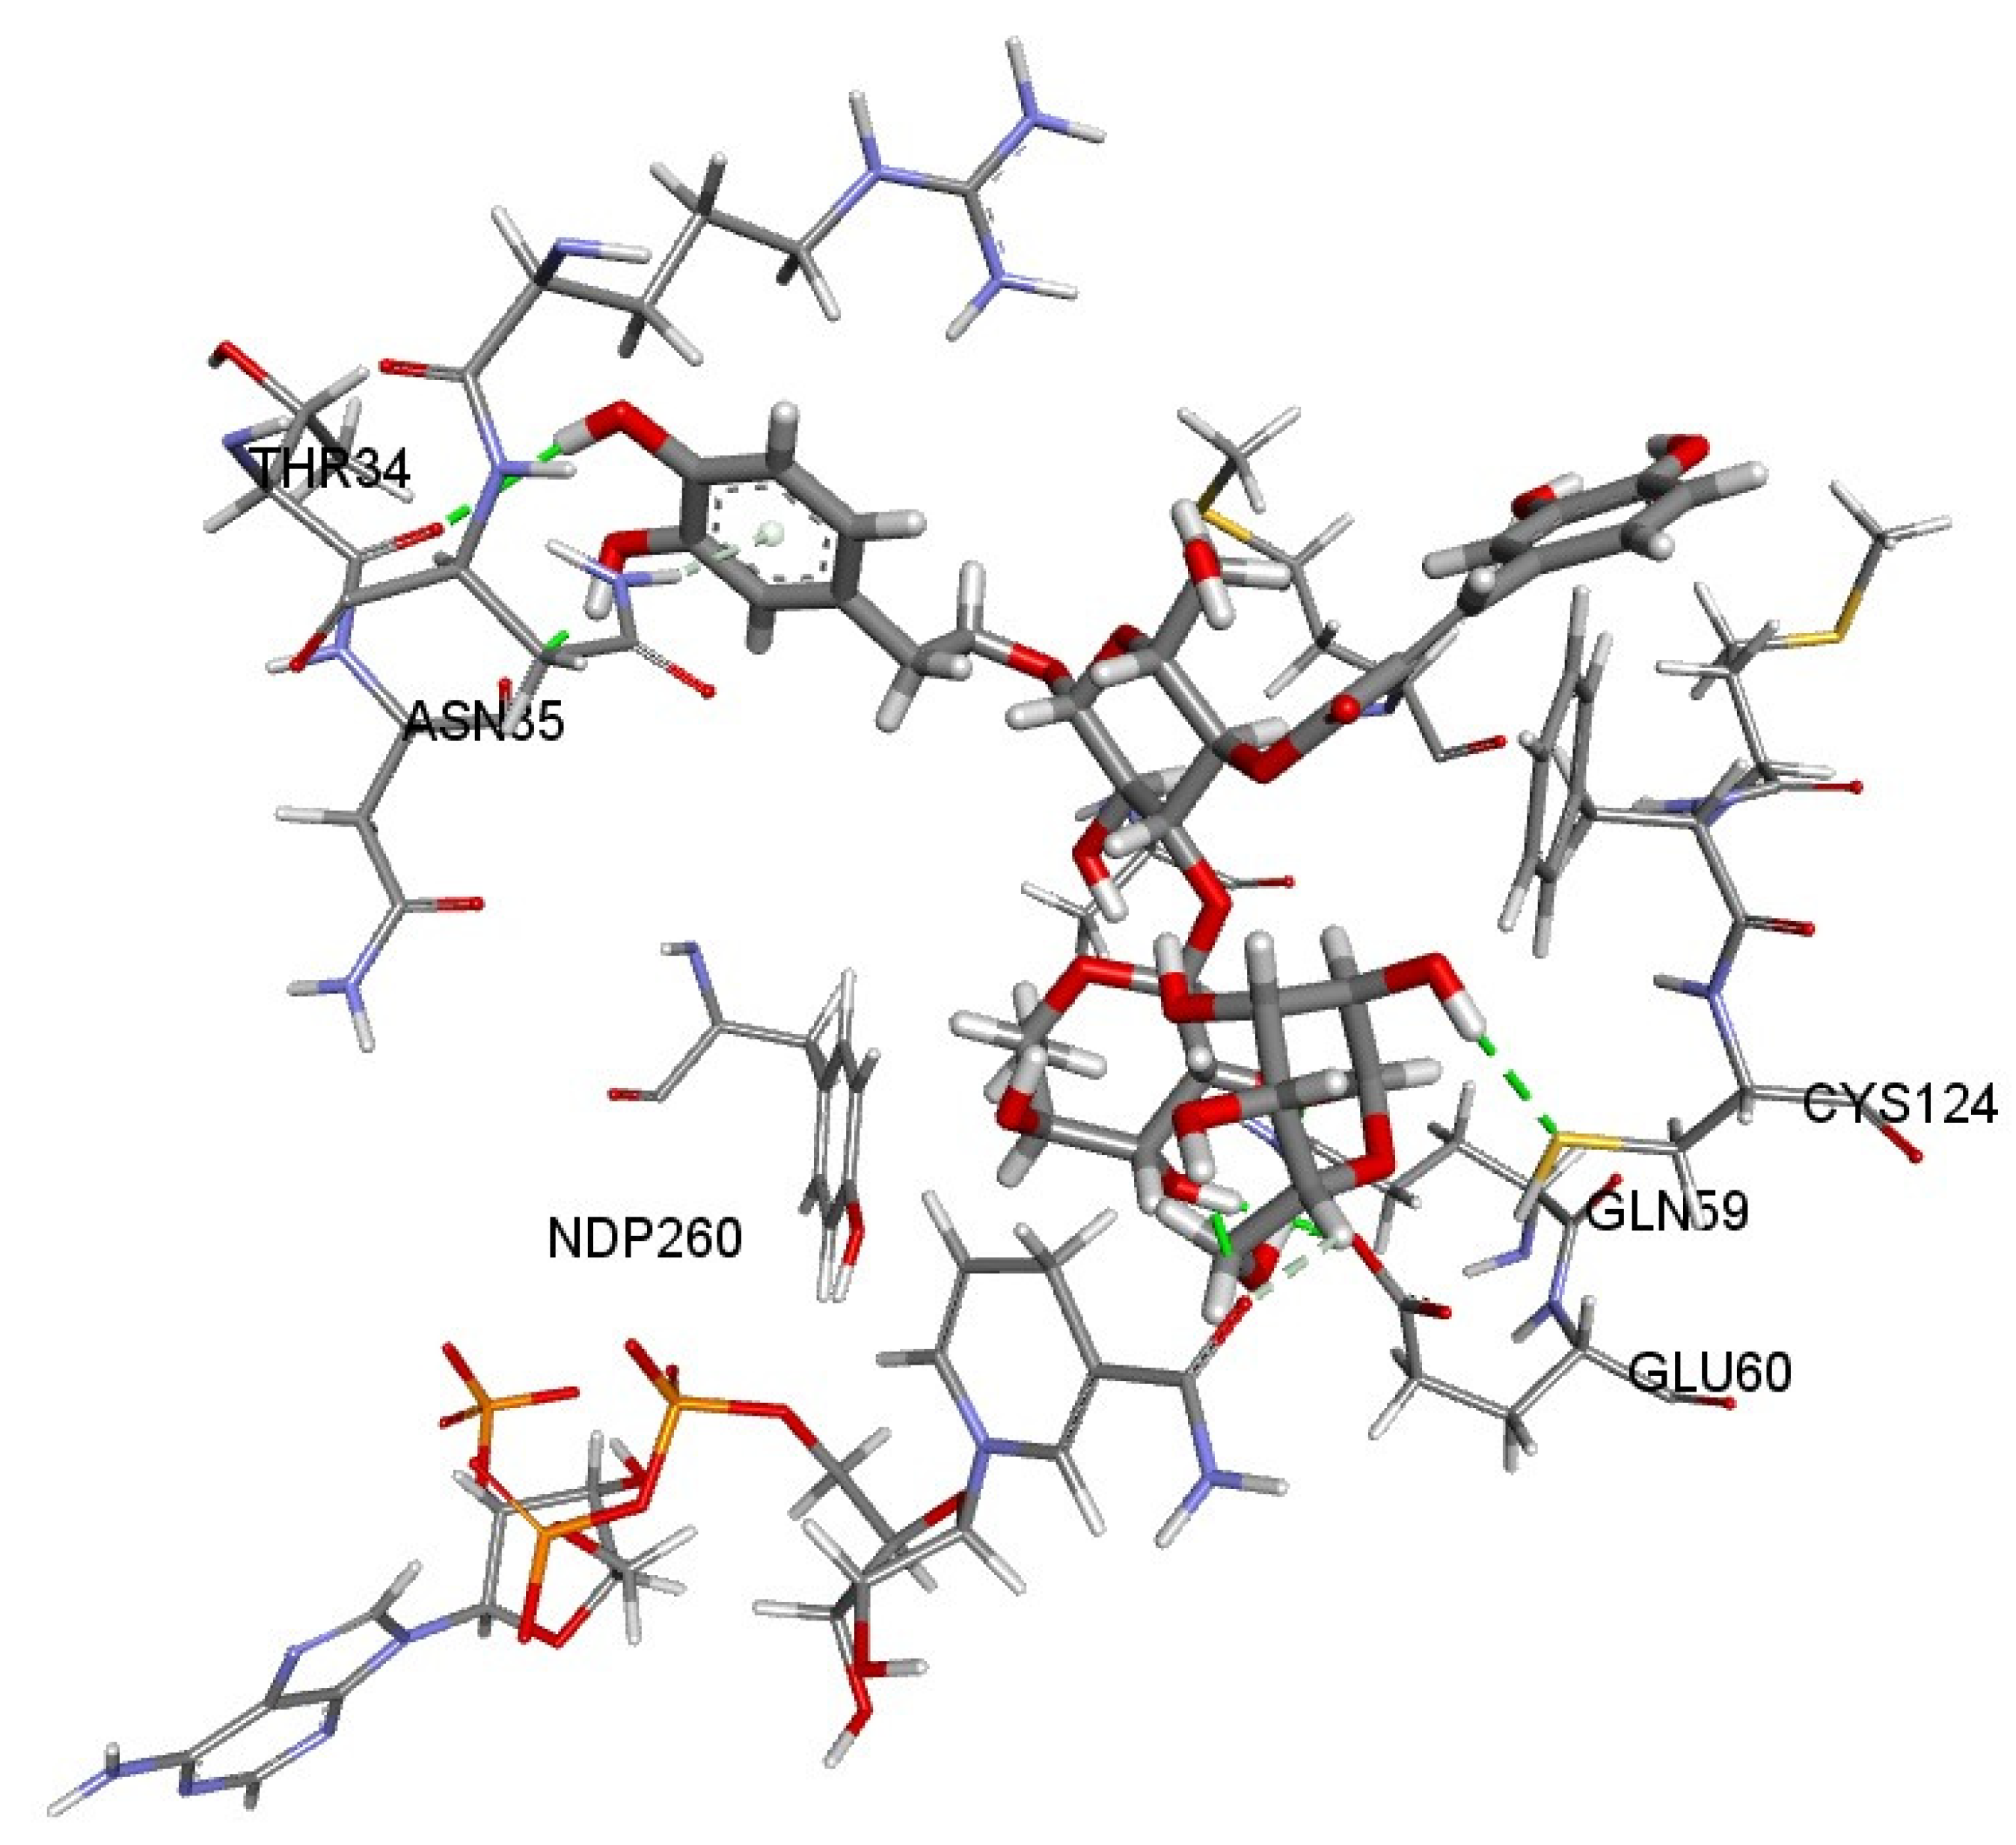
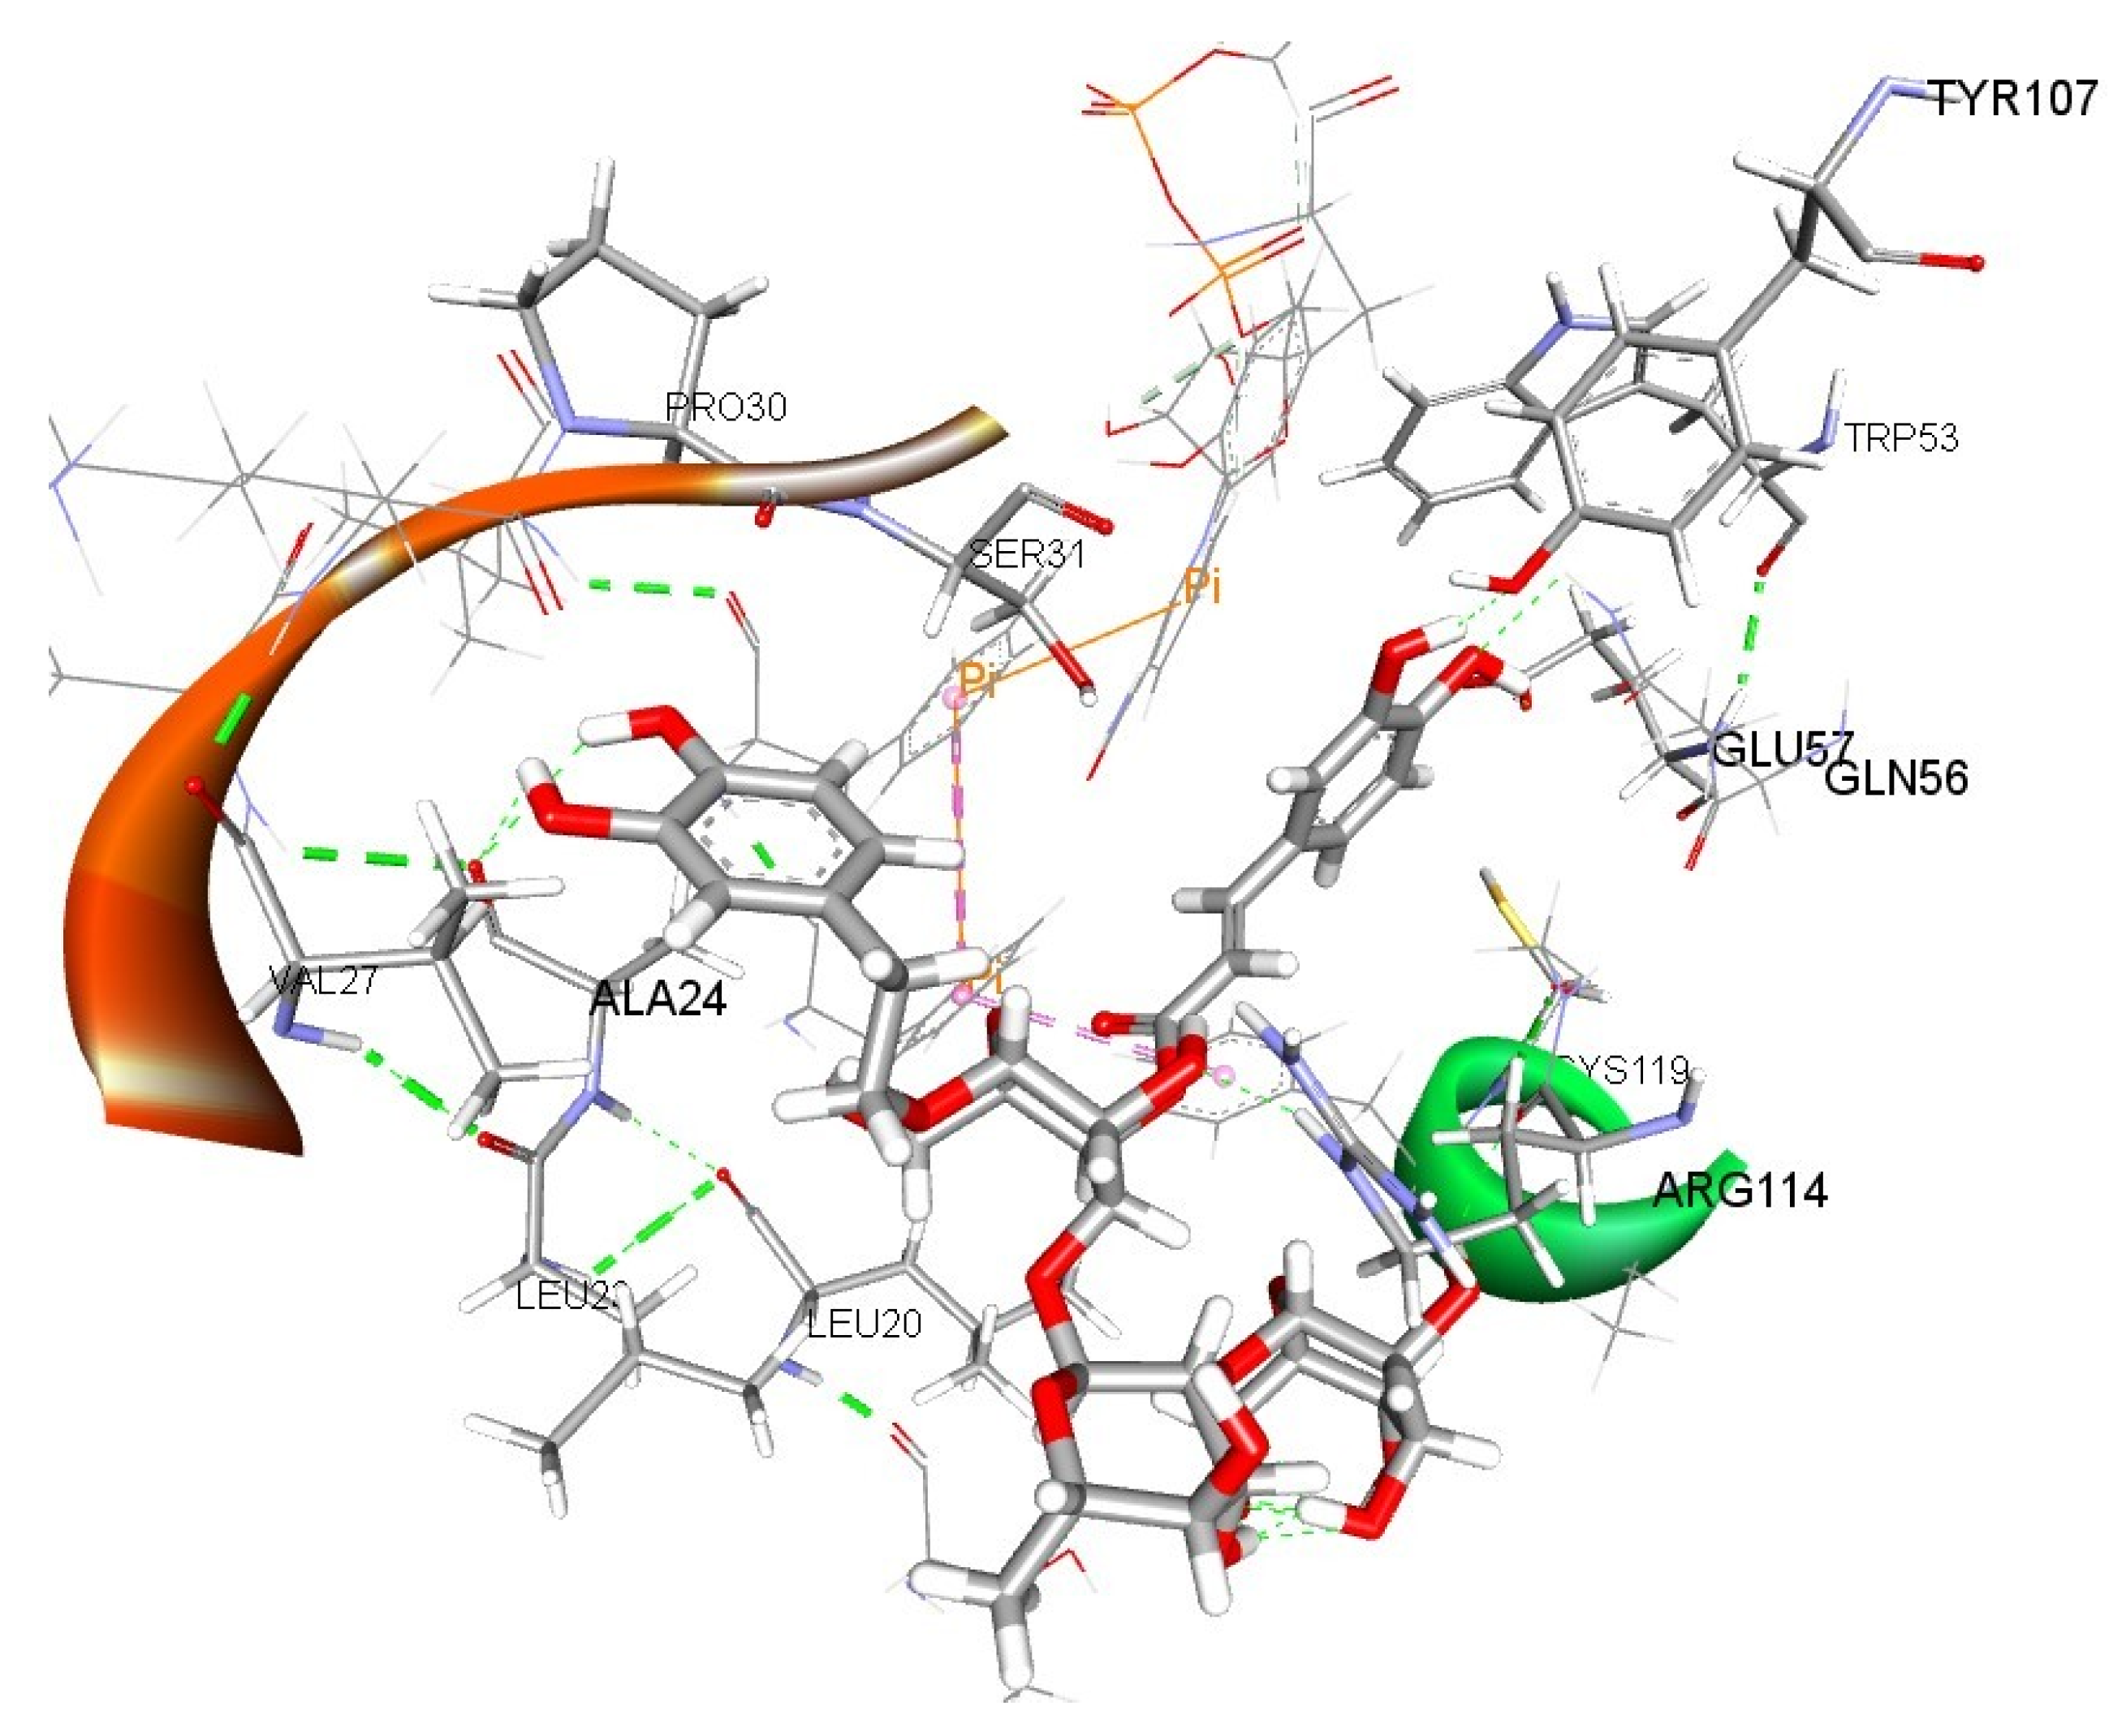
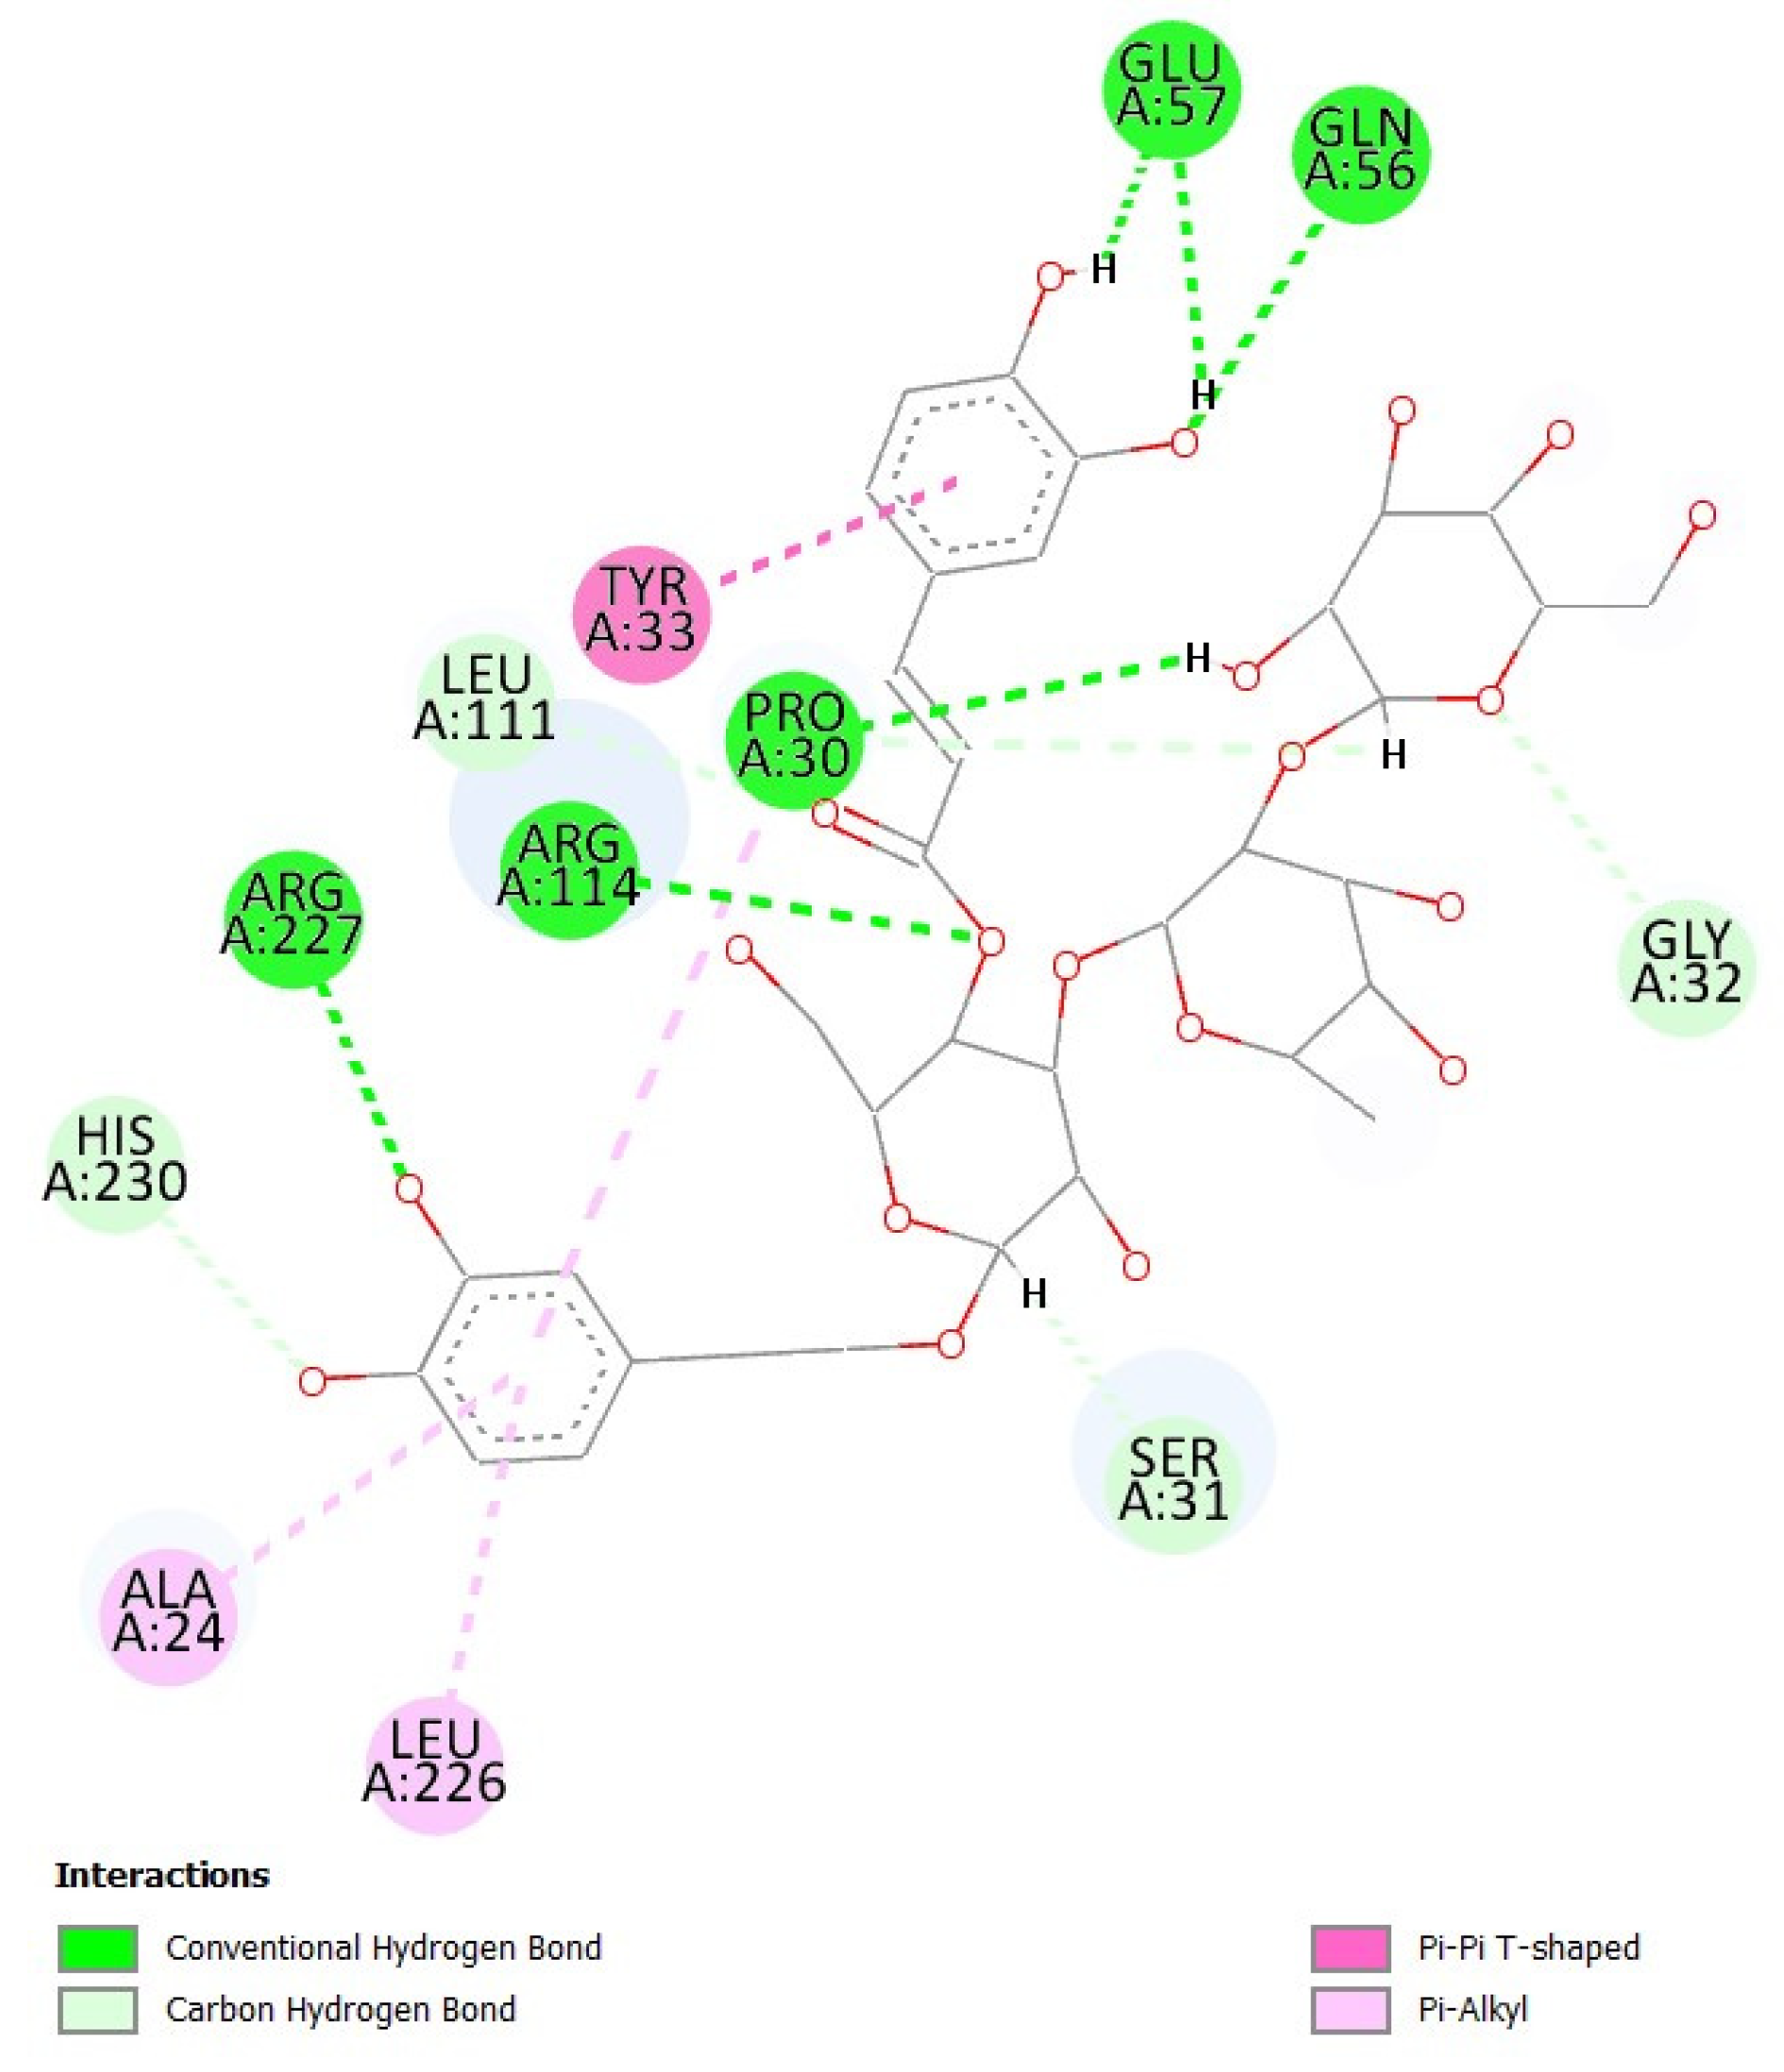
3.10. Evaluation of Binding Interactions of Teupolioside Assessed by Molecular Docking Analysis

Three different ligands were docked with 25 runs each to two targets, human 5α-reductase 1 and 5α-reductase 2 receptors, yielding the results shown in Table 3 and Table 4, which are sorted by binding energy and dissociation constant values. Binding energy refers to the energy change when a ligand binds to a target (typically a protein) and it is usually expressed in kcal/mol or kJ/mol. The more negative a binding energy indicates a more stable and favorable interaction between the ligand and the protein, or how energetically favorable the interaction is. Dissociation constant, usually expressed in molarity (M), refers to the strength of the interaction between a ligand and its target, or how tightly a ligand binds to its target. Lower values mean higher affinity and a lower concentration needed to achieve a biological effect.
Figure 10 and Figure 11 show the binding mode of teupolioside with the human 5α-reductase 1. It is evident that numerous interactions were involved in stabilizing this complex, including (un)conventional H-bonds, Pi-Pi, and Pi-Alkyl bond types between teupolioside and the receptor’s amino acid residues. Notable is also an H-bond between the teupolioside hydroxy group and NADPH (labeled NDP 260 in Figure 10 and Figure 11).
Teupolioside bound to the human 5α-reductase 2 receptor by forming numerous interactions, including H-bonds between the polar groups and amino acid residues of Pro 30, Gln 56, Glu 57, Arg 114, and Arg 227 (Figure 12 and Figure 13).

4. Discussion

Although finasteride represents the standard treatment for BPH and its efficacy can be observed after long therapeutic protocols, several side effects have been reported [30,31,32] and recent studies have demonstrated its potential pro-inflammatory effect [33,34]. It is therefore mandatory to find alternative medications or co-adjuvant natural products [35,36,37,38,39] for delaying resorting to finasteride in just the advanced stages of BHP. Although finasteride remains the standard treatment for benign prostatic hyperplasia (BPH), its therapeutic effects typically require prolonged administration and numerous side effects have been reported [30,31,32]. Moreover, recent studies have highlighted a potential pro-inflammatory action of finasteride [33,34]. Consequently, it is essential to explore alternative therapies or natural co-adjuvant compounds [35,36,37,38,39], with the aim of postponing the use of finasteride until the more advanced stages of BPH.
Finasteride efficacy has been demonstrated in vivo as its mechanism of action is effective in reducing prostate weight and volume [40]. However in vitro studies demonstrated that in monocultures of PC-3 and BPH-1 cells, finasteride did not induce cell death even at relatively high concentrations nor reduced cell proliferation, as was also observed in our experimental conditions (Figure 4 and Figure 6) [41]. Although cell lines are a relevant model, they do not fully replicate the cellular and microenvironmental complexity of human prostate tissue, particularly regarding stromal–epithelial interactions and immune components. PC-3 cell proliferation and viability are affected when finasteride is administered in parallel with G and T (Figure 4) as well as amounts of epiandrosterone (Figure 5), which is produced by the enzyme 5α-reductase from the adrenal hormone DHEA (dehydroepiandrosterone) [42]. It has been reported that 5α-reduced steroids, e.g., 5α-dihydrotestosterone, androsterone, epiandrosterone, 5α-androstene-3α,17β-diol, allopregnanolone, isopregnanolone, and some 5-ene steroids, such as dehydroepiandrosterone and pregnenolone, decreased gradually during finasteride treatment [43]. Surprisingly, combination treatment of G and T results in a reduced BPH-1 cell proliferation, suggesting a different mechanism of action compared to the gold standard finasteride. Furthermore, the selected combination GT2 shows anti-inflammatory properties by reducing cell metabolic activation, increasing catalase activity, restoring the NF-ĸB/Nrf2 imbalance in LPS-stimulated macrophages, and reducing COX-2, IL-6, IL-1β, and TNF-α gene expression, markers which are transcriptionally regulated by NF-ĸB. In particular, the role of IL-6 in BPH inflammation processes has been widely highlighted as it represents one of the major inflammatory drivers in the prostatic microenvironment [44,45,46]. Indeed, in our experimental conditions we observed a significant reduction in IL-6 release in BHP-1 cells, suggesting once again the anti-inflammatory effect of GT2.
Inflammation and oxidative stress are tightly interlaced and are considered important pathophysiological factors in human benign prostatic hyperplasia (BPH). The role of Nrf2 and heme oxygenase (HO-1) has already been investigated in patients affected by BPH. Studies have demonstrated the inverse correlation between Nrf2 and HO-1 expression and intraprostatic inflammation [47,48]. It has been recently demonstrated that, during the development of BPH, a synergistic effect occurs in response to inflammation, oxidative stress, and apoptosis induced by the activation of macrophages. The Nrf2 signaling pathway can mediate macrophage activation and inhibit prostate hyperplasia by suppressing pro-inflammatory factors, anti-oxidative stress disorder, and initiating apoptosis [6]. Immunocompetent cells display a tightly regulated balance between the NF-ĸB- and the Nrf2-related pathways and their dysregulation can lead to chronic inflammation and diseases which occur due to underlying oxidative stress being a trigger [49,50]. In our experimental models of inflammation, the activity rate of the Nrf2-dependent antioxidant enzyme catalase is induced (Figure 2). Moreover, the inhibition of NF-ĸB expression in LPS-stimulated macrophages is paralleled by the Nrf2 restoration to the level of control (Figure 3). Furthermore, HO-1 was observed to be upregulated following a co-administration with GT2 in accordance with the reduction in inflammatory markers gene expression, showing a beneficial effect of the combination in BPH-1 cells. In addition to its anti-inflammatory properties, GT2 proves to exert significant antioxidant activity both in cell-free tests and in vitro assays, as shown in Figure 8. The scavenger activity of Teupol 25P was assessed and in parallel with the previous data on Graminex®G96® it was possible to conclude that the combination has a potential intrinsic scavenger capacity. An antioxidant effect was then demonstrated in the cellular model as the combination was able to reduce ROS accumulation due to GT2’s ability to modulate Nrf-2 and NF-ĸB transcriptional activity.
Finally, in silico techniques were used to explain the possible inhibitory mechanism of teupolioside on the 5α-reductase receptor. While we are aware of the limitations inherent in computational modeling, our approach aimed to provide a preliminary framework to explore potential ligand interactions. The human 5α-reductase 1 and 2 are NADPH-dependent, membrane-associated (microsomal) enzymes composed of 259 and 254 amino acids, respectively. Their sequences contain a high proportion of hydrophobic amino acids, indicating that they are intrinsic membrane proteins deeply embedded in the lipid bilayer. Although both isozymes are integral membrane proteins and catalyze the same reaction, they exhibit only limited sequence homology [51,52,53]. The enzyme requires a reduced pyridine nucleotide cofactor (NADPH) and is capable of metabolizing various steroid substrates [54]. For the molecular docking study, the structure of human 5α-reductase 1 was modeled using homology modeling techniques, while for 5α-reductase 2 the crystal structure was available at the protein data bank (PDB ID: 7BW1). The crystal structure of human 5α-reductase 2 was determined in the presence of NADPH and finasteride, revealing a topology of seven transmembrane α-helices (7-TMs, 1–7) connected by six loops (L1–L6). The binding pocket for NADPH is enclosed by cytosolic loops, effectively shielding it from the cytosol. In contrast, the binding site for finasteride is predominantly hydrophobic. The steroid substrates likely enter the ligand-binding pocket of 5α-reductase 2 from the lipid bilayer through the TM1-TM4 opening, while the polar molecules likely enter through the cytosolic side [24].
Besides steroidal 5α-reductase inhibitors, there are numerous non-steroidal inhibitors mentioned in the literature. Among those are butanoic acid derivatives, 7-hydroxycoumarin derivatives, 2,6-disubstituted-4-hydroxy-4-hydroxymethyl biphenyl derivatives, isoflavonoids, 3,3-diphenylpentane derivatives, and epicatechin-3-gallate and epigallocatechin-3-gallate which are major constituents of green tea [55,56,57]. The last two are the most similar in structure to teupolioside, giving the rational for expecting similar effects on the activity of 5α-reductase. Liao and Hiipakka investigated the effect of these gallates and suggested that the gallyl or galloyl groups may interact with a specific site on 5α-reductase [57].
The molecular docking technique utilized in this study simulated the molecular interactions between tested ligands (teupolioside and two steroid ligands—testosterone and finasteride) and the targeted human 5α-reductase 1 and 2 receptors. For 5α-reductase 1, finasteride has been shown to be a less potent substrate than both teupolioside and testosterone. This agrees with the experiments which show finasteride’s weak affinity for this enzyme. Besides numerous interactions seen between teupolioside and the amino acid residues of 5α-reductase 1, the specific H-bond between the teupolioside hydroxy group and NADPH (labeled NDP 260 in Figure 10 and Figure 11) was also observed. Similar interactions are also observed between finasteride and 5α-reductase 2 in the 3D PDB complex 7BW1 [24]. In that complex, the bond between these two molecules explains the hydride transfer and the reduction in the ∆4,5 bond. Compared to the human 5α-reductase 1, all three ligands showed higher affinity toward the human 5α-reductase 2. With the binding energy of -8.66 kcal/mol and the dissociation constant of 0.45 μM, teupolioside appeared as a competitive ligand to testosterone, with slightly better binding/affinity parameter values (Table 4). As for finasteride, it showed the highest affinity for 5α-reductase 2, which was expected since finasteride is a designed 5α-reductase 2 inhibitor. Several amino acid residues play key roles in activity of human 5α-reductase 2. For example, Glu57 and Tyr91 facilitate hydride transfer to the ∆4,5 bond of testosterone, leading to the formation of DHT, and in the crystal complex of 5α-R2 with finasteride the polar groups at either end of finasteride establish additional interactions with Glu57 and Arg114 [24]. As seen from Figure 12 and Figure 13, the complex of teupolioside with 5α-reductase 2 was greatly stabilized by numerous H-bond interactions, including those with Glu57 and Arg114. Given that teupolioside does not have a specific 4,5-double bond that steroid substrates have, we propose a couple of possible explanations for teupolioside’s inhibition mechanism on the 5-alpha reductases. As the binding energies of testosterone and teupolioside were very similar, one possibility is that teupolioside competes competitively for the testosterone’s binding site and that way blocks the reduction of the natural substrate. Another explanation is related to the polar nature of teupolioside. Given the lipid-rich environment of the opening between TM1 and TM4 (where the steroid substrates enter) and the highly polar nature of NADP+/NADPH, it is unlikely that NADP+/NADPH enters or exits through this opening. Instead, conformational changes in the cytosolic loops may occur during the reaction, temporarily exposing the nucleotide-binding pocket to cytosol before and after each catalytic cycle, enabling NADP+/NADPH exchange for efficient reaction turnover [24]. We presume that teupolioside, due to its polarity and hydrophilicity, also uses this way of entering the enzyme and in this way interferes with the uptake of the cofactor NAPDH, which is necessary for the reduction. The formed complex of teupolioside with 5α-reductase 2 did not show the formation of a direct bond with the NADPH molecule compared to the complex with 5α-reductase 1; however, given the similarity of these two enzymes and similar nature of the other observed interactions we presume that forming a direct bond between teupolioside and 5α-reductase 2 is also possible, which adds another possible explanation for inhibiting the enzyme’s activity. These computational predictions, while useful for generating initial hypotheses about ligand–target interactions, underscore the need for future in vitro experimental validation to confirm the accuracy and biological relevance of the proposed interactions.

5. Conclusions

Inflammation, oxidative stress, and androgen activity are significant factors in the development of BPH. The combination of Graminex®G96®, which has anti-inflammatory and antioxidant properties, and Teupol 25P, known for its antiandrogenic activity in vitro and in silico, appears to be synergistic in vitro at discrete combinations, as demonstrated in this work. Specifically, the enhancement of the Nrf2 and HO-1 expression, the increase in catalase activity, and the lessening in pro-inflammatory cytokines secretion match with the reduction in prostate cell proliferation and androgenic testosterone metabolites levels. In silico studies were also performed to corroborate these data and explain the interaction between teupolioside and 5α-reductases.
While co-culture systems or in vivo studies are essential for a comprehensive evaluation of the mechanisms of action and the therapeutic efficacy of such combinations, the primary aim of this study is to preliminarily assess their effects on inflammation and oxidative stress responses in vitro. Notably, the two cell lines selected (macrophages and BPH-1) represent the key cellular components most implicated in the pathology of benign prostatic hyperplasia (BPH), thereby providing a relevant model for initial investigation. Such foundational data provides critical insights that guide and justify subsequent in-depth studies. In conclusion, our data lay the groundwork for the demonstration of the efficacy of a multi-targeted approach which could potentially lead to a more effective management of BPH, adding new weapons in our therapeutic arsenal which not only alleviate lower urinary tract symptoms [58].

Author Contributions

N.M., V.C., M.G. (Marialucia Gallorini), M.G. (Maria Gulisano), A.O. and S.C.: Methodology and Investigation. M.G. (Marialucia Gallorini), A.C., G.D.F., L.V., A.O. and S.C.: Writing—review and editing, Writing—original draft. N.M., V.C., M.G. (Marialucia Gallorini), L.V. and S.C.: Data curation. M.G. (Marialucia Gallorini) and S.C.: Conceptualization and Funding acquisition. All authors have read and agreed to the published version of the manuscript.

Funding

This research was funded by a Ministero Italiano dell’Università e della Ricerca (MUR) FAR2021 grant to S.C. and M.G. (Marialucia Gallorini).

Institutional Review Board Statement

Not applicable.

Informed Consent Statement

Not applicable.

Data Availability Statement

Data will be made available on request.

Acknowledgments

This publication was produced while attending the PhD program in Biomolecular and Pharmaceutical Sciences at the University of Chieti-Pescara, Cycle XXXIX, with the support of a scholarship co-financed by the Ministerial Decree no. 117 of 2 March 2023, based on the NRRP-funded by the European Union-NextGenerationEU-Mission 4 “Education and Research”, Component 2 “From Research to Business”, Investment 3.3, and by the company IDI Integratori Dietetici Italiani S.r.l. (N.M.).

Conflicts of Interest

Author G.D.F. was employed by the company IDI Integratori Dietetici Italiani S.r.l. The remaining authors declare that the research was conducted in the absence of any commercial or financial relationships that could be construed as a potential conflict of interest.

References

  1. Vuichoud, C.; Loughlin, K.R. Benign prostatic hyperplasia: Epidemiology, economics and evaluation. Can. J. Urol. 2015, 22 (Suppl. S1), 1–6. [Google Scholar] [PubMed]
  2. Welén, K.; Damber, J.E. Androgens, aging, and prostate health. Rev. Endocr. Metab. Disord. 2022, 23, 1221–1231. [Google Scholar] [CrossRef]
  3. O’Quin, C.; White, K.L.; Campbell, J.R.; Myers, S.H.; Patil, S.; Chandler, D.; Ahmadzadeh, S.; Varrassi, G.; Shekoohi, S.; Kaye, A.D. Pharmacological Approaches in Managing Symptomatic Relief of Benign Prostatic Hyperplasia: A Comprehensive Review. Cureus 2023, 15, e51314. [Google Scholar] [CrossRef] [PubMed]
  4. Traish, A.M. Health Risks Associated with Long-Term Finasteride and Dutasteride Use: It’s Time to Sound the Alarm. World J. Men’s Health 2020, 38, 323–337. [Google Scholar] [CrossRef] [PubMed]
  5. Jahan, N.; Chowdhury, A.; Li, T.; Xu, K.; Wei, F.; Wang, S. Neferine improves oxidative stress and apoptosis in benign prostate hyperplasia via Nrf2-ARE pathway. Redox Rep. 2021, 26, 1–9. [Google Scholar] [CrossRef] [PubMed]
  6. Song, G.; Tong, J.; Wang, Y.; Li, Y.; Liao, Z.; Fan, D.; Fan, X. Nrf2-mediated macrophage function in benign prostatic hyperplasia: Novel molecular insights and implications. Biomed. Pharmacother. 2023, 167, 115566. [Google Scholar] [CrossRef]
  7. Miernik, A.; Gratzke, C. Current Treatment for Benign Prostatic Hyperplasia. Dtsch. Arztebl. Int. 2020, 117, 843–854. [Google Scholar] [CrossRef]
  8. Cicero, A.F.G.; Allkanjari, O.; Busetto, G.M.; Cai, T.; Larganà, G.; Magri, V.; Perletti, G.; Robustelli Della Cuna, F.S.; Russo, G.I.; Stamatiou, K.; et al. Nutraceutical treatment and prevention of benign prostatic hyperplasia and prostate cancer. Arch. Ital. Urol. Androl. 2019, 91, 139–152. [Google Scholar] [CrossRef]
  9. Chiavaroli, A.; Recinella, L.; Ferrante, C.; Locatelli, M.; Carradori, S.; Macchione, N.; Zengin, G.; Leporini, L.; Leone, S.; Martinotti, S.; et al. Crocus sativus, Serenoa repens and Pinus massoniana extracts modulate inflammatory response in isolated rat prostate challenged with LPS. J. Biol. Regul. Homeost. Agents 2017, 31, 531–541. [Google Scholar]
  10. De Monte, C.; Carradori, S.; Granese, A.; Di Pierro, G.B.; Leonardo, C.; De Nunzio, C. Modern extraction techniques and their impact on the pharmacological profile of Serenoa repens extracts for the treatment of lower urinary tract symptoms. BMC Urol. 2014, 14, 63. [Google Scholar] [CrossRef]
  11. Locatelli, M.; Macchione, N.; Ferrante, C.; Chiavaroli, A.; Recinella, L.; Carradori, S.; Zengin, G.; Cesa, S.; Leporini, L.; Leone, S.; et al. Graminex Pollen: Phenolic Pattern, Colorimetric Analysis and Protective Effects in Immortalized Prostate Cells (PC3) and Rat Prostate Challenged with LPS. Molecules 2018, 23, 1145. [Google Scholar] [CrossRef] [PubMed]
  12. Chiavaroli, A.; Di Simone, S.C.; Acquaviva, A.; Libero, M.L.; Campana, C.; Recinella, L.; Leone, S.; Brunetti, L.; Orlando, G.; Nilofar; et al. Protective Effects of PollenAid Plus Soft Gel Capsules’ Hydroalcoholic Extract in Isolated Prostates and Ovaries Exposed to Lipopolysaccharide. Molecules 2022, 27, 6279. [Google Scholar] [CrossRef] [PubMed]
  13. Di Pasquale, A.B.; Cassani, A.; Masciovecchio, S.; Zasa, G.; Ranieri, G.; Romano, G.; Di Clemente, L. Postoperative treatment with phytotheraphy Graminex G63 (CERNILEN-Flogo®) after greenlight laser XPS (180W) photovaporization of the prostate (PVP), can affect patient’s quality of life? Eur. Rev. Med. Pharmacol. Sci. 2020, 24, 9116–9120. [Google Scholar] [CrossRef]
  14. Cai, T.; Verze, P.; La Rocca, R.; Palmieri, A.; Tiscione, D.; Luciani, L.G.; Mazzoli, S.; Mirone, V.; Malossini, G. The Clinical Efficacy of Pollen Extract and Vitamins on Chronic Prostatitis/Chronic Pelvic Pain Syndrome Is Linked to a Decrease in the Pro-Inflammatory Cytokine Interleukin-8. World J. Men’s Health 2017, 35, 120–128. [Google Scholar] [CrossRef]
  15. Di Paola, R.; Esposito, E.; Mazzon, E.; Riccardi, L.; Caminiti, R.; Dal Toso, R.; Pressi, G.; Cuzzocrea, S. Teupolioside, a phenylpropanoid glycosides of Ajuga reptans, biotechnologically produced by IRBN22 plant cell line, exerts beneficial effects on a rodent model of colitis. Biochem. Pharmacol. 2009, 77, 845–857. [Google Scholar] [CrossRef]
  16. Korkina, L.G.; Mikhal’chik, E.; Suprun, M.V.; Pastore, S.; Dal Toso, R. Molecular mechanisms underlying wound healing and anti-inflammatory properties of naturally occurring biotechnologically produced phenylpropanoid glycosides. Cell. Mol. Biol. 2007, 53, 84–91. [Google Scholar] [PubMed]
  17. Pastore, S.; Potapovich, A.; Kostyuk, V.; Mariani, V.; Lulli, D.; De Luca, C.; Korkina, L. Plant polyphenols effectively protect HaCaT cells from ultraviolet C-triggered necrosis and suppress inflammatory chemokine expression. Ann. N. Y. Acad. Sci. 2009, 1171, 305–313. [Google Scholar] [CrossRef]
  18. Muraca, L.; Scuteri, A.; Burdino, E.; Marcianò, G.; Rania, V.; Catarisano, L.; Casarella, A.; Cione, E.; Palleria, C.; Colosimo, M.; et al. Effectiveness and Safety of a New Nutrient Fixed Combination Containing Pollen Extract Plus Teupolioside, in the Management of LUTS in Patients with Benign Prostatic Hypertrophy: A Pilot Study. Life 2022, 12, 965. [Google Scholar] [CrossRef]
  19. Gallorini, M.; Carradori, S.; Resende, D.I.S.P.; Saso, L.; Ricci, A.; Palmeira, A.; Cataldi, A.; Pinto, M.; Sousa, E. Natural and Synthetic Xanthone Derivatives Counteract Oxidative Stress via Nrf2 Modulation in Inflamed Human Macrophages. Int. J. Mol. Sci. 2022, 23, 13319. [Google Scholar] [CrossRef]
  20. Sorrenti, V.; D’Amico, A.G.; Barbagallo, I.; Consoli, V.; Grosso, S.; Vanella, L. Tin Mesoporphyrin Selectively Reduces Non-Small-Cell Lung Cancer Cell Line A549 Proliferation by Interfering with Heme Oxygenase and Glutathione Systems. Biomolecules 2021, 11, 917. [Google Scholar] [CrossRef]
  21. Krieger, E.; Vriend, G. YASARA view-molecular graphics for all devices-from smartphones to workstations. Bioinformatics 2014, 30, 2981–2982. [Google Scholar] [CrossRef] [PubMed]
  22. Krieger, E.; Vriend, G. New ways to boost molecular dynamics simulations. J. Comput. Chem. 2015, 36, 996–1007. [Google Scholar] [CrossRef] [PubMed]
  23. Morris, G.M.; Huey, R.; Lindstrom, W.; Sanner, M.F.; Belew, R.K.; Goodsell, D.S.; Olson, A.J. AutoDock4 and AutoDockTools4: Automated docking with selective receptor flexibility. J. Comput. Chem. 2009, 30, 2785–2791. [Google Scholar] [CrossRef]
  24. Xiao, Q.; Wang, L.; Supekar, S.; Shen, T.; Liu, H.; Ye, F.; Huang, J.; Fan, H.; Wei, Z.; Zhang, C. Structure of human steroid 5α-reductase 2 with the anti-androgen drug finasteride. Nat. Commun. 2020, 11, 5430. [Google Scholar] [CrossRef]
  25. Maier, J.A.; Martinez, C.; Kasavajhala, K.; Wickstrom, L.; Hauser, K.E.; Simmerling, C. ff14SB: Improving the accuracy of protein side chain and backbone parameters from ff99SB. J. Chem. Theory Comput. 2015, 11, 3696–3713. [Google Scholar] [CrossRef]
  26. Dassault Systèmes BIOVIA. Discovery Studio Modeling Environment; Release 24.1.0.23298; Dassault Systèmes: San Diego, CA, USA, 2024. [Google Scholar]
  27. Mencarelli, N.; Arena, D.; Salamone, M.; Pietrangelo, L.; Berardi, A.C.; Cataldi, A.; Carradori, S.; Gallorini, M. The combination of hyaluronic acids and collagen boosts human Achilles tendon-derived cell escape from inflammation and matrix remodeling in vitro. Inflamm. Res. 2025, 74, 4. [Google Scholar] [CrossRef]
  28. Ricci, A.; Zara, S.; Carta, F.; Di Valerio, V.; Sancilio, S.; Cataldi, A.; Selleri, S.; Supuran, C.T.; Carradori, S.; Gallorini, M. 2-Substituted-4,7-dihydro-4-ethylpyrazolo [1,5-a]pyrimidin-7-ones alleviate LPS-induced inflammation by modulating cell metabolism via CD73 upon macrophage polarization. Mol. Immunol. 2024, 170, 99–109. [Google Scholar] [CrossRef] [PubMed]
  29. Jones, D.T. Protein secondary structure prediction based on position-specific scoring matrices. J. Mol. Biol. 1999, 292, 195–202. [Google Scholar] [CrossRef]
  30. Mondaini, N.; Gontero, P.; Giubilei, G.; Lombardi, G.; Cai, T.; Gavazzi, A.; Bartoletti, R. Finasteride 5 mg and sexual side effects: How many of these are related to a nocebo phenomenon? J. Sex. Med. 2007, 4, 1708–1712. [Google Scholar] [CrossRef]
  31. Edwards, J.E.; Moore, R.A. Finasteride in the treatment of clinical benign prostatic hyperplasia: A systematic review of randomised trials. BMC Urol. 2002, 2, 14. [Google Scholar] [CrossRef]
  32. Lowe, F.C.; McConnell, J.D.; Hudson, P.B.; Romas, N.A.; Boake, R.; Lieber, M.; Elhilali, M.; Geller, J.; Imperto-McGinely, J.; Andriole, G.L.; et al. Long-term 6-year experience with finasteride in patients with benign prostatic hyperplasia. Urology 2003, 61, 791–796. [Google Scholar] [CrossRef] [PubMed]
  33. Sens-Albert, C.; Weisenburger, S.; König, B.C.; Melcher, S.F.; Scheyhing, U.A.M.; Rollet, K.; Lluel, P.; Koch, E.; Lehner, M.D.; Michel, M.C. Effects of a proprietary mixture of extracts from. Front. Pharmacol. 2024, 15, 1379456. [Google Scholar] [CrossRef]
  34. Murtola, T.J.; Gurel, B.; Umbehr, M.; Lucia, M.S.; Thompson, I.M.; Goodman, P.J.; Kristal, A.R.; Parnes, H.L.; Lippman, S.M.; Sutcliffe, S.; et al. Inflammation in Benign Prostate Tissue and Prostate Cancer in the Finasteride Arm of the Prostate Cancer Prevention Trial. Cancer Epidemiol. Biomark. Prev. 2016, 25, 463–469. [Google Scholar] [CrossRef] [PubMed]
  35. Stewart, K.L.; Lephart, E.D. Overview of BPH: Symptom Relief with Dietary Polyphenols, Vitamins and Phytochemicals by Nutraceutical Supplements with Implications to the Prostate Microbiome. Int. J. Mol. Sci. 2023, 24, 5486. [Google Scholar] [CrossRef]
  36. Tusubira, D.; Aja, P.M.; Munezero, J.; Ssedyabane, F.; Namale, N.; Ifie, J.E.; Agu, P.C.; Ajayi, C.O.; Okoboi, J. Safety profile of colocasia esculenta tuber extracts in benign prostate hyperplasia. BMC Complement. Med. Ther. 2023, 23, 187. [Google Scholar] [CrossRef] [PubMed]
  37. Crocerossa, F.; Cantiello, F.; Bagalá, L.; Sicoli, F.; Carbonara, U.; Manfredi, C.; Falagario, U.; Veccia, A.; Pandolfo, S.D.; Napolitano, L.; et al. Clinical Effects of Oral Supplementation of Gamma-Cyclodextrin Curcumin Complex in Male Patients with Moderate-To-Severe Benign Prostatic Hyperplasia-Related Lower Urinary Tract Symptoms. Urol. Int. 2023, 107, 924–934. [Google Scholar] [CrossRef]
  38. Norouzi, M.; Mahboobi, S.; Eftekhari, M.H.; Salehipour, M.; Ghaem, H.; Mirzakhanlouei, A.; Mohsenpour, M.A. Effects of L-Carnitine and Coenzyme Q10 Supplementation on Lower Urinary Tract Symptoms in Men with Benign Prostatic Hyperplasia: A Randomized, Controlled, Clinical Trial. Nutr. Cancer 2024, 76, 207–214. [Google Scholar] [CrossRef]
  39. Consoli, V.; Burò, I.; Gulisano, M.; Castellano, A.; D’Amico, A.G.; D’Agata, V.; Vanella, L.; Sorrenti, V. Evaluation of the Antioxidant and Antiangiogenic Activity of a Pomegranate Extract in BPH-1 Prostate Epithelial Cells. Int. J. Mol. Sci. 2023, 24, 10719. [Google Scholar] [CrossRef]
  40. Huynh, H.; Seyam, R.M.; Brock, G.B. Reduction of ventral prostate weight by finasteride is associated with suppression of insulin-like growth factor I (IGF-I) and IGF-I receptor genes and with an increase in IGF binding protein 3. Cancer Res. 1998, 58, 215–218. [Google Scholar]
  41. Wang, K.; Jin, S.; Fan, D.; Wang, M.; Xing, N.; Niu, Y. Anti-proliferative activities of finasteride in benign prostate epithelial cells require stromal fibroblasts and c-Jun gene. PLoS ONE 2017, 12, e0172233. [Google Scholar] [CrossRef]
  42. Nair, V.S.; Doman, C.E.; Morrison, M.S.; Miller, G.D.; Husk, J.; van Eenoo, P.; Crouch, A.K.; Eichner, D. Evaluation of epiandrosterone as a long-term marker of testosterone use. Drug Test. Anal. 2020, 12, 1554–1560. [Google Scholar] [CrossRef] [PubMed]
  43. Dušková, M.; Hill, M.; Stárka, L. The influence of low dose finasteride, a type II 5α-reductase inhibitor, on circulating neuroactive steroids. Horm. Mol. Biol. Clin. Investig. 2010, 1, 95–102. [Google Scholar] [CrossRef] [PubMed]
  44. Fibbi, B.; Penna, G.; Morelli, A.; Adorini, L.; Maggi, M. Chronic inflammation in the pathogenesis of benign prostatic hyperplasia. Int. J. Androl. 2010, 33, 475–488. [Google Scholar] [CrossRef]
  45. Jin, R.; Forbes, C.M.; Miller, N.L.; Lafin, J.; Strand, D.W.; Case, T.; Cates, J.M.; Liu, Q.; Ramirez-Solano, M.; Mohler, J.L.; et al. Transcriptomic analysis of benign prostatic hyperplasia identifies critical pathways in prostatic overgrowth and 5-alpha reductase inhibitor resistance. Prostate 2024, 84, 441–459. [Google Scholar] [CrossRef]
  46. Ene, C.V.; Nicolae, I.; Geavlete, B.; Geavlete, P.; Ene, C.D. IL-6 Signaling Link between Inflammatory Tumor Microenvironment and Prostatic Tumorigenesis. Anal. Cell. Pathol. 2022, 2022, 5980387. [Google Scholar] [CrossRef]
  47. Russo, G.I.; Vanella, L.; Castelli, T.; Cimino, S.; Reale, G.; Urzì, D.; Li Volti, G.; Gacci, M.; Carini, M.; Motta, F.; et al. Heme oxygenase levels and metaflammation in benign prostatic hyperplasia patients. World J. Urol. 2016, 34, 1183–1192. [Google Scholar] [CrossRef]
  48. Vanella, L.; Russo, G.I.; Cimino, S.; Fragalà, E.; Favilla, V.; Li Volti, G.; Barbagallo, I.; Sorrenti, V.; Morgia, G. Correlation between lipid profile and heme oxygenase system in patients with benign prostatic hyperplasia. Urology 2014, 83, 1444.e7–1444.e13. [Google Scholar] [CrossRef] [PubMed]
  49. Schweikl, H.; Gallorini, M.; Pöschl, G.; Urmann, V.; Petzel, C.; Bolay, C.; Hiller, K.A.; Cataldi, A.; Buchalla, W. Functions of transcription factors NF-κB and Nrf2 in the inhibition of LPS-stimulated cytokine release by the resin monomer HEMA. Dent. Mater. 2018, 34, 1661–1678. [Google Scholar] [CrossRef]
  50. Gallorini, M.; Carradori, S.; Panieri, E.; Sova, M.; Saso, L. Modulation of NRF2: Biological Dualism in Cancer, Targets and Possible Therapeutic Applications. Antioxid. Redox Signal. 2024, 40, 636–662. [Google Scholar] [CrossRef]
  51. Langlois, V.S.; Zhang, D.; Cooke, G.M.; Trudeau, V.L. Evolution of steroid-5α-reductases and comparison of their function with 5β-reductase. Gen. Comp. Endocrinol. 2010, 166, 489–497. [Google Scholar] [CrossRef]
  52. Russell, D.W.; Wilson, J.D. Steroid 5α-reductase: Two genes/two enzymes. Annu. Rev. Biochem. 1994, 63, 25–61. [Google Scholar] [CrossRef] [PubMed]
  53. Azzouni, F.; Godoy, A.; Li, Y.; Mohler, J. The 5 alpha-reductase isozyme family: A review of basic biology and their role in human diseases. Adv. Urol. 2012, 2012, 530121. [Google Scholar] [CrossRef] [PubMed]
  54. Tomkins, G.M. The enzymatic reduction of Δ4-3-ketosteroids. J. Biol. Chem. 1957, 225, 13–24. [Google Scholar] [CrossRef]
  55. Aggarwal, S.; Thareja, S.; Verma, A.; Bhardwaj, T.R.; Kumar, M. An overview on 5α-reductase inhibitors. Steroids 2010, 75, 109–153. [Google Scholar] [CrossRef]
  56. Occhiato, E.G.; Guarna, A.; Danza, G.; Serio, M. Selective non-steroidal inhibitors of 5α-reductase type 1. J. Steroid Biochem. Mol. Biol. 2004, 88, 1–16. [Google Scholar] [CrossRef] [PubMed]
  57. Liao, S.S.; Hiipakka, R.A. Selective-Inhibition of steroid 5 α-reductase isozymes by tea epicatechin-3-gallate and epigallocatechin-3-gallate. Biochem. Biophys. Res. Commun. 1995, 214, 833–838. [Google Scholar] [CrossRef]
  58. Lo Re, M.; Pezzoli, M.; Cadenar, A.; Fuligni, E.; Gajo, L.; Minervini, A.; Cocci, A. Discovering a new nutraceutical based on pollen extract and teupolioside: A prospective monocentric study evaluating its role in alleviating lower urinary tract symptoms in benign prostatic hyperplasia patients. Arch. Ital. Urol. Androl. 2025, 97, 13412. [Google Scholar] [CrossRef]
Figure 1. (a) The cell metabolic activity of unstimulated and LPS-stimulated macrophages in the presence of loading concentrations of Graminex®G96® (G), Teupol 25P (T), and their combination (GT) after 24 h of exposure. A total of 500 µg/mL and 60.2 µg/mL (GT1), 250 µg/mL and 30.1 µg/mL (GT2), 125 µg/mL and 15 µg/mL (GT3), 62.5 µg/mL and 7.5 µg/mL (GT4), 31.25 µg/mL and 3.75 µg/mL (GT5), and 15.6 µg/mL and 1.87 µg/mL (GT6). Untreated cells (CTRL) are set as the 100% (n = 6). *** p < 0.0001 between treated samples and CTRL; § p < 0.05, §§ p < 0.001, and §§§ p < 0.0001 between treated samples and LPS. (b) Cell metabolic activity of LPS-stimulated macrophages in the presence of selected concentrations of G, T, and GT. LPS alone is set as the 100% (n = 6). ** p < 0.001, and *** p < 0.0001 between treated samples and CTRL; §§§ p < 0.0001 between treated samples and LPS alone; ## p < 0.001 and ### p < 0.0001 between GT and T at the same concentration. (c) LDH released from macrophages in the same experimental conditions of data shown in panel (b) (n = 6). * p < 0.05, and *** p < 0.0001 between treated samples and CTRL; § p < 0.05, §§ p < 0.001 and §§§ p < 0.0001 between treated samples and the LPS; °° p < 0.001 between GT and G at the same concentration.
Nutraceuticals 05 00017 g001
Figure 2. (a) Catalase activity (mU/mL) in the presence of increasing concentrations of Graminex®G96® (G), Teupol 25P (T), and their combination (GT) measured after 24 h of exposure in LPS-stimulated macrophages. The enzymatic activity was normalized to optical densities obtained from the cell metabolic activity assay (MTT). A total of 250 µg/mL and 30.1 µg/mL (GT2), 125 µg/mL and 15 µg/mL (GT3), and 62.5 µg/mL and 7.5 µg/mL (GT4). CTRL = unstimulated cells (untreated control). ** p < 0.001 and *** p < 0.0001 between treated samples and CTRL; § p < 0.05, §§ p < 0.001, and §§§ p < 0.0001 between treated samples and LPS; ° p < 0.05 and °° p < 0.001 between GT and G at the same concentration; ## p < 0.001 between GT and T at the same concentration. (b) The table highlights the increase in the catalase activity rate in the presence of GT compared to G and T alone.
Nutraceuticals 05 00017 g002
Figure 3. Expression-levels of NF-ĸB and Nrf2 in cytosolic and nuclear fractions of LPS-stimulated macrophages after 24 h. A total of 250 µg/mL and 30.1 µg/mL (GT2), 125 µg/mL and 15 µg/mL (GT3), and 62.5 µg/mL and 7.5 µg/mL (GT4). CTRL = unstimulated cells (untreated control). (a) Representative bands from three independent experiments. (b) Bar graphs represent percentages of translocation obtained by ratios of densitometries related to cytosols and nuclei on the total amount of protein. *** p < 0.0001 between treated samples and CTRL; § p < 0.05, §§ p < 0.001, and §§§ p < 0.0001 between treated samples and LPS.
Nutraceuticals 05 00017 g003
Figure 4. (a) Cell metabolic activity of PC-3 cells in the presence of increasing concentrations of finasteride (F) or increasing concentrations of Graminex®G96® (G), Teupol 25P (T), and their combination (GT) after 24 and 48 h of exposure. A total of 250 µg/mL and 30.1 µg/mL (GT2), 125 µg/mL and 15 µg/mL (GT3), and 62.5 µg/mL and 7.5 µg/mL (GT4). Untreated cells (CTRL) are set as the 100% (n = 6). ** p < 0.001 and *** p < 0.0001 between treated samples and CTRL. (b) The cell metabolic activity of PC-3 cells in the presence of GT2, GT3, GT4, and F at increasing concentrations. Untreated cells (CTRL) are set as the 100% (n = 6). *** p < 0.0001 between treated samples and CTRL. (c) PC-3 cells in the presence of GT2 and increasing concentrations of F after 24 h stained by Crystal Violet. Red arrows indicate round-shaped cells and changes in morphology. Magnification 10× (1 cm = 100 µm).
Nutraceuticals 05 00017 g004
Figure 5. Amounts of epiandrosterone (ng/mL) detected in the cell supernatants of PC-3 cells in the presence of increasing concentrations of finasteride (F) or increasing concentrations of Graminex®G96® (G), Teupol 25P (T), and their combinations (GT) after 24 h of exposure. The assay was normalized on optical densities obtained from the cell metabolic activity assay (MTT). CTRL = untreated cells. A total of 250 µg/mL and 30.1 µg/mL (GT2), 125 µg/mL and 15 µg/mL (GT3), and 62.5 µg/mL and 7.5 µg/mL (GT4). * p < 0.01, ** p < 0.001, and *** p < 0.0001 between treated samples and CTRL. •• p < 0.001 between GT and G at the same concentration. °°° p < 0.0001 between F 1 µM + GT2 and F 0.1 µM + GT2. ### p < 0.0001 between F 1 µM + GT3 and F 0.1 µM + GT3. §§§ p < 0.0001 between F 1 µM + GT4 and F 0.1 µM + GT4.
Nutraceuticals 05 00017 g005
Figure 6. Evaluation of BPH-1 cell viability following treatment with Graminex®G96® (a), Teupol 25P, (b) finasteride (c), and GT combination (d). Untreated cells (CTRL) are set as the 100%. Statistical significance: *** p < 0.0005; ** p < 0.005 vs. CTRL.
Nutraceuticals 05 00017 g006
Figure 7. Gene expression of pro-inflammatory markers measured by qRT-PCR following inflammation model establishment with LPS and co-administration with selected GT2 (ad). Quantification of IL-6 levels released in conditioned media of BPH-1 cells exposed to LPS and a combination of LPS + GT2 (e). Statistical significance: *** p < 0.0005; ** p < 0.005; * p < 0.05 vs. CTRL; ### p < 0.0005; ## p < 0.005; # p < 0.05 vs. LPS.
Nutraceuticals 05 00017 g007
Figure 8. Cell-free measurement of T antioxidant activity expressed as % of scavenger activity (a) and µM ferrous equivalents (b). Quantification of HO-1 levels following BPH-1 cell exposure to LPS and combination treatment with GT2 (c). Fluorometric measurement of reactive oxygen species (ROS) after 6 h treatment (d). ** p < 0.005 vs. CTRL; ### p < 0.0005 vs. LPS treated cells.
Nutraceuticals 05 00017 g008
Figure 9. Constructed 3D structure of 5α-reductase 1 obtained by homology modeling.
Nutraceuticals 05 00017 g009
Figure 10. Binding mode of teupolioside within active site of human 5α-reductase 1 receptor.
Nutraceuticals 05 00017 g010
Figure 11. A 2D diagram of the molecular interactions between teupolioside and human 5α-reductase 1 receptor amino acid residues.
Nutraceuticals 05 00017 g011
Figure 12. Binding mode of teupolioside within active site of human 5α-reductase 2 receptor (PDB: 7BW1).
Nutraceuticals 05 00017 g012
Figure 13. A 2D diagram of molecular interactions between teupolioside and human 5α-reductase 2 receptor amino acid residues.
Nutraceuticals 05 00017 g013
Table 1. Template hits found and used for the homology modeling of human 5α-reductase 1.
TemplateTotal ScoreBLAST
E-Value
Align ScoreCoverIDResolutionHeader
1450.333 × 10−55608.095%7BW1 (chain-A)2.80 Å3-oxo-5-alpha-steroid 4-dehydrogenase 2 [Homo sapiens] (245 residues with quality score 0.783)
2401.824 × 10−58498.094%7C83 (chain-A)2.00 Å3-oxo-5-alpha-steroid 4-dehydrogenase [Proteobacteria bacterium] (251 residues with quality score 0.860)
Table 2. The resulting hybrid model parameters.
Check TypeQuality Z-ScoreComment
Dihedrals0.515Optimal
Packing 1D0.674Optimal
Packing 3D−1.304Satisfactory
Overall−0.269Good
Table 3. Docking results of tested ligands with human 5α-reductase 1 receptor.
LigandBinding Energy [kcal/mol]Dissociation Constant [μM]
Teupolioside−8.181.01
Testosterone−8.171.03
Finasteride−7.662.43
Table 4. Docking results of tested ligands with human 5α-reductase 2 receptor.
LigandBinding Energy [kcal/mol]Dissociation Constant [μM]
Teupolioside−8.660.45
Testosterone−8.640.46
Finasteride−8.710.41
Disclaimer/Publisher’s Note: The statements, opinions and data contained in all publications are solely those of the individual author(s) and contributor(s) and not of MDPI and/or the editor(s). MDPI and/or the editor(s) disclaim responsibility for any injury to people or property resulting from any ideas, methods, instructions or products referred to in the content.

