Article

Inequalities in Enrollment in Nepal’s National Health Insurance Program: An Intersectional Analysis of Nepal Demographic and Health Survey 2022


1
School of Nursing, Midwifery, Allied and Public Health, Canterbury Christ Church University, Canterbury CT1 1QU, UK
2
New ERA, Rudramati Marga, Kalopul, Kathmandu 44600, Nepal
*
Author to whom correspondence should be addressed.
Int. J. Environ. Res. Public Health 2026, 23(4), 521; https://doi.org/10.3390/ijerph23040521
Submission received: 18 January 2026 / Revised: 12 April 2026 / Accepted: 14 April 2026 / Published: 17 April 2026
(This article belongs to the Special Issue Addressing Disparities in Health and Healthcare Globally)

Highlights

Public health relevance—How does this work relate to a public health issue?
  • National health insurance program (NHIP) of Nepal experiences several dimensions of inequality.
  • It provides evidence for targeted policy interventions to increase enrollment in NHIP.
Public health significance—Why is this work of significance to public health?
  • This study constructs a composite measure of intersectional disadvantage in NHIP enrollment.
  • The use of composite indicators of intersectional disadvantages (wealth, education, gender and ethnicity) shows how multiple markers interact to create deeper inequality.
Public health implications—What are the key implications or messages for practitioners, policy makers and/or researchers in public health?
  • Intersectional disadvantages create compounded barriers to NHIP enrollment.
  • Targeted interventions addressing intersection of wealth, ethnicity, gender, and education are necessary to reduce inequality.

Abstract

Nepal’s National Health Insurance Program (NHIP), launched in 2016, continues to show low enrollment rates and substantial socio-economic and geographical inequalities hinder the progress towards universal health coverage (UHC). This study uses a composite indicator of intersectional disadvantages to examine how multiple equity markers (wealth quintile, education status and ethnicity) interact to shape inequalities in NHIP coverage. Data were drawn from the nationally representative 2022 Nepal Demographic and Health Survey. Key predictors are wealth status, education, ethnicity, residence, province, ecological zone and marginalization status. A composite measure of intersectional disadvantage was constructed using three socioeconomic dimensions: wealth, education, and ethnicity. Binary logistic regression, concentration indices, and concentration curves were used to assess the patterns of inequality in NHIP coverage. Results show that only 10.2% of men and 10.8% of women were enrolled in the NHIP. Enrollment varied markedly by province, with highest in Koshi (21.8% for men and 22.9% for women) and lowest in Madhesh (3.1% for men and 2.7% for women). Enrollment was disproportionately higher among wealthier, more educated, and ethnically advantaged groups. This disparity is starkest for those with an intersection of triple disadvantage (poor, illiterate, and disadvantaged ethnicity) and had substantially lower coverage (3.0% for men and 3.4% for women) compared to those facing no disadvantage (18.4% for men and 22.9% women). The concentration curve analysis confirmed that wealthier women and men had greater access to NHIP. Multivariable analysis showed that women and men with no disadvantages were more likely to be enrolled in NHIP than individuals in triple-disadvantage groups. These findings highlight persistent inequities in NHIP, which undermine its contribution to financial risk protection. Targeted interventions are urgently required, including effective implementation of existing subsidies for poor households, expansion of health facility networks in underserved provinces like Madhesh, and tailored outreach programs that address the intersection of ethnicity, wealth, and education in both genders to accelerate equitable progress towards UHC.

1. Introduction

Universal Health Coverage (UHC) has become a central driver of the global health agenda, representing an important long-term global healthcare priority. As a key mechanism for advancing equity, health outcomes, financial protection, and economic development, UHC ensures all people can access quality, affordable healthcare services when needed [1,2]. Social health protection programs have become a prominent strategy for achieving UHC in low- and middle-income countries (LMICs) to reduce catastrophic out-of-pocket expenditures (OOPE) and improve healthcare access [3].
Nepal implemented the National Health Insurance Program (NHIP) in 2016 as a pilot in three districts: Kailali, Baglung and Ilam [4,5]. The program was gradually expanded in a phased manner and had reached all the 77 districts and 750 of the 753 local governments by March 2026 [6]. The program considers families (up to five members) as a unit for enrollment. The base insurance premium for a family is set at NPR 3500 per year (1 USD = NPR 149), with an additional charge of NPR 700 for each additional member. The benefit package provides coverage up to NPR 100,000 for the family and NPR 20,000 for each additional member with the maximum ceiling of up to NPR 200,000 per family [7]. The benefit package includes 1289 types of medicines [8]. As of March 2026, Health Insurance Board (HIB), the public institution responsible for operating and managing the NHIP has empaneled 425 health facilities as first service points (FSPs) and 85 referral hospitals [6,9]. The FSPs are designated health facilities like hospitals or primary healthcare centers (PHCs) that individuals must select during their enrollment. They can select only the public health facilities as FSPs during enrollment. Insured individuals need to visit the FSP that they had chosen during enrollment for routine check-ups, while they may visit the referral hospitals upon referral from FSPs or in the case of an emergency [5]. Out of 29.1 million population, 98.7 million population have been enrolled in the scheme. The active enrolled population is about 60% only (5.97 million) [6].
Some studies from Nepal using Demographic and Health Surveys (DHS) have examined how multiple forms of disadvantages (or advantage) interact to influence access to healthcare [10]. Although national representative studies on health insurance have explored individual dimension of disadvantage such as wealth, ethnicity, or educational attainment in relation to health insurance enrollment [11,12,13,14,15], they have not applied the intersectionality lens in assessing the disparity in health insurance enrollment. Intersectionality provides a valuable framework. It helps to examine how overlapping social identities intersect and create unique experiences of advantages and disadvantages [16,17,18]. For example, the barrier to health insurance faced by poor women differs from those faced by women who are poor, illiterate and from a disadvantaged ethnic group. Understanding this compounded barrier is essential for effective implementation of health insurance policy in Nepal.
Nepal’s health insurance policy seeks to achieve UHC and improve access to healthcare to general public [19]. It also aims to provide subsidies for targeted population including the poor households [20]. However, such blanket policy approach may fail to reach the most marginalized populations. Other social factors like ethnicity and education often create extra layer of disadvantage. Current policies have yet used intersectionality to identify and support the most vulnerable segments of population within the poor households. In contrast to previous studies, which examined socio-economic inequality of health insurance in isolation, this study provides novelty in literature. It applies intersectionality framework to quantify how multiple disadvantages (being poor, illiterate and in a disadvantaged ethnic group) affects NHIP enrollment in Nepal. This approach provides clear empirical evidence. It shows the need for targeted strategies to reach people facing multiple overlapping disadvantages in society. Furthermore, this research directly supports the “leave no one behind” principle. This is a core commitment of the Sustainable Development Goals (SDGs) by identifying the most marginalized groups in access to health insurance coverage [21]. It also aligns SDG goals 10, which aim to reduce inequalities. The findings offer important insights for assessing and addressing persistent disparities in health equity [22].

2. Materials and Methods

2.1. Sampling Design and Data Source

We used secondary data from Nepal Demographic and Health Survey (NDHS) 2022 which is a nationally representative cross-sectional survey. NDHS 2022 is the sixth round periodic nationally representative survey conducted every five years. It is also the first survey conducted after the NHIP was implemented across Nepal [23]. The survey used a two-stage stratified sampling method. Each province was stratified into urban and rural areas. Detailed information on the sampling design and survey methodology appears in the final report [23].
A total of 4913 men and 14,845 women aged 15–49 were interviewed face-to-face by trained interviewers using structured questionnaires. All eligible women aged 15–49 in selected households were interviewed. Men aged 15–49 were interviewed only in half of the selected households. This approach, interviewing all women and half men is a standard practice in DHS conducted in over 90 countries [24]. Previous studies have also analyzed women and men separately [12,13,14,15,25]. The flowchart showing women and men distribution for this study is shown in File S1 (Figure S1).

2.2. Outcome Measures

The primary outcome of this study was enrollment in NHIP. We assessed this separately for women and men aged 15–49 years. Both women and men were asked: ‘Are you covered by any health insurance? If yes, what type of health insurance are you covered by?’ We classified responses that mentioned government health insurance as NHIP enrollment.
Independent variables included socioeconomic and geographic characteristics such as ethnicity, wealth quintile, education status, place of residence, province, ecological region and marginalization status. For this study, we merged six categories of ethnic groups into two groups: disadvantaged ethnicities (Dalits, Muslims, Terai ethnic groups, and disadvantaged Janajatis) and advantaged ethnicities (Brahmins/Chhetris and relatively advantaged Janajatis). We dichotomized education into illiterate (unable to read and write) and literate (able to read and write and having completed at least primary education).
We also dichotomized wealth quintiles into two groups: poor (lower 40% or lowest two quintiles) rich (upper 60% or higher three quintiles). This binary classification aligns with established literature documenting historical and structural patterns of privilege and exclusion in Nepal by ethnicity, wealth and education [10]. We constructed a composite disadvantage measure using education status, wealth quintile, and ethnicity to examine intersectional inequalities. This dichotomization was done primarily to address small sample sizes when combining multiple dimensions of disadvantage. We then combined these dichotomous variables to form a composite marginalization status variable. The eight original categories of marginalization status were collapsed into four categories, based on the number of concurrent disadvantages a woman experienced: triple, double, single, or no disadvantages [10]. This approach operates intersectionality. It captures the cumulative burden of multiple marginalized identities. It also allows testing whether health insurance coverage decreased significantly as the number of disadvantages increased.
We used an additive approach (single, double, and triple disadvantage) to apply intersectionality in a quantitative framework. This method helps us examine how overlapping social disadvantages compound inequalities in health outcomes. It is widely used in public health research with survey data. The detailed definition of all the variables is explained in File S1 (Table S1).

2.3. Statistical Analysis

Results were disaggregated by sex, and an intersectional analysis was performed to examine inequalities across wealth quintiles, education status, and ethnicity. Categorical variables were summarized as frequencies, percentages (%), and 95% confidence intervals (CIs) across the relevant associated variables which are presented in File S1 (Table S2).
We used bivariate and multivariable binary logistic regression analyses to estimate the adjusted effects of NHIP enrollment separately for women and men. We reported both unadjusted odds ratio (uOR) and adjusted odds ratios (aOR) to show the magnitude of association relative to the reference category.
Statistical significance was determined at a p-value < 0.05, with 95% confidence intervals used to assess precision. We checked the multicollinearity among covariates using the Variance Inflation Factor (VIF). A cutoff value of 10 was applied before running the multivariable models.
Further, we also assessed model fit using Stata’s postestimation goodness-of-fit test, which indicated that the model adequately fitted the data. The level of statistical significance was set to 0.05. Our main objective was to examine inequalities using wealth quintile, education status, and ethnicity as intersectional dimensions of marginalization. Therefore, these were the primary predictors in the models. Other important variables, such as health status, prior service utilization, and disability, are reported in File S1 (Table S3).
The Erreygers normalized concentration index (ENCI) was used to quantify socio-economic inequalities in NHIP enrollment [26]. The ENCI is suitable for bounded variables, such as dichotomous measure of enrollment in NHIP (Yes = 1 and No = 0) [26,27,28]. The ENCI is computed using the following equation:
E ( C ) = 4 μ b a × C
where
  • μ is the mean of the health variable (NHIP enrollment);
  • a and b are lower and upper bounds of the variable;
  • C is the traditional concentration index.
C = 2 μ C o v ( y , R )
where
  • y is the health variable.
  • μ is the mean of the health variable (NHIP enrollment).
  • R is the fractional rank of individuals in the distribution of SES.
  • Cov denotes the covariance between y and R.
The ENCI ranges between −1 and +1. A value of zero indicates no socioeconomic-related inequality in the health outcome, a positive value indicates that the outcome is more concentrated among individuals with higher socioeconomic status (pro-rich inequality), and a negative value indicates that the outcome is more concentrated among individuals with lower socioeconomic status (pro-poor inequality). This normalization is widely used in studies examining socioeconomic inequalities in health outcomes. The ENCI and standard error (SE) is presented in the result section.
The ‘svyset’ command in Stata (MP version 17.0) was used to apply sampling weights and account for the complex survey design (separately women and men), ensuring unbiased estimates for data management and statistical analysis [29], and figures were prepared using both Stata and R (version 4.4.3) [30]. The gender imbalance in sample sizes is by design in DHS surveys and does not compromise the validity of our gender-specific analyses—particularly since we applied complex survey analysis and gender-specific weights.

3. Results

3.1. Descriptive Summary

The descriptive analysis included 4913 men and 14,845 women. The enrollment for men was 10.2% [95% CI: 8.8–11.8] and that of females was 10.8% [95% CI: 9.6–12.2] respectively (Table 1). The enrollment was consistently higher among older, more educated, and wealthier individuals in both genders. Clear disparities were observed across ethnicities and provinces. Enrollment was also higher among internet users and those with media exposure (radio, television or newspapers). Tobacco use was linked to lower enrollment. Several other variables showed no clear association. Details of descriptive analysis are in File S1 (Table S2).

3.2. Measurement of Socio-Economic Inequality

Structural factors showed significant association with coverage. Ethnic disparities were clear: advantaged ethnic men had 15.8% coverage compared to 7.5% among disadvantaged ethnic men. This pattern was similar for women (advantaged: 17.8% vs. disadvantaged: 7.3%).
Education also revealed large inequalities. Literate men had 10.9% enrollment versus 2.5% enrollment for illiterate men. Among women, the figures were 13.0% versus 4.5%. Wealth also showed strong gradient with enrollment. The wealthiest men (top 60%) had 12.0% coverage compared to 6.8% among poor men (bottom 40%). A similar trend appeared among women (rich:13.7% versus poor: 5.8%).
At the intermediatory level, provincial inequalities were observed. Koshi province had highest enrollment (men: 21.8% and women: 20.4%) while Madhesh Province recorded the lowest (men: 3.1% and women: 2.7%). Urban residence was linked to higher coverage only among women (urban: 12.2% versus rural: 7.8%), while the difference was not significant for men (urban: 11.0% versus rural: 8.4%). Ecological zone (Mountain, Hill, Terai) showed no significant association with NHIP coverage for either gender.
Intersectional analysis revealed compounded disadvantages. Individuals with triple disadvantage (poor, illiterate, and disadvantaged ethnicity) had the lowest coverage (men: 3.0%; women: 3.4%), while those with no disadvantage (rich, literate, and advantaged ethnicity groups) had the highest rate (men: 18.4%; women: 22.9%).
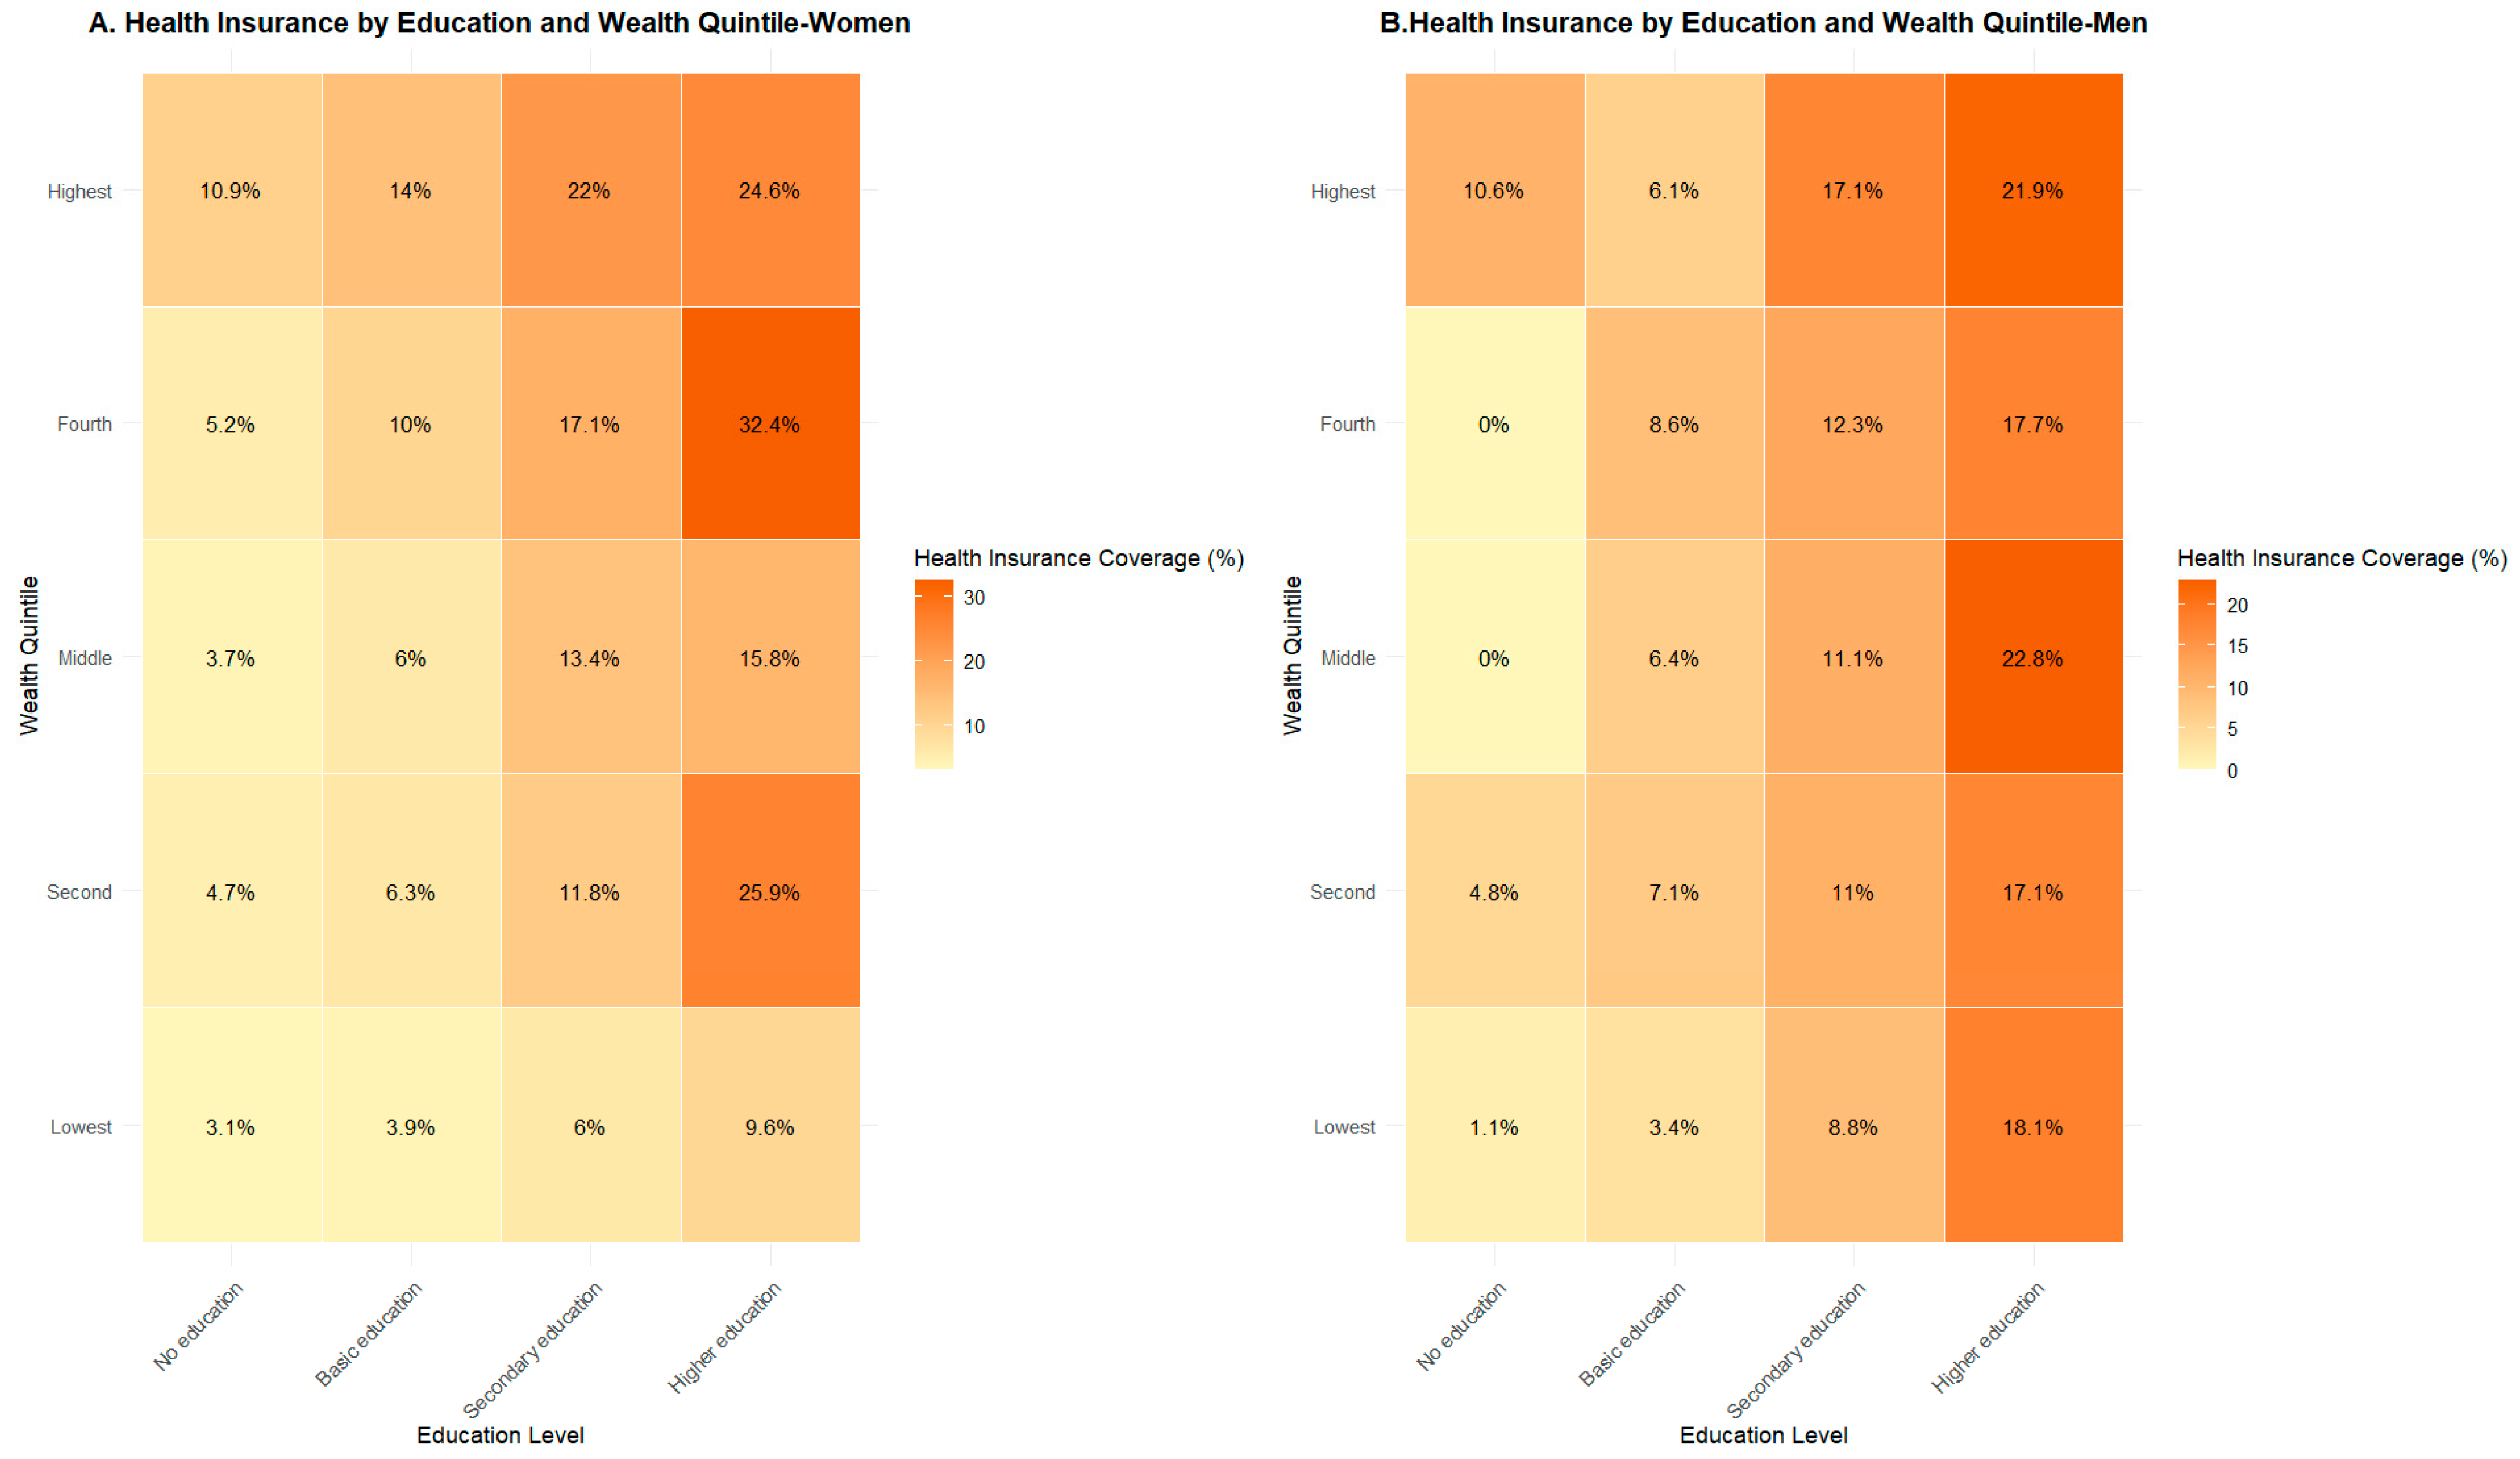
Figure 1 shows clear inequalities in NHIP enrollment by education level and wealth quintile. Enrollment increases with higher education and higher wealth levels for both genders. Higher educated women in the fourth wealth quintile recorded the highest enrollment (32.4%), compared to only 3.1% among uneducated women in poorest quintile. Similarly, higher educated men in third and fifth wealth quintiles had the enrollment rate of nearly 22%, while uneducated men in poorer groups showed almost-zero enrollment (0% in third and fourth quintile and just 1.1% for lowest quintile).
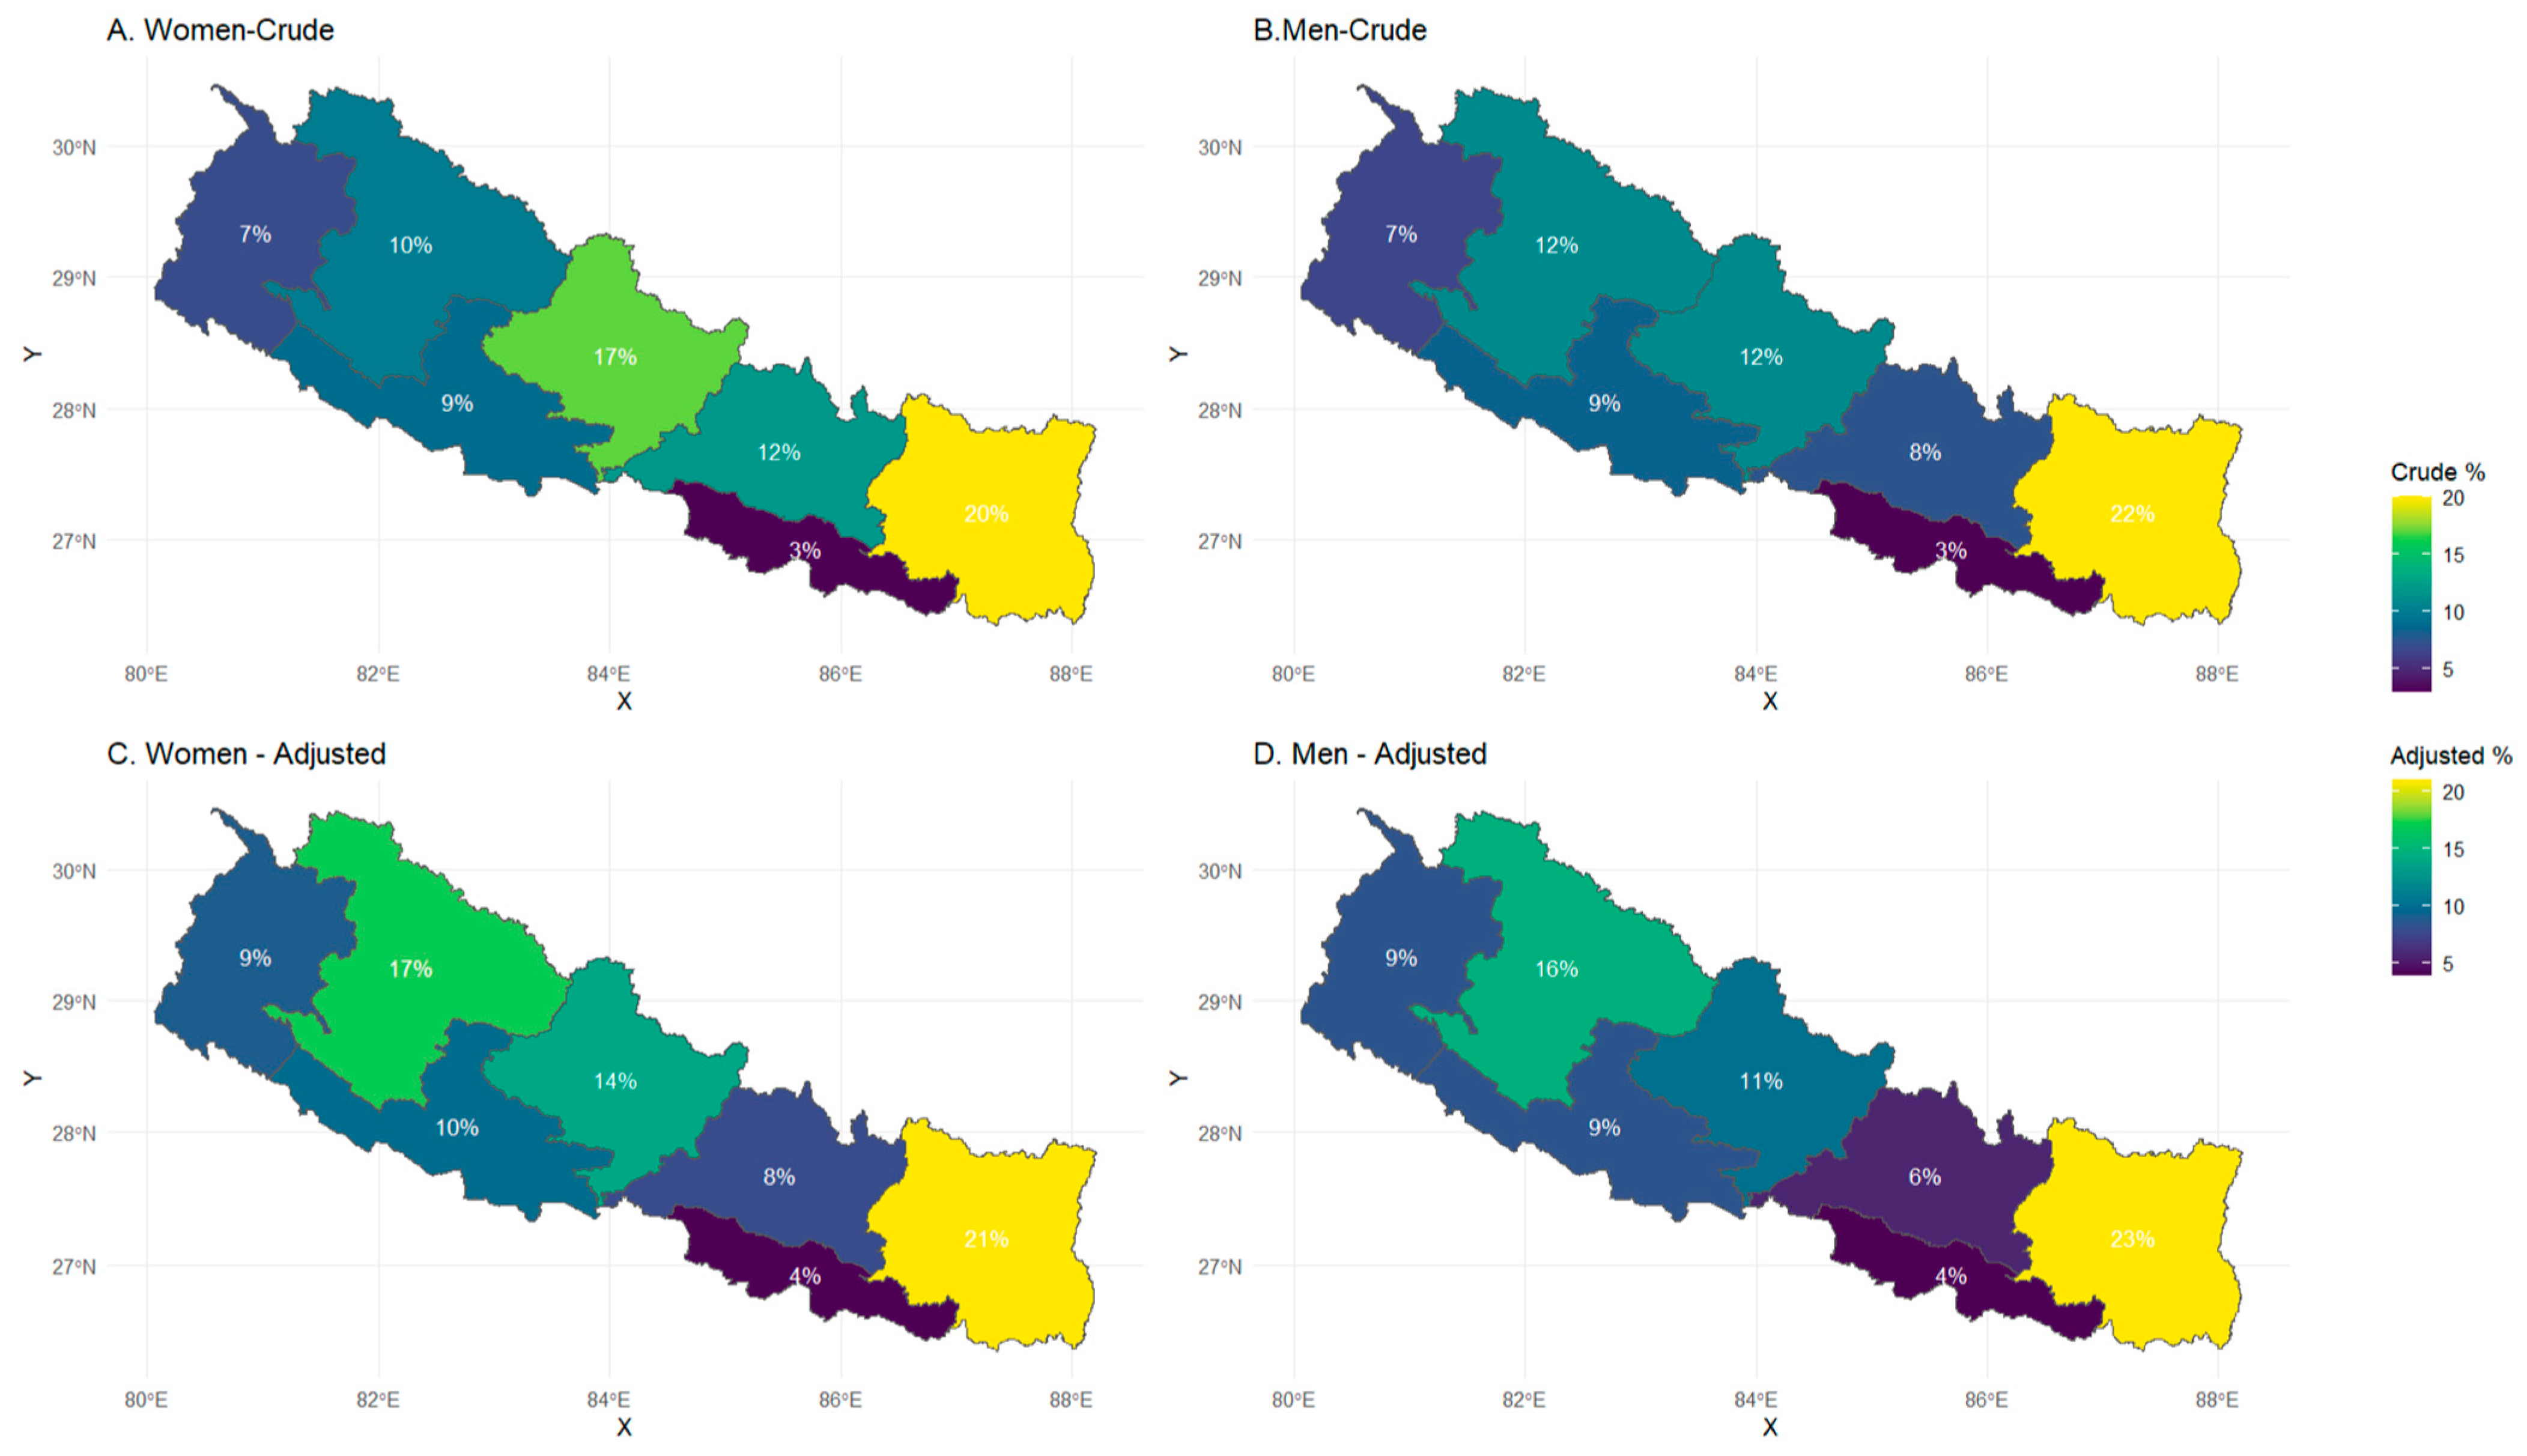
Figure 2 presents provincial variations in NHIP enrollment. Both crude rates (Panel A: Women; Panel B: Men) and adjusted rates (Panels C: Women; Panel D: Men) shows Koshi province maintains the highest NHIP enrollment for both genders, while Madhesh consistently ranks the lowest rates. These patterns highlight significant geographic inequalities in Nepal’s health insurance uptake. Adjustments were made using three key covariates: age, education, and wealth quintile.

3.3. Results from Measures of Inequality by Geographical Location

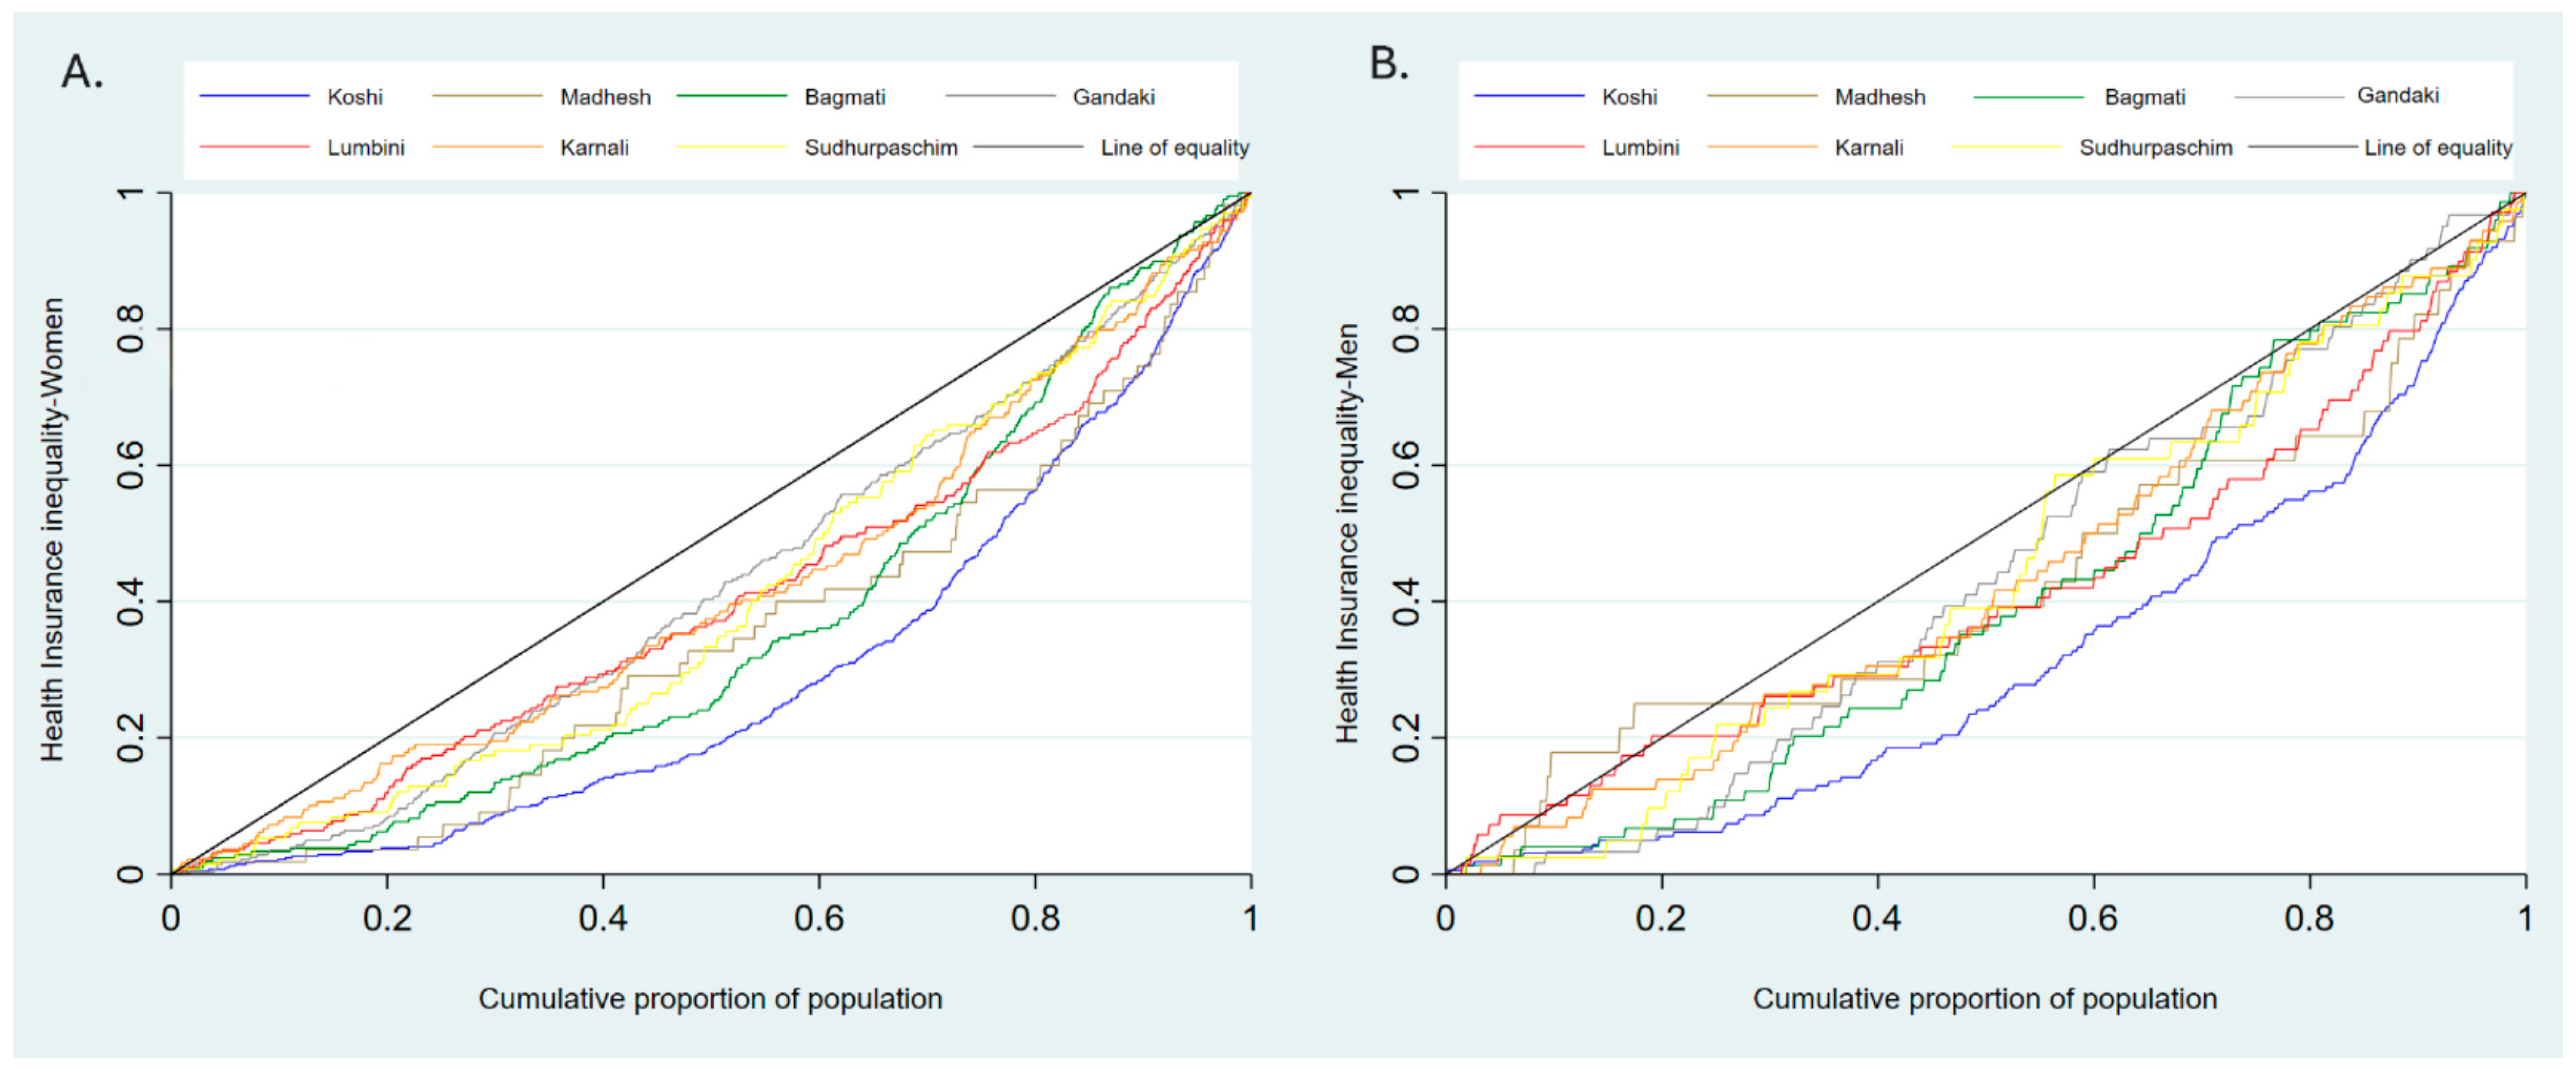
Figure 3 shows inequality in health insurance enrollment in provinces by wealth status. The concentration curve lies below the line of equality. This indicates pro-rich inequalities in NHIP enrollment across seven provinces for both genders. Women from Koshi and Bagmati province showed steeper curves, which shows a stronger pro-rich enrollment bias. In contrast, Sudhurpaschim province showed relatively equitable enrollment. Among men, Koshi again showed the highest wealth-related inequality. These patterns confirm systemic structural advantages for wealthier households in NHIP enrollment.

3.4. Results from Measures of Inequality by Marginalization Status

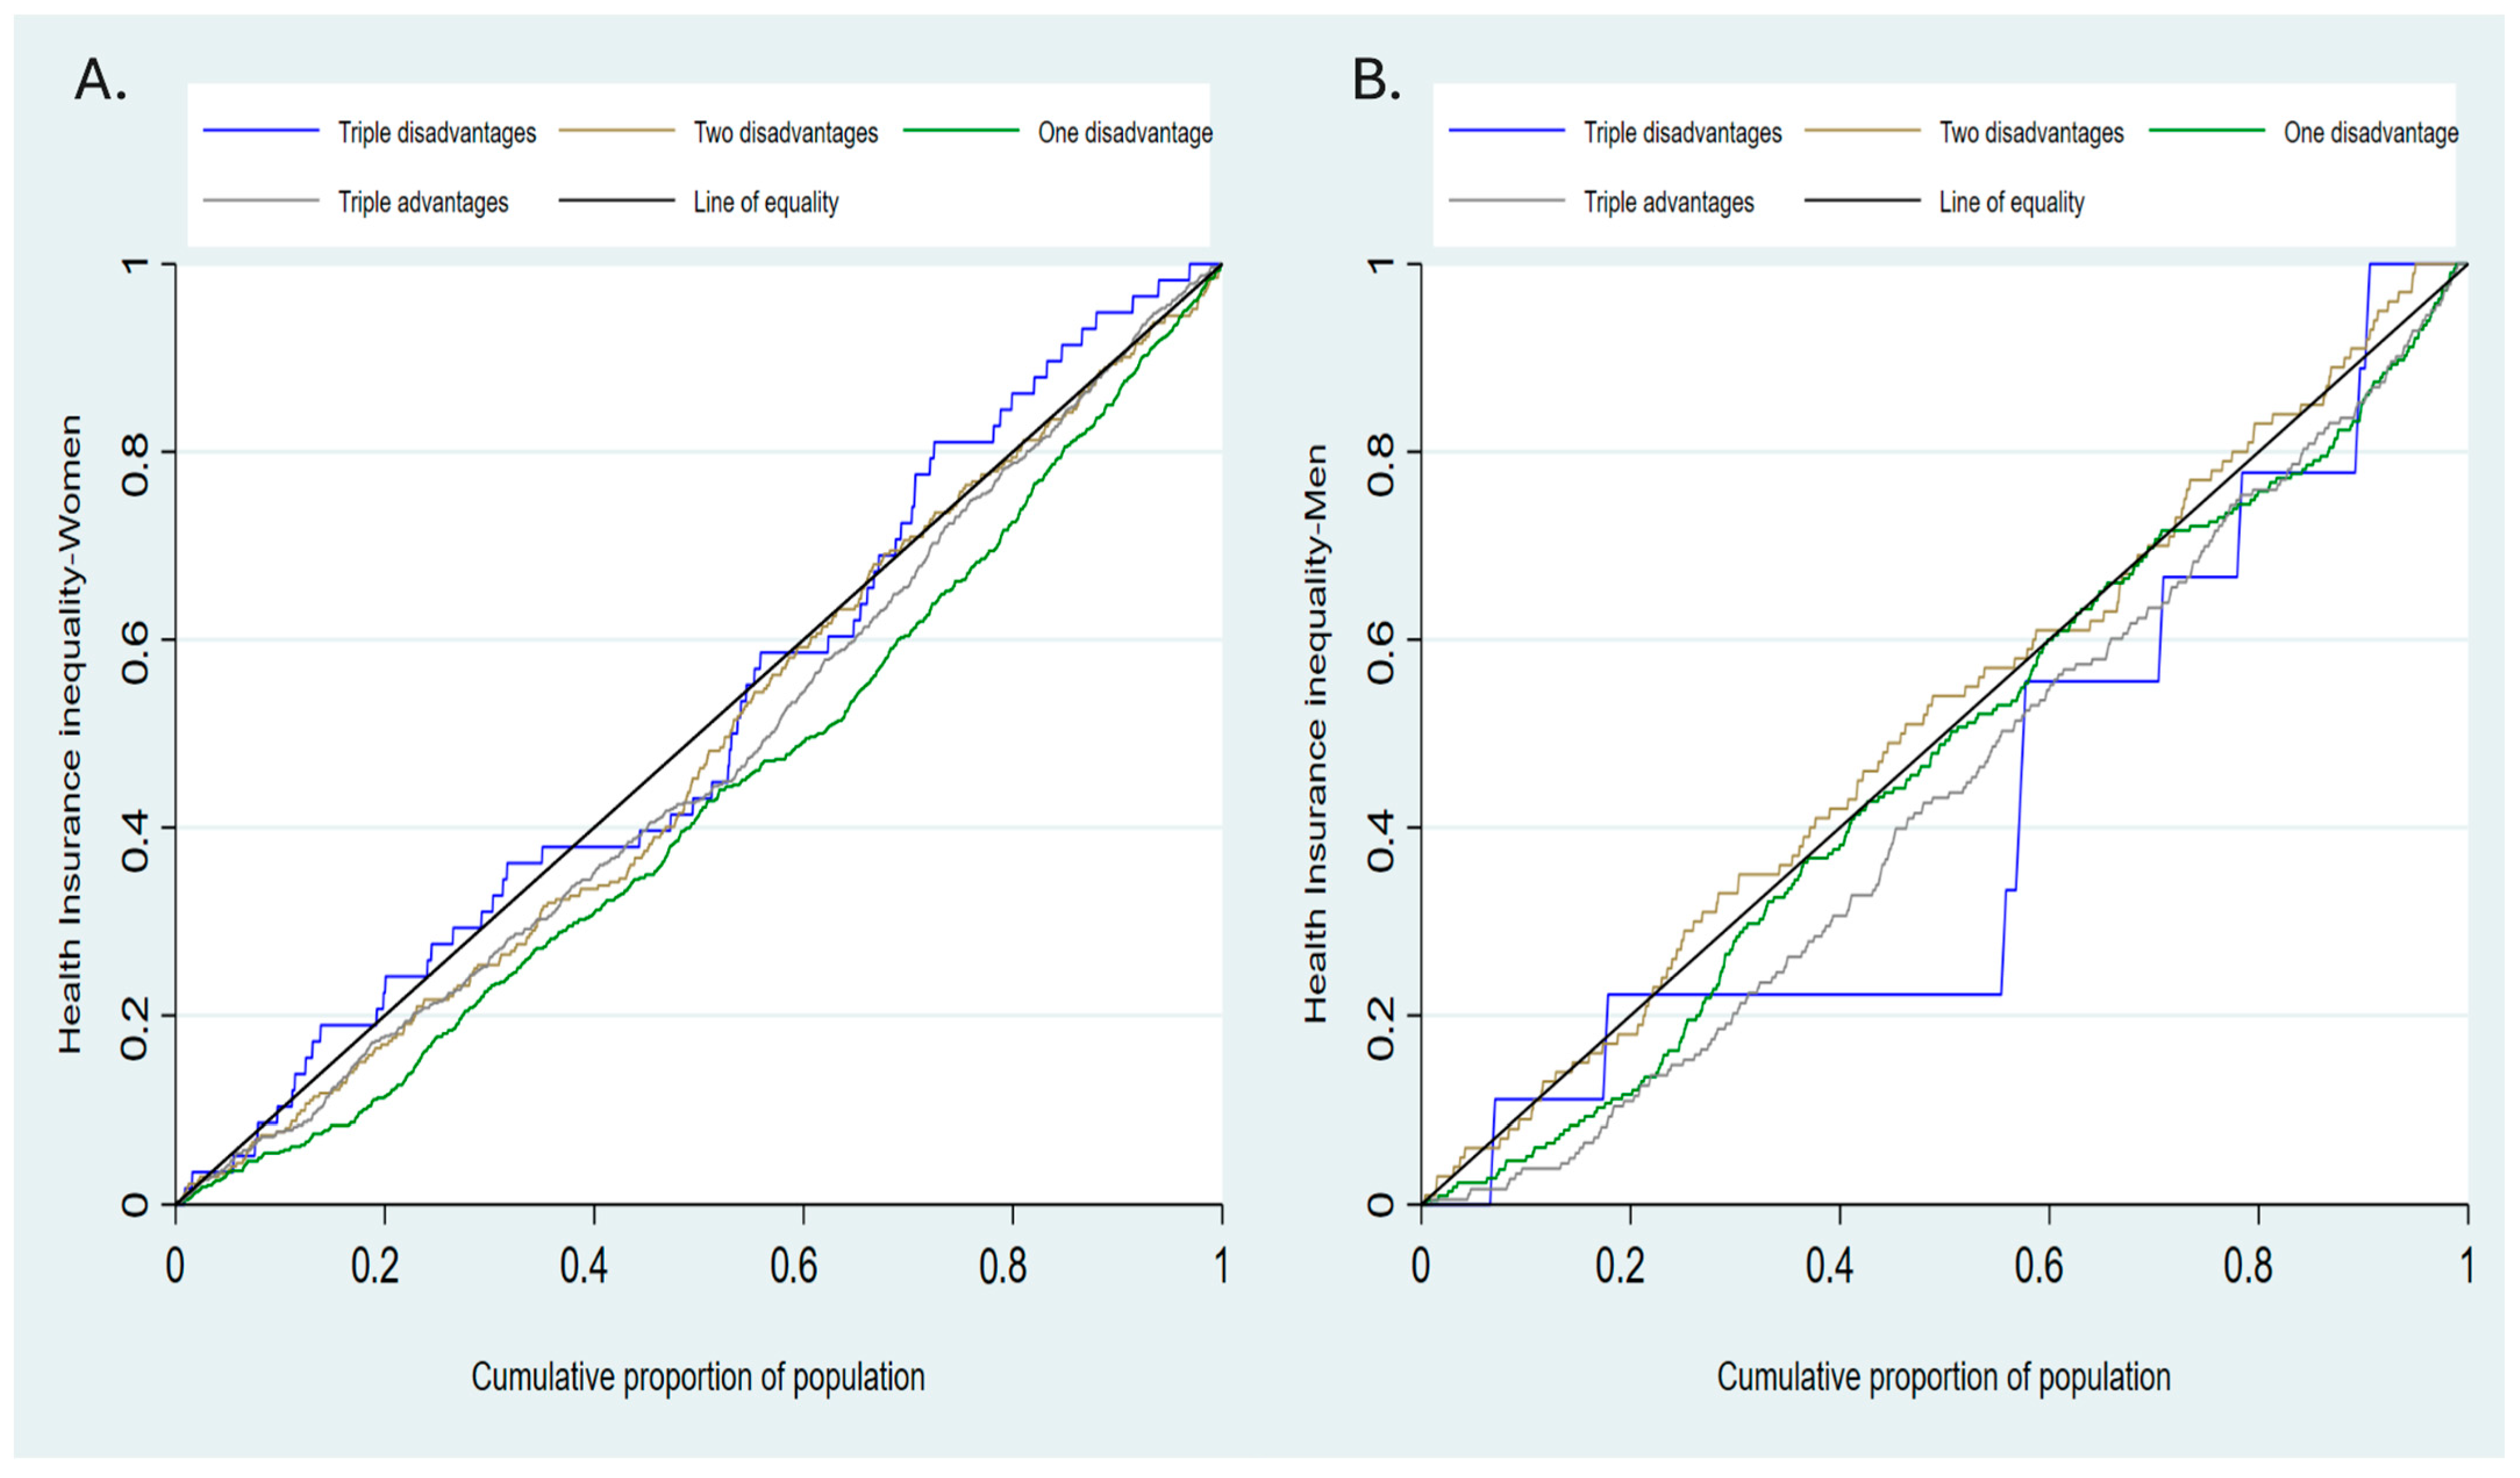
Figure 4 below shows the concentration curve in health insurance enrollment among women and men by their marginalization status. The findings show that NHIP coverage is most concentrated among advantaged groups.

3.5. Socioeconomic and Education-Based Relative Inequality in the Enrollment of NHIP

Table 2 presents the ENCI and summarizes the magnitude of socioeconomic and education-based inequalities. Positive ENCI values mean that NHIP enrollment is more concentrated among higher wealth quintiles and more educated groups. Women experienced greater socioeconomic inequality (ENCI = 0.102) than men (ENCI = 0.071). This pattern is observed in both rural (women: 0.077 vs men: 0.060) and urban areas (women: 0.104 vs men: 0.063). Socioeconomic inequality varies across ecological zones. The strongest pro-rich bias appeared in the Hill zone for both men (ENCI = 0.086) and women (ENCI = 0.129). Provincial differences are also clear. All provinces showed socioeconomic inequality among women, with Koshi showing the highest (0.314) and Madhesh showing lowest (0.026). Among men, disparities were not statistically significant in Madhesh, Gandaki, Karnali, and Sudhurpaschim provinces.
Intersectional analysis revealed more pronounced disparities. Statistically significant ENCI values appeared for both single-disadvantage groups (women:0.053 vs men: 0.027) and no disadvantage groups (women:0.068 vs men: 0.079). These findings highlight persistent socioeconomic, educational, and marginalization-related disparities in NHIP enrollment. The gaps particularly affect women, residents of certain ecological zones, and specific provinces. Education-based inequality follows a similar pattern, with women generally experiencing higher disparities across zones.

3.6. Factors Associated with NHIP Enrollment Among Women and Men

Table 3 indicates that socio-economic disadvantage greatly influences NHIP coverage for both men and women. Adjusted results show that men without disadvantage had approximately 6.4 times greater odds of being covered, while women had about 8 times greater odds compared to those experiencing triple disadvantage. This highlights a clear trend: as marginalization decreases, the likelihood of enrollment rises. Provincial differences were notable, with all provinces showing lower coverage odds compared to Koshi; Madhesh had the lowest odds for both genders (about 90% lower). For women, urban residence was linked to 30% lower odds of coverage than rural residence, whereas this relationship was not statistically significant for men. Ecological zone did not significantly affect NHIP coverage for either gender. Further multivariable analysis details are available in File S1 (Table S3).

4. Discussion

This study examined the coverage of NHIP among women and men using nationally representative survey data. Overall enrollment was low: 10.2% for men (95% CI: 8.8, 11.8) and 10.8% for women (95% CI: 9.6, 12.2). This low enrollment highlights a major barrier in achieving universal coverage of NHIP enrollment.
Our results show that advantaged ethnic groups, literate individuals, those in higher wealth quintiles, people living in rural areas, and residents of Koshi province had significantly higher coverage than other counterparts. Education strongly predicts NHIP enrollment for both genders. Literate individuals had significantly higher rates than illiterate ones (men: 10.9% vs. 2.5%; women: 13.0% vs. 4.5%). Multivariable analysis confirmed this association (Table 2). These findings suggest that education enhances awareness of NHIP benefits and financial risks of remaining uninsured. This finding aligns with previous studies from Nepal [11,31,32], Ghana [33,34], Namibia [35], Ethiopia [36] and other LMICs [37].
To address this gap, enrollment assistants (EAs) have been recruited at ward level to visit homes, explain the scheme, enroll households and collect premium [5]. These EAs could do more through community outreach. Other effective interventions include setting up information desks or enrollment support booths in the health facilities. School could also facilitate by adding insurance education to the school curriculum or conducting sessions within school health programs [38].
Wealth status showed a clear pro-rich pattern. Wealthier households had higher enrollment compared to poorer ones. This is likely because richer households can more easily afford the premium, while poorest face financial barriers. These findings are consistent with research from Nepal [11,39,40], Ghana [33,34,41,42,43,44,45], Ethiopia [36], Namibia [35] and Nigeria [46]. Ethnicity also played a significant role. Advantaged groups are enrolled at higher rates than disadvantaged ones for both sexes. This echoes with previous Nepalese studies showing higher enrollment among advantaged ethnic groups compared to marginalized groups such as Dalits [11,39]. Geographic disparities were clearly visible. Households in Koshi Province were more likely to enroll than those in the other six provinces, while Madhesh had the lowest rate for both genders. Likewise, recent data shows that although the program has been implemented in 750 local governments, almost half (368) of the local governments do not have any FSPs [6], which might have contributed to low enrollment.
Regression analysis confirmed that all the other provinces had significantly lower odds of NHIP enrollment compared to Koshi Province, and aligns with other previous studies [11]. Lower enrollment in Madhesh, Sudhurpaschim, and Karnali provinces may partly reflect their Human Development Index (HDI) scores, which are below the national average of 0.602 [47]. Analysis of service utilization and empaneled health facility data (File S1, Table S4) suggests another issue: limited access to tertiary or high-quality health facilities offering NHIP services. Enrollment was comparatively higher in districts where tertiary-level facilities were available even in low HDI areas like Jumla district.
Structural barriers also played a role in Madhesh Province. Six of its eight districts rank among the nine districts nationwide with the lowest density of NHIP empaneled facilities (<1 facility per 100,000 population). Four of the top five districts with the lowest enrollment rates (Sarlahi, Dhanusha, Mahottari, and Bara) are in Madhesh Province (File S1, Table S5). This uneven distribution of empaneled health facilities might have reduced access to services and, ultimately, the enrollment which has been analyzed and discussed in File S1 (Analysis S1). In addition, many people in Madhesh Province seek healthcare across the border in neighboring India, where the NHIP card is not accepted. This may further discourage enrollment.
Concentration curves and indices showed that NHIP enrollment was more concentrated among wealthier households for both sexes across all seven provinces. Wealthier households were therefore better protected from financial risk, while poorer ones remained exposed to financial hardship. Studies from Sub-Saharan Africa [48], Nepal [11] and Kenya [49] have demonstrated similar pattern.
To address this issue, the Government of Nepal has a policy to subsidize enrollment for poor households [19,20]. Subsidies are provided to targeted populations including ultra-poor households, senior citizens, female-community health volunteers (FCHVs), those with null disability, leprosy patients, individuals with multi-drug resistance tuberculosis and people living with HIV [20]. However, very few poor households have joined the schemes. The recent data shows that of the enrolled 5.97 million active enrolled population, only 1.63 million are from targeted population [6]. Of these, 75% (1.23 million) are senior citizens [6]. Although more than one in five of the (17.4%) populations is poor, as per multi-dimensional poverty index [50], the program has not delivered subsidies to the poor sufficiently. Weak systems for identifying eligible poor households and lack of clear guidelines remain major problem for this issue [5].
The intersectional analysis illustrated compounded disadvantages. Individuals with triple disadvantage (poor, illiterate, and from a disadvantaged ethnic group) had the lowest (men: 3.0%; women: 3.4%), while those with no disadvantage had the highest enrollment rate (men: 18.4%; women: 22.9%). An intersectionality theory suggests that multiple forms of marginalizations interact to lower the odds of enrollment among the most disadvantaged groups [18,51]. In the adjusted model, having no disadvantage was linked to 6.4 times higher odds for men and 8.0 times for women compared to triple disadvantage. A systematic literature review revealed that vulnerable populations—including individuals with disabilities, female-headed households, ethnic minorities, and displaced persons—have lower enrollments [52].
The ENCI shows persistent socio-economic and education-based inequality in NHIP enrollment. These inequalities favor richer and educated groups and were stronger among women. This suggests structural barriers, such as limited access to information, financial autonomy, or decision-making power within households, may disproportionately affect women’s ability to enroll in the NHIP. The ENCI findings confirm that inequality in NHIP enrollment undermines the progress towards UHC in Nepal. The persistent barriers for poorer, less educated, rural and female population and unequal expansion in Madhesh, Karnali and Sudhurpaschim province compared to Koshi Province indicates several policy and programmatic reforms.

4.1. Program and Policy Implications

This study reveals several actionable policy implications to enhance NHIP enrollment and equity, advancing the pathway to UHC goals. First, facing triple disadvantage need targeted approaches based on the intersectionality framework [53]. The policymakers should identify most marginalized and design-targeted interventions. This could include targeted awareness campaigns, integrated outreach programs that links health insurance with other health programs, and shift from blanket subsidies to multi-dimensional targeting that addresses compounded barriers [54].
Second, community outreach programs should merge health insurance awareness with existing community platforms. Subsidies need to move from universal to targeted support for vulnerable populations, and educational initiatives should foster insurance literacy through schools and community mobilizers. Rwanda and Ghana successfully increased enrollment through community-based campaigns delivered through school [55,56].
Third, large provincial disparities—the highest in Koshi and the lowest in Madhesh—highlight the need to improve geographic access. Increasing the number of empaneled health facilities and first service points (FSPs) in underserved provinces could enhance access and uptake. The evidence from Rwanda shows that better healthcare access increases enrollment [55].
Fourth, observed pro-rich bias calls for a stronger system to identify and subsidize poor households. Although subsidies policy exists, the existing mechanisms are weak for its effective implementation [5,7]. Implementing a more robust identification system such as integrating local government data or community-based targeting would help to reach appropriate poor households [5,7]. Ethiopia’s hybrid model, which combined poverty-targeted social protection with health insurance program can be a useful example [57].
Finally, strategic expansion of empaneled facilities is needed in under-performing districts. Policymakers should carefully assess the location of health facilities considering the population distribution and reliable transportation networks to promote equitable access to services.

4.2. Strength and Limitation

Our study helps in filling the knowledge gaps in inequality in NHIP enrollment through three methodological advancements. First, it used a large, national representatives survey, which supports generalizability to broader Nepali population. Second, it applies an intersectionality framework to examine compounded disadvantages. Third, it extended earlier works [11,13] by using concentration curve and intersectionality analysis to analyze multiple level of marginalization.
This study has some limitations. First, this observational and cross-sectional design pecan shows associations but cannot prove causality or temporality. Second, outcome was self-reported, during face-to-face interviews with respondents, which may introduce social desirability bias. In addition, DHS survey records enrollment at an individual-level, whereas NHIP enrollment is a household decision. Sampling weights provided in the survey were applied to ensure representativeness. Results for women and men are shown separately. Although gender was not a sampling stratum the smaller male sample may slightly reduce precision for male-specific estimates. Finally, the quantitative approach may not fully capture lived experiences of intersecting disadvantages. Further qualitative research would be valuable.

5. Conclusions

This study applied an intersectional lens to examine how overlapping inequalities affect NHIP enrollment in Nepal. The findings show that social identity does not operate in isolation. Instead, poverty, illiteracy and ethnic marginalization interact to create compounded disadvantages. Individuals facing these compounded disadvantages had substantially lower enrollment than those with no disadvantage. These inequities reflect systemic barriers that disproportionately exclude the most vulnerable populations from financial risk protection. The results highlight that although the NHIP is moving towards UHC, it currently fails to reach those who need it most because of multiple forms of marginalization.

Supplementary Materials

The following supporting information can be downloaded at https://www.mdpi.com/article/10.3390/ijerph23040521/s1. Figure S1: Flowchart showing the sampling of study; Table S1: Description and categorization of covariates; Table S2: Bivariate analysis for association between coverage of NHIP and explanatory variables; Table S3: Unadjusted and Adjusted odds ratio of NHIP coverage among women and men; Table S4: District level service data; Table S5: Province level service data; Analysis S1: Analysis of health insurance service data. Figure S2: Enrolment in National Health Insurance Program by districts and provinces. Figure S3: Enrolment percentage and health facility density by districts and province levels.

Author Contributions

Conceived the idea of study: G.N.K.; Conceptualized the study: G.N.K. and K.A.; Contributed statistical analyses: G.N.K. and K.A.; Drafted the paper: G.N.K.; Reviewed and finalized the manuscript: G.N.K. and K.A.; Agreed on final manuscript: G.N.K. and K.A. All authors have read and agreed to the published version of the manuscript.

Funding

This research received no external funding.

Institutional Review Board Statement

We obtained approval and access to Nepal Demographic and Health Survey 2022 (NDHS 2022) data after requesting the data from the official website of ‘The DHS programme’. The NDHS 2022 obtained ethical approval from Ethical Review Board of Nepal Health Research Council (reference number: 494/2021) and institutional review board of ICF international (reference number: 180657.0.001.NP.DHS.01). District-level geographical inequality analysis used publicly available data from multiple sources and hence no ethical approval was required.

Informed Consent Statement

New ERA, the research organization that implemented the survey, obtained written informed consent from every participant before enrolling them into the study.

Data Availability Statement

Upon approval of our request to access the data, we downloaded NDHS 2022 dataset from https://dhsprogram.com/data/available-datasets.cfm. Data was accessed on 24 June 2023.

Acknowledgments

We would like to acknowledge DHS program for providing us with data for further analysis.

Conflicts of Interest

The authors declare no conflicts of interest.

Abbreviations

The following abbreviations are used in this manuscript:
aORAdjusted Odds Ratio
CIConfidence Interval
DHSDemographic and Health Survey
EAEnrollment Assistant
ENCIErreygers Normalized Concentration Index
FCHVFemale Community Health Volunteer
FSPFirst Service Point
HDIHuman Development Index
HIBHealth Insurance Board
LMICLow- and Middle-Income Country
MICSMultiple Indicator Cluster Survey
NDHSNepal Demographic and Health Survey
NHIPNational Health Insurance Program
OOPEOut-of-Pocket Expenditure
PHCPrimary Healthcare Center
SDGSustainable Development Goal
SEStandard Error
UHCUniversal Health Coverage
uORUnadjusted Odds Ratio
VIFVariance Inflation Factor
WHOWorld Health Organization

References

  1. World Health Organization. The World Health Report: Health Systems Financing: The Path to Universal Coverage; World Health Organization: Geneva, Switzerland, 2010. [Google Scholar]
  2. World Health Organization. Making Fair Choices on the Path to Universal Health Coverage: Final Report of the WHO Consultative Group on Equity and Universal Health Coverage; World Health Organization: Geneva, Switzerland, 2014; ISBN 978-92-4-150715-8. [Google Scholar]
  3. Bayarsaikhan, D.; Tessier, L.; Ron, A. Universal Health Coverage and Social Health Protection: Policy Relevance to Health System Financing Reforms. Int. Soc. Secur. Rev. 2022, 75, 75–95. [Google Scholar] [CrossRef]
  4. Pokharel, R.; Silwal, P.R. Social Health Insurance in Nepal: A Health System Departure toward the Universal Health Coverage. Int. J. Health Plan. Manag. 2018, 33, 573–580. [Google Scholar] [CrossRef] [PubMed]
  5. Khanal, G.N.; Bharadwaj, B.; Upadhyay, N.; Bhattarai, T.; Dahal, M.; Khatri, R.B. Evaluation of the National Health Insurance Program of Nepal: Are Political Promises Translated into Actions? Health Res. Policy Syst. 2023, 21, 7. [Google Scholar] [CrossRef] [PubMed]
  6. Health Insurance Board Health Insurance: Yesterday and Today in Data (Unofficial Translation), 2026. Presented at the Paper Presentation on 10th Health Insurance Day, Kathmandu, Nepal, 8 April 2026.
  7. Ministry of Health and Population. Report of Health Insurance Reform Advise Taskforce, 2025; Ministry of Health and Population: Kathmandu, Nepal, 2025.
  8. Health Insurance Board. Benefit Package Revised List and Rate 2024 (Unofficial Translation); Health Insurance Board: Kathmandu, Nepal, 2024.
  9. Health Insurance Board. Health Institutions Designated as Service Providers in the Form of First Service Point Under the Health Insurance Board (Unofficial Translation); Health Insurance Board: Kathmandu, Nepal, 2025.
  10. Khatri, R.; Dulal, K.P.; Timelsena, K.; Tamrakar, M.; Rosenberg, R.; Tuladhar, S. Equity Analysis of Maternal Health Services in Nepal: Trends and Determinants, 2011–2022 Nepal DHS Surveys; DHS Further Analysis Reports; Ministry of Health and Population: Kathmandu, Nepal, 2024. [Google Scholar]
  11. Bhusal, U.P.; Sapkota, V.P. Predictors of Health Insurance Enrolment and Wealth-Related Inequality in Nepal: Evidence from Multiple Indicator Cluster Survey (MICS) 2019. BMJ Open 2021, 11, e050922. [Google Scholar] [CrossRef] [PubMed]
  12. Acharya, D.; Sharma, S.; Bietsch, K. Enrollment and Associated Factors of the National Health Insurance Program of Nepal: Further Analysis of the Nepal Demographic and Health Survey 2022. PLoS ONE 2024, 19, e0310324. [Google Scholar] [CrossRef]
  13. Acharya, D.; Sharma, S.; Bietsch, K.; Courey, M. Status and Associated Factors of Health Insurance Enrollment in Nepal: Findings from Nepal Demographic Health Survey 2022; DHS Further Analysis Reports; Ministry of Health and Population: Kathmandu, Nepal, 2024. [Google Scholar]
  14. Giri, S.; Acharya, D.; Adhikari, R.; Sharma, M.K.; Ranabhat, C.L. Status and Associated Factors of Health Insurance Enrollment among Women in Nepal. World Med. Health Policy 2025, 17, 49–63. [Google Scholar] [CrossRef]
  15. Lamichhane, P.; Banjara, R.; Dulal, B.P. What Determines Health Insurance Ownership in Nepal? Findings from the Nepal Multiple Indicator Cluster Survey 2019. J. Health Serv. Res. Policy 2026, 31, 25–33. [Google Scholar] [CrossRef]
  16. Bauer, G.R. Incorporating Intersectionality Theory into Population Health Research Methodology: Challenges and the Potential to Advance Health Equity. Soc. Sci. Med. 2014, 110, 10–17. [Google Scholar] [CrossRef]
  17. Khatri, R.B.; Alemu, Y.; Protani, M.M.; Karkee, R.; Durham, J. Intersectional (in) Equities in Contact Coverage of Maternal and Newborn Health Services in Nepal: Insights from a Nationwide Cross-Sectional Household Survey. BMC Public Health 2021, 21, 1098. [Google Scholar] [CrossRef]
  18. Aspinall, C.; Jacobs, S.; Frey, R. Intersectionality and Critical Realism: A Philosophical Framework for Advancing Nursing Leadership. Adv. Nurs. Sci. 2019, 42, 289–296. [Google Scholar] [CrossRef]
  19. Government of Nepal. Health Insurance Act [Unofficial Translation]. 2017.
  20. Government of Nepal. Health Insurance Regulation, 2019 [Unofficial Translation]. 2019.
  21. United Nations Sustainable Development Group. Universal Values: Leave No One Behind. Available online: https://unsdg.un.org/2030-agenda/universal-values/leave-no-one-behind (accessed on 13 March 2026).
  22. United Nations Goals 10: Reduce Inequality Within and Among Countries. Available online: https://sdgs.un.org/goals/goal10 (accessed on 13 March 2026).
  23. Ministry of Health and Population; New Era; ICF. Nepal Demographic and Health Survey 2022; Ministry of Health and Population: Kathmandu, Nepal, 2023.
  24. ICF Demographic and Health Survey. Available online: https://dhsprogram.com/data/data-collection.cfm (accessed on 10 March 2026).
  25. Bhattarai, N.; Bam, K.; Acharya, K.; Thapa, R.; Shrestha, B. Factors Associated with HIV Testing and Counselling Services among Women and Men in Nepal: A Cross-Sectional Study Using Data from a Nationally Representative Survey. BMJ Open 2021, 11, e049415. [Google Scholar] [CrossRef]
  26. Erreygers, G. Correcting the Concentration Index. J. Health Econ. 2009, 28, 504–515. [Google Scholar] [CrossRef] [PubMed]
  27. Okova, D.; Chiwire, P.; Lukwa, A.T. Progress and Inequality in Cervical Cancer Screening in Lesotho (2009–2024): Decomposing within- and between-Group Inequality. SSM-Health Syst. 2025, 5, 100120. [Google Scholar] [CrossRef]
  28. Lukwa, A.T.; Okova, D.; Bodzo, P.; Maseko, S.C.; Bhebe, M.; Akinsolu, F.T.; Olunike, A.; Nzeribe, E.; Siya, A.; Nyabunze, A.; et al. Temporal Socio-Economic Inequalities in the Double Burden of Malnutrition (DBM) among under-Five Children: An Analysis of within- and between-Group Disparities in 20 Sub-Saharan African Countries (2004–2024). Glob. Transit. 2025, 7, 262–275. [Google Scholar] [CrossRef]
  29. StataCorp. Stata: Release 17; StataCorp LLC: College Station, TX, USA, 2021. [Google Scholar]
  30. R Core Team. A Language and Environment for Statistical Computing, version 4.4.0; R Foundation for Statistical Computing: Vienna, Austria, 2024.
  31. Acharya, D.; Devkota, B.; Wagle, B.P. Factors Associated to the Enrollment in Health Insurance: An Experience from Selected Districts of Nepal. Asian Soc. Sci. 2019, 15, 90. [Google Scholar] [CrossRef]
  32. Adhikari, A.; Gahatraj, N.R.; Yadav, D.K. Factors Associated with Non-Enrollment in National Health Insurance Scheme in Kaski District, Nepal. Nepal. J. Insur. Soc. Secur. 2020, 3, 77–90. [Google Scholar] [CrossRef]
  33. Dake, F.A.A. Examining Equity in Health Insurance Coverage: An Analysis of Ghana’s National Health Insurance Scheme. Int. J. Equity Health 2018, 17, 85. [Google Scholar] [CrossRef] [PubMed]
  34. Salari, P.; Akweongo, P.; Aikins, M.; Tediosi, F. Determinants of Health Insurance Enrolment in Ghana: Evidence from Three National Household Surveys. Health Policy Plan. 2019, 34, 582–594. [Google Scholar] [CrossRef]
  35. Allcock, S.H.; Young, E.H.; Sandhu, M.S. Sociodemographic Patterns of Health Insurance Coverage in Namibia. Int. J. Equity Health 2019, 18, 16. [Google Scholar] [CrossRef]
  36. Kebede, S.A.; Liyew, A.M.; Tesema, G.A.; Agegnehu, C.D.; Teshale, A.B.; Alem, A.Z.; Yeshaw, Y. Spatial Distribution and Associated Factors of Health Insurance Coverage in Ethiopia: Further Analysis of Ethiopia Demographic and Health Survey, 2016. Arch. Public Health 2020, 78, 25. [Google Scholar] [CrossRef]
  37. Adebayo, E.F.; Uthman, O.A.; Wiysonge, C.S.; Stern, E.A.; Lamont, K.T.; Ataguba, J.E. A Systematic Review of Factors That Affect Uptake of Community-Based Health Insurance in Low-Income and Middle-Income Countries. BMC Health Serv. Res. 2015, 15, 543. [Google Scholar] [CrossRef] [PubMed]
  38. Jenkins, J.M. Healthy and Ready to Learn: Effects of a School-Based Public Health Insurance Outreach Program for Kindergarten-Aged Children. J. Sch. Health 2018, 88, 44–53. [Google Scholar] [CrossRef] [PubMed]
  39. Ghimire, P.; Sapkota, V.P.; Poudyal, A.K. Factors Associated with Enrolment of Households in Nepal’s National Health Insurance Program. Int. J. Health Policy Manag. 2019, 8, 636–645. [Google Scholar] [CrossRef]
  40. Acharya, D.; Thapa, K.B.; Sharma, B.; Rana, M.S. Causes of Dropout from Health Insurance Program: An Experience from Lumbini Province, Nepal. Dialogues Health 2023, 3, 100150. [Google Scholar] [CrossRef]
  41. Amu, H.; Dickson, K.S. Health Insurance Subscription among Women in Reproductive Age in Ghana: Do Socio-Demographics Matter? Health Econ. Rev. 2016, 6, 24. [Google Scholar] [CrossRef]
  42. Duku, S.K.O. Differences in the Determinants of Health Insurance Enrolment among Working-Age Adults in Two Regions in Ghana. BMC Health Serv. Res. 2018, 18, 384. [Google Scholar] [CrossRef]
  43. Jehu-Appiah, C.; Aryeetey, G.; Spaan, E.; De Hoop, T.; Agyepong, I.; Baltussen, R. Equity Aspects of the National Health Insurance Scheme in Ghana: Who Is Enrolling, Who Is Not and Why? Soc. Sci. Med. 2011, 72, 157–165. [Google Scholar] [CrossRef]
  44. Kumi-Kyereme, A.; Amo-Adjei, J. Effects of Spatial Location and Household Wealth on Health Insurance Subscription among Women in Ghana. BMC Health Serv. Res. 2013, 13, 221. [Google Scholar] [CrossRef]
  45. Kusi, A.; Hansen, K.S.; Asante, F.A.; Enemark, U. Does the National Health Insurance Scheme Provide Financial Protection to Households in Ghana? BMC Health Serv. Res. 2015, 15, 331. [Google Scholar] [CrossRef]
  46. Aregbeshola, B.S.; Khan, S.M. Predictors of Enrolment in the National Health Insurance Scheme Among Women of Reproductive Age in Nigeria. Int. J. Health Policy Manag. 2018, 7, 1015–1023. [Google Scholar] [CrossRef] [PubMed]
  47. Dulal, T.D. Status of Human Development Index with Reference to Nepal. J. Popul. Dev. 2023, 4, 166–180. [Google Scholar] [CrossRef]
  48. Barasa, E.; Kazungu, J.; Nguhiu, P.; Ravishankar, N. Examining the Level and Inequality in Health Insurance Coverage in 36 Sub-Saharan African Countries. BMJ Glob. Health 2021, 6, e004712. [Google Scholar] [CrossRef]
  49. Wamalwa, P.N.; Strupat, C.; Singh, K.; Kuloba, M.N.; Kazungu, J.; De Allegri, M. Who Remains Uncovered? Assessing Inequalities and Determinants of National Health Insurance Enrolment among Informal Sector Workers in Kenya. Glob. Health Res. Policy 2025, 10, 62. [Google Scholar] [CrossRef]
  50. National Planning Commission. Multidimentional Poverty Index: Analysis Towards Action; 2021. Available online: https://ophi.org.uk/publications/Nepal-MPI-report-2021 (accessed on 13 March 2026).
  51. Elaine Muirhead, V.; Milner, A.; Freeman, R.; Doughty, J.; Macdonald, M.E. What Is Intersectionality and Why Is It Important in Oral Health Research? Community Dent. Oral Epidemiol. 2020, 48, 464–470. [Google Scholar] [CrossRef] [PubMed]
  52. Van Hees, S.G.M.; O’Fallon, T.; Hofker, M.; Dekker, M.; Polack, S.; Banks, L.M.; Spaan, E.J.A.M. Leaving No One behind? Social Inclusion of Health Insurance in Low- and Middle-Income Countries: A Systematic Review. Int. J. Equity Health 2019, 18, 134. [Google Scholar] [CrossRef] [PubMed]
  53. Holman, D.; Salway, S.; Bell, A.; Beach, B.; Adebajo, A.; Ali, N.; Butt, J. Can Intersectionality Help with Understanding and Tackling Health Inequalities? Perspectives of Professional Stakeholders. Health Res. Policy Syst. 2021, 19, 97. [Google Scholar] [CrossRef]
  54. James, N.; Acharya, Y. Increasing Health Insurance Enrollment in Low- and Middle-Income Countries: What Works, What Does Not, and Research Gaps: A Scoping Review. Inq. J. Med. Care Organ. Provis. Financ. 2022, 59, 469580221090396. [Google Scholar] [CrossRef] [PubMed]
  55. Muremyi, R.; Migisha, L.B.; Munezero, M.L.P.; Mumararungu, S.; Niyigena, E.; Mpabuka, G.W.; Batamuliza, J.; Ruranga, C. Barriers to Health Insurance Uptake in Rwanda: A Nationwide Cross-Sectional Survey. Pan Afr. Med. J. 2025, 51, 8. [Google Scholar] [CrossRef]
  56. Antabe, R.; Anfaara, F.W.; Sano, Y.; Amoak, D. Ghana’s National Health Insurance Enrollment: Does the Intersection of Educational and Residential Status Matter? PLoS ONE 2025, 20, e0318202. [Google Scholar] [CrossRef]
  57. Mussa, E.C.; Otchere, F.; Vinci, V.; Reshad, A.; Palermo, T.; ISNP Evaluation Team. Linking Poverty-Targeted Social Protection and Community Based Health Insurance in Ethiopia: Enrolment, Linkages, and Gaps. Soc. Sci. Med. 2021, 286, 114312. [Google Scholar] [CrossRef]
Figure 1. Enrollment of health insurance among women (A) and men (B) in Nepal by education status and wealth quintile.
Ijerph 23 00521 g001
Figure 2. Health insurance enrollment (crude and adjusted) by province in Nepal.
Ijerph 23 00521 g002
Figure 3. Concentration curve showing wealth-related inequality in NHIP enrollment in women (A) and men (B) by provinces.
Ijerph 23 00521 g003
Figure 4. Concentration curve showing wealth-related inequality in NHIP enrollment in women (A) and men (B) by marginalization status.
Ijerph 23 00521 g004
Table 1. Bivariate analysis for association between coverage of NHIP and explanatory variables.
MenWomen
VariableNCoverage % [95% CI]p ValueNCoverage % [95% CI]p Value
Overall491310.2 [8.8, 11.8] 14,84510.8 [9.6, 12.2]
Structural
Ethnicity
    Disadvantaged33117.5 [6.3, 9.0] 99377.3 [6.3, 8.5]
    Advantaged160215.8 [13.0, 19.1]<0.001490817.8 [15.5, 20.5]<0.001
Education
    Illiterate3932.5 [1.2, 5.1] 37964.5 [3.6, 5.6]
    Literate 452010.9 [9.4, 12.6]<0.00111,04913.0 [11.5, 14.6]<0.001
Wealth rank
    Poor (40%)16846.8 [5.4, 8.5] 54855.8 [4.8, 7.0]
    Rich (60%)322912.0 [10.2, 14.2]<0.001936013.7 [12.1, 15.6]<0.001
Intersectionality
    Poor, illiterate and disadvantaged ethnicity2413.0 [1.2, 7.0] 16003.4 [2.4, 4.9]
    Poor, illiterate and advantaged ethnicity217.2 [1.7, 25.6] 4505.8 [4.0, 8.3]
    Poor, literate and disadvantaged ethnicity10026.7 [5.0, 9.0] 23615.7 [4.5, 7.3]
    Rich, illiterate and disadvantaged ethnicity1210 15034.1 [3.1, 5.5]
    Poor, literate and advantaged ethnicity4209.3 [6.7, 12.7] <0.00110749.7 [7.6, 12.2]<0.001
    Rich, illiterate and advantaged ethnicity 1013.4 [1.9, 55.6] 24311.5 [7.3, 17.5]
    Rich, literate and disadvantaged ethnicity19479.0 [7.2, 11.1] 447310.7 [9.0, 12.5]
    Rich, literate and advantaged ethnicity115118.4 [14.9, 22.6] 314222.9 [19.6, 26.5]
Marginalization
    Triple disadvantage 2413.0 [1.2, 7.0] 16003.4 [2.4, 4.9]
    Double disadvantage 11456.0 [4.5, 8.0]<0.00143145.2 [4.3, 6.3]<0.001
    Single disadvantage23769.0 [7.5, 10.9] 578910.5 [9.1, 12.1]
    No disadvantage115118.4 [14.9, 22.6] 314222.9 [19.6, 26.5]
Intermediatory
Province
    Koshi88221.8 [17.0, 27.5] 249320.4 [16.5, 25.0]
    Madhesh9973.1 [1.9, 5.2] 30102.7 [1.6, 4.4]
    Bagmati12148.4 [5.9, 11.7] 306211.5 [8.5, 15.2]
    Gandaki38711.7 [8.3, 16.3]<0.001140116.6 [13.2, 20.7]<0.001
    Lumbini8129.0 [5.8, 13.7] 26919.4 [6.7, 13.0]
    Karnali26612.3 [8.4, 17.5] 90910.3 [7.5, 14.1]
    Sudhurpaschim 3557.3 [4.1, 12.7] 12796.6 [4.0, 10.9]
Residence
    Urban346211.0 [9.2, 13.1]0.07010,17812.2 [10.5, 14.1]
    Rural14518.4 [6.6, 10.6] 46677.8 [6.4, 9.4]<0.001
Ecological zone
    Mountain25510.7 [5.8, 18.8] 7919.9 [6.7, 14.4]
    Hill197310.3 [8.3, 12.6]0.988587211.7 [9.9, 13.9]0.416
    Terai268510.2 [8.2, 12.5] 818210.2 [8.5, 12.2]
Note: The p-value in bold indicates significant values.
Table 2. Socioeconomic and education-based Erreygers Normalized Concentration Index (ENCI) in the enrollment of NHIP.
CharacteristicsENCI (SE)
Socioeconomic InequalityEducation-Based Inequality
MenWomenMenWomen
Overall0.071 *** (0.011)0.102 *** (0.005)0.101 *** (0.009)0.105 *** (0.005)
Place of residence
    Urban0.063 *** (0.014)0.104 *** (0.008)0.087 *** (0.013)0.115 *** (0.008)
    Rural0.060 *** (0.013)0.077 *** (0.007)0.111 *** (0.012)0.083 *** (0.007)
Ecological zone
    Mountain0.046 (0.033)0.059 *** (0.016)0.084 * (0.036)0.043 * (0.019)
    Hill0.086 *** (0.015)0.129 *** (0.008)0.097 *** (0.014)0.098 *** (0.008)
    Terai0.111 *** (0.013)0.121 *** (0.008)0.109 *** (0.013)0.122 *** (0.007)
Province
    Koshi0.303 *** (0.030)0.314 *** (0.018)0.199 *** (0.029)0.188 *** (0.017)
    Madhesh0.019 (0.013)0.026 *** (0.007)0.051 *** (0.013)0.033 *** (0.006)
    Bagmati0.080 *** (0.022)0.117 *** (0.014)0.128 *** (0.021)0.102 *** (0.014)
    Gandaki 0.045 (0.033)0.102 *** (0.020)0.128 *** (0.029)0.131 *** (0.019)
    Lumbini0.064 * (0.025)0.073 *** (0.014)0.063 ** (0.023)0.092 *** (0.013)
    Karnali 0.047 (0.026)0.057 *** (0.012)0.066 * (0.028)0.036 * (0.014)
    Sudhurpaschim0.023 (0.024)0.046 *** (0.012)0.018 (0.023)0.040 *** (0.011)
Marginalization
    Triple disadvantage 0.032 (0.029)0.001 (0.944)0.0000.000
    Double disadvantage −0.015 (0.016)0.011 (0.007)0.071 *** (0.015)0.022 ** (0.007)
    Single disadvantage0.027 * (0.013)0.053 *** (0.009)0.076 *** (0.012)0.067 *** (0.008)
    No disadvantage0.079 ** (0.026)0.068 *** (0.017)0.082 *** (0.024)0.064 *** (0.016)
Note: SE, standard errors; * p < 0.05, ** p < 0.01, *** p < 0.001.
Table 3. Unadjusted and adjusted odds ratio of NHIP coverage among women and men.
Men (N = 4913)Women (N = 14,845)
uOR [95% CI]aOR [95% CI]uOR [95% CI]aOR [95% CI]
Marginalization
    Triple disadvantage RefRefRefRef
    Double disadvantage 2.1 [0.8, 5.2]1.6 [0.6, 4.3]1.9 *** [1.3, 2.7]1.6 * [1.1, 2.3]
    Single disadvantage3.1 * [1.3, 7.9]2.9 * [1.1, 7.6]3.9 *** [2.5, 6.1]3.3 *** [2.1, 5.3]
    No disadvantage7.0 *** [2.8, 17.6]6.4 *** [2.4, 17.0]9.9 *** [6.2, 15.7]8.0 *** [4.9, 13.2]
Residence
    UrbanRefRefRefRef
    Rural0.7 [0.5, 1.0]0.8 [0.5, 1.0]0.6 *** [0.5, 0.8]0.7 ** [0.5, 0.9]
Ecological zone
    MountainRefRefRefRef
    Hill1.0 [0.5, 1.0]0.9 [0.4, 1.9]1.2 [0.8, 1.9]0.8 [0.5, 1.4]
    Terai0.9 [0.5, 1.9]1.0 [0.4, 2.3]1.0 [0.6, 1.7]1.0 [0.5, 1.7]
Province
    KoshiRefRefRefRef
    Madhesh0.1 *** [0.1, 0.2]0.1 *** [0.1, 0.2]0.1 *** [0.1, 0.2]0.1 *** [0.1, 0.2]
    Bagmati0.3 *** [0.2, 0.5]0.2 *** [0.1, 0.4]0.5 ** [0.3, 0.8]0.3 *** [0.2, 0.5]
    Gandaki0.5 ** [0.3, 0.8]0.4 ** [0.2, 0.8]0.8 [0.5, 1.1]0.7 [0.4, 1.1]
    Lumbini0.4 *** [0.2, 0.6]0.3 *** [0.2, 0.5]0.4 *** [0.3, 0.6]0.4 *** [0.2, 0.5]
    Karnali0.5 ** [0.3, 0.8]0.5 * [0.3, 0.9]0.4 *** [0.3, 0.7]0.5 * [0.3, 0.9]
    Sudhurpaschim0.3 *** [0.2, 0.4]0.2 *** [0.1, 0.5]0.3 *** [0.2, 0.5]0.3 *** [0.1, 0.5]
*** p < 0.001, ** p < 0.01, * p < 0.05.
Disclaimer/Publisher’s Note: The statements, opinions and data contained in all publications are solely those of the individual author(s) and contributor(s) and not of MDPI and/or the editor(s). MDPI and/or the editor(s) disclaim responsibility for any injury to people or property resulting from any ideas, methods, instructions or products referred to in the content.