Abstract
Background: The prevalence of stress-related health issues is becoming increasingly significant. This study aimed to examine the relationships between work stress, home stress, overall stress, and individual behavioral and perceptual characteristics among middle-aged employees in the service sector. Methods: Physical activity, diet, and perceptions were assessed using the WellBeNet application (2.10.2, INRAE, Clermont-Ferrand, France) while perceived stress levels were evaluated through an online questionnaire during a one-week period. The associations between stress levels and individual and behavioral characteristics were examined using multiple linear regressions and analyses of variance. Results: General stress was significantly influenced by both work and home stress. Home stress was positively correlated with the perception of one’s silhouette in red, the increasing consumption of dairy products, and the decreasing consumption of vegetables. Work stress was inversely correlated with age and positively correlated with body shape. Conclusions: Our study identified various context markers of stress—including age, body shape, food intake, and color of the silhouette. These markers could be used in subsequent intervention studies to demonstrate causal links.
1. Introduction
In today’s rapidly changing and complex society, a growing number of individuals are grappling with stress-related issues [1]. Stress can have a profound impact on one’s health and can lead to physiological disorders. Therefore, by altering the functioning of the autonomic nervous system, stress disrupts the sympatho–vagal balance, heart rate, and its variability, often with lasting effects [2]. The reduction in heart rate variability is associated with cardiac events in adults; it is a risk factor for high blood pressure or stroke [2]. Stress can give rise to psychological distress, anxiety, and depression, which in turn impact one’s behavior. In the general population, psychosocial stress is linked to decreased physical activity, particularly during leisure time, and increased screen time [3]. Stress is known to heighten impulsiveness while reducing emotional, visceral, and behavioral control [4]. Prolonged stress amplifies the consumption of highly pleasurable sweet and fatty foods [5] while diminishing the intake of fruits and vegetables [6]. These behaviors serve as coping mechanisms. If this coping strategy persists, it may contribute to weight gain, obesity, and metabolic disorders [7].
Perception of stress is influenced by various factors, both individual and environmental. A study revealed that the prevalence of moderate stress was lowest among individuals aged 60–69 years, while the highest prevalence was observed in the 40–44-year age group [8]. Women between the ages of 30 and 34 reported a higher frequency of moderate stress compared to men within the same age range. Additionally, the prevalence of high stress was more common among women than men [8]. A correlation was found between stress and obesity [6]. Both work and family environments can present challenges for individuals. In the workplace, stress can arise from various sources, including career development, relationships with colleagues, and work organization [9]. Managerial and administrative workers tended to express greater satisfaction with their career positions compared to manual workers. Some professions are more stressful than others, such as those requiring the most physical or psychological efforts or those providing the least satisfaction [10]. Workers with higher education had a tendency for lower levels of perceived stress. Hard manual workers or persons with physical work had a higher risk of a high perceived level of stress compared to managerial and administrative workers in the tertiary sector [11]. The latter were more satisfied with their achieved career position than manual workers. However, employees in the tertiary sector, who typically work in an office setting, face an increased risk of experiencing high stress levels if they spend more than an additional 3 h per day in a sedentary position outside of work, which can multiply their stress levels by 3 or 4.
This cross-sectional study explored the individual characteristics, behaviors, and emotions linked to stress among employees in the tertiary sector. The purpose of the study is to first examine the relationships between general stress and stress at work and at home, then between stress and behavioral and perceptual variables, depending on the context. The study was an observational survey that was designed based on data collected remotely thanks to the participants’ smartphones and computers. The cross-sectional study was chosen because it is suited to the study of covariation relationships between stress and the large number of new variables collected using our original device, the WellBeNet application (Version 2.10.2, INRAE, Clermont-Ferrand, France). Moreover, cross-sectional studies are suitable for mature populations like ours that have reached equilibrium and are not vulnerable to transitory biases [12]. In this case, one time point can be representative of a stable state and provides relevant information on the relationships between stress, behavior, and perceptions.
2. Materials and Methods
2.1. Study Design
This study aimed to objectively assess physical activity and sedentary behaviors and subjectively assess self-reported stress levels, emotions, and food choices in a voluntary sample of tertiary employees aged 40–60 years (Figure 1). Data collection took place over one week during a working period based on the availability of participants who used their smartphones and computers remotely.
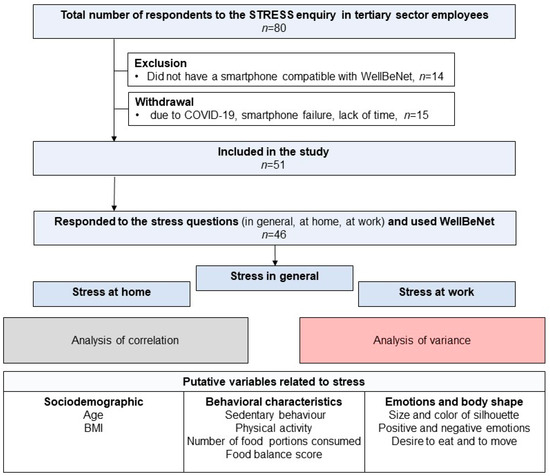
Figure 1.
Flow chart of employees’ inclusion.
2.2. Participants and Selection Process
Participants were recruited through social networks and mailing lists of the Auvergne Rhone Alpes INRAE Center and the University of Clermont Auvergne. Eighty candidates responded to the advertisement, but fourteen did not have a smartphone compatible with the WellBeNet application. Fifteen withdrew before the start of the study, because they were ill with COVID-19, had a problem with their phone, or did not have enough time to take part in the study (Figure 1). The study was conducted in accordance with the Declaration of Helsinki and approved by the Committee for the Protection of Human Subjects (Sud-Est VI, reference 2020/CE 06). Prior to completing the survey, participants provided informed consent online. Recruitment of participants began on 14 March 2022 and ended on 3 June 2022.
2.3. Main Outcome
Perceived Stress: To assess stress levels at work, at home, and in general, three visual analogue scales were used [13]. These scales consisted of horizontal continuous lines of 100 mm, ranging from “very low perceived stress” on the left to “very high perceived stress” on the right, without graduation. Participants were instructed to report their stress levels at the same time each evening throughout the week.
2.4. Secondary Outcomes
Body Mass Index (BMI): BMI (kg/m2) was calculated using self-reported height and weight provided by the participants. Participants are considered overweight when their BMI is between 25 and 30 kg/m2 and obese when their BMI is above 30.
Physical Activity: Participants were instructed to download the WellBeNet app (version 2.10.2, INRAE, Clermont-Ferrand, France) from the Play Store and provide their age and sex to the researcher. They then input their height and weight into the app and were directed to use the eMouve, NutriQuantic, and EmoSens components of the WellBeNet application (Version 2.10.2, INRAE, Clermont-Ferrand, France) for seven consecutive days. To collect accelerometry data during waking hours, participants were instructed to wear their smartphones in their pants pocket. Time spent in four activity categories (immobility, light-intensity activity, moderate-intensity activity, and vigorous-intensity activity) was calculated as a percentage of total recording time. Notably, eMouve provided accurate estimations of time spent in these categories, with minimal errors for both normal-weight and overweight subjects [14,15]. Guidoux et al. (2014) explain how the physical activity/sedentary behavior assessment algorithm was designed [16]. The absolute errors in estimating the time spent in the four activity categories (sedentary, light-, moderate-, and vigorous-intensity activity) are less than 5% compared to indirect calorimetry in normal-weight or overweight adults.
Eating behavior: NutriQuantic was used to track the number of food portions consumed during the same period, regardless of the food category. A portion estimation guide was provided to each participant, including examples of portion sizes for different food categories (Table 1). The number of portions in each category was counted, and the proportion of each category was calculated by dividing the number of portions by the total number of food portions. A nutritional score was assigned to each of the 11 food categories (alcohol, hot drink, starchy product, fruit, nut, dairy product, legume, vegetable, fatty–salty–sugary product, snack, and meat–fish–egg) based on the number of portions consumed, following French and international nutritional guidelines [17]. The assigned score ranged from 0 to 1, and a nutritional balance score for the overall diet was calculated based on confidential calculations using the food categories [18]. A nutritional score of 0 corresponds to a number of servings that is very far from the nutritional recommendations, 0.5 to a number that is slightly far from the recommendations, and 1 to a number of servings in line with the recommendations. The balance score is the sum of the individual scores.

Table 1.
Examples of food portion.
Perceptions: With EmoSens, participants assessed their body shape, physiological state (desire to eat and move), and emotions in the evening [19]. They selected one of nine silhouettes defined by Stunkard et al. (1983) that corresponded to their body shape, and colored it with one of the following hues: orange, yellow, red, gray, or white [20,21,22]. The choice of color was made spontaneously without any information about the meaning of the color. Each hue represented a different emotion or state. The color red is often associated with a high level of excitement (passion, anger, perception of danger, etc.), orange with a lower level of excitement, yellow with joy, white with a neutral emotion, and gray with sadness [23]. Participants rated their emotions using a 10-point scale based on the Geneva Wheel and scored their desire to eat and move on unstructured scales, with scores ranging from 0 to 100 [24]. For each day of recording, we calculated the mean values of positive and negative emotions. Then, we calculated the mean values of positive and negative emotions and of the two desires over the week. The proportions of color choices were calculated over the week.
All data collected by smartphones is sent anonymously to the ActivCollector server and processed anonymously [25].
2.5. Statistical Analysis
Normality of variables was tested using the Shapiro–Wilk test, quantitative data are presented as mean and SD, and qualitative data are presented as a number (%). To compare the number of executive vs. non-executive employees in each weight status taken 2 by 2, we carried out chi2 tests. A significant p-value (<0.05) indicated an association between weight status and professional category. Multiple linear regression models were used to analyze the relationships between general stress, stress at work and home, and individual and behavioral characteristics. Results of linear regressions were expressed as r2, and regression coefficients with their 95% confidence intervals were shown. The SAS proc REG with the stepwise option was used (Version 9.4, SAS Institute, Cary, USA). For variables that exhibited a normal distribution, differences between levels of perceived stress (low, medium, and high) were assessed using analysis of variance (GLM procedure of SAS). Non-normally distributed variables were examined using Cochran–Mantel–Haenszel statistics (cmh) for differences in row mean ranks (FREQ procedure of SAS). A significant p-value (<0.05) indicated a strong association between stress level and variable value, while a p-value between 0.05 and 0.10 indicated a trend. For variables indicating which differences between stress levels were found to be significant, multiple mean comparison tests (LSMEANS) were conducted for normally distributed variables. In the case of non-normally distributed variables, differences between the low and medium stress levels, medium and high stress levels, and low and high stress levels were examined using Cochran–Mantel–Haenszel statistics. Furthermore, effect size (ES) was calculated using Hedges’ g equation (Equation(1), [26]):
where F1 and F2 represent two stress levels among the three (low, medium and high), and SDpooled is the pooled standard deviation.
3. Results
3.1. Participant Characteristics
A total of 51 participants (41 women and 10 men) were included in the study (Figure 1). The sample had a notably lower representation of men. The average age of the participants was 48 years. Among them, 24 participants were classified as being of normal weight, 15 were categorized as overweight, and 12 were classified as obese (Table 2). All have intellectual office jobs without significant physical activity. Twenty of them are executive and thirty-one are non-executive employees. A one-way analysis of variance does not show differences in age depending on weight status (F = 1.02, p = 0.37). Chi-square tests show that the number of executive employees was slightly higher among normal-weight individuals than among overweight individuals (χ2 = 2.83, p = 0.09) or obese volunteers (χ2 = 2.75, p = 0.09). There was no difference in the number of executive and non-executive employees among overweight and obese volunteers (χ2 = 0.01, p = 0.92). However, it is important to note that six of the fifty-one participants did not complete the stress questionnaire (five women and one man).
Table 2.
Description of the volunteer sample.
3.2. Perceived Stress
The mean (SD) values of perceived general, work, and home stress were 30.5 (17.5), 31.2 (20.7), and 21.2 (16.6), respectively (Figure 2). The mean values of general and work stress were similar and higher than the mean home stress value. There was significant variability in stress levels around these means, enabling us to categorize participants into three groups of equal size.
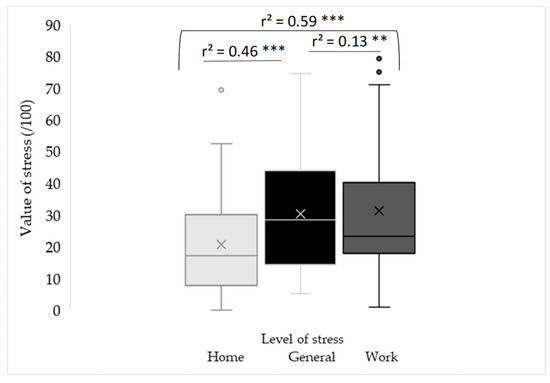
Figure 2.
Distribution of stress values and contribution of stress at home and at work to stress in general (whisker chart). X: mean value, °: outlier, lower and upper lines outside the box: minimum and maximum data, excluding outliers, lower and upper lines in the box: 25th and 75th percentiles, line in the box: median (50th percentile). Level of significance: **: p < 0.01, ***: p < 0.001.
The 95% confidence intervals of regression coefficients are [1.1 to 14.8], [0.3 to 0.8], and [0.1 to 0.5] for the intercept and the coefficients associated with stress at home and stress at work (Equation (2)).
3.3. Linear Relationships of Correlation Between Perceived Stress and Individual, Behavioral, and Emotional Characteristics
The multiple regression model shows that general stress was explained by two components of stress, home stress (r2 = 0.46, p < 0.0001) and work stress (r2 = 0.13, p = 0.0006), with a total explanation of 59% (p < 0.0001, Figure 2, Equation (2)). These two components were partly dependent (r2 = 0.13, p = 0.01) and associated with different variables. In a multiple regression model for explaining home stress, two emotional variables and two variables related to diet were relevant (r2 = 0.41, p = 0.0002; Equation (3), Figure 3). Choosing the color red instead of orange for one’s silhouette was indicative of high levels of home stress (r2 = 0.22, p = 0.001). Consuming fewer vegetable portions (r2 = 0.09, p = 0.02) and a higher percentage of dairy products (r2 = 0.07, p = 0.04) were also features associated with high levels of home stress.
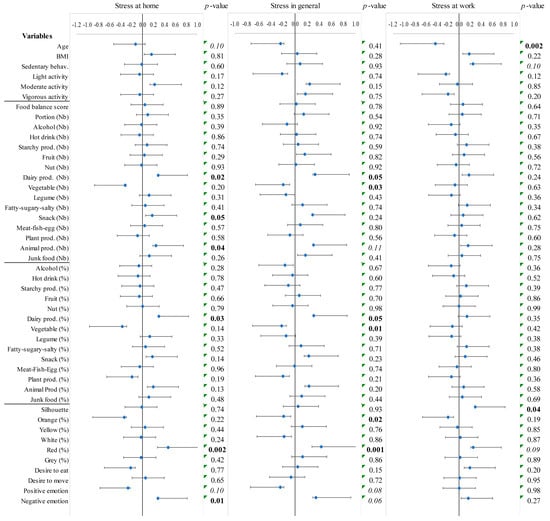
Figure 3.
Linear relationships between stress and individual, behavioral, and emotional characteristics. Coefficients of correlation and their 95% confidence intervals. p-values in bold indicate a probability lower than 0.05, those in italics indicate a trend with a probability lower than or equal to 0.10.
The 95% confidence intervals of regression coefficients are , , and for the intercept, the coefficients associated with the percentage of dairy products, the number of vegetable portions, and the orange and red shades used to color the silhouettes (Equation (3)).
In a third regression model, work stress was explained by two complementary individual variables (r2 = 0.26, p = 0.002; Equation (4)). Being younger and perceiving one’s silhouette as overweight were associated with high levels of work stress (r2 = 0.19, p = 0.003, r2 = 0.07, p = 0.06, respectively; Equation (4), Figure 3).
The 95% confidence intervals of regression coefficients are , for the intercept, and the coefficients associated with age and silhouette (Equation (4)).
3.4. Effect of Home Stress Level on Individual, Behavioral, and Emotional Characteristics
Analyses of variance revealed significant effects of home stress on six variables: moderate-intensity physical activity, the number and proportion of vegetable portions, the desire to eat, and proportions of orange and red chosen to color body silhouettes (Table 3). When comparing low and high home stress levels, large ES were observed for the number of vegetable portions and the proportion of orange-colored silhouettes. Moderate ES were found for moderate-intensity physical activity, proportion of red-colored silhouettes, and proportion of vegetables. Participants in the low-stress group engaged in less physical activity, consumed a greater number of vegetable portions, and had a higher proportion of orange-colored silhouettes and a lower proportion of red-colored silhouettes compared to the high-stress group. The ES between low and medium home stress for eating desire was large, with participants in the low-stress group expressing less desire to eat than the medium-stress group. Comparing medium and high home stress levels, large ES were observed for the proportion of orange-colored silhouettes, desire to eat, and number and proportion of vegetables. The ES was medium for the proportion of red-colored silhouettes. Medium-stress participants chose orange more often, had a greater desire to eat, consumed more vegetables, and had a higher proportion of orange-colored silhouettes compared to high-stress participants.
Table 3.
Mean comparison of individual, behavioral, and emotional characteristics between the three home stress levels in a sample of French tertiary sector employees.
3.5. Effect of Work Stress Level on Individual, Behavioral, and Emotional Characteristics
The level of work stress had significant effects on six variables: age, number of alcohol and dairy product portions, proportion of orange-colored silhouettes, positive emotions, and proportion of vegetables in the diet (Table 4). Large ES were observed between low and high work stress levels for age, number of alcohol portions, proportion of orange-colored silhouettes, and proportion of vegetables. The ES was medium for the number of dairy product portions. Participants in the low-stress group were older, consumed fewer dairy product portions, had a higher proportion of vegetables, and chose the orange silhouette more often compared to the high-stress group. Comparing low and medium work stress levels, large ES were observed for positive emotions and proportion of vegetables, and a medium ES for orange-colored silhouettes. The low-stress group experienced more intense positive emotions, consumed a higher percentage of vegetables, and chose a higher proportion of orange-colored silhouettes compared to the medium-stress group. Comparing medium and high work stress levels, the ES was large for age and medium for the number of dairy product portions, orange-colored silhouettes, and positive emotions. Participants with medium stress were older, consumed fewer dairy product servings, had a higher proportion of orange-colored silhouettes, and experienced less intense positive emotions compared to the high-stress group.
Table 4.
Mean comparison of individual, behavioral, and emotional characteristics between the three work stress levels in a sample of French tertiary sector employees.
4. Discussion
Home stress was found to be the primary contributor to general stress, followed by work stress. Stress levels can vary depending on the context, with higher levels of stress often experienced at work compared to home or vice versa. In this study, on average, stress levels were lower at home. However, there was a correlation between the two types of stress. Previous research has found a positive correlation between job stress and home stress [27]. A meta-analysis also showed that employees with greater job stress, lower job control, and limited support experienced more interference between work and family life [28]. Work-related stressors can spill over into family life, while home-related stressors can disrupt work.
4.1. Home Stress
There was a positive correlation between home stress and the proportion of red-colored silhouettes as well as the consumption of dairy products, while an inverse correlation was found with the proportion of orange-colored silhouettes and the consumption of vegetables. The relationship between color and emotion has been established. Red is associated with both positive and negative concepts, while other colors like blue or pink are less commonly associated with negative concepts [29]. Red is known to be associated with sexual attractiveness, passion, love, danger, and aggression. Additionally, red can also be associated with anger. Therefore, it is reasonable to expect that individuals who experienced high levels of stress may opt for a red-colored silhouette to represent themselves. This choice is consistent with the perception that red signifies heightened arousal and a perception of aggression when faced with challenges that surpass one’s coping ability. Orange represents an exciting emotion, albeit with less intensity compared to red, and yellow is milder and more pleasant than orange. Gray is often associated with feelings of sadness, shame, or fear.
Vegetable consumption, desire to eat, orange and red silhouettes, and physical activity were found to differentiate the three levels of home stress. The ES for vegetable consumption was large, with low or moderate stress levels being associated with higher vegetable consumption compared to high-stress levels. Increased consumption of vegetables, which are rich in antioxidants and folate, may contribute to reducing stress levels and protecting against mental illness [30]. On the contrary, chronic perceived stress can also impact eating behaviors, leading to increased consumption of sweet and salty snacks and caffeinated drinks, as well as reduced intake of vegetables and fruits [28]. The desire to eat was significantly greater among participants with medium home stress compared to the other two groups. This finding is consistent with previous research [31] that indicated that individuals with moderate stress tend to maintain a general desire for food even after experiencing stress, whereas the high-stress group had less desire for food and showed signs of anhedonia, i.e., difficulty perceiving one’s own emotions. The moderate stress group also had a greater desire to eat compared to the low-stress group. People with a high level of self-control tend to experience less stress, lower levels of desire, and less goal conflict, indicating an anticipatory coping strategy to avoid problematic situations [32]. There were large and moderate ES for orange and red silhouettes between low, moderate, and high stress levels. Hence, lower levels of stress were correlated with a higher proportion of orange silhouettes and a lower proportion of red silhouettes. As observed before, the color red is linked to high stress. The high-stress home group engaged in more moderate-intensity physical activity than the low-stress group. However, it has been demonstrated that perceived stress tends to decrease when individuals are engaged in vigorous or moderate-intensity physical activity, highlighting their potential positive impact on stress reduction [33]. Household activities, which fall into the moderate physical activity class, may contribute to home-related stress if they are perceived as laborious or mentally burdensome [34].
4.2. Work Stress
The evaluation of work stress revealed significant differences in age, alcohol consumption, positive emotions, and tendencies related to the consumption of dairy products, the proportion of consumed vegetables, and the proportion of orange-colored silhouettes. The participants with low and moderate stress levels were found to be older than the highly stressed group, which is consistent with previous studies indicating that younger employees tend to experience greater work stress [8,35]. In the predominantly female sample of this study, highly and moderately stressed participants consumed less alcohol compared to the low-stress group, which is consistent with the lower level of alcohol problems observed in stressed women due to higher levels of social support [36]. The ES for the dairy product proportion was moderate between low, moderate, and high home stress levels. The most stressed people at work consumed more dairy products than the other participants, probably for the calming effect of substances derived from milk. Dairy product intake influences stress and mental health [37]. Furthermore, individuals in the low and high work-related stress groups reported experiencing positive emotions more intensely. It has been established that higher levels of stress are positively associated with negative emotions and negatively associated with positive affect [38]. In our study, high levels of stress were also associated with positive emotions. Folkman and Moskowitz (2004) reported that negative and positive emotions can co-occur throughout the stress process [39]. Viney et al. (1989) found a co-occurrence of positive and negative emotions in a sample of chronically ill men [40]. Although the negative emotions were more frequent in the chronically ill groups when compared to a healthy control group, the positive emotion of enjoyment was also more frequent in the chronically ill groups.
In line with the findings regarding home stress, the low work stress group exhibited higher proportions of vegetables and orange-colored silhouettes. This indicates a similar association between stress level and vegetable consumption and the preference for the color orange in both home and work, highlighting their potential importance across different environments. Consumption of fatty–salty–sugary products in the present study, which are often palatable, was not higher among stressed employees than among those with low stress levels, either at home or at work. This result was not consistent with other studies that have found a positive association between stress and consumption of palatable foods. Instead of palatable foods, it was the proportion of dairy products in the diet that tended to be higher among employees who were stressed at work. Two hypotheses can be put forward to explain this result: employees are aware of the dangers of consuming fatty–salty–sugary products, and dairy products may have beneficial effects on mood.
Despite providing novel findings, this study has limitations. The volunteers come from a voluntary, non-randomized sample. The male/female and normal weight/overweight/obese ratios were not balanced. As height and weight were self-reported, they may not be entirely reliable. The cross-sectional nature of the data limits our ability to establish causal relationships, and larger and more balanced samples in terms of gender and weight status could provide clearer effects.
5. Conclusions
Both stress at home and at work contributed to stress in general, with a greater contribution from stress at home than at work. Different behavioral and perceptual variables were associated with one or another location where stress was evaluated. Certain foods and emotions were linked to stress recorded at home, while individual characteristics were associated with stress at work. These variables can result from stress, lead to a reduction in stress, or reinforce the perception of stress. The participants in our study who see themselves more frequently in red and those who consume more dairy products in their diet but fewer servings of vegetables than the other participants are more at risk of suffering from stress at home. Age seems to be protective, while high body fat is a marker of stress at work. Younger people who are overweight or obese may be more at risk of suffering work-related stress. However, our cross-sectional study is unable to establish causal conclusions regarding the impact of stress on behavior and perceptions due to the absence of temporal elements in the design, as well as the fact that the presumed cause was not assessed before the hypothesized effect.
To investigate deeper into the causal relationship, such as that between a diet abundant in naturally antioxidant-rich vegetables and the reduction in stress, it would be necessary to undertake an intervention study spanning several months. This study would involve the regular measurement of stress before, during, and after the intervention.
Author Contributions
Conceptualization, S.R., F.D. and P.L.; methodology, G.B. and C.B.; software, P.L.; validation, S.R., F.D. and G.B.; formal analysis, S.R.; investigation, C.B. resources, P.L.; data curation, S.R.; writing—original draft preparation, S.R.; writing—review and editing, F.D., P.L. and G.B.; visualization, S.R.; supervision, F.D.; project administration, P.L. All authors have read and agreed to the published version of the manuscript.
Funding
This research received no external funding.
Institutional Review Board Statement
The study was conducted in accordance with the Declaration of Helsinki and approved by the Institutional Review Board of Sud-Est VI, reference 2020/CE.
Informed Consent Statement
Informed consent was obtained from all subjects involved in the study.
Data Availability Statement
The data presented in this study are available from the corresponding author upon reasonable request.
Acknowledgments
The authors thank the employees who participated in this study. They also thank Gail Wagman for proofreading this paper.
Conflicts of Interest
The authors declare no conflicts of interest.
References
- Leonidis, A.; Korozi, M.; Sykianaki, E.; Tsolakou, E.; Kouroumalis, V.; Ioannidi, D.; Stavridakis, A.; Antona, M.; Stephanidis, C. Improving stress management and sleep hygiene in intelligent homes. Sensors 2021, 21, 2398. [Google Scholar] [CrossRef] [PubMed]
- Marsac, J. Heart rate variability: A cardiometabolic risk marker with public health implications. Bulletin de l’Académie Nationale de Médecine 2013, 197, 175–186. [Google Scholar] [CrossRef] [PubMed]
- St-Pierre, M.; Sinclair, I.; Elgbeili, G.; Bernard, P.; Dancause, K.N. Relationships between psychological distress and health behaviors among Canadian adults: Differences based on gender, income, education, immigrant status, and ethnicity. SSM-Popul. Health 2019, 7, 100385. [Google Scholar] [CrossRef]
- Sinha, R. Chronic stress, drug use, and vulnerability to addiction. Ann. N. Y. Acad. Sci. 2008, 1141, 105–130. [Google Scholar] [CrossRef]
- Laugero, K.D.; Falcon, L.M.; Tucker, K.L. Relationship between perceived stress and dietary an activity patterns in older adults participating in the Boston Puerto Rican health study. Appetite 2011, 56, 194–204. [Google Scholar] [CrossRef]
- Ellis, E.M.; Orom, H.; Giovino, G.A. Relations between negative affect and health behaviors by race/ethnicity: Differential effects for symptoms of depression and anxiety. Health Psychol. 2015, 34, 966–969. [Google Scholar] [CrossRef]
- Sinha, R.; Jastreboff, A.M. Stress as a common risk factor for obesity and addiction. Biol. Psychiatry 2013, 73, 827–835. [Google Scholar] [CrossRef]
- Bergdahl, J.; Bergdahl, M. Perceived stress in adults: Prevalence and association of depression; anxiety and medication in a Swedish population. Stress Health 2002, 18, 235–241. [Google Scholar] [CrossRef]
- Nash, J.M.; Thebarge, R.W. Understanding psychological stress, its biological processes, and impact on primary headache. Headache 2006, 46, 1377–1386. [Google Scholar] [CrossRef]
- Winwood, P.C.; Lushington, K. Disentangling the effects of psychological and physical work demands on sleep, recovery and maladaptative chronic stress outcomes with a large sample of Australian nurses. J. Adv. Nurs. 2006, 56, 679–689. [Google Scholar] [CrossRef]
- Dėdelė, A.; Miskinyté, A.; Andrusaityté, S.; Bartkuté, Z. Perceived stress among different occupational groups and the interaction with sedentary behaviour. Int. J. Environ. Res. Public Health 2019, 16, 4595. [Google Scholar] [CrossRef]
- Spector, P.E. Do not cross me, optimizing the use of cross-sectional designs. J. Bus. Psychol. 2019, 34, 125–137. [Google Scholar] [CrossRef]
- Langevin, V.; Boini, S.; François, M.; Riou, A. Echelle visuelle analogique EVA. Références en santé au travail. Ref. Santé Trav. 2012, 130, 167–169. [Google Scholar]
- Rousset, S.; Guidoux, R.; Paris, L.; Farigon, N.; Miolanne, M.; Lahaye, C.; Duclos, M.; Boirie, Y.; Saboul, D. A novel smartphone accelerometer application for low-intensity activity and energy expenditure estimations in overweight and obese adults. J. Med. Syst. 2017, 41, 117. [Google Scholar] [CrossRef]
- Guidoux, R.; Duclos, M.; Fleury, G.; Lacomme, P.; Lamaudière, N.; Saboul, D.; Ren, L.; Rousset, S. The eMouveRecherche application competes with research devices to evaluate energy expenditure; physical activity and still time in free-living conditions. J. Biomed. Inform. 2017, 69, 128–134. [Google Scholar] [CrossRef]
- Guidoux, R.; Duclos, M.; Fleury, G.; Lacomme, P.; Lamaudière, N.; Manenq, P.-H.; Paris, L.; Ren, L.; Rousset, S. A smartphone-driven methodology for estimating physical activities and energy expenditure in free living conditions. J. Biomed. Inform. 2014, 52, 271–278. [Google Scholar] [CrossRef]
- Hercberg, S.; Chat-Yung, S.; Chaulia, M. The French National Nutrition and Health Program; 2001–2006–2010. Int. J. Public Health 2008, 53, 68–77. [Google Scholar] [CrossRef]
- Cissoko, J.; Boirie, Y.; Duclos, M.; Fardet, A.; Guidoux, R.; Paris, L.; Phan, R.; Ren, L.; Rousset, S. NutriQuantic: A smartphone application to determine the adequacy of food intake to nutritional requirements. In Proceedings of the 6èmes Journées Ouvertes en Biologie; Informatique & Mathématiques, Clermont-Ferrand, France, 6–9 January 2015. [Google Scholar]
- Belmahjoub, M. Développement d’une Application Mobile Pour Evaluer L’impact des Emotions sur le Comportement Alimentaire. Institut Supérieur d’Informatique, de Modélisation et Leurs Applications; Filière Systèmes d’Information et Aide à la Décision: Clermont-Ferrand, France, 2017. [Google Scholar]
- Stunkard, A.J.; Sorenson, T.; Schulsinger, F. Use of the Danish Adoption Register for the study of obesity and thinness. In The Genetics of Neurological and Psychiatric Disorders; Kety, S.S., Rowland, L.P., Sidman, R.L., Matthysse, S.W., Eds.; Raven Press: New York, NY, USA, 1983; pp. 115–120. [Google Scholar]
- Parzer, V.; Sjöholm, K.; Brix, J.M.; Svensson, P.-A.; Ludvik, B.; Taube, M. Development of a BMI-assigned Stunkard scale for the evaluation of body image perception based on data of the SOS reference study. Obes. Facts 2021, 14, 397–404. [Google Scholar] [CrossRef]
- Nummenmaa, L.; Glerean, E.; Hari, R.; Hietanen, J.K. Bodily maps of emotions. Proc. Natl. Acad. Sci. USA 2014, 11, 646–651. [Google Scholar] [CrossRef]
- Fugate, J.M.B.; Franco, C.L. What color is your anger? Assessing color-emotion pairings in English speakers. Front. Psychol. 2019, 10, 206. [Google Scholar] [CrossRef]
- Scherer, K.R. What are emotions? And how can they be measured? Soc. Sci. 2005, 44, 695–729. [Google Scholar] [CrossRef]
- ActivCollector. Available online: https://activcollector.clermont.inra.fr (accessed on 25 March 2014).
- Hedges, L.V. Estimation of effect size from a series of independent experiments. Psychol. Bull. 1982, 92, 490–499. [Google Scholar] [CrossRef]
- Fan, L.B.; Blumenthal, J.A.; Watkins, L.L.; Sherwood, A. Work and home stress: Associations with anxiety and depression symptoms. Occup. Med. 2015, 65, 110–116. [Google Scholar] [CrossRef] [PubMed]
- Byron, K. A meta-analytic review of work-family conflict and its antecedents. J. Vocat. Behav. 2005, 67, 169–198. [Google Scholar] [CrossRef]
- Jonauskaite, D.; Dael, N.; Chèvre, L.; Althaus, B.; Tremea, A.; Charalambides, L.; Mohr, C. Pink for girl; red for boy; and blue for both genders: Colour preferences in children and adults. Sex Roles 2018, 80, 630–642. [Google Scholar] [CrossRef]
- Opie, R.S.; Itsiopoulos, C.; Parletta, N.; Sanchez-Villegas, A.; Akbaraly, T.N.; Ruusunen, A.; Jacka, F.N. Dietary recommendations for the prevention of depression. Nutr. Neurosci. 2017, 20, 161–171. [Google Scholar] [CrossRef]
- Hyldelund, N.B.; Frederiksen, C.; Byrne, D.V.; Andersen, B.V. Is stress taking the pleasure out of food? A characterization of the food pleasure profiles; appetite; and eating behaviors of people with chronic stress. Foods 2022, 11, 1980. [Google Scholar] [CrossRef]
- Hofmann, W.; Baumeister, R.F.; Förster, G.; Vohs, K.D. Everyday temptations: An experience sampling study of desire, conflict, and self-control. J. Pers. Soc. Psychol. 2012, 102, 1318–1335. [Google Scholar] [CrossRef]
- Kim, W.-K.; Chung, W.-C.; Oh, D.-J. The effects of physical activity and sedentary time on the prevalence rate of metabolic syndrome and perceived stress in Korean adults. J. Exerc. Rehabil. 2019, 15, 37–43. [Google Scholar] [CrossRef]
- Eek, F.; Axmon, A. Gender inequality at home is associated with poorer health for women. Scand. J. Public Health 2015, 43, 176–182. [Google Scholar] [CrossRef]
- Hsu, H.C. Age differences in work stress, well-being, and related factors from an ecological perspective. Int. J. Environ. Res. Public Health 2019, 16, 50. [Google Scholar] [CrossRef]
- Sacco, P.; Bucholz, K.K.; Harrington, D. Gender differences in stressful life events, social support, perceived stress, and alcohol use among older adults: Results from a national survey. Subst. Use Misuse 2014, 49, 456–465. [Google Scholar] [CrossRef]
- Ano, Y.; Kita, M.; Kitaoka, S.; Furuyashiki, T. Leucine-histidine dipeptide attenuates microglial activation and emotional disturbances induced in brain inflammation and repeated social defeat stress. Nutrients 2019, 11, 2161. [Google Scholar] [CrossRef]
- Bijttebier, P.; Raes, F.; Vasey, M.W.; Feldman, G.C. Responses to positive affect predict mood symptoms in children under conditions of stress: A prospective study. J. Abnorm. Child Psychol. 2012, 40, 381–389. [Google Scholar] [CrossRef]
- Folkman, S.; Moskowitz, J.T. Coping: Pitfalls and promise. Ann. Rev. Psychol. 2004, 55, 745–774. [Google Scholar] [CrossRef]
- Viney, L.L.; Henry, R.; Walker, B.M.; Crooks, L. The emotional reactions of HIV antibody positive men. Br. J. Psychol. 1989, 62, 151–161. [Google Scholar] [CrossRef] [PubMed]
Disclaimer/Publisher’s Note: The statements, opinions and data contained in all publications are solely those of the individual author(s) and contributor(s) and not of MDPI and/or the editor(s). MDPI and/or the editor(s) disclaim responsibility for any injury to people or property resulting from any ideas, methods, instructions or products referred to in the content. |
© 2025 by the authors. Licensee MDPI, Basel, Switzerland. This article is an open access article distributed under the terms and conditions of the Creative Commons Attribution (CC BY) license (https://creativecommons.org/licenses/by/4.0/).