Article

Respiratory Health Impacts of Outdoor Air Pollution and the Efficacy of Local Risk Communication in Quito, Ecuador

1
Marron Institute of Urban Management, New York University, Brooklyn, NY 11201, USA
2
Department of Environmental Medicine, New York University Grossman School of Medicine, New York, NY 10010, USA
3
Secretaría de Ambiente del Distrito Metropolitano de Quito, Quito 170138, Ecuador
4
Department of Population Health, New York University Grossman School of Medicine, New York, NY 10016, USA
*
Author to whom correspondence should be addressed.
Int. J. Environ. Res. Public Health 2023, 20(14), 6326; https://doi.org/10.3390/ijerph20146326
Submission received: 21 February 2023 / Revised: 27 June 2023 / Accepted: 4 July 2023 / Published: 8 July 2023
(This article belongs to the Special Issue Environmental Health in Latin America and the Caribbean)

Abstract

:
Relatively few studies on the adverse health impacts of outdoor air pollution have been conducted in Latin American cities, whose pollutant mixtures and baseline health risks are distinct from North America, Europe, and Asia. This study evaluates respiratory morbidity risk associated with ambient air pollution in Quito, Ecuador, and specifically evaluates if the local air quality index accurately reflects population-level health risks. Poisson generalized linear models using air pollution, meteorological, and hospital admission data from 2014 to 2015 were run to quantify the associations of air pollutants and index values with respiratory outcomes in single- and multi-pollutant models. Significant associations were observed for increased respiratory hospital admissions and ambient concentrations of fine particulate matter (PM2.5), ozone (O3), nitrogen dioxide (NO2), and sulfur dioxide (SO2), although some of these associations were attenuated in two-pollutant models. Significant associations were also observed for index values, but these values were driven almost entirely by daily O3 concentrations. Modifications to index formulation to more fully incorporate the health risks of multiple pollutants, particularly for NO2, have the potential to greatly improve risk communication in Quito. This work also increases the equity of the existing global epidemiological literature by adding new air pollution health risk values from a highly understudied region of the world.

1. Introduction

According to the World Health Organization (WHO), air pollution (both household and outdoor) is the largest environmental threat to human health, associated with 7.4 million premature deaths every year. Low- and middle-income countries experience greater exposure to unhealthy levels of air pollution compared to the global average [1]. However, not all global regions experience the same concentrations or composition of outdoor air pollution. For example, the concentrations and mixtures of outdoor air pollution in Latin America might be distinct from North America, Europe, and Asia due to different natural and anthropogenic sources of air and different meteorological and topographic features. Similarly, the health response of the general public may be modified due to differences in baseline health conditions, cultural or socioeconomic differences affecting exposure pathways, or distinct genetic makeup. Unfortunately, there are few studies about air quality and health in Latin America to demonstrate any such distinctions [2,3].
This study will address these issues by performing a health analysis in Quito, the capital city of Ecuador, to determine local associations between air pollution and respiratory hospitalization data. Quito is a valley city surrounded by mountains, increasing the risk of temperature inversions, which, coupled with decades of fast population growth, have made the city highly susceptible to elevated air pollution episodes [4]. Vehicle emissions are of particular concern, driven by high-sulfur fuels and an increasing demand for private transportation [5]. However, recent air quality control efforts have resulted in improved air quality measured by local monitoring stations. In fact, the literature available suggests that air pollution levels may be lower in Latin America than in Europe, Asia, and North America. In some of the most polluted parts of Latin America, satellite-derived data demonstrate long-term trends of decreasing NO2 levels [6]. In Ecuador specifically, WHO’s Ambient Air Pollution in Cities database reports that Quito has relatively good air quality compared to other cities in the country and to other major cities in Latin America and around the world in terms of the annual mean concentration of fine particulate matter [7]. This is supported by data in Figure 1 showing satellite-derived NO2 data trends for the cities of Quito and Guayaquil in Ecuador from 2005 to 2020 [8]. While the concentrations of certain air pollutants in some major cities in South America have decreased since 2010, the region still consistently exceeds the WHO guidelines and national standards [9].
Many countries with varying levels of air quality choose to communicate current air pollution conditions to the public using air quality indices, which encourage individuals to modify their behavior in ways that reduce unhealthy air pollution exposures. Changes in behavior in response to index alerts have been observed in numerous studies [10,11,12]. However, traditional risk communication tools, such as the U.S. Air Quality Index (AQI), are designed to highlight days where pollution levels are above regulatory levels and are, therefore, limited in capturing the risks associated with lower levels of air pollution. As air quality has been improving in some regions, strong evidence suggests that even air pollution below standard regulatory levels is associated with increased health risk [13,14,15].
Efforts have been made in many countries to develop health-based indices for use as communication tools to the public [16,17,18,19]. Studies have evaluated these indices and found that health-based indices in general represent health outcomes more accurately than existing air quality indices [16,20,21]. Respiratory morbidity has improved through the awareness and utilization of the Air Quality Health Index (AQHI) in Canada [22], and a study in Shanghai found that an air quality health index, compared with the existing air pollution index (API), shows much stronger associations with health outcomes and therefore provides a more effective tool to communicate the air pollution-related health risks to the public [16]. Recently, Mexico City also created and validated a multi-pollutant, health-based air quality index, which is currently in use to communicate daily health risks to the public [23].
The Municipality of the Metropolitan District of Quito (MDMQ) has designed a numerical index, Quito’s Air Quality Index (IQCA), which is communicated to the public every day in order to guide individual behavior modification decisions and reduce the public health burden attributable to air pollution exposures. The IQCA is generated by converting the measured concentrations of air pollutants to a common numerical and color scale for all pollutants, with specific ranges tied to different impacts on human health. However, this index has never been evaluated for its ability to accurately capture the overall health risk to the Quito population. The need for a validation of air quality messaging using local health data has been recommended by leading experts at the American Thoracic Society [24], and directly informs the design of the present study.
The purpose of this work is two-fold: First, it evaluates the association between respiratory health risks and outdoor air pollution in Quito. Second, it assesses whether population-level respiratory health risks, the health outcome most likely to drive individual behavior modification decisions [25,26,27], are associated with the IQCA values communicated daily to those living in Quito. This work not only benefits Quito directly by providing location-specific risk values and communication improvements, but increases global health research equity by adding new air pollution health risk values to the limited epidemiological literature conducted in Latin America.

2. Materials and Methods

2.1. Exposure Data

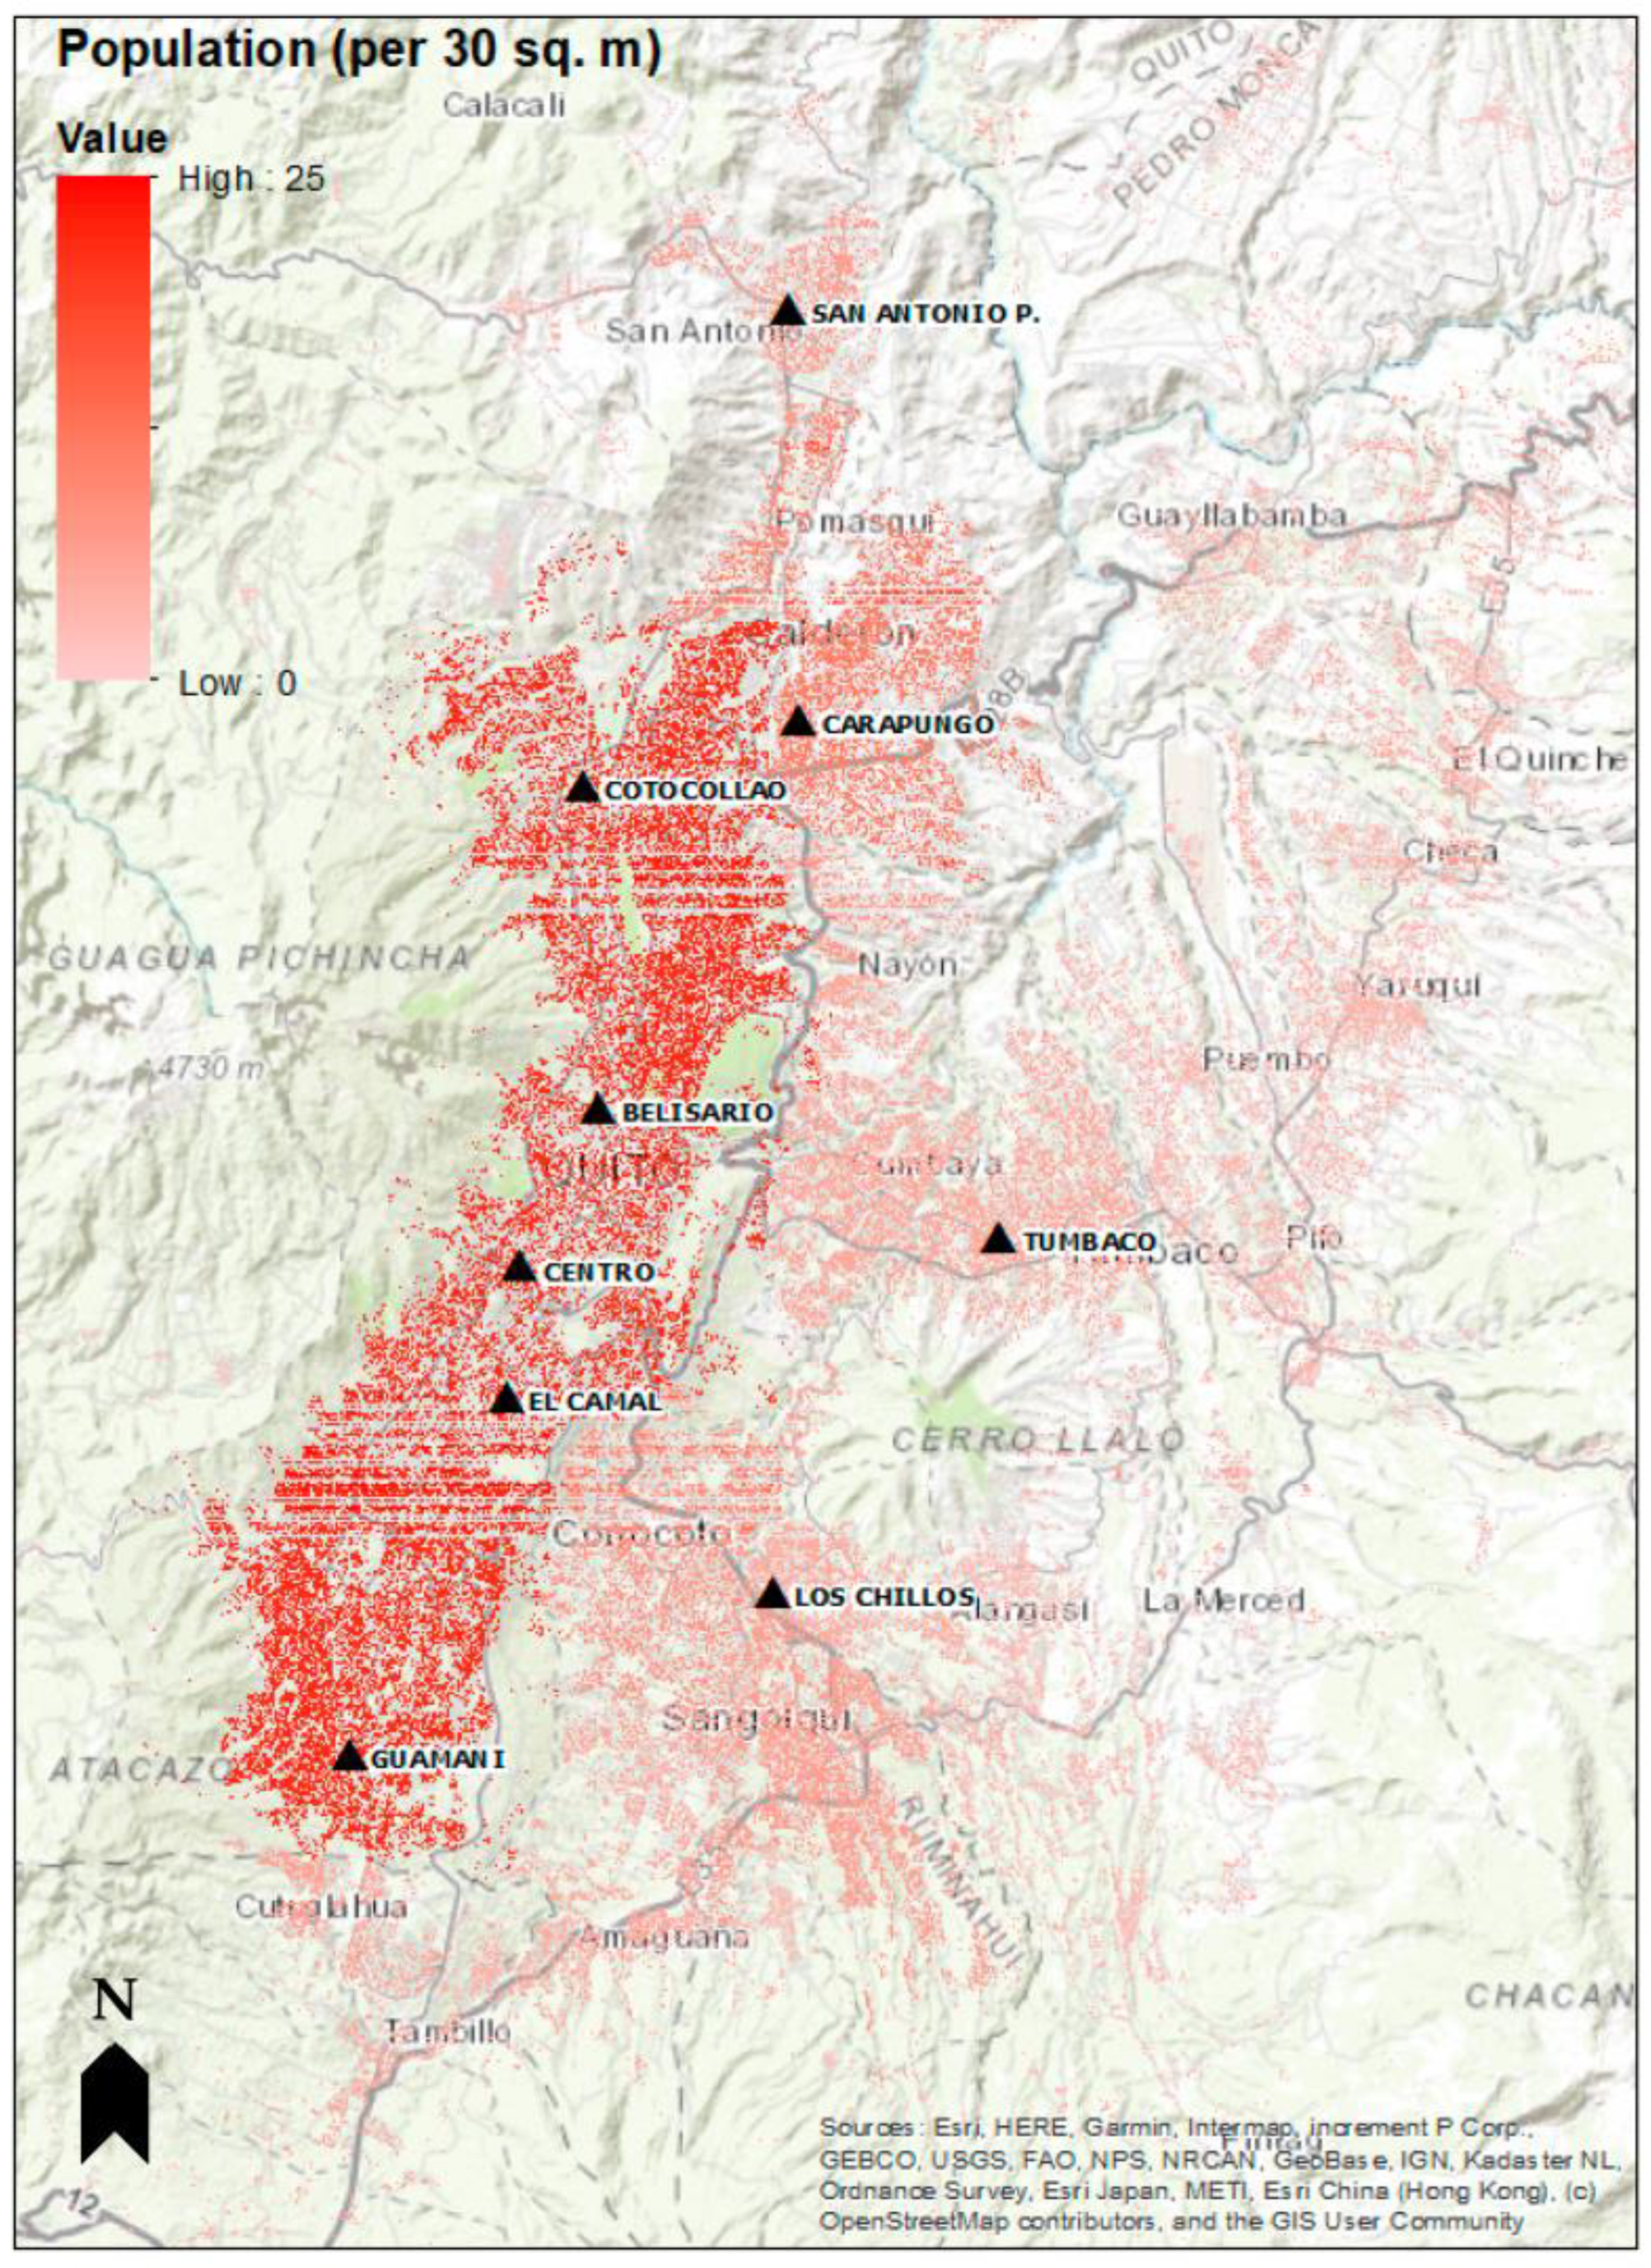
Hourly air pollution data in Quito for the years 2014–2015 were obtained for all 9 monitoring stations from Quito’s Atmospheric Monitoring Metropolitan Network (REMMAQ) (see Figure 2). The individual pollution variables were aggregated into daily exposure variables, at health-relevant averaging times: 24 h average for PM2.5 (µg/m3), 8 h maximum average for ground-level O3 (ppb), 1 h maximum for NO2 (ppb), and 24 h average for SO2 (ppb). We handled the missing data through multivariate imputation by chained equations (MICE) using predictive mean matching [28]. Guidance from in-country environmental officials aided the selection of monitoring stations that best represent daily levels in the region. Correlation coefficient cut-off values were used as inclusion criteria of monitoring stations for data imputation. The cut-point values for each pollutant are: 0.6 for PM2.5 and O3 and 0.4 for SO2 and NO2. All imputations were completed using R.
Hourly meteorological data were also obtained from REMMAQ stations and aggregated into 24 h average variables. These were used in the analysis to control for the effects of temperature and relative humidity, which have known associations with both respiratory health outcomes and daily pollution concentrations [29,30,31]. Descriptive statistics of air pollution and meteorological variable concentrations in Quito over our 2-year study period are shown in Table A1.
The IQCA (highest daily index value from either PM2.5 or O3) is published online every day as guidance for the general population to modify their daily activities. The IQCA is a numerical scale between 0 and 500, with intermediate ranges expressed in different colors. The higher the IQCA value, the greater the level of air pollution and, consequently, the greater the health concern. The daily IQCA values for all air pollutants were calculated from daily concentrations of corresponding pollutants using equations from the technical document provided by the MDMQ (see Table 1).

2.2. Health Data

Hospital admission data for the years 2014–2015 for respiratory diseases in Quito were obtained from city managers, with air-pollution-relevant diagnostic codes kept in order to determine the associations of short-term pollution exposure and acute respiratory morbidity in Quito. The included diagnostic codes met the following ICD-10 definitions: acute upper respiratory infections, excluding the common cold (J01–06); pneumonia, unspecified organism (J18); other acute lower respiratory infections (J20–J22); other diseases of the upper respiratory tract (J30–J39); chronic lower respiratory disease, including COPD and asthma (J40–J47); other respiratory diseases principally affecting the interstitium (J80–J84); suppurative and necrotic conditions of the lower respiratory tract (J86); and other diseases of the pleura (J90, J92–J94). More recent years of health data through 2020 were available for analysis but were held back at the request of in-country collaborators in order to have independent data available for evaluation and validation of potential modifications to their air quality index as part of future work.
After screening with our inclusion criteria, there were a total of 19,966 respiratory hospital admissions during the study period. Daily hospital admission counts were calculated for age groups 0–17 years (children), 18–64 years (adults), 65+ years (elderly), and a combined category of all ages. The descriptive statistics by age group and year are shown in Table A2.

2.3. Model Design

Poisson generalized linear models were used to assess the associations of individual air pollutants with respiratory hospital admissions in Quito. Such models provide an effective method for analyzing nonlinear time-series and are widely used to analyze the health impacts of air pollution. The regression model included an indicator for day of week, a smooth function of time with four degrees of freedom (df) per calendar year to control for seasonality and long-term trends, a smooth function of same-day temperature (three df), a smooth function of lag days 1–3 temperature (three df), and a smooth function of same-day relative humidity (three df). Associations between air pollution and hospital admissions were examined for individual lag days 0–3 and average lag days 0–3. In presenting the results, excess risks and 95% confidence intervals (CI) were calculated for an interquartile range (IQR) increase in the individual air pollutants. Sensitivity analysis was completed using alternative degrees of freedom and the results indicated that the associations were not substantially changed. All analysis was completed using R [32].
The individual index values for all four air pollutants were calculated, respectively, and included in the model. The IQCA (the highest index value of the four pollutants) was also included in the model as an individual variable. The IQCA was largely driven by ozone during the 2-year study period: 575 days were driven by O3 and 155 days were driven by PM2.5. Individual index values from NO2 and SO2 were much lower than those from O3 and PM2.5, and thus were not represented in the IQCA variable.
Two-pollutant models were run to identify potential improved predictors among air pollutants. Two-pollutant models used the same basic structure as the single-pollutant models, with the inclusion of two pollutant variables with six different combinations: PM2.5 and O3, PM2.5 and NO2, PM2.5 and SO2, O3 and NO2, O3 and SO2, NO2 and SO2.

3. Results

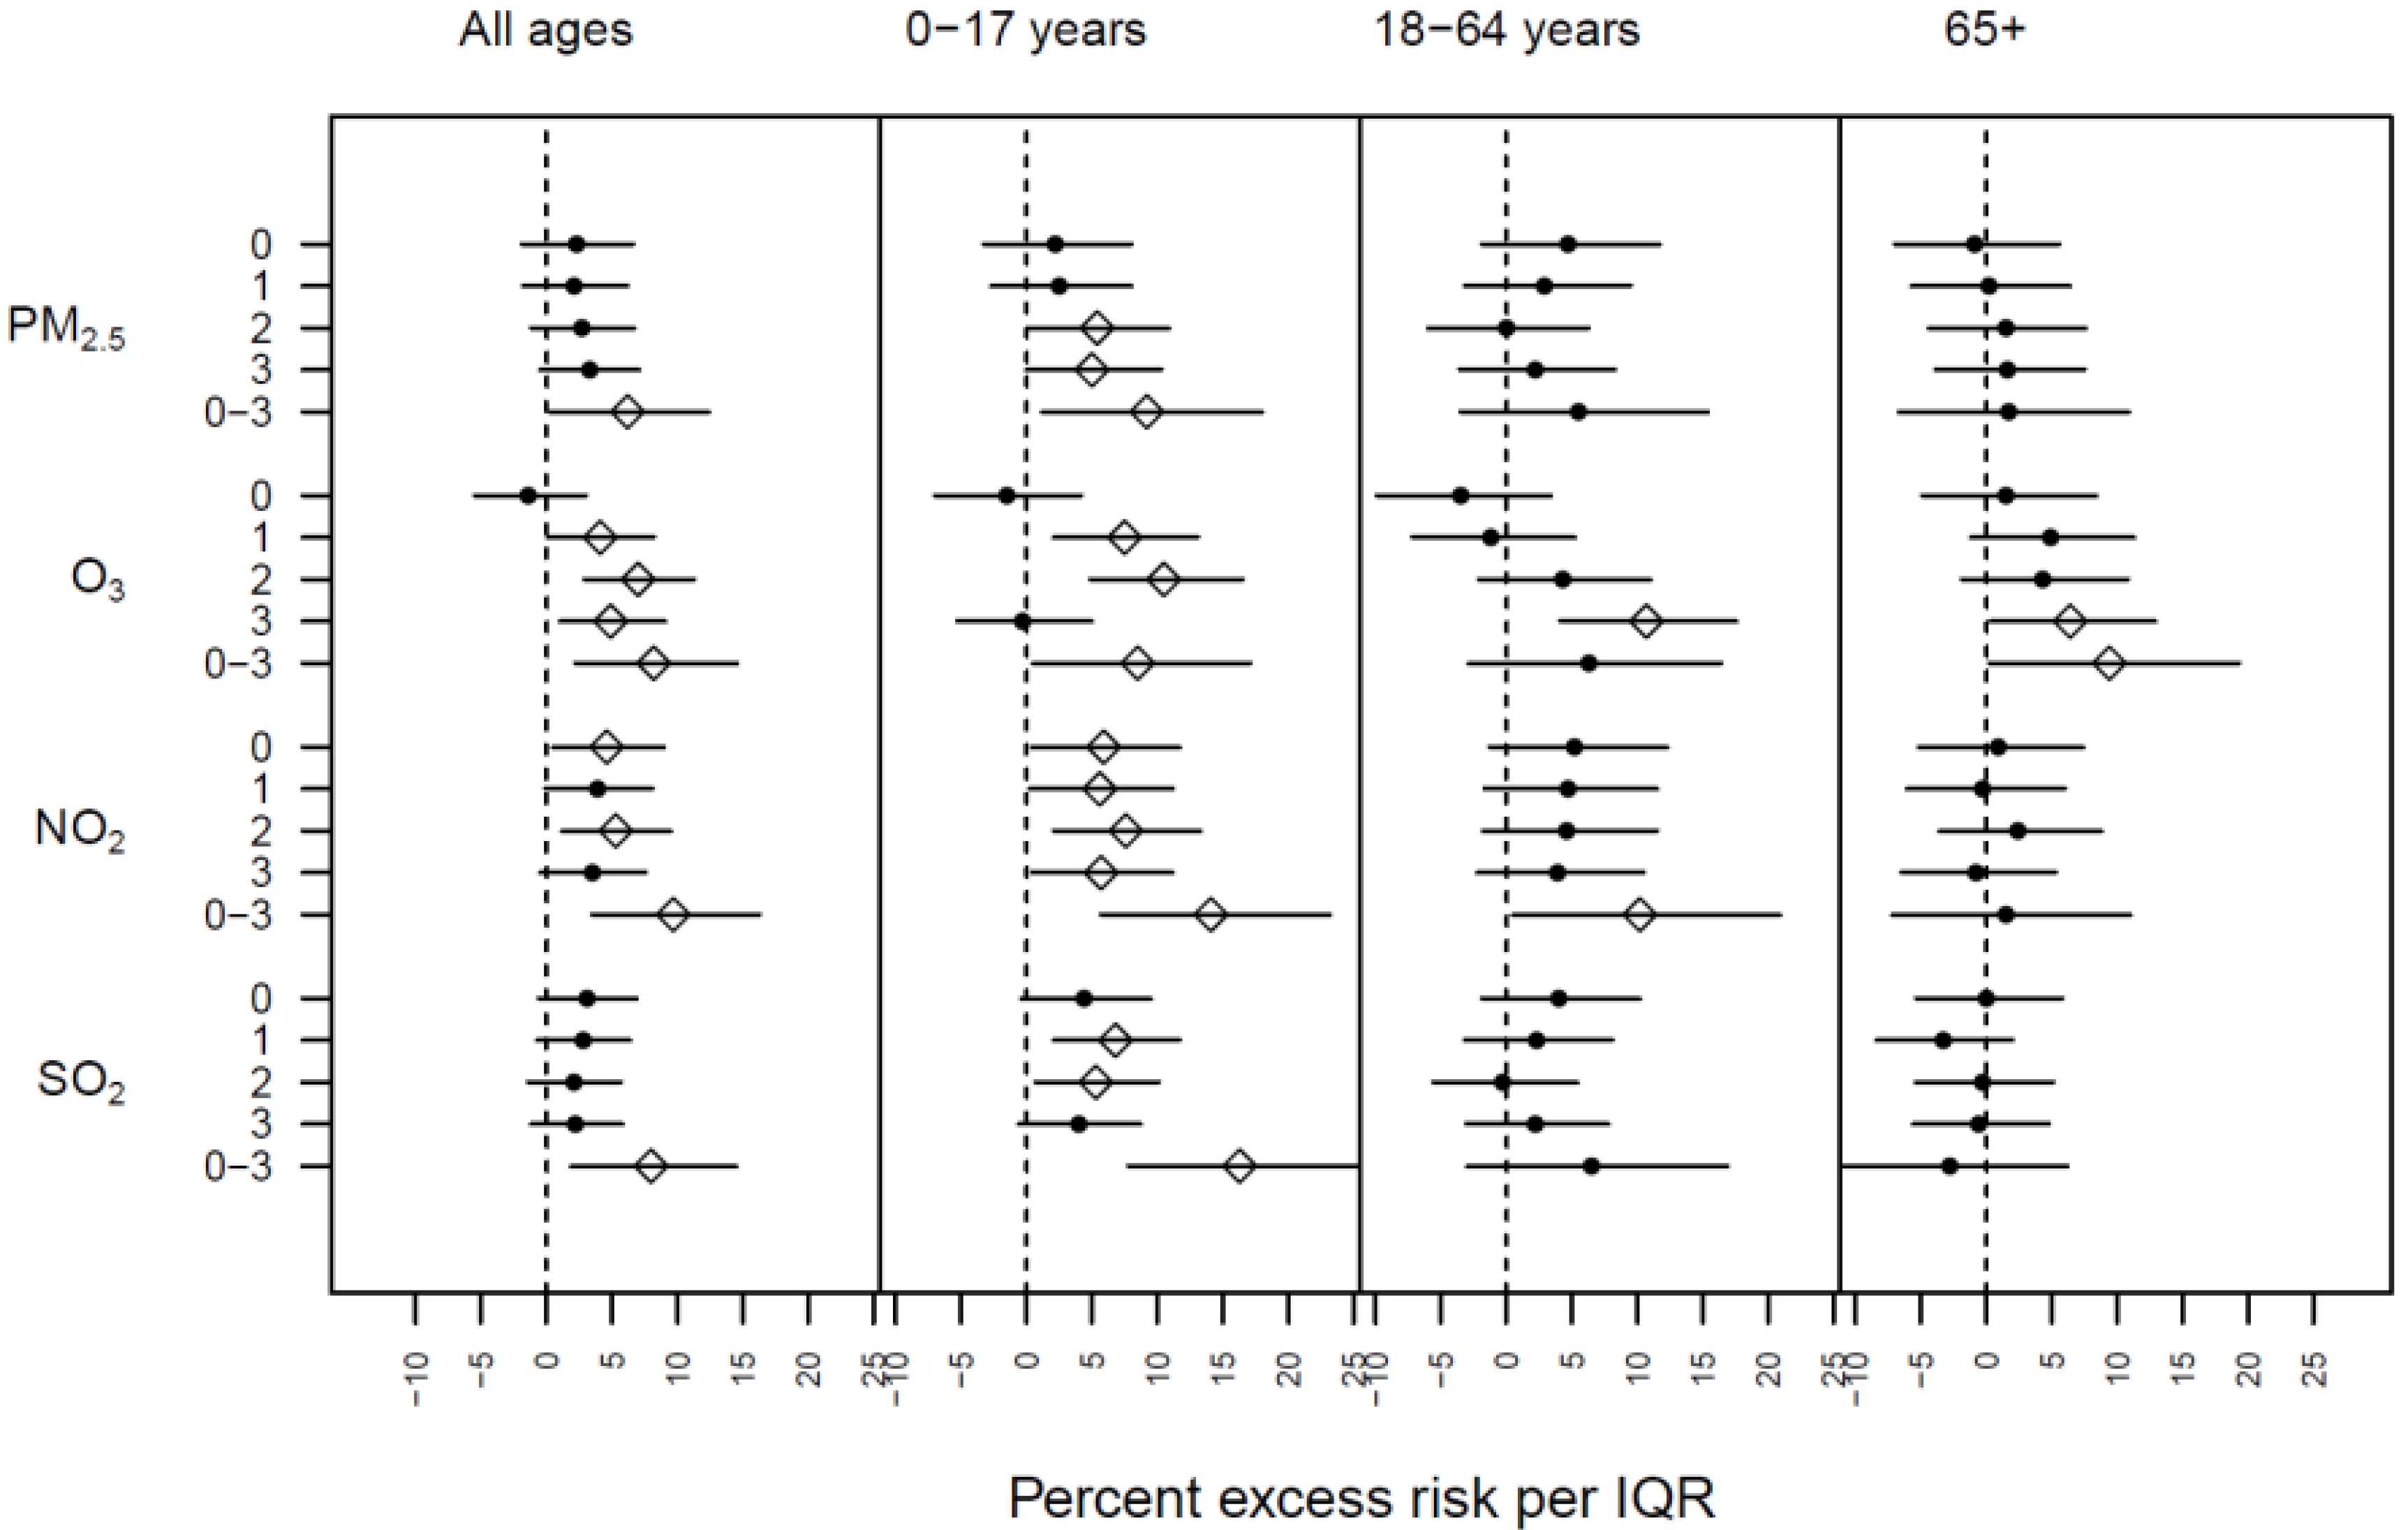
Significant associations between air pollution exposures and daily respiratory hospital admissions were commonly observed among multiple pollutants, age groups, and lag days. Figure 3 shows the excess risks of respiratory hospital admissions in Quito, corresponding to an IQR increase in air pollutant concentrations, by lag structure and age group. Significant associations between PM2.5 and health outcomes were observed across multiple lag days among all ages and children, with the maximum excess risk observed on average on lag days 0–3 among children, indicating an excess risk of 9.2% (95% CI: 1.2, 18) for an IQR increase in PM2.5.
Exposures to increased levels of ambient O3 were also significantly associated with respiratory hospital admissions during the study period, with more significant associations observed for all ages compared to PM2.5. Similar to PM2.5, significant associations were mainly observed in children, but the health effects of O3 were also observed in older age groups with the peak impact of O3 occurring in adults on lag day 3 (10.7% excess risk with 95% CI: 4.1, 17.6). O3 was the only air pollutant that showed significant and near-significant associations with health outcomes among older adults (ages 65+).
Significant associations with respiratory hospital admissions were also observed for NO2. Significant associations were observed across multiple individual lag days for all ages and across all lag days in children. Among adults, there were positive but not significant associations observed across all individual lag days, and the average lag days 0–3 captured the significant associations with an excess risk of 10.2% (95% CI: 0.5, 20.9).
Associations between respiratory hospital admissions and SO2 were only observed in children, but the magnitude of the associations observed for average lag days 0–3 in children were the largest among all four air pollutants, with an excess risk of 16.3% (95% CI: 7.8, 25.4). No significant associations were observed among adult and elderly age groups.
Moving from individual pollutants to the local air quality index, significant associations between index values and daily respiratory hospital admissions were commonly observed among multiple pollutants, age groups, and lag days. As shown in Figure 4, associations between respiratory hospital admissions and index values followed the same pattern as their corresponding air pollutants. The effect of the daily IQCA followed a similar pattern as the O3 index values, which is anticipated, as most of the IQCA values came from O3 (575 out of 730 values). The remaining 155 IQCA values were based on the PM2.5 index.
The results of the two-pollutant models are presented in Figure A1. In general, the associations observed for PM2.5 were attenuated in most two-pollutant models, while the associations with NO2, and to a lesser extent O3, remained significant and largely unchanged, regardless of which second pollutant was also included in the analysis.

4. Discussion

One of the primary goals of an air quality index is to easily and effectively communicate the daily health risks of outdoor air pollution exposures to the public, especially to individuals with increased susceptibility, whom the index is designed to help. The index should take into account the effects of multiple pollutants at both high and relatively low concentrations, therein capturing the overall health risk to a population exposed to many different air pollutants.
Overall, O3 and NO2 were consistently associated with significant increases in population-level respiratory morbidity among both children and adults over multiple lag days. Average lag structures captured effects that occurred over multiple days following exposure among children. Significant results were most commonly observed among children, but this may be due in part to the higher number of hospital admissions in this age group (see Table A2) and children’s heightened susceptibility to air pollutants, as evidenced in previous studies [33,34,35]. Specifically, children have higher ventilation rates, engage in more physical activity, and spend more time outdoors than adults and thus inhale more pollutants relative to their body size. Children also have unique physiologies, including still-developing lungs, immature immune systems, and smaller peripheral airways which put them at increased risk of experiencing adverse health impacts from air pollution exposure [34,36,37,38].
The interpretation of findings of a multi-pollutant model can be complicated [39,40,41]. If the two pollutants in the same model are independent risk factors for the health outcome, a two-pollutant model might help us to capture the total impacts of these two pollutants as well as the synergistic (or antagonistic) effects. If one pollutant is a surrogate for the other, the model might be able to indicate which pollutant serves as a better predictor of the health risk, such as our two-pollutant models, which suggest that PM2.5 is a relatively weak predictor for health risk in Quito. However, we should be careful making such interpretations since this lower predictiveness could be caused by measurement errors or variations unique to PM2.5 compared to the other gaseous pollutants. If both pollutants in the model are just surrogates for some other pollutant, the model can still identify which one is a better surrogate, and thus a better predictor. Specifically, our two-pollutant model showed that NO2, and to a much lesser extent SO2, are consistently associated with health outcomes primarily among children, yet were excluded from the IQCA reporting due to their low individual index values.
This study constructed the single-pollutant index using the equations in the technical document provided by MDMQ to evaluate whether the index was associated with population-level health risks. The findings of this study showed that significant associations with respiratory morbidity were observed for all four air pollutants (PM2.5, O3, NO2, and SO2) and their IQCAs. The IQCA, which was reported online every day to the public as behavior modification guidance, was also predictive of respiratory morbidity risk among the Quito population. It is derived exclusively by O3 and PM2.5, and driven primarily by O3, whose pattern of effect is mimicked by the IQCA. However, only NO2 showed consistent significant associations with health effects in both single- and two-pollutant models among children. While NO2 would likely serve as a better predictor of respiratory morbidity risk than PM2.5 or O3, it is presently excluded from the IQCA reporting due to its low index values.
An effective air quality index should provide individuals with reliable information, not just on high pollution days, but also on moderate- and low-pollution days. Cumulative evidence suggests susceptible individuals still experience adverse health risks at low levels of air pollution [13,14,42], yet commonly lack access to information that could guide their daily behavior modification decisions. An air quality index is also most useful if higher values are closely and consistently associated with increased population-level health risks. However, the nature of traditional indices only allows for a single pollutant to drive daily index values (typically the highest individual daily pollutant’s index value), potentially underestimating the total health impacts and ignoring the impacts of multi-pollutant interactions. Research in NYC has indicated that regulatory-based indices may inadequately communicate the full spectrum of adverse health risks of air pollution when there are health-relevant exposures to more than one pollutant at a time [43]. Although a traditionally designed index may be useful on its own, incorporating multiple pollutants into index calculations allows the index to better reflect the real-world health risks of air pollution.
Multi-pollutant health-based indices have been successfully implemented throughout the world. In Guangzhou, China, Li et al. (2017) constructed and validated an air quality health index based on the short-term associations of multiple air pollutants with mortality. Their findings suggest that the health-based index is a better health risk communication tool compared to the existing air quality index [20]. Cromar et al. [23] created and validated a multi-pollutant, health-based air quality index using the same three criteria pollutants in Mexico City, which is currently in use to communicate daily health risks to the public. Recently, Gladson et al. [44] developed a health-based air quality index using simple calculations based on daily index values from three criteria pollutants— PM2.5, NO2, and O3—which reflects children’s respiratory risk and can be used throughout the world to provide local air quality alerts.
In light of this study’s results and the success of health-based air quality indices globally, it has been recommended that the MDMQ considers potential ways they could modify the IQCA calculation to account for the observed health impacts of all ambient air pollutants in this population. We anticipate this change will increase the health benefits of individual behavior modification influenced by Quito’s air quality alerts, especially in children.
It is important to note that the health impacts associated with NO2 in particular may not be driven exclusively by its own direct health impacts. NO2 is a known surrogate for other traffic-related and combustion-driven air pollution that impacts health but is not typically monitored, such as ultrafine particles. These pollutants follow similar concentration patterns to NO2 when produced via the same processes (e.g., vehicle exhausts). The health effects of the hundreds of products of combustion are likely being reflected in the health effects linked to NO2 in the IQCA, as combustion is the primary source of NO2. In addition, because NO2 was the only air pollutant that showed same-day health impacts in Quito, reporting its index to the public might help people change their outdoor activities to avoid breathing polluted air on the same day. It also had a robust health effect among adults (excess risk at 10.1%, with 95% CI: 0.5 and 20.5). Furthermore, the significant associations for NO2 remained consistent even when controlling for a second pollutant.
There are some limitations of this study. Data were only obtained for respiratory hospital admissions, which usually have a much smaller number of daily cases compared to emergency department (ED) visits and, thus, smaller statistical power. Additionally, the data were not differentiated by at-risk populations, who may respond differently to ambient pollutant concentrations, and who may be more likely to modify their behavior based on air quality alerts.

5. Conclusions

This study successfully quantified the respiratory health risks associated with monitored ambient air pollution in Quito, Ecuador and identified how individual pollutants drive local risk communication. All four ambient air pollutants assessed in this study showed significant positive associations with respiratory hospital admissions, although some associations were attenuated in two-pollutant models. Quito’s risk communication tool, the IQCA, effectively represents real respiratory health risks in the region, but is driven heavily by O3 alone despite clear risk associations in other air pollutants, particularly NO2. Consideration of the impacts of all pollutants in a potential reassessment of the IQCA could help capture the overall health risk to the Quito population. This work contributes to increased global research equity by adding an epidemiological study to the limited health analyses conducted in Latin American cities.

Author Contributions

Conceptualization, K.C.; methodology, J.Z. and K.C.; formal analysis, J.Z. and L.G.; data curation, V.D.S.; writing—original draft, J.Z. and L.G.; writing—review and editing, K.C. and L.G.; supervision, K.C.; funding acquisition, K.C. All authors have read and agreed to the published version of the manuscript.

Funding

This research was funded by the Marron Institute of Urban Management at New York University.

Institutional Review Board Statement

Not applicable.

Informed Consent Statement

Not applicable.

Data Availability Statement

Health and environmental data were acquired through a special arrangement with the local government in Quito, Ecuador and are not available from the study authors for public dissemination. Requests for data should be made to the Secretaría de Ambiente in Quito.

Acknowledgments

This collaboration was enabled by, but not directly associated with, an ongoing collaboration with the NASA Health and Air Quality Applied Science Team (HAQAST) and government officials in Quito, Ecuador.

Conflicts of Interest

The authors declare no conflict of interest.

Appendix A

Table A1. Descriptive statistics of air pollution and weather data in Quito, 2014–2015. IQR: interquartile range, SD: standard deviation.
MinimumMedianMaximumIQRMeanSD
PM2.5 (μg/m3)6.617.332.76.517.34.7
O3 (ppb)8.321.338.87.221.95.3
NO2 (ppb)11.32237.26.922.54.9
SO2 (ppb)0.51.63.71.11.70.8
Temp (°C)12.315.518.61.315.50.9
RH (%)26.269.592.117.167.411.7
Precipitation (mm)0.00.113.91.81.52.7
Table A2. Descriptive statistics of hospital admission data in Quito, 2014–2015. IQR: interquartile range, SD: standard deviation.
Minimum Daily CountMedian Daily CountMaximum Daily CountIQR of Daily CountMean
Daily Count
SD of Daily CountTotal
2014All ages126471126.38.19600
0–17 years01225812.35.44500
18–64 years181757.93.82900
65+061446.02.62200
2015All ages129551528.410.010,366
0–17 years01028611.05.04033
18–64 years01024810.45.53796
65+061647.03.22537
Figure A1. Results of two-pollutant models showing associations with daily respiratory hospital admissions by age group (six combinations grouped by color). Open diamonds indicate significant results and black circles indicate insignificant results at the 0.05 level.
Ijerph 20 06326 g0a1

References

  1. WHO. Billions of people still breathe unhealthy air: New WHO data. Available online: https://www.who.int/news/item/04-04-2022-billions-of-people-still-breathe-unhealthy-air-new-who-data (accessed on 5 July 2022).
  2. Cazorla, M. Air quality over a populated Andean region: Insights from measurements of ozone, NO, and boundary layer depths. Atmos. Pollut. Res. 2016, 7, 66–74. [Google Scholar] [CrossRef]
  3. Gouveia, N.; Kephart, J.L.; Dronova, I.; McClure, L.; Granados, J.T.; Betancourt, R.M.; O’Ryan, A.C.; Texcalac-Sangrador, J.L.; Martinez-Folgar, K.; Rodriguez, D. Ambient fine particulate matter in Latin American cities: Levels, population exposure, and associated urban factors. Sci. Total Environ. 2021, 772, 145035. [Google Scholar] [CrossRef] [PubMed]
  4. Cevallos, V.M.; Díaz, V.; Sirois, C.M. Particulate matter air pollution from the city of Quito, Ecuador, activates inflammatory signaling pathways in vitro. Innate Immun. 2017, 23, 392–400. [Google Scholar] [CrossRef] [PubMed] [Green Version]
  5. Valencia, V.H.; Hertel, O.; Ketzel, M.; Levin, G. Modeling urban background air pollution in Quito, Ecuador. Atmos. Pollut. Res. 2020, 11, 646–666. [Google Scholar] [CrossRef]
  6. Geddes, J.A.; Martin, R.V.; Boys, B.L.; van Donkelaar, A. Long-term trends worldwide in ambient NO2 concentrations inferred from satellite observations. Environ. Health Perspect. 2016, 124, 281–289. [Google Scholar] [CrossRef] [PubMed] [Green Version]
  7. WHO. WHO air pollution database. Available online: https://www.who.int/data/gho/data/themes/air-pollution/who-air-quality-database/2014 (accessed on 5 July 2022).
  8. NASA. Nitrogen Dioxide Trends for World Cities. Available online: https://airquality.gsfc.nasa.gov/no2/world (accessed on 7 July 2023).
  9. Peláez, L.M.G.; Santos, J.M.; de Almeida Albuquerque, T.T.; Reis, N.C., Jr.; Andreão, W.L.; de Fátima Andrade, M. Air quality status and trends over large cities in South America. Environ. Sci. Policy 2020, 114, 422–435. [Google Scholar] [CrossRef]
  10. Wen, X.J.; Balluz, L.; Mokdad, A. Association between media alerts of air quality index and change of outdoor activity among adult asthma in six states, BRFSS, 2005. J. Community Health 2009, 34, 40–46. [Google Scholar] [CrossRef]
  11. Borbet, T.C.; Gladson, L.A.; Cromar, K.R. Assessing air quality index awareness and use in Mexico City. BMC Public Health 2018, 18, 538. [Google Scholar] [CrossRef] [Green Version]
  12. Delmas, M.A.; Kohli, A. Can apps make air pollution visible? Learning about health impacts through engagement with air quality information. J. Bus. Ethics 2020, 161, 279–302. [Google Scholar] [CrossRef] [Green Version]
  13. Cromar, K.R.; Gladson, L.A.; Ewart, G. Trends in Excess Morbidity and Mortality Associated with Air Pollution above American Thoracic Society-Recommended Standards, 2008–2017. Ann. Am. Thorac. Soc. 2019, 16, 836–845. [Google Scholar] [CrossRef]
  14. Perlmutt, L.; Stieb, D.; Cromar, K. Accuracy of quantification of risk using a single-pollutant Air Quality Index. J. Expo. Sci. Environ. Epidemiol. 2017, 27, 24–32. [Google Scholar] [CrossRef] [PubMed]
  15. Brauer, M.; Brook, J.R.; Christidis, T.; Chu, Y.; Crouse, D.L.; Erickson, A. Mortality–Air pollution associations in low-exposure environments (MAPLE): Phase 2. Health Eff. Inst. Tech. Rep. Res. Rep. 2022, 2022, 212. [Google Scholar]
  16. Chen, R.; Wang, X.; Meng, X.; Hua, J.; Zhou, Z.; Chen, B.; Kan, H. Communicating air pollution-related health risks to the public: An application of the Air Quality Health Index in Shanghai, China. Environ. Int. 2013, 51, 168–173. [Google Scholar] [CrossRef] [PubMed]
  17. Stieb, D.M.; Burnett, R.T.; Smith-Doiron, M.; Brion, O.; Shin, H.H.; Economou, V. A new multipollutant, no-threshold air quality health index based on short-term associations observed in daily time-series analyses. J. Air Waste Manag. Assoc. 2008, 58, 435–450. [Google Scholar] [CrossRef] [Green Version]
  18. Wong, T.W.; Tam, W.W.S.; Yu, I.T.S.; Lau, A.K.H.; Pang, S.W.; Wong, A.H. Developing a risk-based air quality health index. Atmos. Environ. 2013, 76, 52–58. [Google Scholar] [CrossRef]
  19. Cairncross, E.K.; John, J.; Zunckel, M. A novel air pollution index based on the relative risk of daily mortality associated with short-term exposure to common air pollutants. Atmos. Environ. 2007, 41, 8442–8454. [Google Scholar] [CrossRef]
  20. Li, X.; Xiao, J.; Lin, H.; Liu, T.; Qian, Z.; Zeng, W.; Guo, L.; Ma, W. The construction and validity analysis of AQHI based on mortality risk: A case study in Guangzhou, China. Environ. Pollut. 2017, 220, 487–494. [Google Scholar] [CrossRef]
  21. To, T.; Shen, S.; Atenafu, E.G.; Guan, J.; McLimont, S.; Stocks, B.; Licskai, C. The air quality health index and asthma morbidity: A population-based study. Environ. Health Perspect. 2013, 121, 46–52. [Google Scholar] [CrossRef] [Green Version]
  22. Chen, H.; Li, Q.; Kaufman, J.S.; Wang, J.; Copes, R.; Su, Y.; Benmarhnia, T. Effect of air quality alerts on human health: A regression discontinuity analysis in Toronto, Canada. Lancet Planet. Health. 2018, 2, e19–e26. [Google Scholar] [CrossRef] [Green Version]
  23. Cromar, K.; Gladson, L.; Palomera, M.J.; Perlmutt, L. Development of a health-based index to identify the association between air pollution and health effects in Mexico City. Atmosphere 2021, 12, 372. [Google Scholar] [CrossRef]
  24. Laumbach, R.J.; Cromar, K.R.; Adamkiewicz, G.; Carlsten, C.; Charpin, D.; Chan, W.R.; de Nazelle, A.; Forastiere, F.; Goldstein, J.; Gumy, S.; et al. Personal Interventions for Reducing Exposure and Risk for Outdoor Air Pollution: An Official American Thoracic Society Workshop Report. Ann. Am. Thorac. Soc. 2021, 18, 1435–1443. [Google Scholar] [CrossRef] [PubMed]
  25. Ward, A.L.S.; Beatty, T.K. Who responds to air quality alerts? Environ. Resour. Econ. 2016, 65, 487–511. [Google Scholar] [CrossRef]
  26. Neidell, M. Air quality warnings and outdoor activities: Evidence from Southern California using a regression discontinuity design. J. Epidemiol. Community Health 2010, 64, 921–926. [Google Scholar] [CrossRef] [PubMed]
  27. McDermott, M.; Srivastava, R.; Croskell, S. Awareness of and compliance with air pollution advisories: A comparison of parents of asthmatics with other parents. J. Asthma 2006, 43, 235–239. [Google Scholar] [CrossRef]
  28. Van Buuren, S.; Groothuis-Oudshoorn, K. MICE: Multivariate Imputation by Chained Equations in R. J. Stat. Softw. 2011, 45, 1–67. [Google Scholar] [CrossRef] [Green Version]
  29. Lepeule, J.; Litonjua, A.A.; Gasparrini, A.; Koutrakis, P.; Sparrow, D.; Vokonas, P.S.; Schwartz, J. Lung function association with outdoor temperature and relative humidity and its interaction with air pollution in the elderly. Environ. Res. 2018, 165, 110–117. [Google Scholar] [CrossRef]
  30. Zhu, Z.; Qiao, Y.; Liu, Q.; Lin, C.; Dang, E.; Fu, W.; Wang, G.; Dong, J. The impact of meteorological conditions on Air Quality Index under different urbanization gradients: A case from Taipei. Environ. Dev. Sustain. 2021, 23, 3994–4010. [Google Scholar] [CrossRef]
  31. Li, Y.; Chen, Y.; Karimian, H.; Tao, T. Spatiotemporal analysis of air quality and its relationship with meteorological factors in the Yangtze River Delta. J. Elem. 2020, 25, 1059–1075. [Google Scholar]
  32. R Core Team. R: A Language and Environment for Statistical Computing; R Foundation for Statistical Computing: Vienna, Austria, 2013. [Google Scholar]
  33. Moorman, J.E. National Surveillance for Asthma—United States, 1980–2004; U.S. Department of Health and Human Services: Atlanta, GA, USA, 2007. [Google Scholar]
  34. Trasande, L.; Thurston, G.D. The role of air pollution in asthma and other pediatric morbidities. J. Allergy Clin. Immunol. 2005, 115, 689–699. [Google Scholar] [CrossRef]
  35. Kim, J.J. Ambient air pollution: Health hazards to children. Pediatrics 2004, 114, 1699–1707. [Google Scholar]
  36. Gilliland, F.D. Outdoor air pollution, genetic susceptibility, and asthma management: Opportunities for intervention to reduce the burden of asthma. Pediatrics 2009, 123 (Suppl. S3), S168–S173. [Google Scholar] [CrossRef] [Green Version]
  37. Selgrade, M.K.; Plopper, C.G.; Gilmour, M.I.; Conolly, R.B.; Foos, B.S. Assessing the health effects and risks associated with children’s inhalation exposures—Asthma and allergy. J. Toxicol. Environ. Health Part A 2007, 71, 196–207. [Google Scholar] [CrossRef] [PubMed]
  38. Bateson, T.F.; Schwartz, J. Children’s response to air pollutants. J. Toxicol. Environ. Health Part A 2007, 71, 238–243. [Google Scholar] [CrossRef] [PubMed]
  39. Wesson, K.; Fann, N.; Morris, M.; Fox, T.; Hubbell, B. A multi–pollutant, risk–based approach to air quality management: Case study for Detroit. Atmos. Pollut. Res. 2010, 1, 296–304. [Google Scholar] [CrossRef] [Green Version]
  40. Tolbert, P.E.; Klein, M.; Peel, J.L.; Sarnat, S.E.; Sarnat, J.A. Multipollutant modeling issues in a study of ambient air quality and emergency department visits in Atlanta. J. Expo. Sci. Environ. Epidemiol. 2007, 17, S29–S35. [Google Scholar] [CrossRef] [PubMed] [Green Version]
  41. Vedal, S.; Kaufman, J.D. What does multi-pollutant air pollution research mean? Am. J. Respir. Crit. Care Med. 2011, 183, 4–6. [Google Scholar] [CrossRef] [PubMed]
  42. Thurston, G.D.; Ahn, J.; Cromar, K.R.; Shao, Y.; Reynolds, H.R.; Jerrett, M.; Lim, C.C.; Shanley, R.; Park, Y.; Hayes, R.B. Ambient particulate matter air pollution exposure and mortality in the NIH-AARP diet and health cohort. Environ. Health Perspect. 2016, 124, 484–490. [Google Scholar] [CrossRef] [Green Version]
  43. Perlmutt, L.D.; Cromar, K.R. Comparing associations of respiratory risk for the EPA Air Quality Index and health-based air quality indices. Atmos. Environ. 2019, 202, 1–7. [Google Scholar] [CrossRef]
  44. Gladson, L.A.; Cromar, K.R.; Ghazipura, M.; Knowland, K.E.; Keller, C.A.; Duncan, B. Communicating respiratory health risk among children using a global air quality index. Environ. Int. 2022, 159, 107023. [Google Scholar] [CrossRef]
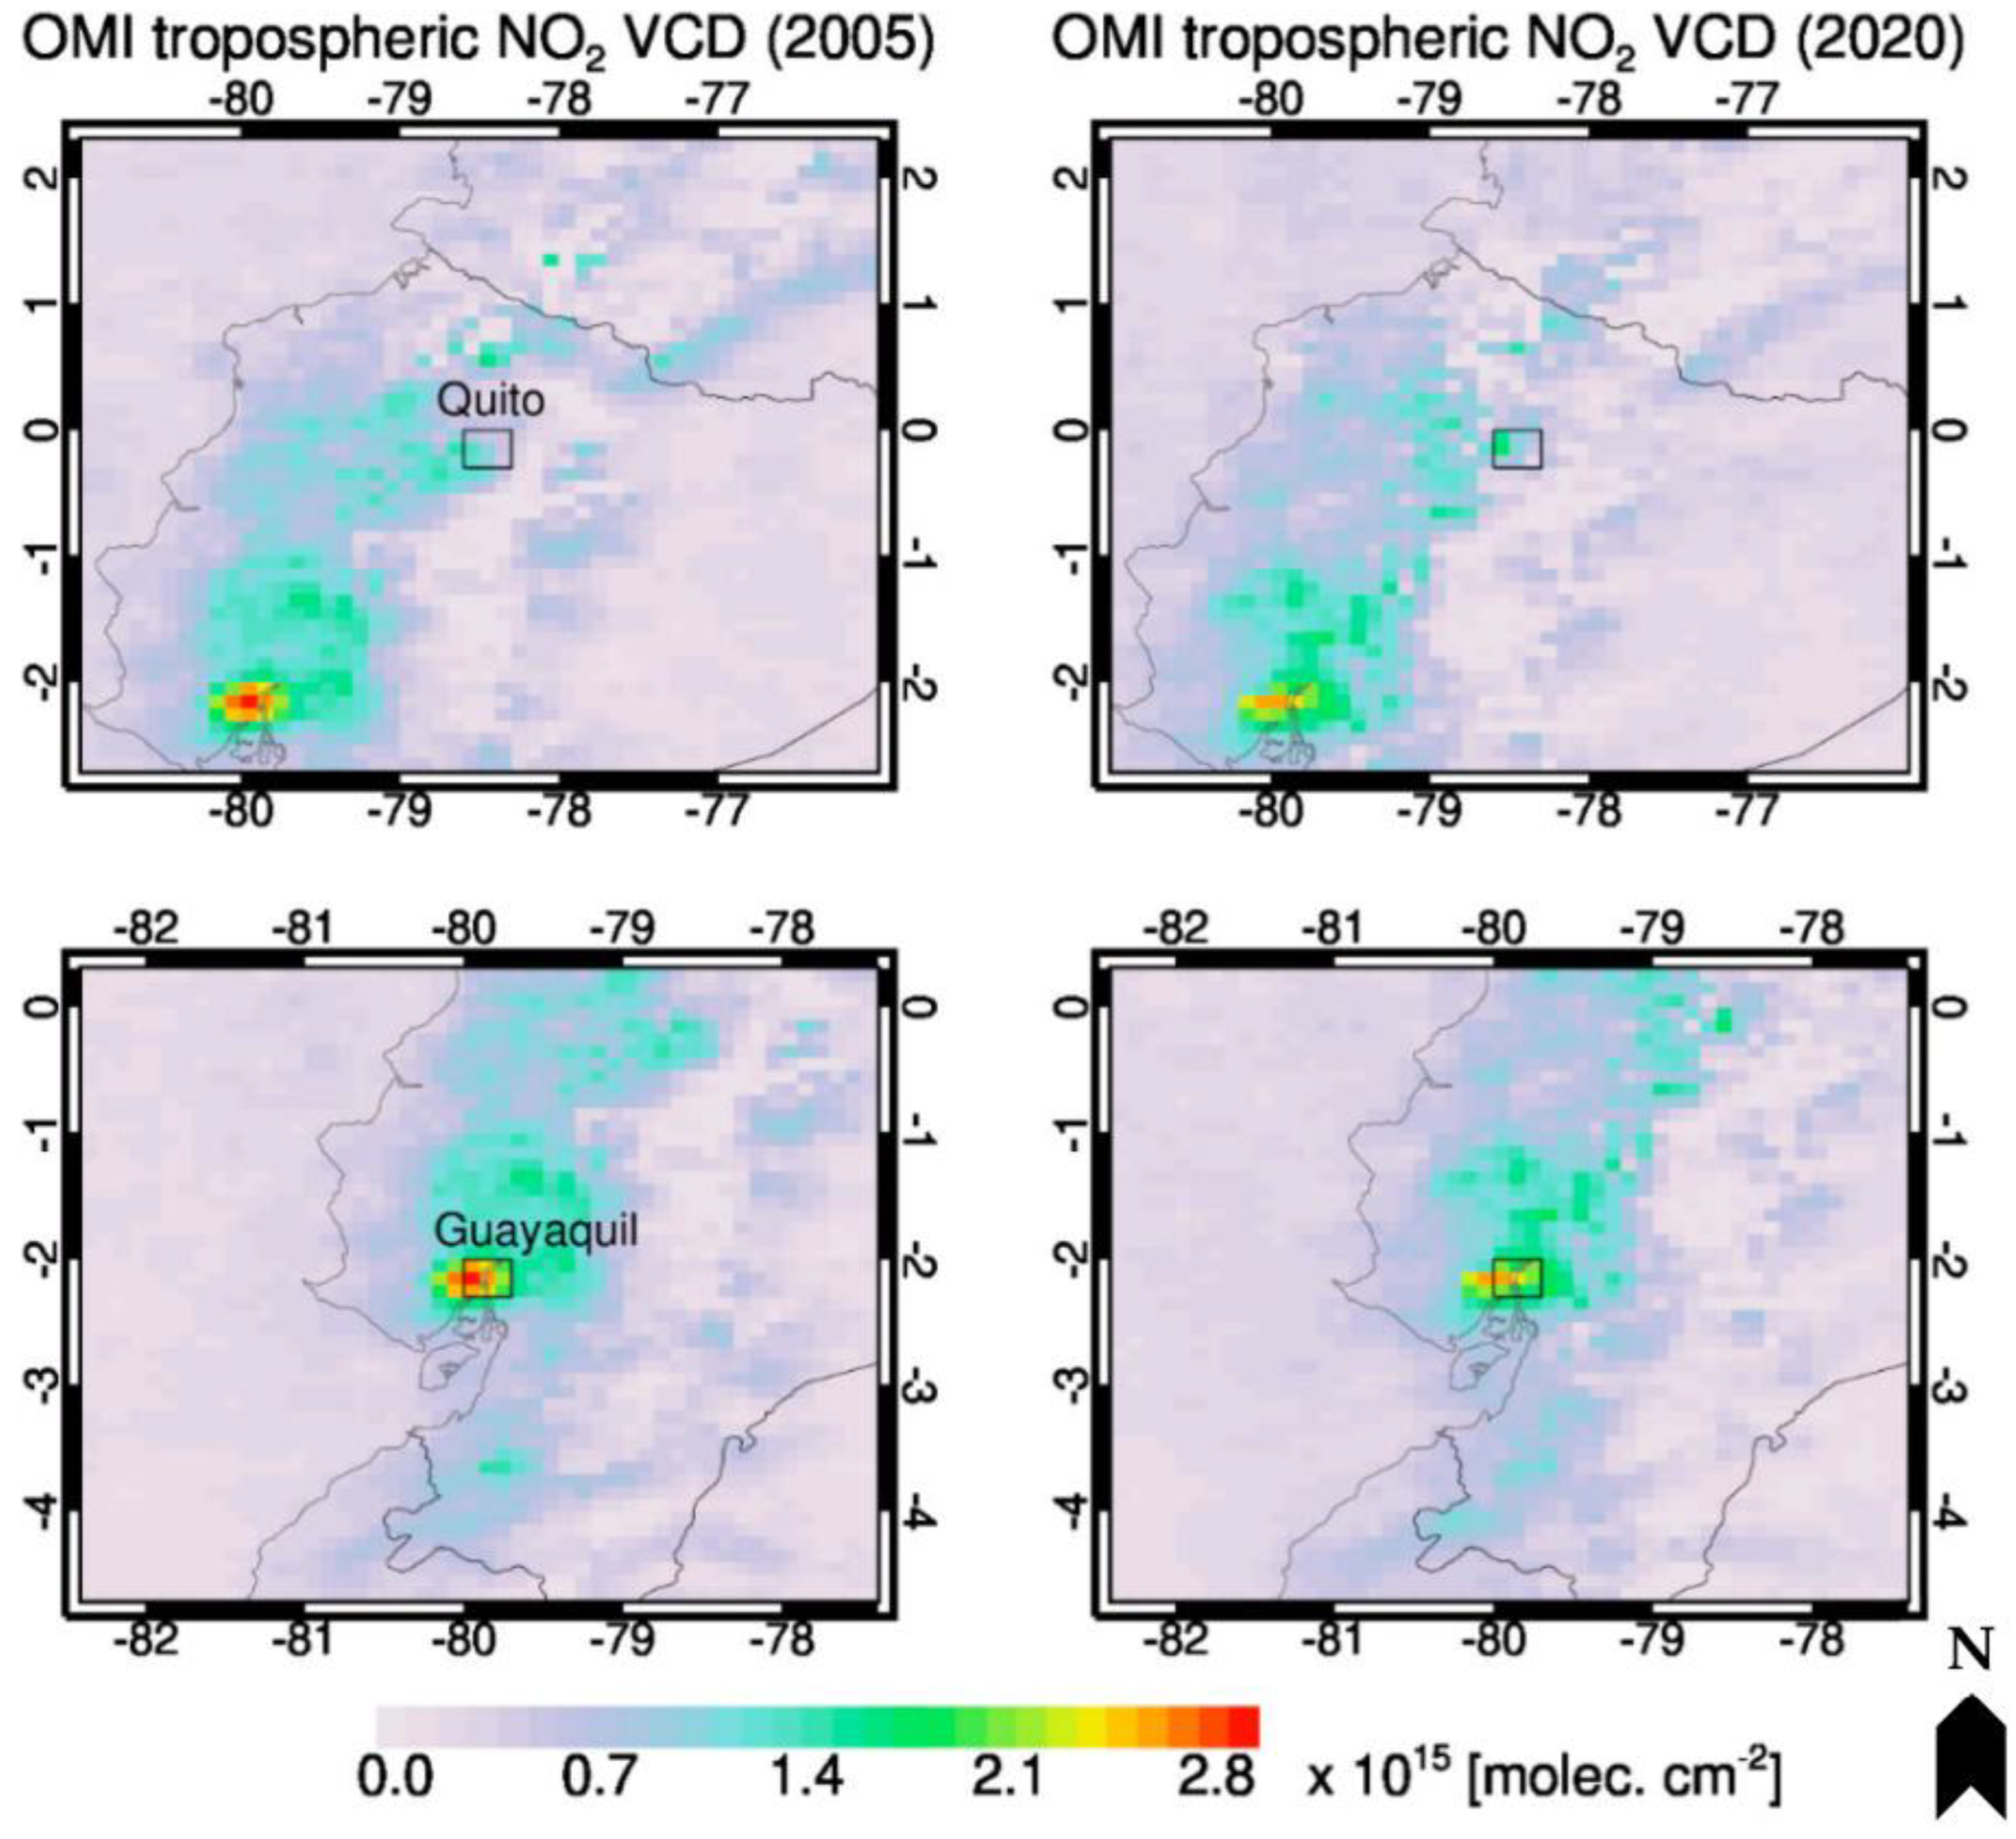
Figure 1. NO2 data trends for the cities of Quito and Guayaquil in Ecuador, 2005–2020 (OMI instrument, tropospheric NO2 vertical column density, 13 × 24 km2 horizontal spatial resolution). Reproduced with permission from Ref. [8].
Ijerph 20 06326 g001
Figure 2. Locations of air pollution monitoring stations overlaid on population density in Quito. The black triangles represent the 9 REMMAQ stations: Belisario, Carapungo, Centro, Cotocollao, El Camal, Guamani, Los Chillos, San Antonio, and Tumbaco.
Ijerph 20 06326 g002
Figure 3. Excess risks of respiratory hospital admissions in Quito corresponding to an IQR increase in air pollutant concentrations, by lag structure and age group. Open diamonds indicate significant results and black circles indicate insignificant results at the 0.05 level.
Ijerph 20 06326 g003
Figure 4. Excess risks of respiratory hospital admissions in Quito corresponding to an IQR in index values, by lag structure and age group. Open diamonds indicate significant results and black circles indicate insignificant results at the 0.05 level. IQCA is reported for the maximum daily index value across all four pollutants. Of the 730 days included in this analysis, 575 days were driven by O3 with the remaining 155 days driven by PM2.5.
Ijerph 20 06326 g004
Table 1. Equations used to calculate index values based on the concentration of a given pollutant.
Contaminant (μg/m3)Mathematical Expressions for Each Concentration (C) Range
O3, 8 h maximum0 < C ≤ 100100 < C ≤ 200200 < C ≤ 600600 < C
index values = Cindex values = Cindex values = 0.5C + 100index values = 0.5C + 100
NO2, 1 h maximum 0 < C ≤ 200200 < C ≤ 10001000 < C ≤ 30003000 < C
index values = 0.50Cindex values = 0.125C + 75.00index values = 0.1C + 100index values = 0.1C + 100
SO2, 24 h average 0 < C ≤ 62.562.5 < C ≤ 125125 < C ≤ 200200 < C
index values = 0.8Cindex values = 1.333C − 66.667index values = 0.125C + 175index values = 0.125C + 175
PM2.5, 24 h average0 < C ≤ 5050 < C ≤ 250250 < C
index values = 2Cindex values = C + 50index values = C + 50
Disclaimer/Publisher’s Note: The statements, opinions and data contained in all publications are solely those of the individual author(s) and contributor(s) and not of MDPI and/or the editor(s). MDPI and/or the editor(s) disclaim responsibility for any injury to people or property resulting from any ideas, methods, instructions or products referred to in the content.