Article

Level of Service Model of the Non-Motorized Vehicle Crossing the Signalized Intersection Based on Riders’ Perception Data

1
Ningbo Port Trade Cooperation and Development Collaborative Innovation Center, Faculty of Maritime and Transportation, Ningbo University, Ningbo 315211, China
2
Faculty of Maritime and Transportation, Ningbo University, Ningbo 315211, China
3
School of Architecture and Transportation, Guilin University of Electronic Technology, Guilin 541004, China
4
College of Automobile and Traffic Engineering, Nanjing Forestry University, Nanjing 210037, China
5
School of Transportation, Southeast University, Nanjing 211189, China
6
Department of Civil and Environmental Engineering, University of Wisconsin–Madison, Madison, WI 53706, USA
*
Author to whom correspondence should be addressed.
Int. J. Environ. Res. Public Health 2022, 19(8), 4534; https://doi.org/10.3390/ijerph19084534
Submission received: 11 March 2022 / Revised: 1 April 2022 / Accepted: 7 April 2022 / Published: 9 April 2022

Abstract

:
This article aims to analyze the factors affecting the LOS (level of service) of non-motorized vehicles crossing the signalized intersection and to construct an appropriate method to evaluate the LOS. Aiming at the mixed non-motorized traffic flow of electric vehicles and bicycles in the Chinese metropolis, the delay model in the highway capacity manual (HCM) was modified by taking two new factors into account: the pedestrian traffic rule compliance rate and the fuzzy perception of arrival rate in reality. The results show that the data obtained by the modified model are more consistent with the actual one. Next, a comparison was established between the linear regression method and cumulative logistic regression to determine the variables that affect the LOS, and finally, a LOS evaluation index system based on threshold schemes was defined. The recommended LOS model can provide corresponding references for traffic engineers who seek to improve the level of service in urban intersections.

1. Introduction

Due to high convenience and low carbon emissions, non-motorized vehicles have become one of the major sustainable trip modes in developing countries, especially in China. For example, the average trips of non-motorized vehicles occupied 33.2% and 30.4% in the cities of Nanjing and Ningbo, respectively. With the rapid development of shared bicycles and electric bikes (e-bikes), a cumulative 23 million shared bicycles and e-bikes were put into the trip market from 2015 to now. Moreover, non-motorized vehicles are often used as transfer modes along the metro and bus lines to better facilitate the travel of passengers. Obviously, the proportion of bicycle and e-bike trips becomes larger in most Chinese cities. The high proportion of non-motorized trips brings some issues about traffic efficiency and safety. Especially at road intersections, the riders of bicycles and e-bikes cross the street against the traffic signal and are threatened by the high risk of traffic accidents.
Traffic intersections are the most complex locations as different traveling directions are desired by different models of travel, such as motorized vehicles, non-motorized vehicles, and pedestrians [1]. All of them want to prioritize themselves because of the lack of road resources which leads to conflicts between them. In the design and practice of signal timing of intersection, the green-signal time is often shared by the same direct movements of pedestrians, vehicles, and non-motorized vehicles. However, bicycles and e-bikes often invade the parallel crosswalk of pedestrians or the vehicular lane and collide with them [2]. The invasion behavior of non-motorized vehicles will inevitably result in a higher risk of traffic conflicts and lower traffic efficiency. The signal timing should take the crossing behavior of invasion into account. In fact, the minimum green-light time provided at an intersection is affected by the need for sufficient time for bicycles and e-bikes to pass through safely. In turn, the green light signal is assigned to another specific movement, which affects the capacity and delay of the intersection.
In addition, a large number of non-motorized vehicles in China has led to lower intersection service level and longer delays. Level of service (LOS) is defined as a qualitative measure to describe the state of an intersection based on some measurable characteristics (e.g., speed of passing through, actual travel time, traffic delay, and so on). Generally speaking, the delay of an intersection is one of the most important parameters for evaluating the LOS of non-motorized vehicles at signalized intersections. Unfortunately, the current LOS methods were formulated for pure traffic flow conditions and traditional delay and LOS models for non-motorized vehicles without considering the crossing behavior and mixed traffic flow, especially the invading behavior and mixed non-motorized traffic flow combing regular bicycles and e-bikes. The applications of traditional LOS methods could not reflect the real situations in mixed traffic conditions in China. The invasion of non-motorized vehicle crossing behavior into other traffic flows could be described by the conflicts among them.
Accordingly, the paper focuses on evaluating the delays of non-motorized vehicles under the specific circumstance of mixed traffic flow and analyzes the LOS of the intersection by considering the conflict between non-motorized vehicles and other behaviors and the perception of non-motorized riders on traffic safety and the efficiency of intersection traffic. The purpose of this research is to evaluate the LOS of non-motorized vehicles at signalized intersections and to comprehensively analyze the influencing factors of LOS based on the conflict and perception data collected from Ningbo, Nanjing, and Guilin, China. The contributions of this article are to improve the delay model in HCM to make it suitable for the current situation of mixed electric vehicles and bicycles at intersections in China and to apply the method of combining cyclist perception and experimental data for modeling LOS of the non-motorized vehicle crossing the signalized intersection. The findings could further improve and better design the crossing facilities at the signalized intersections.

2. Literature Review

LOS as an effective method is applied to design and manage the signal timing and crossing facilities of intersections. It contains several measurable characteristics and the delay is one of the most significant factors which deserve further study.
Related studies on delay and LOS methods focused on the pure bicycle traffic flow on the road segment. By improving the bicycle compatibility index model, Zhao (2014) [3] determined the LOS’s classification standard by analyzing the characteristics of bicycle traffic flow and the influencing factors of cycling. Han (2014) [4] established a LOS evaluation method for non-motorized vehicles based on subjective feelings and the number of over-taking maneuvers. Cao (2015) [5] combined the subjective factors with the physiological characteristics of non-motorized vehicle riders based on the subjective investigation of the non-motorized vehicle LOS. The service level evaluation indicators of non-motor vehicles were selected from both subjective and objective aspects; the grading standards for LOS were determined afterward. Based on the subjective perceptions of the bicycle and pedestrian sharing road traffic survey, an LOS evaluation model was established by Yu et al. (2012) [6] and they also proposed a corresponding grading standard. Yan, Wang, Ye et al. (2018) [7] analyzed the major types of abreast riding and overtaking, and used a binomial logistic model to explore the volume threshold for two-abreast riding as well as the suitable clearances required for comfortable overtaking. Jin, Qu, Zhou et al. (2015) [8] proposed a novel bicycle equivalent unit for e-bike estimation through eight traffic flow fundamental diagrams developed for one-way cycleway capacity estimation and implied that the estimated capacity was independent of a cyclist’s gender and age, but increased with the proportion of e-bikes. Yan, Wang, Chen et al. (2019) [9] analyzed the characteristics of the bicycle–passenger conflicts at bus stops and developed a model to predict the number of conflicts accurately.
Various factors, for instance, peak hour factor, motor vehicle flow, large motor vehicle ratio, pavement condition, the effective width of non-motorized vehicle lanes, and the number of collisions per unit road segment, were considered to establish a bicycle LOS model by Elias (2011) [10]. According to Landis, Vattikuti, Ottenberg et al. (2003) [11], benefitting from the innovative “Ride for Science” field data collection event and video simulations of the Florida Department of Transportation, the new Bicycle LOS model for the main streets was established. The data consisted of participants’ perceptions of how well roadways met their needs as they rode selected arterial roadways and/or viewed simulations of those and other roadways. Kang and Lee (2012) [12] developed a bicycle LOS model by considering the user’s level of satisfaction and multiple factors that affect the bicycle LOS. Griswold, Yu, Filingeri et al. (2018) [13] conducted a survey on cyclist habits, preferences, and user experiences to obtain behavior data. Then, they applied behavioral analysis tools as the proof of concept for a new bicycle LOS measure and combined statistics and behavioral analysis to improve the quality of bicycle level of service measures to make decisions driven by empirically measured cyclist preferences. Liu, Homma, and Iki (2019) [14] introduced and compared two methods for evaluating the quality of bicycle facilities, bicycle compatibility index (BCI) and bicycle level of service (BLOS). Beura, Kumar, and Bhuyan (2017) [15] modeled the quality of services offered to bicycles through movement at urban signalized intersections carrying heterogeneous traffic. A total of six attributes of intersection approaches having significant influences on bicycle service quality were identified with the help of Pearson’s correlation analysis and stepwise regression analysis. Majumdar and Mitra (2018) [16] developed a bicyclist perceived level of service (LOS) criteria by expressing ordered probit (OP) models to assess the quality of bicycle travel from the users’ perspective and develop adequate moderation measures. Beura, Chellapilla, and Bhuyan (2017) [17] applied random forest to identify eight important road attributes affecting the bicycle LOS and proposed a suitable model for urban road segments in mid-sized cities under complex situations. Bicycle LOS measures, thresholds, and estimation procedures for off-street paths, designated bicycle lanes on urban streets, and urban street intersections were provided by The 2016 Highway Capacity Manual. As for urban streets intersections, perceived separation from motorized vehicle traffic, motorized vehicle volumes, cross-street width, and presence and utilization of on-street parking were combined by the bicycle LOS model and, according to the regression model, there were six LOS configurations (A through F) included.
The Highway Capacity Manual 2016 defined bicycle delay with Webster’s model which was based on the assumption that there is no bicycle incremental delay or initial queue delay. The formulation is given below:
d b = 0.5 × C × ( 1 g b C ) 2 1 min [ V b i c C b , 1.0 ] × g b C
where
  • d b is the average delay of the bicycle (s),
  • C is cycle length (s),
  • g b is effective green time for the bicycle lane (s)
  • V b i c is the bicycle flow rate (bicycle/h), and
  • C b is the capacity of the bicycle lane (bicycle/h).
The previous research focused on the LOS of regular bicycles on the segments. Most bicycle delay models did not take the e-bike into account. Especially, in the 2016 HCM model, the pure bicycle LOS was used for the planning, design, and management of the bicycle facilities.

3. Methodology for the Delay Model of the Non-Motorized Vehicle at Signalized Intersections

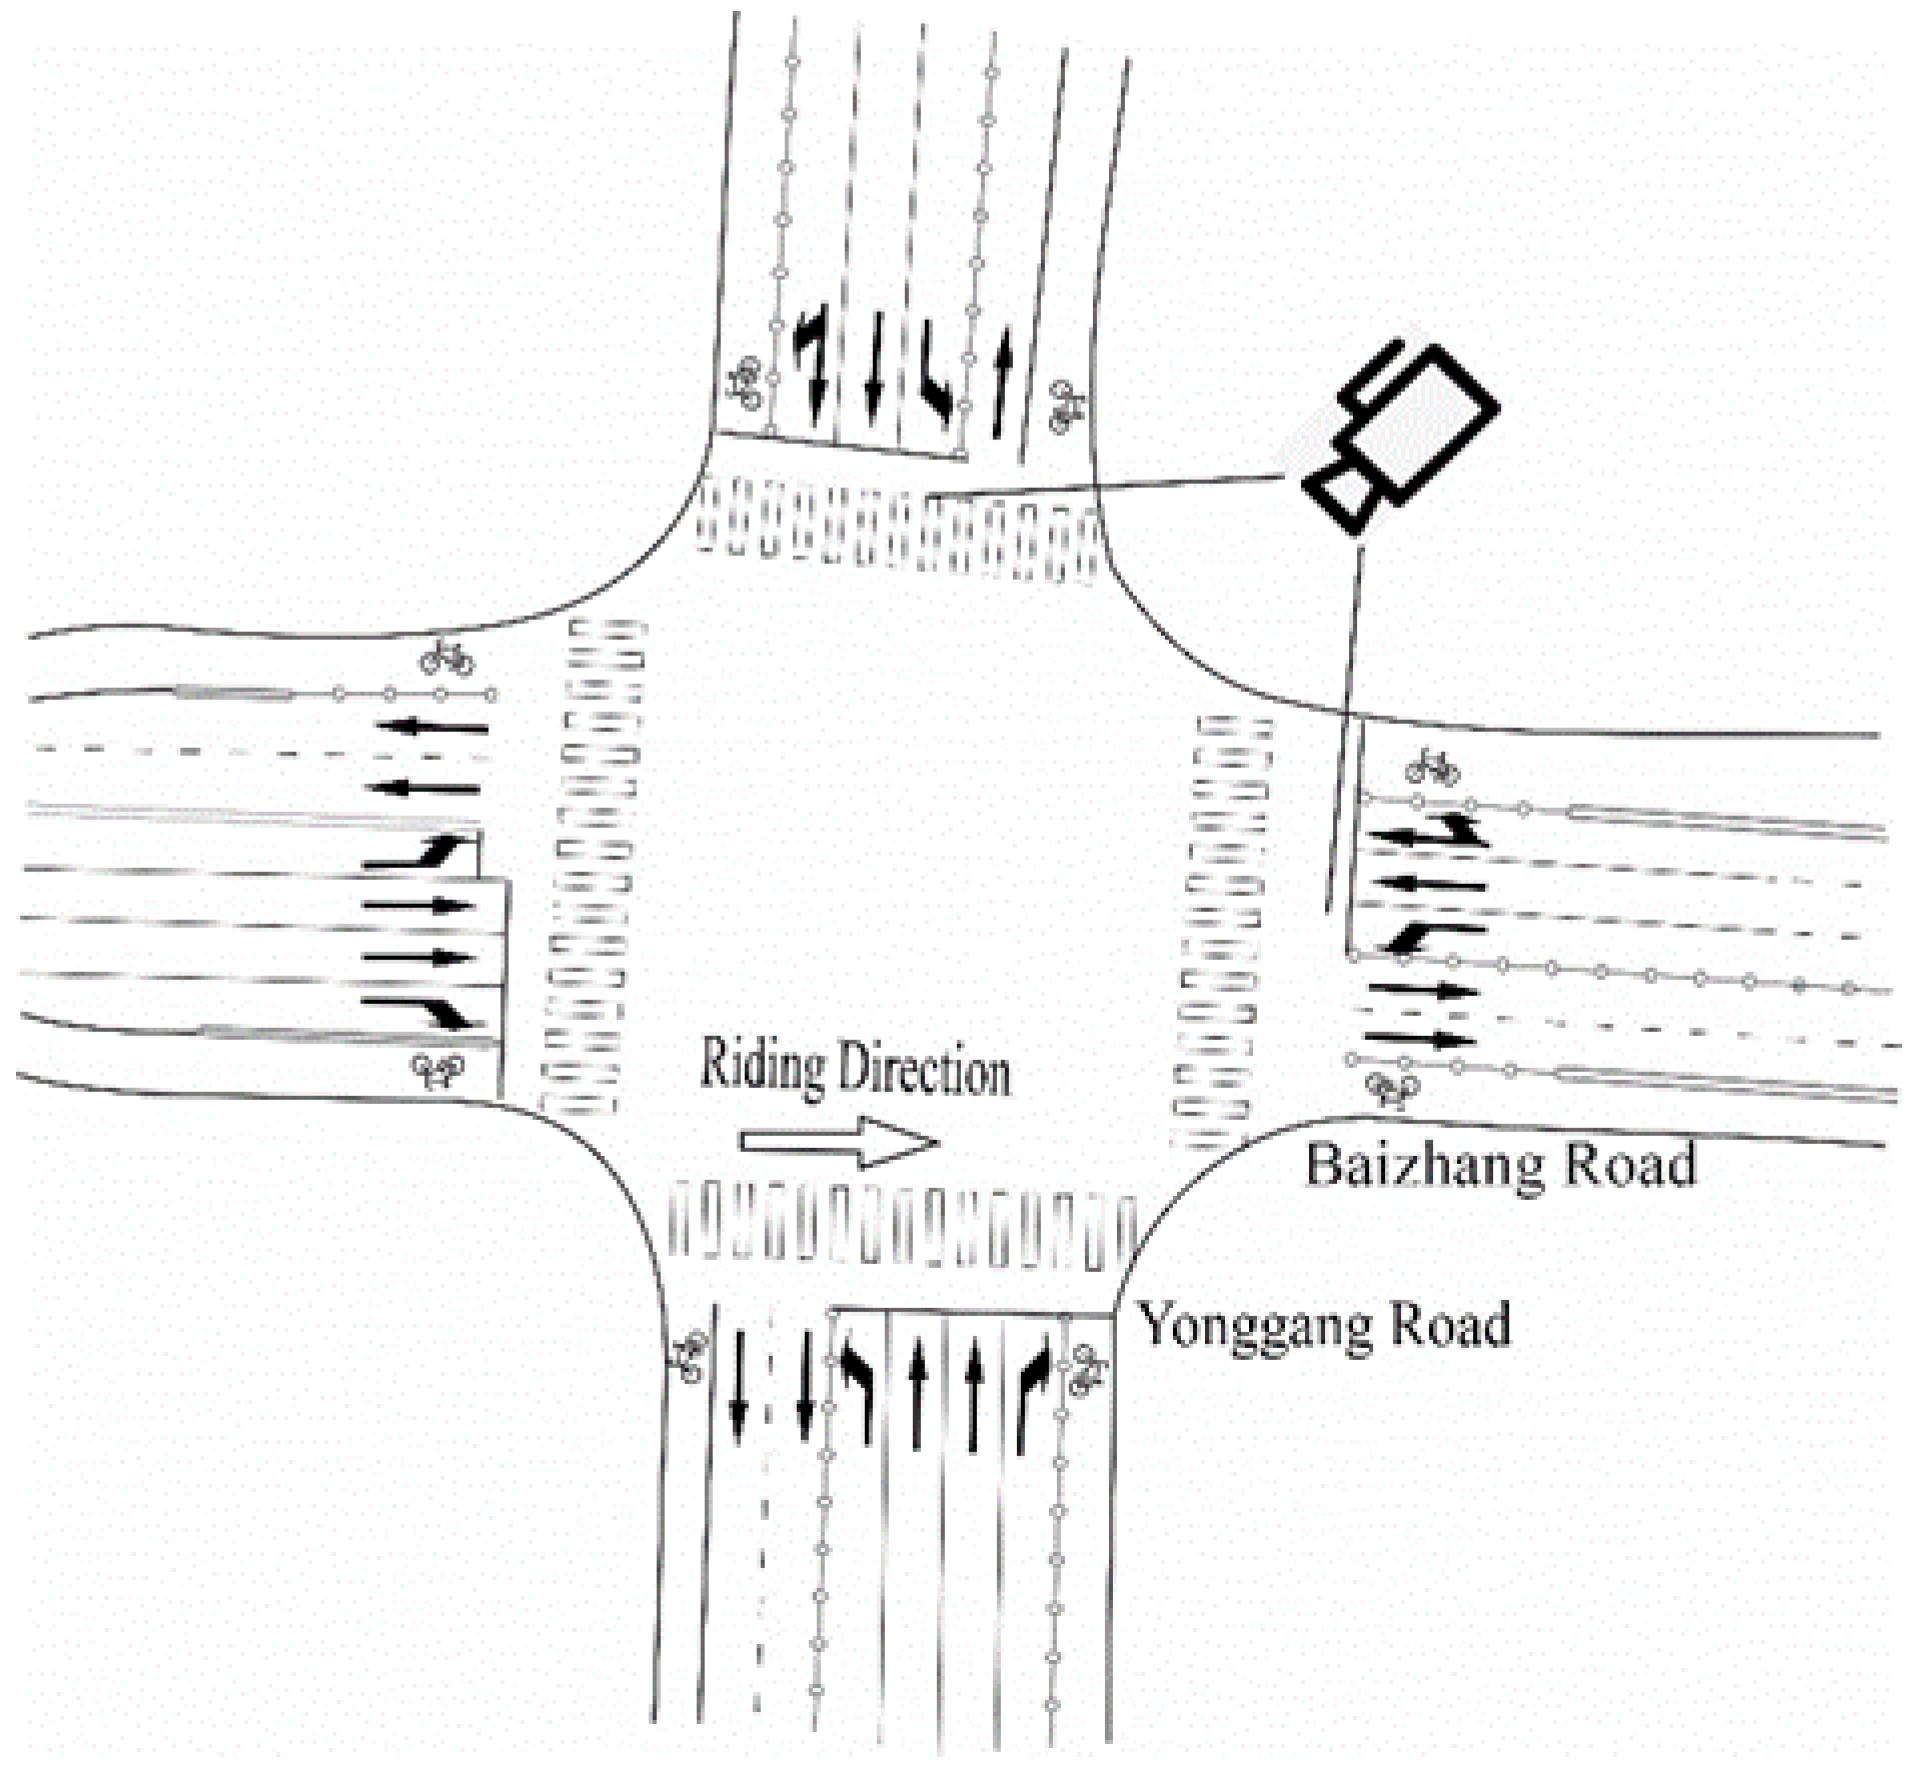
3.1. Data Collection

Since the research objects are the intersections of a typical metropolis in China and the non-motor vehicles passing through, it is necessary to ensure the authenticity and regularity of these two while collecting data. This requires that the selected intersections have typical non-motorized vehicle traffic flow to ensure the authenticity of the data, available crossing facilities to ensure the feasibility of crossing behavior, and of course, signal lights that work normally are also needed. After all, intersections without signal lights only account for a small part of the city, let alone be representative.
Therefore, the data collection sites of this study were selected in 20 entry roads at 10 intersections in different cities in the Chinese mainland: Ningbo, Guilin, and Nanjing. The crossing width and number of lanes of these intersections are different (ranging from 25 m–40 m wide for the crossing width while the number of lanes varies from four to nine), but the common point of these intersections is that they all set special crossing signal phases for non-motorized vehicles to pass through the intersection. Due to the requirements for the amount of analysis data, we choose to collect data in the morning and evening peak times (7:00–9:00; 16:30–18:30) when the traffic flow is large and people have a strong perception about the LOS of crossing the street. The width of the non-motorized lane at the selected intersection ranges from 0–4 m, which is less than a quarter of the road resources occupied by motor vehicles. However, through the subsequent extraction of the data in the video, it is found that the number of right-turning non-motorized vehicles is as high as 2160/h, which is more than four times higher than that of right-turning motor vehicles (the maximum number of right-turning motor vehicles is 450/h). This shows the importance of evaluating the LOS of intersection from the perspective of non-motorized vehicles.

3.2. The Non-Motorized Vehicle Delay Model at Signalized Intersection Crosswalks

Compared with the traditional method of dividing the signal timing into red, yellow, and green periods, this experiment only divides the signal into green phase and non-green phase and records the number of non-motorized vehicles passing through the intersection every 60 s. Considering the non-motorized riders’ compliance with traffic rules and the fuzzy perception of vehicles entering the intersection situation, the delay model of The 2016 Highway Capacity Manual is modified, and two new influencing factors, rule compliance degree, KC, and irregular arrival rate, KNU, are introduced into the model. The degree of rule compliance is expressed by the proportion of the number of non-motorized vehicles in the stop line in the non-green phase. This should be 100% as we expected that all riders follow the rules. However, there are always some riders who choose to stop ahead of the stopping line, especially at intersections with large traffic flow during commutes. This kind of action not only affects the right turn of motorized vehicles but also “manually” increases the number of non-motorized vehicles stranded during the non-green phase, eventually reducing the LOS of the intersection. Thus, Kc was used to take the impact of those “rule breakers” into consideration. The irregular arrival rate is a variable defined by Li (2005) [18], which is determined by the number of non-motor vehicles in the green phase and the total number of non-motorized vehicles.
The updated model is as follows:
d = 0.5 × C × K C × K N U × ( 1 g b C ) 2 1 min [ V C b , 1.0 ] × g b C

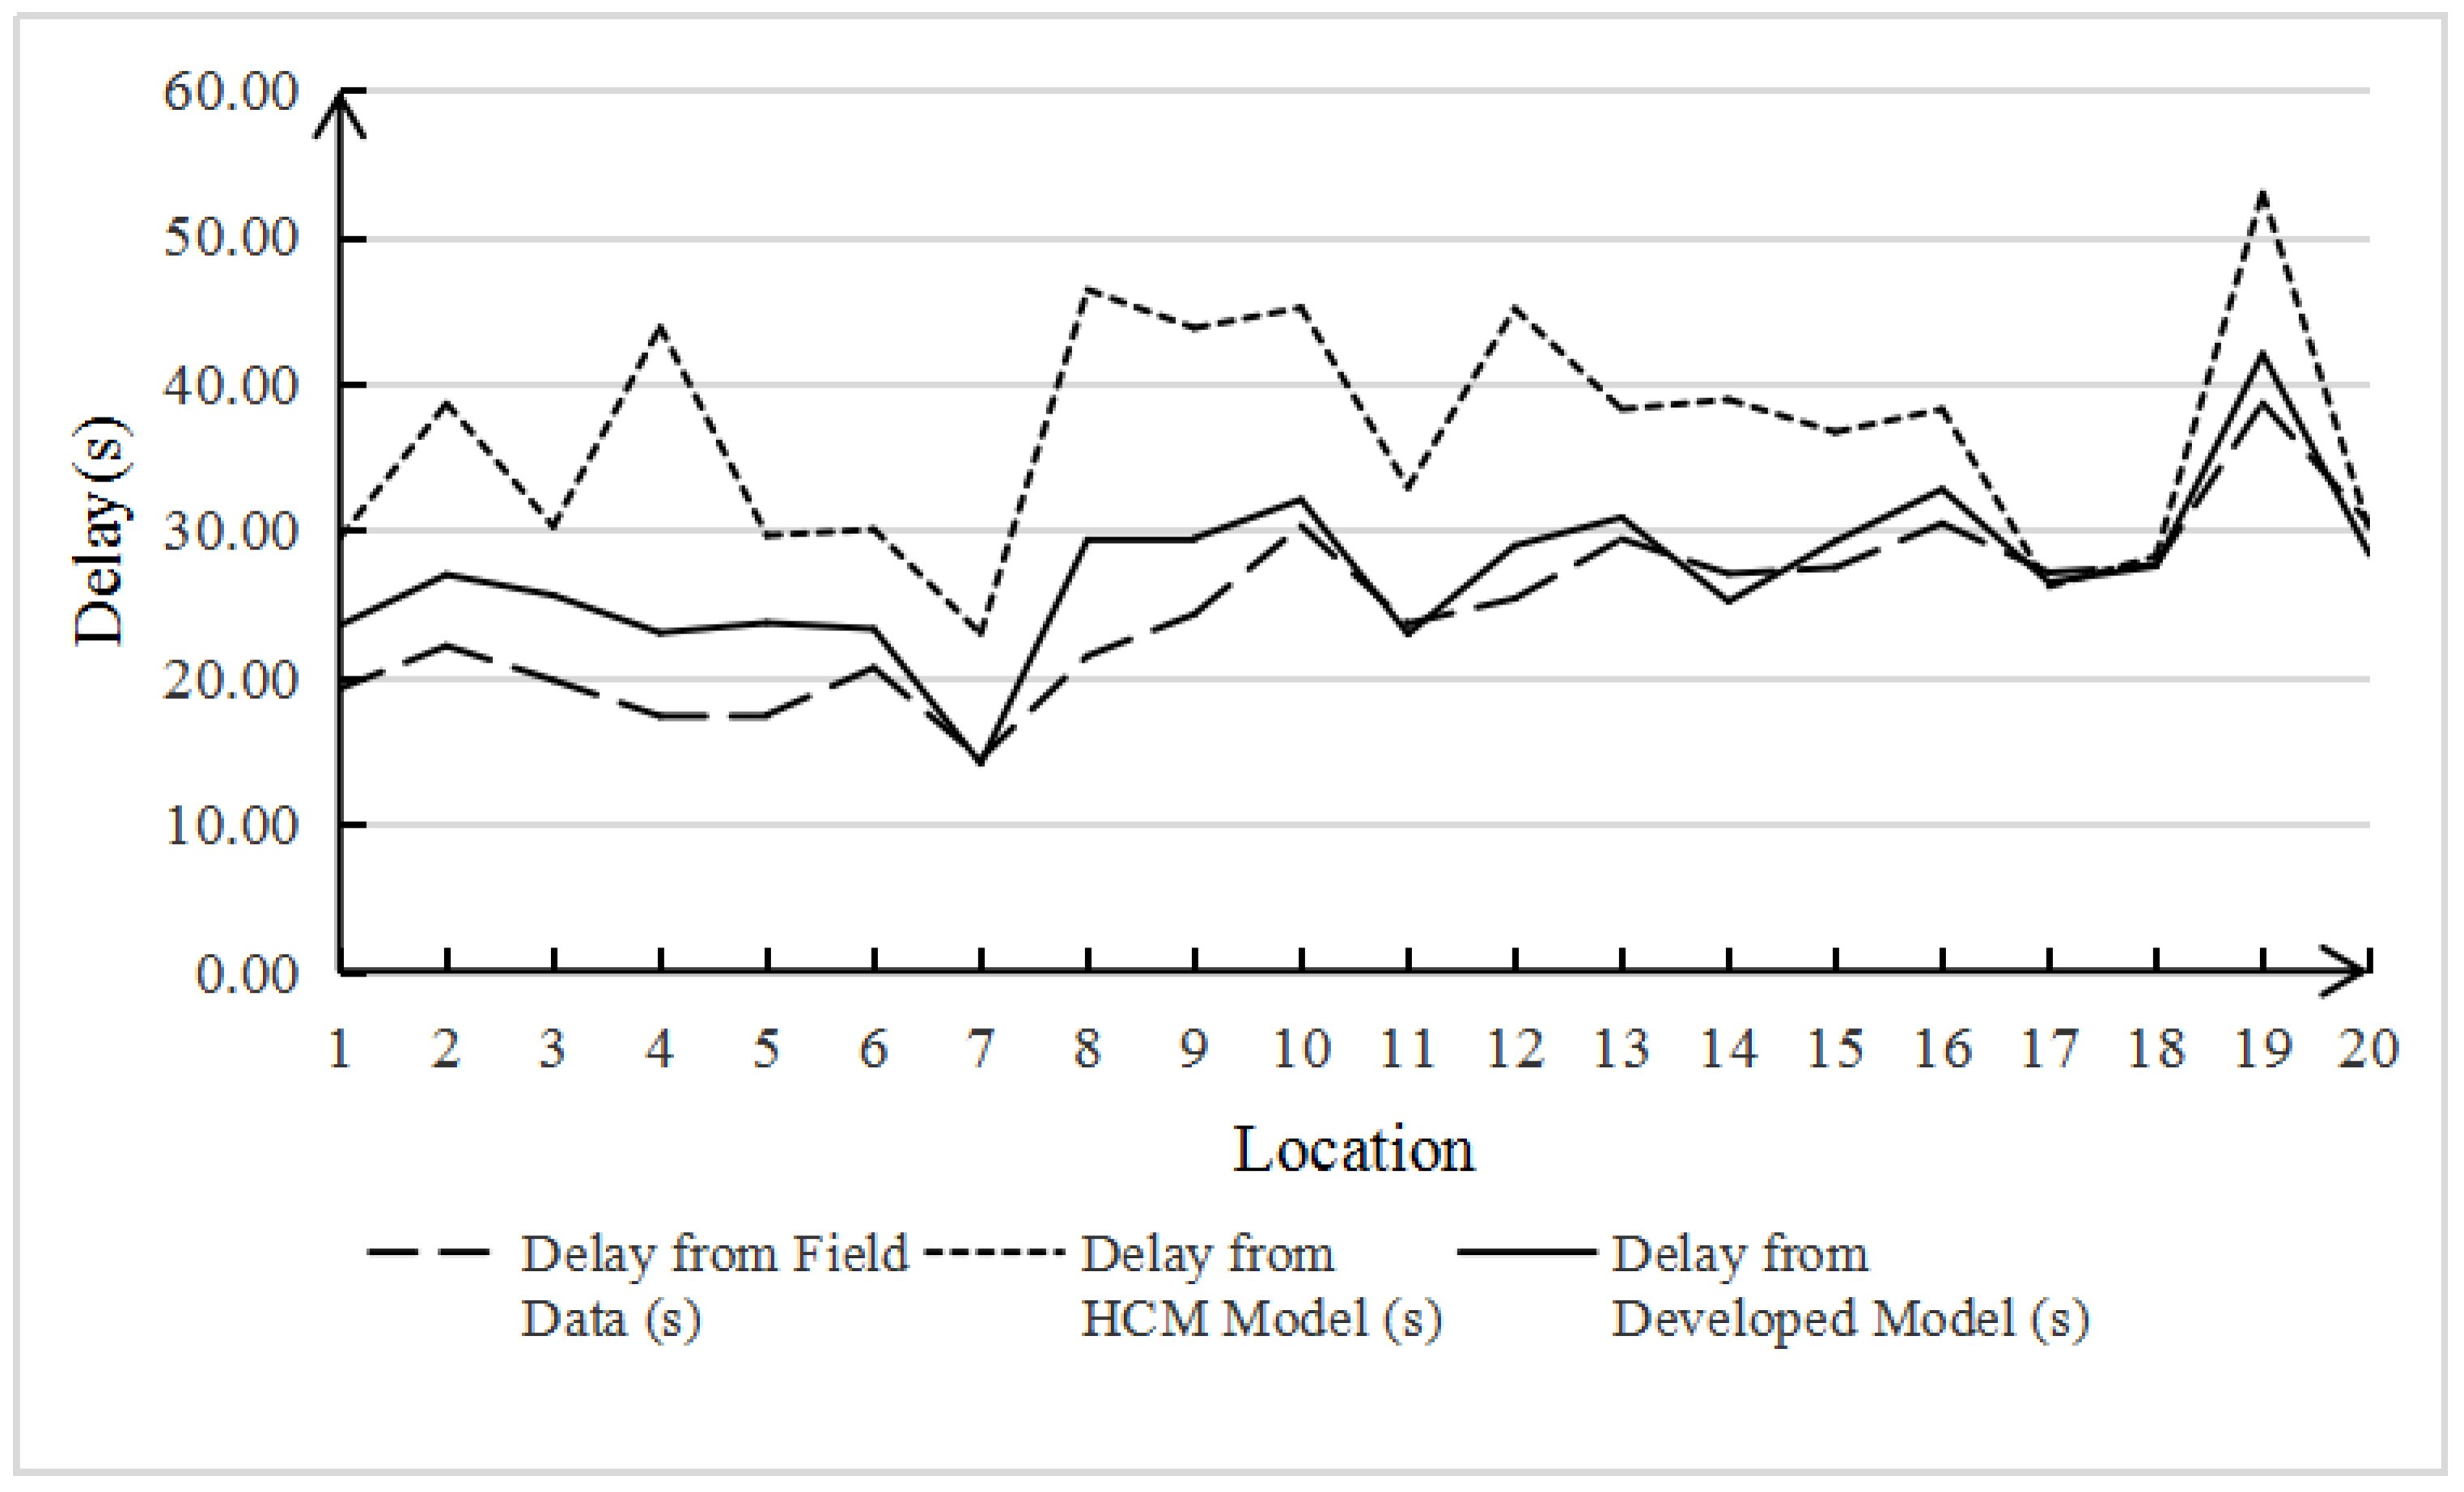
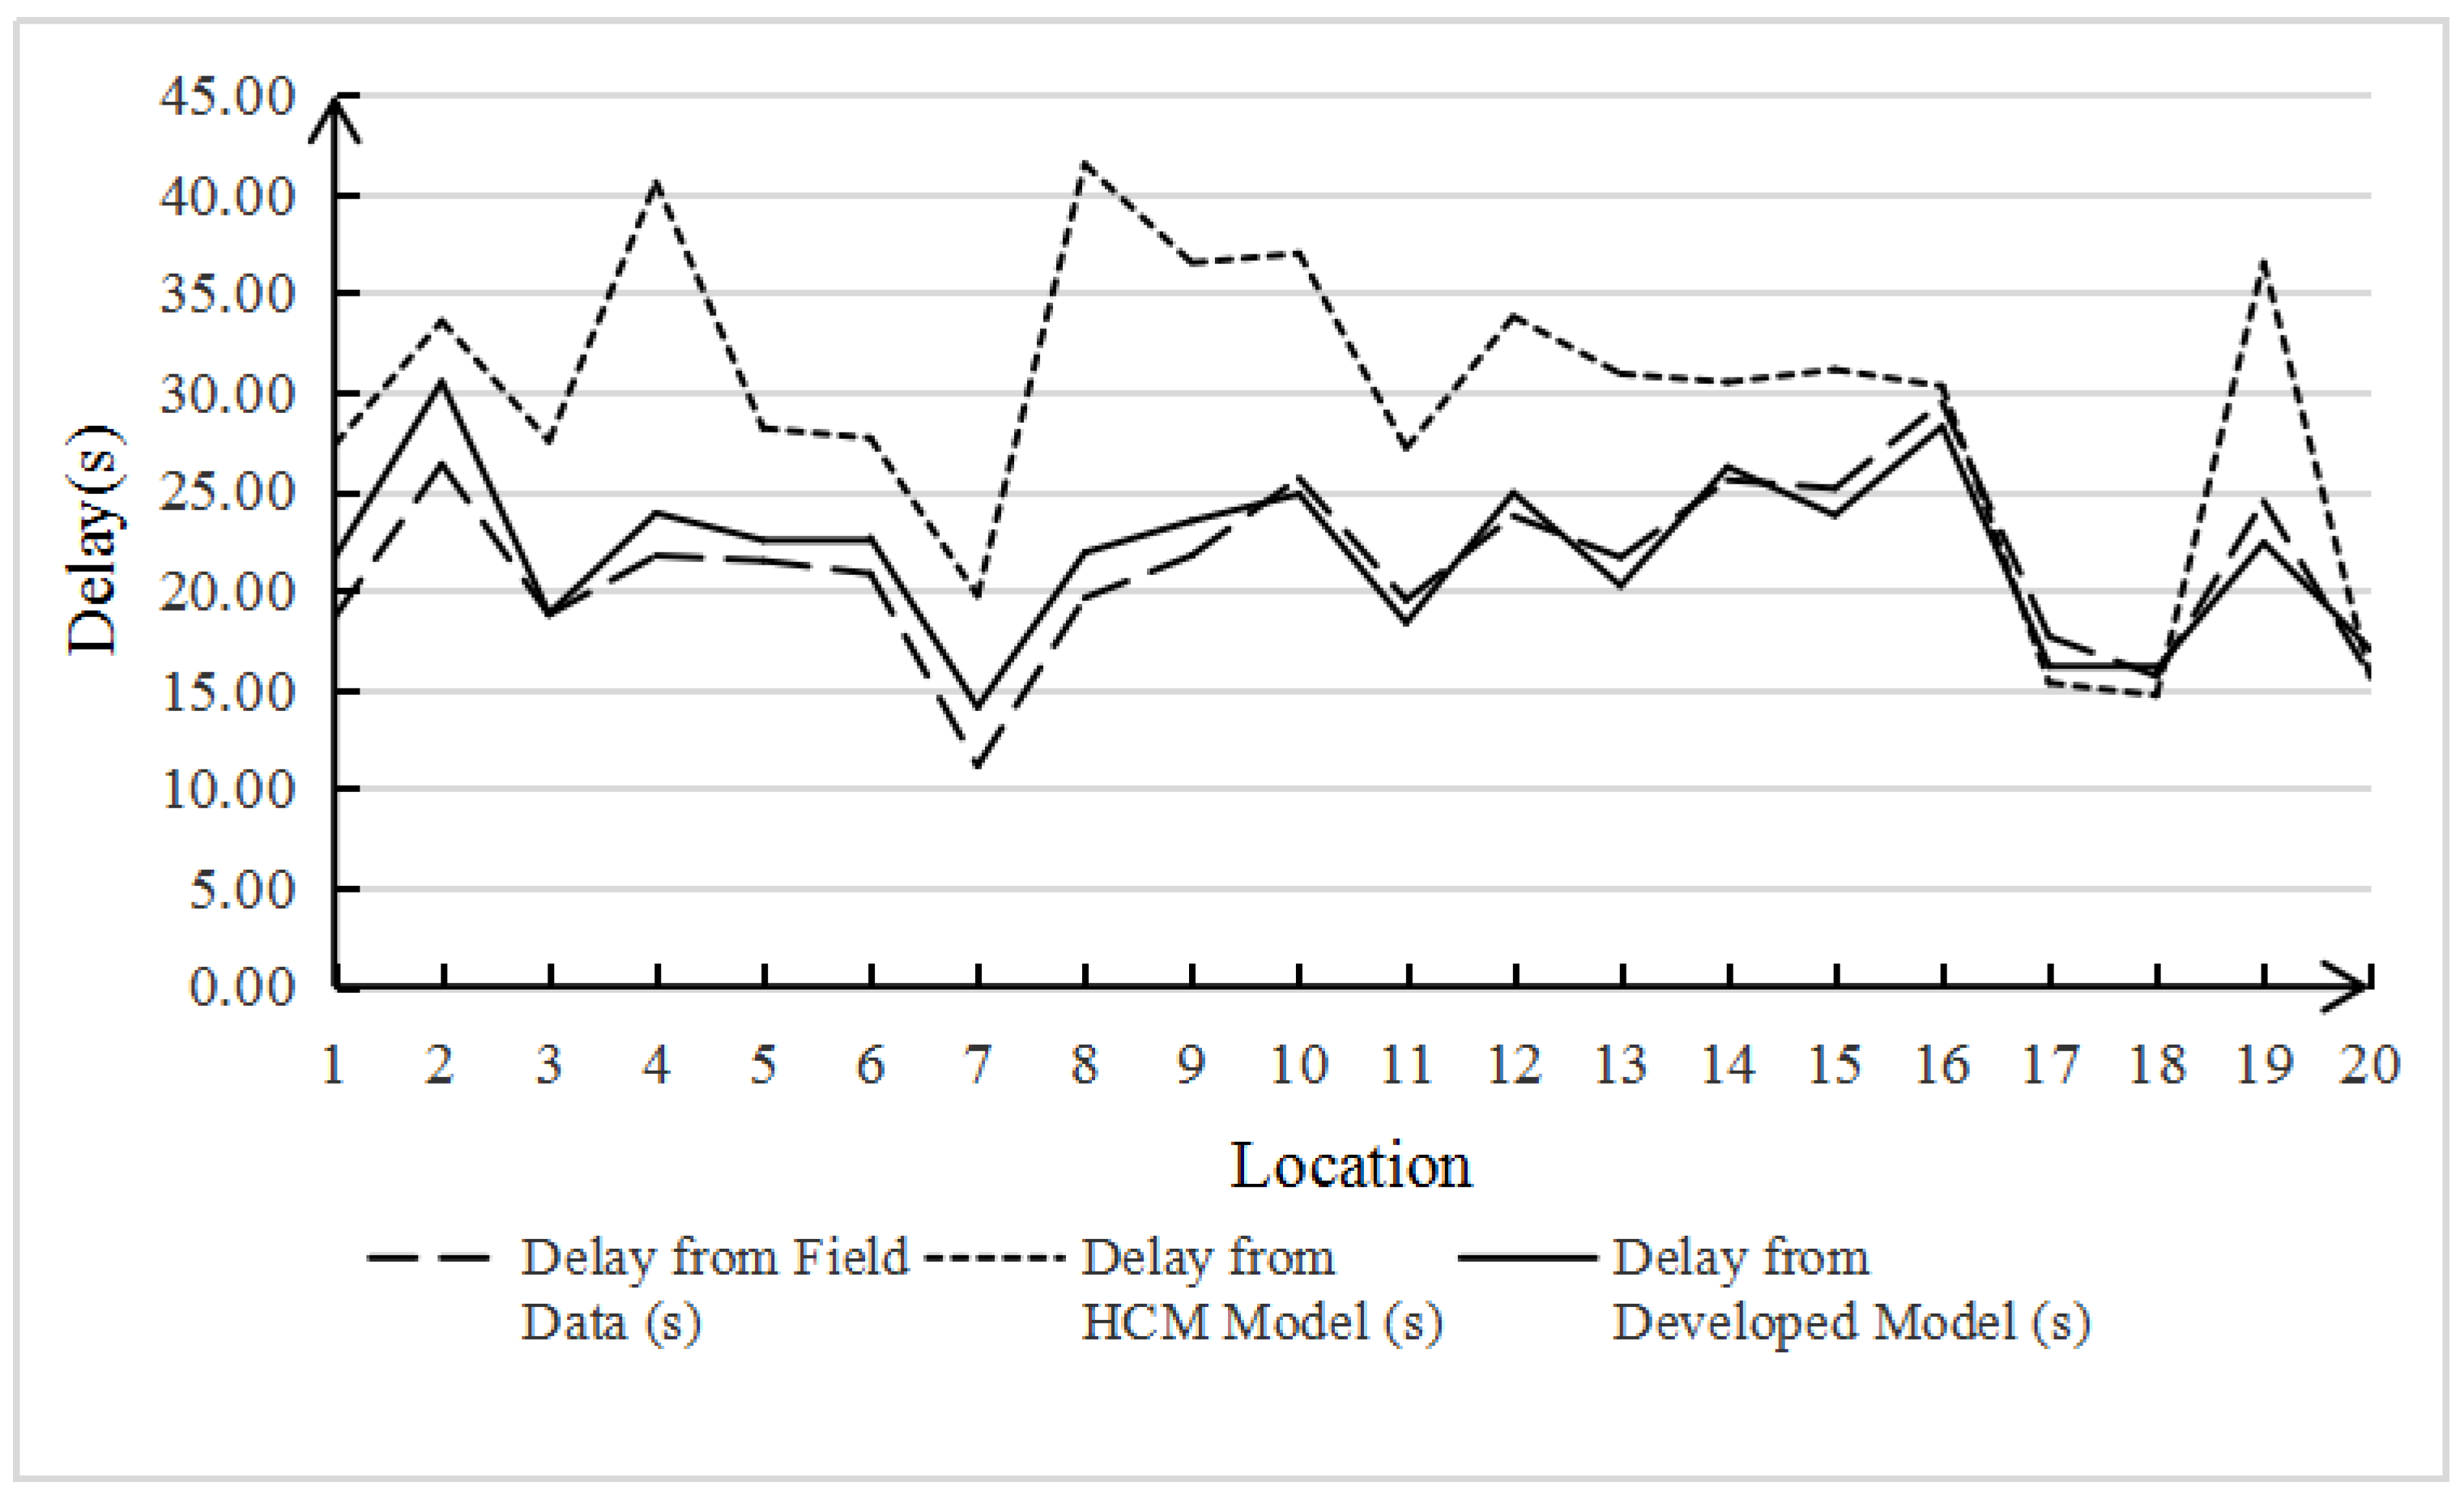
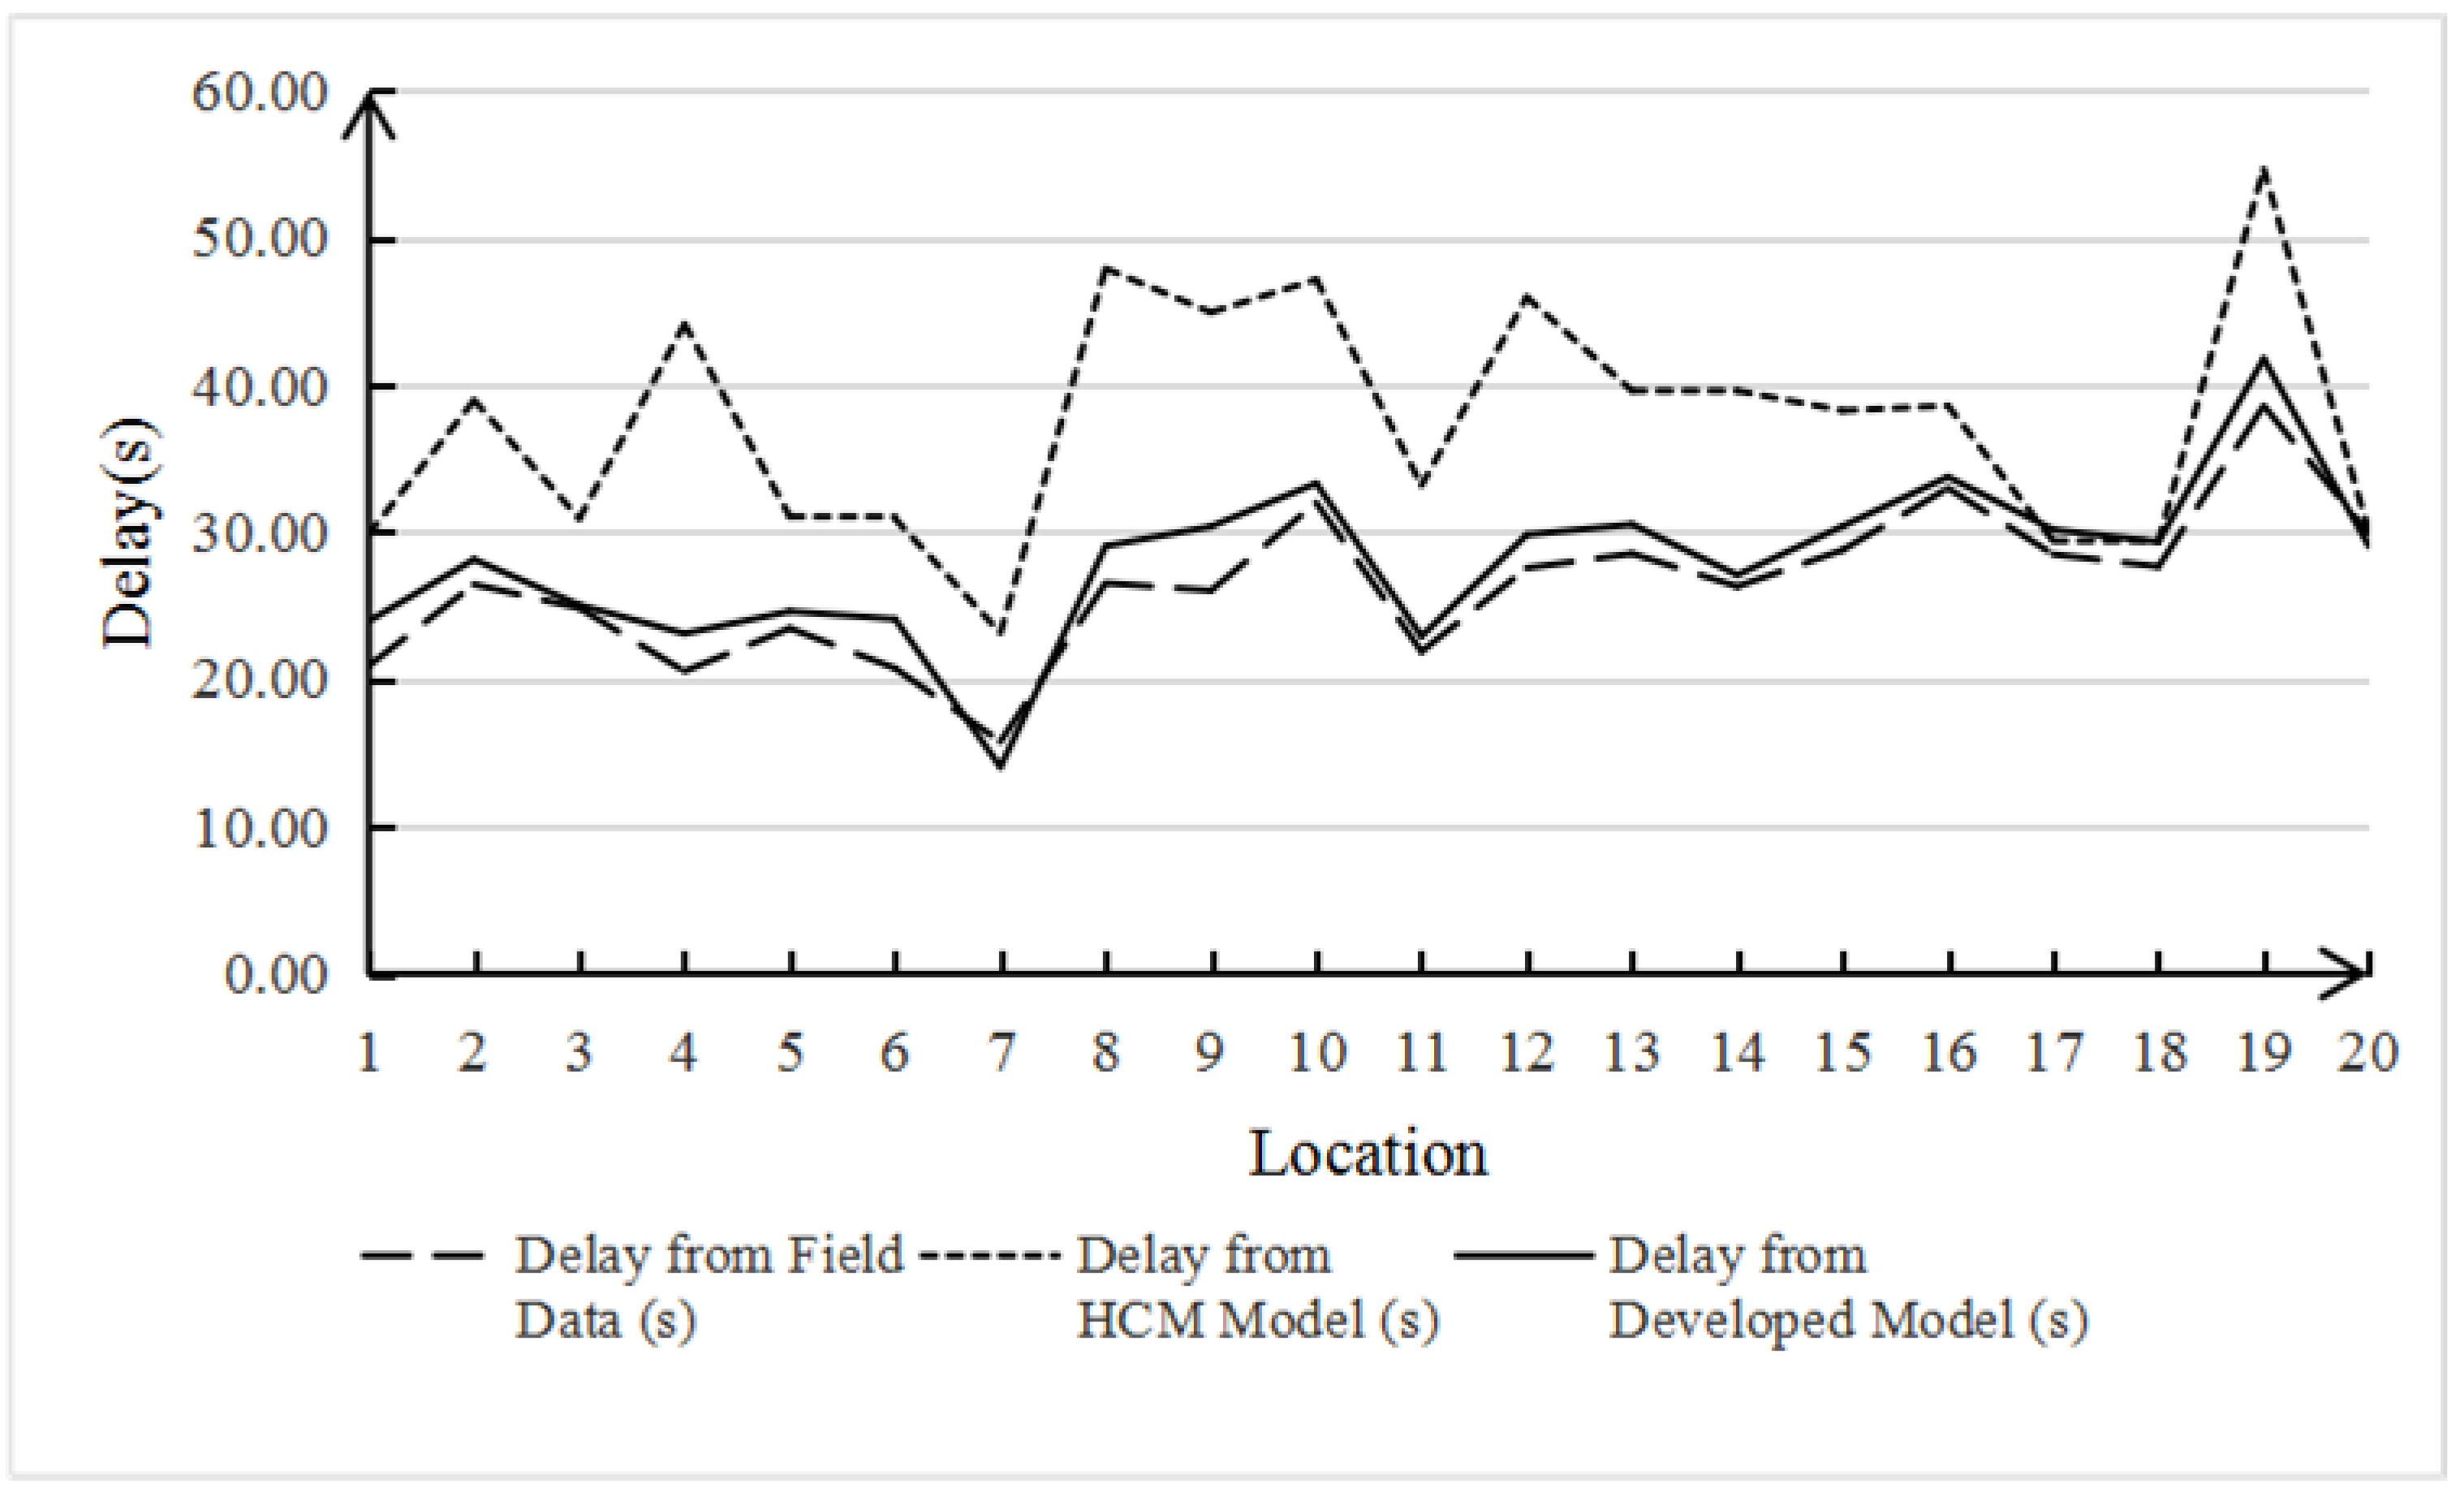
3.3. The Delay Model Results of the Non-Motorized Vehicle

Table 1 shows the data obtained from the field survey. These data are extracted from the video taken by the camera, and the camera erection position is shown in Figure 1. The camera was erected at selected intersections for a continuous week; the camera memory card was replaced twice in the middle, and finally, the data of the captured video were extracted manually. The data in Table 1 are the average value of the data extracted from Monday to Friday with rounded processing of the number of non-motorized vehicles.
The data include intersection signal period, green light phase duration, number of non-motorized vehicles crossing the street, and the number of conflicts related to non-motorized vehicles crossing the street. Conflicts are used to describe the intrusion behavior of non-motorized vehicles crossing the street, which has nothing to do with the model calculation, so they are not included. The actual intersection delay time calculated from these data is different from the value calculated by the HCM initial delay model and Formula (2), which can be clearly seen from either Table 2 or Figure 2, Figure 3 and Figure 4. It is noteworthy that although the results of Formula (2) do not fully agree with the real data, compared with the HCM model with an error rate of 43.34%, the error rate of 7.52% seems to be acceptable, which also proves that the HCM method is not applicable to the mixed non-motor vehicle flow of electric vehicles and non-motorized vehicles. Therefore, we continue to modify the delay model as follows:
d e b = 0.5 × C × K C × K N U × ( 1 g b C ) 2 1 min [ 1.056 × V e b 186.687 C b , 1.0 ] × g b C
d b = 0.5 × C × K C × K N U × ( 1 g b C ) 2 1 min [ 3.875 × V b + 366.456 C b , 1.0 ] × g b C
where C is cycle length (s), g b is effective green time for the bicycle lane (s), V e b is the e-bike flow rate (bike/h), V b is the bicycle flow rate (bicycle/h), C b is capacity of the bicycle lane (bicycle/h), and d e b , d b are the delay of e-bike and bicycle.
Then, the delay model integrated e-bikes with bicycles
d = 0.798 × d e b + 0 . 309 × d b

4. Methodology for LOS Model of the Non-Motorized Vehicle at Signalized Intersection

Crossing facilities, traffic conflicts, and delay act as the three main factors which pose an impact on the LOS of the non-motorized vehicles at the signalized intersection. The proposed delay model of the non-motorized vehicle could be used to calculate the average delay at signalized intersections. After choosing the significant factors influencing LOS, statistical methods were used to select the interdependence between model variables and explanatory variables to establish the integration of multiple variables, and thus remove those insignificant variables.

4.1. Questionnaire of Rider’s Perceptions

Traffic conditions, crossing facilities, and delays were contained in the site investigation at the signalized intersection. In the field investigation, investigators rode e-bikes and bicycles to cross the intersections to obtain actual perception data. The experimental data were used to verify the respondents’ performance.
The video was reviewed and 20 short videos were selected according to the service levels. Then, the volunteers reviewed the videos and assigned a score according to the service levels A–F. Before they watched the video and made evaluations, the researchers explained to the participants the meaning of LOS, and then asked them to ride an electric bicycle or bicycle through the intersection themselves to feel the level of comfort and safety of crossing the intersection. Then, they were asked to use the pre-quantified evaluation parameter standard to express their thoughts. The six letters A–F are used to correspond to six different grades, which are used to express six different street crossing feelings of “excellent”, “good”, “average”, “inferior”, “ poor”, and “very poor” (for example: LOS A = 1, excellent). Considering the operation attributes and their cycling feelings, the intersection is evaluated from the following factors: (1) ride space for the non-motorized vehicles (left and right and front); (2) ability to pass or overtake during cycling; and (3) impact of right-turning motor vehicles. The questionnaire was completed according to the participants’ personal feelings of subjective evaluation, using the six grades of A to F, respectively, on behalf of their riding experience perception. The questionnaire is shown in Appendix A, Table A1.
A total of 400 respondents participated in the survey, 178 females and 222 males. Table 3 shows the gender and age distributions of each survey site and the average user score.

4.2. Representation of Survey Results by a Single LOS Grade

When selecting single-value to analysis research data, the average and mode are usually selected. For this study, selecting the mode can intuitively reflect the service level of the intersection from the perspective of participants, but the mode may not be unique, that is, one intersection corresponds to two LOS, which is very embarrassing for the research results, so it is not mentioned in the article. Although the average does not have two values at the same time, it is vulnerable to extreme values, and for this study, there are almost no intersections with LOS A or LOS F. Take LOS A as an example, to be identified as LOS A required every participant to give the same evaluation of the intersection. Even if a large number of participations chose LOS A, it takes only a few different responses to switch the final result to another one (Table 4).
The rows labeled with LOS 1, LOS 2, and LOS 3 were filled with letters instead of percentage values like the first six lines because of the new fitting approaches. The three new LOS correspond to three different parameters: straight thresholds, thresholds shifted to midpoints, and compressed ranges (Table 5). Using the average value of the six different distributions calculated before, we listed the service levels corresponding to the range of the average value one by one. Then, for each newly defined LOS, LOS A to LOS F can be represented for each corresponding distribution. This means that the six letters from A to F and the six distributions from 1 to 6 are in one-to-one correspondence.
Observing the LOS 1 line, it can be seen that the LOS obtained by replacing the corresponding range of the straight threshold has reached the expected D, E, and F levels for the three distributions of 4, 5, and 6, which also shows that the straight threshold method is not suitable for the three distributions of 1, 2, and 3.
In the same way, for the row labeled LOS 2, which adopts the thresholds shifted to midpoints, the distributions of 4 and 5 have reached the expected level; the distributions of 2 and 3 were improved under this parameter and reached the expected level, but unfortunately, distribution 1 and 6 still performed poorly.
The LOS 3 line that used compressed ranges compresses the range of LOS B to LOS E, leaving more room for LOS A and LOS F. In other words, the range of these two extreme LOS has a higher tolerance which can ensure that a large number of values at the two extremes can be covered by them correctly.
The field data of the non-motorized vehicle was used to verify the LOS 3 threshold approach which led to the conclusion that this approach could produce a reasonable range of LOS. Therefore, the data collection results were reported by this threshold approach.

4.3. Linear Regression Tests

To evaluate the average score obtained by each respondent in the field survey, it is necessary to explore the linear regression technique to determine whether there may be multiple linear relationships.
For the selection of variables in linear regression problems, independent variables are used to evaluate the dependent variables preliminarily selected from a large number of explanatory variables, and the variables irrelevant to the dependent variables are eliminated. The positive stepwise regression method is used to cover the important variables that can improve the prediction ability of the dependent variables of the model and R2 value is used as the proxy of that capability. The adjusted R2 value for the overall model is 0.367, which means only 36.7% of the variation in mean participant ratings could be estimated by the model. In addition, the coefficients were found to be significant at the 95% confidence interval. The results of the stepwise multiple linear regressions are shown in Table 6.
The best-fit model is the mean LOS score of the non-motorized vehicle which can be calculated by:
a 1 × ln ( Q e b ) + a 2 × ln ( Q b ) + a 3 × V b + a 4 × ln ( C r v ) + a 5 × ln ( C p ) + a 6 × d + a 7
where
  • Q e b , Q b are the volume of electric bicycles and bicycles, respectively,
  • V b is the average speed of bicycles passing through,
  • C r v is the number of conflicts between non-motor vehicles and pedestrians,
  • C p is the number of conflicts between non-motor vehicles and right-turning motor vehicles, and
  • d is the delay of non-motorized vehicles passing the intersection calculated by the delay model.
It can be seen from the above model that when the number of non-motor vehicles increases, the LOS decreases. However, at most intersections in China, bicycles account for a small proportion of non-motorized vehicles while electric non-motorized vehicles account for a large portion, so the number of bicycles has little impact on the LOS. Because the e-bikes usually tend to cross the intersections in a group, there is certain collinearity between the e-bikes’ flow and speed. The speed of e-bikes is eliminated in the model. Besides, because the right-turning vehicles are not controlled by signal lights, and tend to slow down to wait for the non-motorized vehicles to advance, therefore, the impact of motor vehicles on non-motor vehicles passing through the intersection is small. The number of conflicts between non-motorized vehicles and pedestrians and the delay of non-motorized vehicles passing through intersections is closely related to the LOS score.

4.4. Limitations of Linear Regression Model

When modeling ordered variables, the linear regression model may not be the best choice. It cannot deal with the situation of more than one dependent variable and the multicollinearity between independent variables, nor can it measure some variables that cannot be measured directly. As for this study, they are variables with strong subjectivity.
In order to avoid these limitations, we also use the cumulative logistic regression method to predict the response probability corresponding to each LOS according to the combination of explanatory variables, and can make full use of the 400 data samples obtained from the field survey, rather than just using the average value of 20 entrances to evaluate the LOS of the intersection.

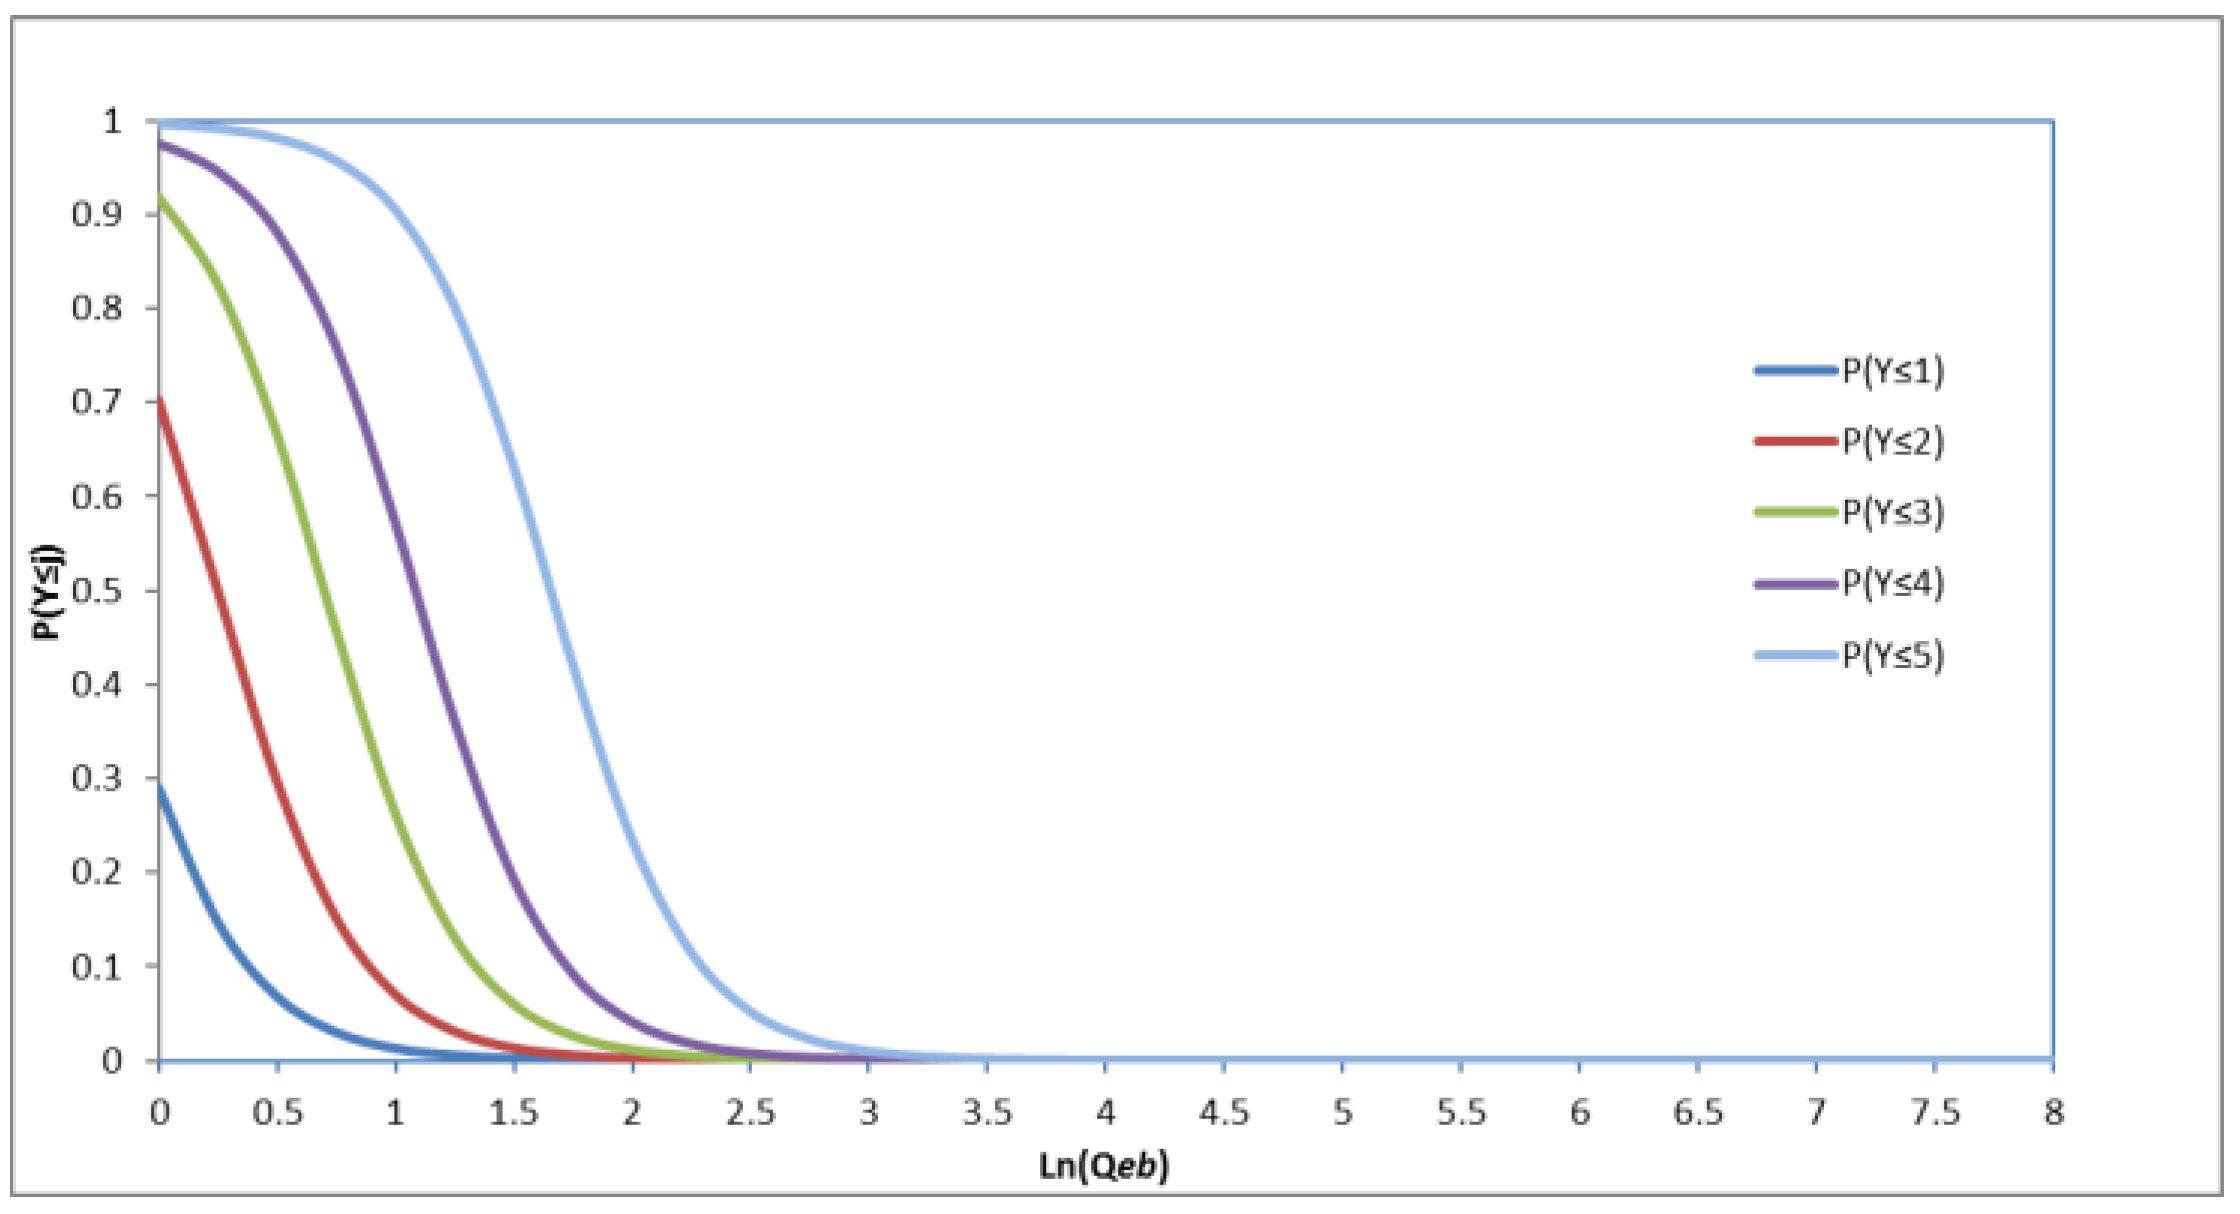
4.5. Cumulative Logistic Regression

Since the quantified LOS index is discrete rather than displaying continuous variables, the linear regression model cannot analyze the data well, so we turn to cumulative logistic regression to solve the problem.
The cumulative probability P ( Y j | x ) is defined as follows:
ln P ( Y j | x ) 1 P ( Y j | x ) = α β ( x )
where
  • P is the probability,
  • γ is ordered variables,
  • j is the score of LOS, and
  • x are explanatory variables of the influential factors.
Under the general circumstances, P ( Y j | x ) = 1 P ( Y j 1 | x ) , so it is not hard to obtain estimated probabilities for all scores. Vector β denotes the vector of coefficients for both LOS ranges and the coefficients of the independent variables considered in the model. Therefore, we modified Equation (8) as follows:
P ( Y j | x ) = exp ( α β ( x ) ) 1 + exp ( α β ( x ) )
Each cumulative probability has its own intercept α j , with the fixed x , α j , and P ( Y j | x ) showing the same upward tendency. For each j within the model, it is assumed that all effects caused by β Q b , β V e b , β V b , β Q v , β C r v , β C p , and β d are equal. In order to make an understandable explanation, we consider the value for Q b , V e b , V b , Q v , C r v , C p , and d as 0 is expected for two scores, j and k, with j < k. After some algebraic operations, the result is as follows:
P ( Y k | Q e b ) = P ( Y j | Q e b + ( α k α j ) / β )
As shown in Figure 5, the value of each α j increases and the value of β is positive for the numbers of the e-bikes. Table 6 illustrates the model coefficients and their significance.
The increasing value of the intercept ensures that each value of rating-num is an integer and the order of cumulative probabilities for a certain value, l, of the number of non-motorized vehicles is in the right order, meaning that:
P ( Y 1 | Q e b = l ) P ( Y 2 | Q e b = l ) P ( Y 3 | Q e b = l ) P ( Y 4 | Q e b = l ) P ( Y 5 | Q e b = l ) 1
As shown in Figure 5, when the number of e-bikes ( Q e b ) increases, riders are more likely to choose a low LOS. For instance, the value P ( Y = 1 ) = P ( Y 1 ) is higher when ln (number of the e-bikes) = 0.5 than when ln = 1, and the value P ( Y = 5 ) = P ( Y 5 ) P ( Y 4 ) is higher when ln = 1 than ln = 0.5. Therefore, it seems that crossing with e-bikes is more likely to get a higher LOS score.

5. Recommended LOS Model of the Non-Motorized Vehicle

The LOS model of non-motorized vehicles provided above evaluates the average satisfaction level of non-motorized vehicle drives with the intersection facilities, in which LOS A means “excellent” and LOS F represents “terrible”.
LOS of the non-motorized vehicle = mean (LOS)
The mean LOS rating can be calculated by Formula 13 below,
mean ( LOS ) = J = 1 6 P ( LOS = J ) × J
The mean LOS number is converted to the average letter grade for the facility (LOS 3 in Table 4 and Table 5) and there are differences between the numerical threshold used for converting the average score to the average LOS letter grade and the score (J) used to calculate the average score.
The probability that a participant will accurately evaluate a given facility as LOS J is equal to the probability that removing evaluations that are worse than LOS J from the cumulative probability of both LOS J evaluations and even worse ones.
P ( L O S = J ) = P ( L O S J ) P ( L O S J 1 )
The cumulative logit model below gives the probability when a participant decides to rate a given facility as LOS J or worse:
P ( Y J ) = 1 1 + exp ( α ( J ) + K β K x K )
where
  • P ( Y J ) is the probability the intersection received an LOS grade J or worse,
  • α ( J ) denotes the maximum numerical threshold for LOS grade J (Table 7),
  • β K is the calibration parameters for attributes (Table 7), and
  • x K is the attributes (k) of the segment or facility (Table 7).
In order to keep the accuracy of the experimental data, the maximum likelihood estimation method is used to calibrate the threshold values ( α ( J ) ) and the attribute equation coefficients ( β K ) by taking the paired facility features and LOS perception data into account.

6. Application and Performance of the LOS Model of the Non-Motorized Vehicle

The developed model is tested at the intersection with the location number 18 in Table 1. Row 18 of Table 8 shows the observed vehicle volume, the non-motorized vehicle volume, collision volume, and delay of the non-motorized vehicle.
m e a n ( L O S ) = J = 1 6 P ( L O S = J ) J = 0.01 1 + 0.05 2 + 0.16 3 + 0.30 4 + 0.37 5 + 0.11 6 = 4.3 = L O S E
As shown in Table 8, the linear regression LOS model matched 55% of the survey data while the logistic LOS model matched 10% higher, at 65%. All factors have a direct impact on LOS. Based on the application and comparison, the recommended logistic model performed with more accuracy.

7. Conclusions

Due to the complex and multidimensional environment, non-motorized vehicles are affected by many factors, which greatly affect their perception of safety, comfort, and convenience. Investigation and research on these factors are necessary to evaluate the facilities of non-motorized vehicles. In addition, a standardized evaluation method is needed to understand the degree of adaptation to non-motorized vehicles at intersections.
This study helps to evaluate the factors that affect the service level of non-motorized vehicles at intersections and proposes a method to determine the LOS of non-motorized vehicles at signalized intersections under mixed traffic conditions. The LOS model recommended can accurately reflect the rider’s perception when crossing a signalized intersection by combining the safety, comfort, and operability perceived by the rider when crossing the street. The field data collected in this study included the participants’ perceptions of safety, comfort, and operability when passing through selected signalized intersections and the resulting model can measure the rider’s views on how the geometric and operational characteristics of the intersection meet their needs.
A delay model of the non-motorized vehicle suitable for mixed traffic conditions was established and verified by measured data. The signal compliance rate and the irregular arrival rate of non-motorized vehicles were considered to improve the non-motorized vehicle delay model in The 2016 Highway Capacity Manual. The average delay was found to be 26.39 s and the average compliance rate of the non-motorized vehicle was 89.68%. The error rate between the delay value predicted by the delay model proposed in this study and the actual value is only 7%, which is 35.82% lower than that predicted by the HCM. Cumulative logistic regression and linear regression methods were developed to identify the significant factors influencing the LOS of the non-motorized vehicle at signalized intersections, including vehicle traffic, non-motorized traffic, conflicts, and the delay of the non-motorized traffic. Due to the limitations of linear regression techniques, cumulative logistic regression was carried out to develop a model suitable for mixed traffic conditions in China. This model can predict the probability of responses within each LOS based on the combination of explanatory variables, and improve the quality of service while separating conflicting vehicles to accommodate cyclists comfortably and safely. Moreover, the LOS model recommended in this paper can be used in other areas of developing countries with large non-motorized vehicle flows. However, a modification is required to Kc because of the differences in the proportion of violations. The LOS model of the non-motorized vehicle provides a measure of the safety and comfort of an intersection relative to the cyclist. Roadway designers can determine how well a particular intersection accommodates non-motorized travel by using the value of the LOS of the non-motorized vehicle at an intersection. This measure will help assess and premeditate the non-motorized vehicles’ travel needs of existing intersections.
The current study is not without limitations. First, traffic data during weekends and holidays were out of our consideration. However, these neglected periods were the time when riders truly prefer intersections with high LOS [19,20]. Next, although the error rate predicted by the modified model was significantly improved, there is still room for improvement. Future research can take more relevant parameters into account, such as the integrity of crossing facilities. Finally, with the development of autonomous driving technology, autonomous vehicles will not only reconstruct people’s travel mode but also affect the intersection service level [21]. Studying the conflicts or interactions between autonomous vehicles and non-motorized vehicles at intersections should be put on the agenda.

Author Contributions

Conceptualization, X.Y. (Xiaofei Ye), Y.Z. and T.W.; methodology, X.Y. (Xiaofei Ye) and Y.Z.; software, X.Y. (Xiaofei Ye); validation, X.Y. (Xiaofei Ye) and Y.Z.; formal analysis, X.Y. (Xiaofei Ye) and Y.Z.; investigation, Y.Z.; resources, X.Y. (Xiaofei Ye) and T.W.; data curation, X.Y. (Xiaofei Ye) and Y.Z.; writing—original draft preparation, X.Y. (Xiaofei Ye); writing—review and Editing, Y.Z.; visualization, X.Y. (Xiaofei Ye); supervision, X.Y. (Xiaofei Ye), J.C., X.Y. (Xingchen Yan), B.R. and T.W.; project administration, X.Y. (Xiaofei Ye); funding acquisition, X.Y. (Xiaofei Ye). All authors have read and agreed to the published version of the manuscript.

Funding

This research was supported by the projects of the Natural Science Foundation of Zhejiang Province, China (no. LY20E080011), the National Natural Science Foundation of China (nos. 71971059, 71701108, and 71861006), the National Key Research and Development Program of China—Traffic Modeling, Surveillance, and Control with Connected and Automated Vehicles (2017YFE9134700), the Natural Science Foundation of Jiangsu Province, China (no. BK20180775), the Natural Science Foundation of Guangxi Province (2020GXNSFAA159153), and the Basic public welfare research project of Zhejiang Province 2018 (LGF18E090005).

Informed Consent Statement

Informed consent was obtained from all subjects involved in the study.

Data Availability Statement

All the data used in this research were collected by questionnaires and presented in Table 1.

Acknowledgments

The authors thank their mentors who provided instruction on writing this paper and the participants for their assistance in the survey.

Conflicts of Interest

The authors declare no conflict of interest.

Appendix A

Table A1. Service Level Questionnaire.
Click “√” in the corresponding space below:
Background information
GenderMaleFemale
Age≤2021–3940–59≥60≤2021–3940–59≥60
Evaluation information
You are asked to evaluate this intersection according to your feeling, consider the running attributes of the road and your riding experience, and evaluate the intersection in the video clip from the following factors:
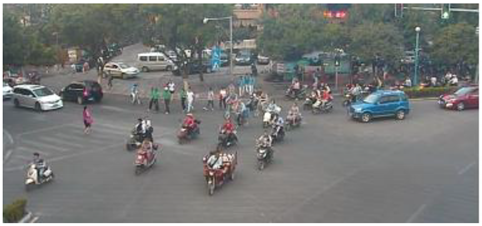
 Ijerph 19 04534 i001
excellentgoodgeneralnot-goodvery badterrible
(1) Ride space for the non-motorized vehicles (left and right and front)
(2) Ability to pass or overtake during cycling
(3) Impact of right-
turning motor vehicles
(4) Other interference
According to the above feelings, score the video, scoring standard:
●  excellent = 1; good = 2; general = 3; not-good = 4; very bad = 5; terrible = 6.
excellentGoodgeneralnot-goodvery badterrible

References

  1. Ye, X.; Chen, J.; Jiang, G.; Yan, X. Modeling Pedestrian Level of Service at Signalized Intersection Crosswalks under Mixed Traffic Conditions. Transp. Res. Rec. 2015, 2512, 46–55. [Google Scholar] [CrossRef]
  2. Wang, T.; Xie, S.; Ye, X.; Yan, X.; Chen, J.; Li, W. Analyzing E-Bikers’ Risky Riding Behaviors, Safety Attitudes, Risk Perception, and Riding Confidence with the Structural Equation Model. Int J Environ Res Public Health. 2020, 17, 4763. [Google Scholar] [CrossRef] [PubMed]
  3. Zhao, X.L. Research on Urban Bicycle Road Service Level. Master’s Thesis, Beijing University of Civil Engineering and Architecture, Beijing, China, 2014. [Google Scholar]
  4. Han, H. Research on Evaluation Method of Mixed-line the Non-motorized Vehicle Service Level. Traffic Transp. (Acad. Ed.) 2014, 2, 125–129. [Google Scholar]
  5. Cao, S.Q. Research on the Service Level of the Non-Motorized Vehicle of Road Sections under Mixed Traffic Flow Conditions. Master’s Thesis, Beijing Industry University, Beijing, China, 2015. [Google Scholar]
  6. Yu, H.; Chen, J.; Xie, Z.Q. Bicycle-Pedestrian Sharing Service Level Research. City Traffic. 2012, 10, 75–79. [Google Scholar] [CrossRef]
  7. Yan, X.; Wang, T.; Ye, X.; Chen, J.; Yang, Z.; Bai, H. Recommended Widths for Separated Bicycle Lanes Considering Abreast Riding and Overtaking. Sustainability 2018, 10, 3127. [Google Scholar] [CrossRef] [Green Version]
  8. Jin, S.; Qu, X.; Zhou, D.; Xu, C.; Ma, D.; Wang, D. Estimating cycleway capacity and bicycle equivalent unit for electric bicycles. Transp. Res. Part A Policy Pract. 2015, 77, 225–248. [Google Scholar] [CrossRef]
  9. Yan, X.; Wang, T.; Chen, J.; Ye, X.; Yang, Z.; Bai, H. Analysis of the Characteristics and Number of Bicycle-Passenger Conflicts at Bus Stops for Improving Safety. Sustainability 2019, 11, 5263. [Google Scholar] [CrossRef] [Green Version]
  10. Elias, A. Automobile-Oriented or Complete Street? Transp. Res. Rec. J. Transp. Res. Board 2011, 2257, 80–86. [Google Scholar] [CrossRef]
  11. Landis, B.W.; Vattikuti, V.R.; Ottenberg, R.M.; Petritsch, T.A.; Guttenplan, M.; Crider, L.B. Intersection Level of Service for the Bicycle Through Movement. Transp. Res. Rec. J. Transp. Res. Board 2003, 1828, 101–106. [Google Scholar] [CrossRef]
  12. Kang, K.; Lee, K. Development of a bicycle level of service model from the user’s perspective. KSCE J. Civ. Eng. 2012, 16, 1032–1039. [Google Scholar] [CrossRef]
  13. Griswold, J.B.; Yu, M.; Filingeri, V.; Grembek, O.; Walker, J.L. A behavioral modeling approach to bicycle level of service. Transp. Res. Part A Policy Pract. 2018, 116, 166–177. [Google Scholar] [CrossRef]
  14. Liu, Q.; Homma, R.; Iki, K. Utilizing Bicycle Compatibility Index and Bicycle Level of Service for Cycleway networks. MATEC Web Conf. 2019, 259, 03005. [Google Scholar] [CrossRef]
  15. Beura, S.K.; Kumar, N.K.; Bhuyan, P.K. Level of Service for Bicycle Through Movement at Signalized Intersections Operating Under Heterogeneous Traffic Flow Conditions. Transp. Dev. Econ. 2017, 3, 21. [Google Scholar] [CrossRef]
  16. Majumdar, B.B.; Mitra, S. Development of Level of Service Criteria for Evaluation of Bicycle Suitability. J. Urban Plan. Dev. 2018, 144, 04018012. [Google Scholar] [CrossRef]
  17. Beura, S.K.; Chellapilla, H.; Bhuyan, P.K. Urban road segment level of service based on bicycle users’ perception under mixed traffic conditions. J. Mod. Transp. 2017, 25, 90–105. [Google Scholar] [CrossRef] [Green Version]
  18. Li, Q.; Wang, Z.; Yang, J.; Wang, J. Pedestrian delay estimation at signalized intersections in developing cities. Transp. Res. Part A Policy Pract. 2005, 39, 61–73. [Google Scholar] [CrossRef]
  19. Ye, X.; Yan, X.; Chen, J.; Wang, T.; Yang, Z. Impact of Curbside Parking on Bicycle Lane Capacity in Nanjing, China. Transp. Res. Rec. 2018, 2672, 120–129. [Google Scholar] [CrossRef]
  20. Ye, X.; Yang, C.; Wang, T.; Yan, X.; Li, S.; Chen, J. Research on parking app choice behavior based on MNL. Travel Behav. Soc. 2021, 25, 174–182. [Google Scholar] [CrossRef]
  21. Wang, J.; Gong, S.; Peeta, S.; Lu, L. A real-time deployable model predictive control-based cooperative platooning approach for connected and autonomous vehicles. Transp. Res. Part B Methodol. 2019, 128, 271–301. [Google Scholar] [CrossRef]
Figure 1. Setting details for observation.
Ijerph 19 04534 g001
Figure 2. Comparative analysis of e-bike delay.
Ijerph 19 04534 g002
Figure 3. Comparative analysis of bicycle delay.
Ijerph 19 04534 g003
Figure 4. Comparative analysis of the non-motorized vehicle delay.
Ijerph 19 04534 g004
Figure 5. Example cumulative logit distribution of LOS.
Ijerph 19 04534 g005
Table 1. Characteristics of Data Collection.
LocationCycle Time
(s)
Green Time
(s)
Number of the Non-Motorized Vehicles Arriving during Non-Green PhaseNumber of the Non-Motorized Vehicles Arriving
During Green Phase
Signal
Compliance Rate
E-BikeBicycleE-BikeBicycleE-BikeBicycle
11506017925157230.8989 0.9122
2150502571622380.8696 0.9090
31506024035192400.9125 0.8795
41504014612190120.8864 0.8636
51506016178151660.9297 0.8854
61506021454194420.8860 0.8733
71255527115389150.8392 0.8000
81504021940237560.9666 0.9290
91857040543475570.9090 0.9302
101857049875502850.8872 0.8909
111506033511385130.8987 0.8847
121505041725495230.9363 0.9433
131505553858422620.9125 0.8571
141505548835532250.8563 0.9333
151505547283338670.8667 0.8744
161505558019380110.8989 0.9326
1712565738100612800.8875 0.9112
181256577534695260.8889 0.9231
191857084244718560.9136 0.8667
2012565978120972900.9053 0.9217
Table 2. Delay Model Validation.
LocationDelay from Field Data (s)Delay from HCM Model (s)Delay from Developed Model (s)
E-BikeBicycleE-BikeBicycleE-BikeBicycle
119.2218.6329.4760 27.3279 23.5257 21.6394
222.1326.3538.6313 33.5635 26.9800 30.5092
319.818.7630.2691 27.5159 25.5746 18.8224
417.3521.7443.8406 40.5651 23.0260 23.8855
517.4421.4829.6424 28.1585 23.7015 22.5077
620.6520.8330.0668 27.6639 23.2875 22.6490
714.4611.1322.9688 19.7315 14.1332 14.0940
821.4519.646.3754 41.4708 29.3570 21.8900
924.2921.7543.7672 36.5037 29.4550 23.4885
1030.3125.6545.1494 36.9758 32.0905 24.8406
1123.6619.532.9268 27.1630 22.9470 18.3571
1225.3623.7445.0799 33.7968 28.9488 24.9067
1329.4121.6538.2415 30.9075 30.8778 20.2167
1427.0425.5538.9009 30.4899 25.1636 26.2096
1527.4625.1336.6870 31.1207 29.2554 23.7746
1630.4729.4738.2415 30.2852 32.7922 28.2440
1727.1317.6526.1818 15.3191 26.4636 16.1560
1827.6415.6728.2353 14.6939 27.5669 16.0130
1938.6624.4852.9530 36.5037 42.0056 22.3941
2030.4515.6530.0000 15.4839 28.377716.9899
Table 3. Gender and Age Distribution and Average User Score of Each Survey Site.
Site IDNumber of ParticipantsNumber of MalesNumber of FemalesPercentage by Age Group (Years)Average User Score
≤2021–3940–59≥60
12081248621.30
22013729541.45
320101047722.45
420911510412.00
52011935752.95
62012858432.60
72091139623.80
82081247723.85
920101056543.95
10201010211613.80
112012837913.55
122014646733.40
132091118653.80
1420713310524.50
152012845744.25
1620119210624.20
172081237554.50
1820101047634.30
192014638634.30
2020101046734.30
Table 4. Representation of Survey Results by a Single LOS Grade: Distributions and Mean of LOS.
LOSResults by Distribution
123456
A60%10%NANANANA
B26%67%20%18%NANA
C14%23%35%25%14%8%
DNA10%30%34%28%19%
ENANA15%23%40%36%
FNANANANA18%37%
1BCDDEF
2BBCDEE
3ABCDEF
Note: NA = not available; mean for distributions 1–6, respectively: 1.54, 2.13, 3.40, 3.62, 4.62, and 5.02; mode for distributions 1–6, respectively: 1, 2, 3, 4, 5, and 6.
Table 5. Representation of Survey Results by a Single LOS Grade: LOS Mean Value Threshold Schemes.
LOSNumerical ValueLOS 1, Straight
Thresholds
LOS 2, Thresholds
Shifted to Midpoints
LOS 3, Compressed
Ranges
A1Mean ≤ 1.00Mean ≤ 1.50Mean ≤ 2.00
B21.00 < Mean ≤ 2.001.50 < Mean ≤ 2.502.00 < Mean ≤ 2.75
C32.00 < Mean ≤ 3.002.50 < Mean ≤ 3.502.75 < Mean ≤ 3.50
D43.00 < Mean ≤ 4.003.50 < Mean ≤ 4.503.50 < Mean ≤ 4.25
E54.00 < Mean ≤ 5.004.50 < Mean ≤ 5.504.25 < Mean ≤ 5.00
F65.00 < Mean5.50 < Mean5.00 < Mean
Table 6. Multiple Linear Regression Model.
ModelModel EstimateCoefficientSESig
Q e b a 1 2.1320.3730.000
Q b a 2 0.1200.1270.044
V b a 3 0.0710.1090.013
C r v a 4 −1.1710.4150.005
C p a 5 0.7610.2840.008
d a 6 0.0390.0170.023
Constant a 7 −9.9061.1390.000
Table 7. Maximum Likelihood Estimates for LOS Model.
ParameterEstimateSEWaldDFSig95% Confidence Interval
Lower BoundUpper Bound
Intercept 119.4342.10185.59410.00015.31723.551
Intercept 221.1932.13398.76710.00017.04125.373
Intercept 322.7432.176109.19310.00018.47727.009
Intercept 424.0682.207118.95110.00019.74328.393
Intercept 526.0382.241134.95710.00021.64530.431
Q e b , β Q e b 3.4440.63929.06310.0002.1924.697
Q b , β Q b 0.6660.17514.52310.0000.3241.009
V e b , β V e b 0.3190.1952.67310.102−0.0630.702
V b , β V b 0.0400.1820.04910.826−0.3160.396
Q v , β Q v 0.1730.2100.68310.408−0.2380.584
C r v , β C r v −1.7960.6926.73410.009−3.153−0.440
C p , β C p 1.2570.4786.91310.0090.3202.193
d , β d −0.0670.0285.645310.018−0.122−0.012
Table 8. Evaluation of Proposed LOS Model of The Non-motorized Vehicle.
Survey NumberValues by VariableSurvey LOSLinear Model LOSLogistic Model LOS
Q v
(pcu/h)
Q e b
(e-bike/h)
Q b
(bicycle/h)
C r v C p V e b
(m/s)
V b
(m/s)
d (s)
112033648113753.963.2220.92AAB
2144480241751215.162.7326.44ABB
3192432751961064.023.2224.83BBB
416833624120555.792.3520.54AAA
5216312144103894.842.9423.46CBB
6144408962502063.892.2720.74BBB
7450660302751605.193.2915.77DBD
8264456961521424.912.5626.53DCC
9808801002751254.353.3426.02DCD
1034010001603902205.874.5031.98DDE
11168720242141504.912.5021.88DCD
1272912483941224.852.8027.55CCC
133909601203741764.944.0328.53DDD
141201020603602034.143.6326.30EDD
154508101502901305.013.6428.77DCD
16240960302681824.152.9032.97DDC
1718013501804502024.043.2528.48EEE
183601470604812143.932.2227.65EDE
1940015601004411794.982.6538.57EEE
2027019502105842563.612.4629.88EEE
Publisher’s Note: MDPI stays neutral with regard to jurisdictional claims in published maps and institutional affiliations.

