
Enhanced Nutrient Removal in A2N Effluent by Reclaimed Biochar Adsorption


Abstract
:1. Introduction
2. Materials and Methods
2.1. Preparation of the Biochar
2.2. Biochar Characterization
2.3. Wastewater Contaminates Adsorption and Degradation Test
2.4. Temperature and pH Influence Test
2.5. Chemical Analysis
2.6. Analysis of Adsorption Kinetics and Adsorption Isotherm
3. Results and Discussions
3.1. Biochar Characteristics
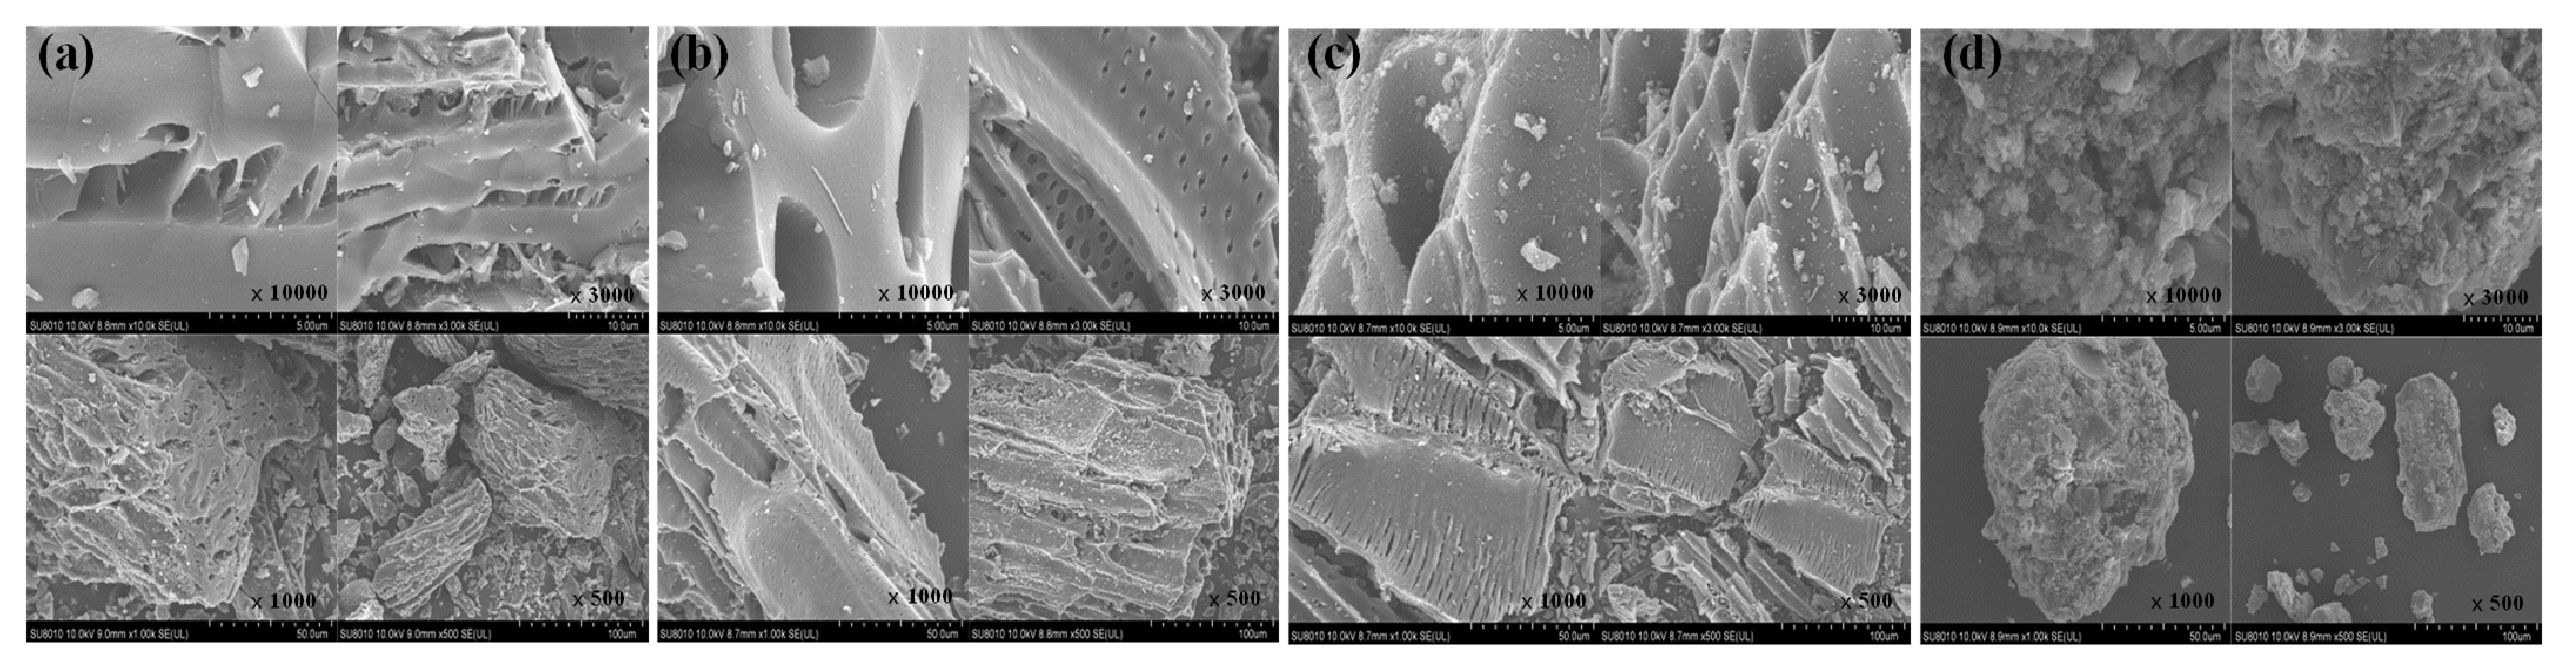
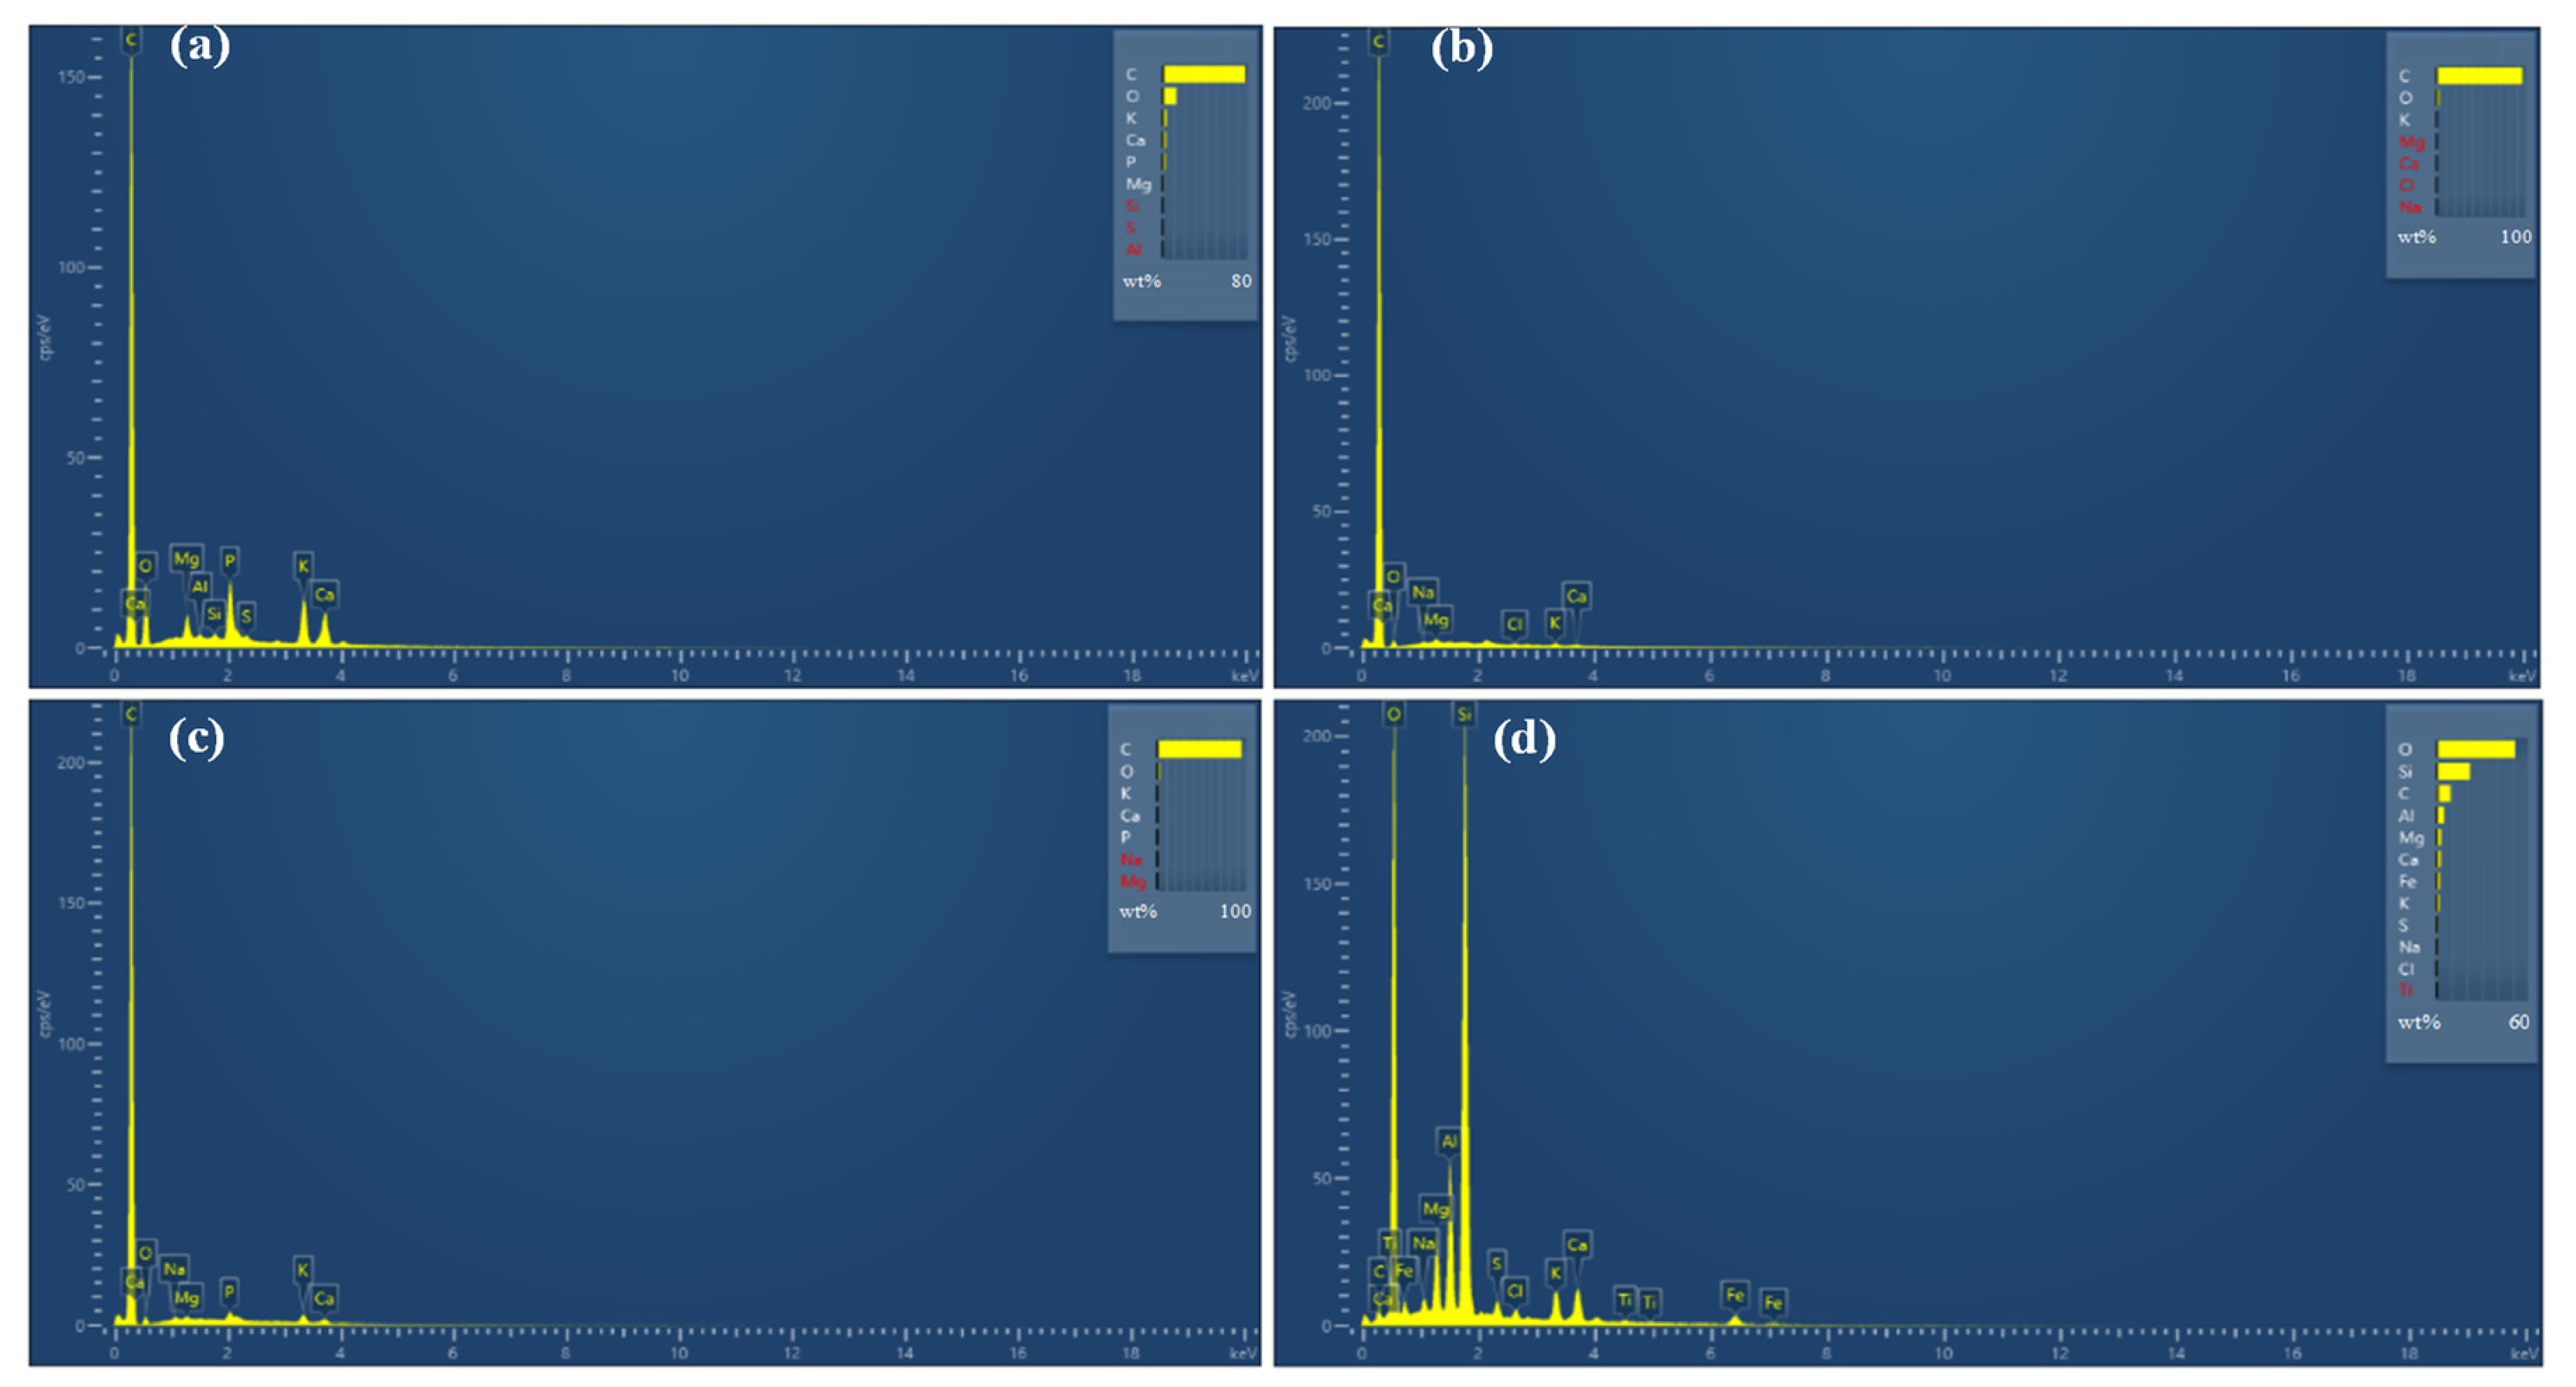
3.1.1. SEM-EDS
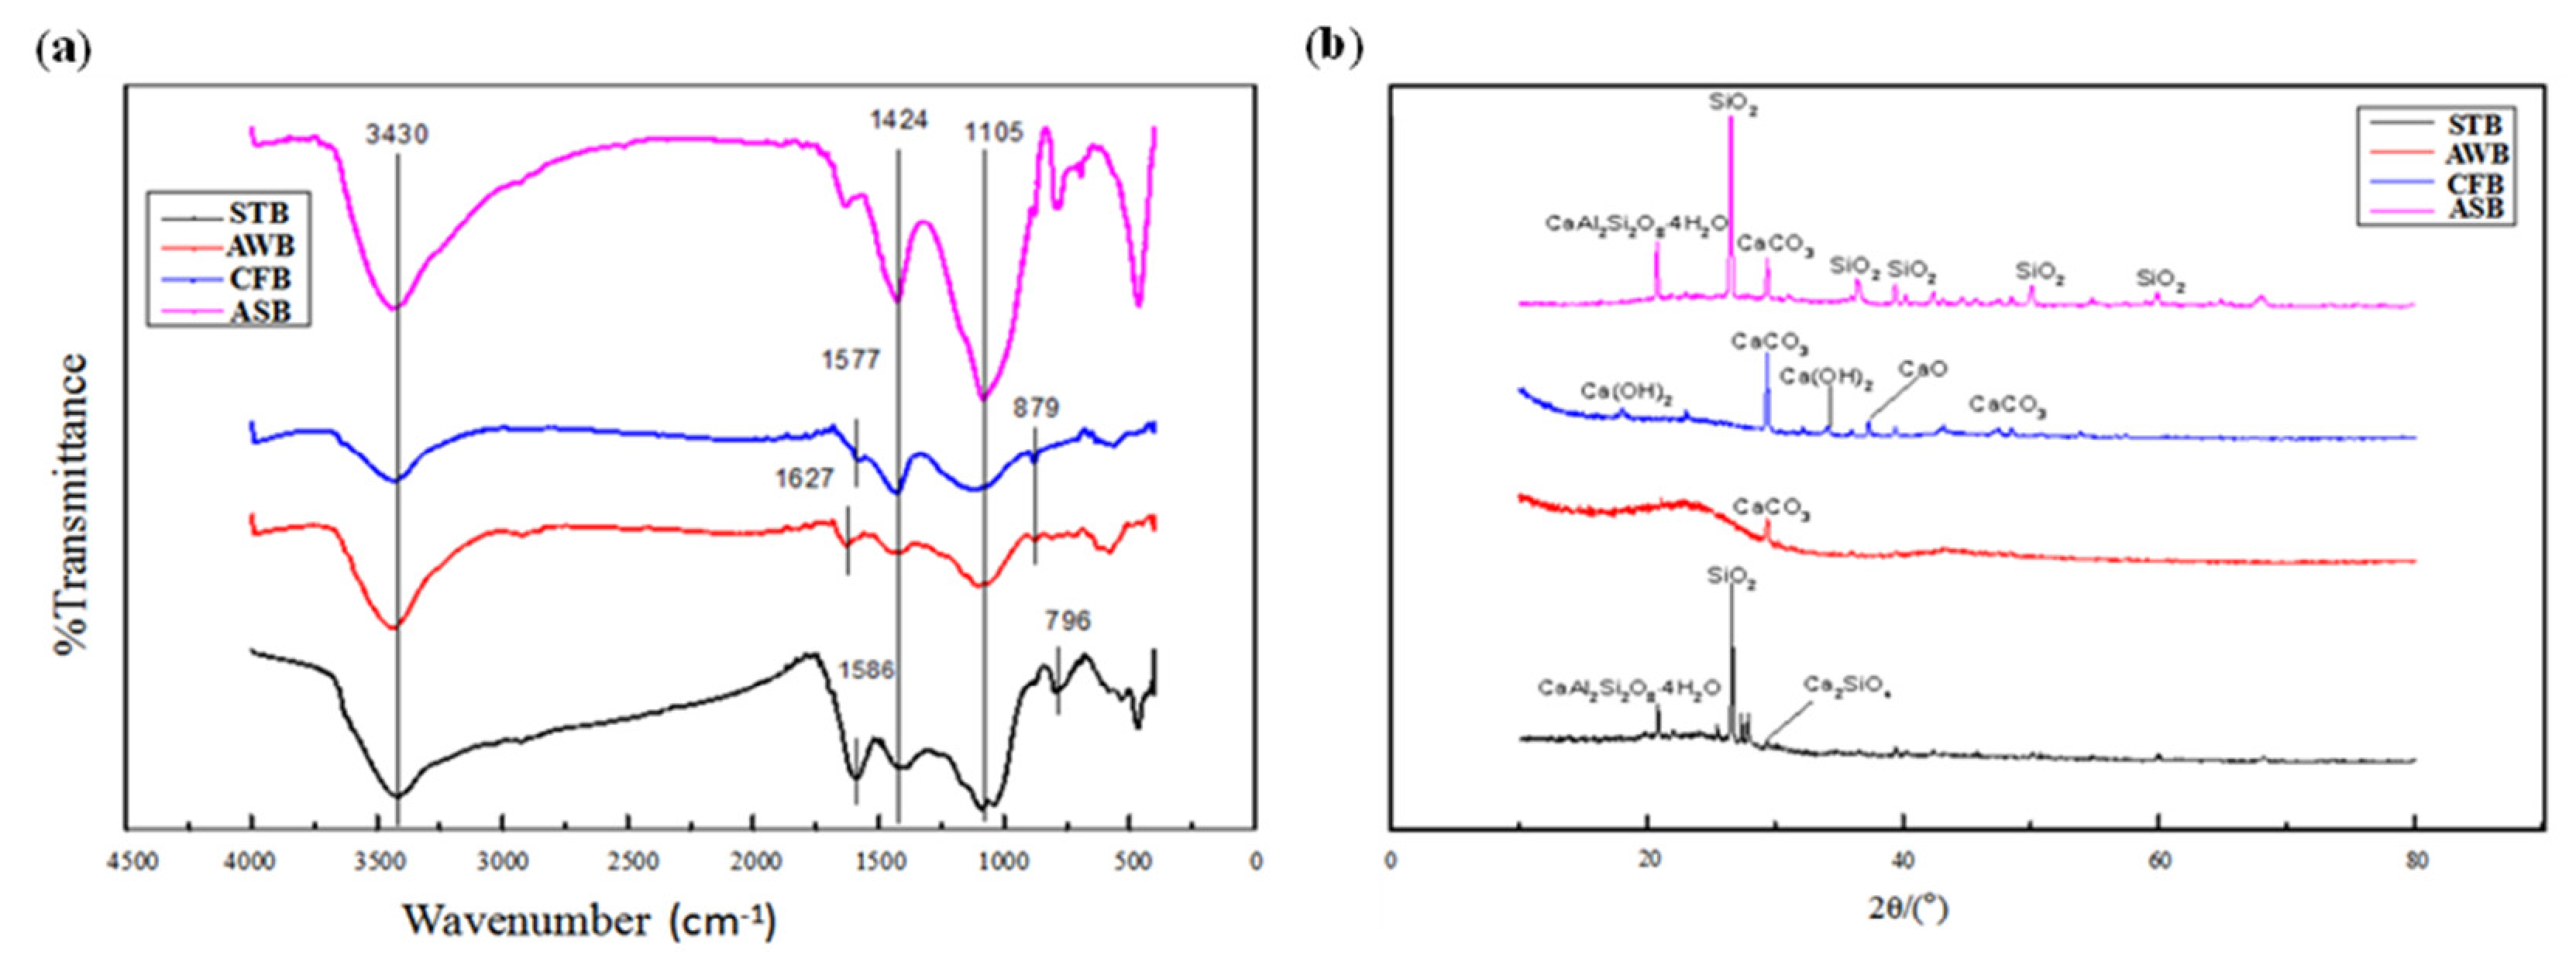
3.1.2. FTIR
3.1.3. XRD
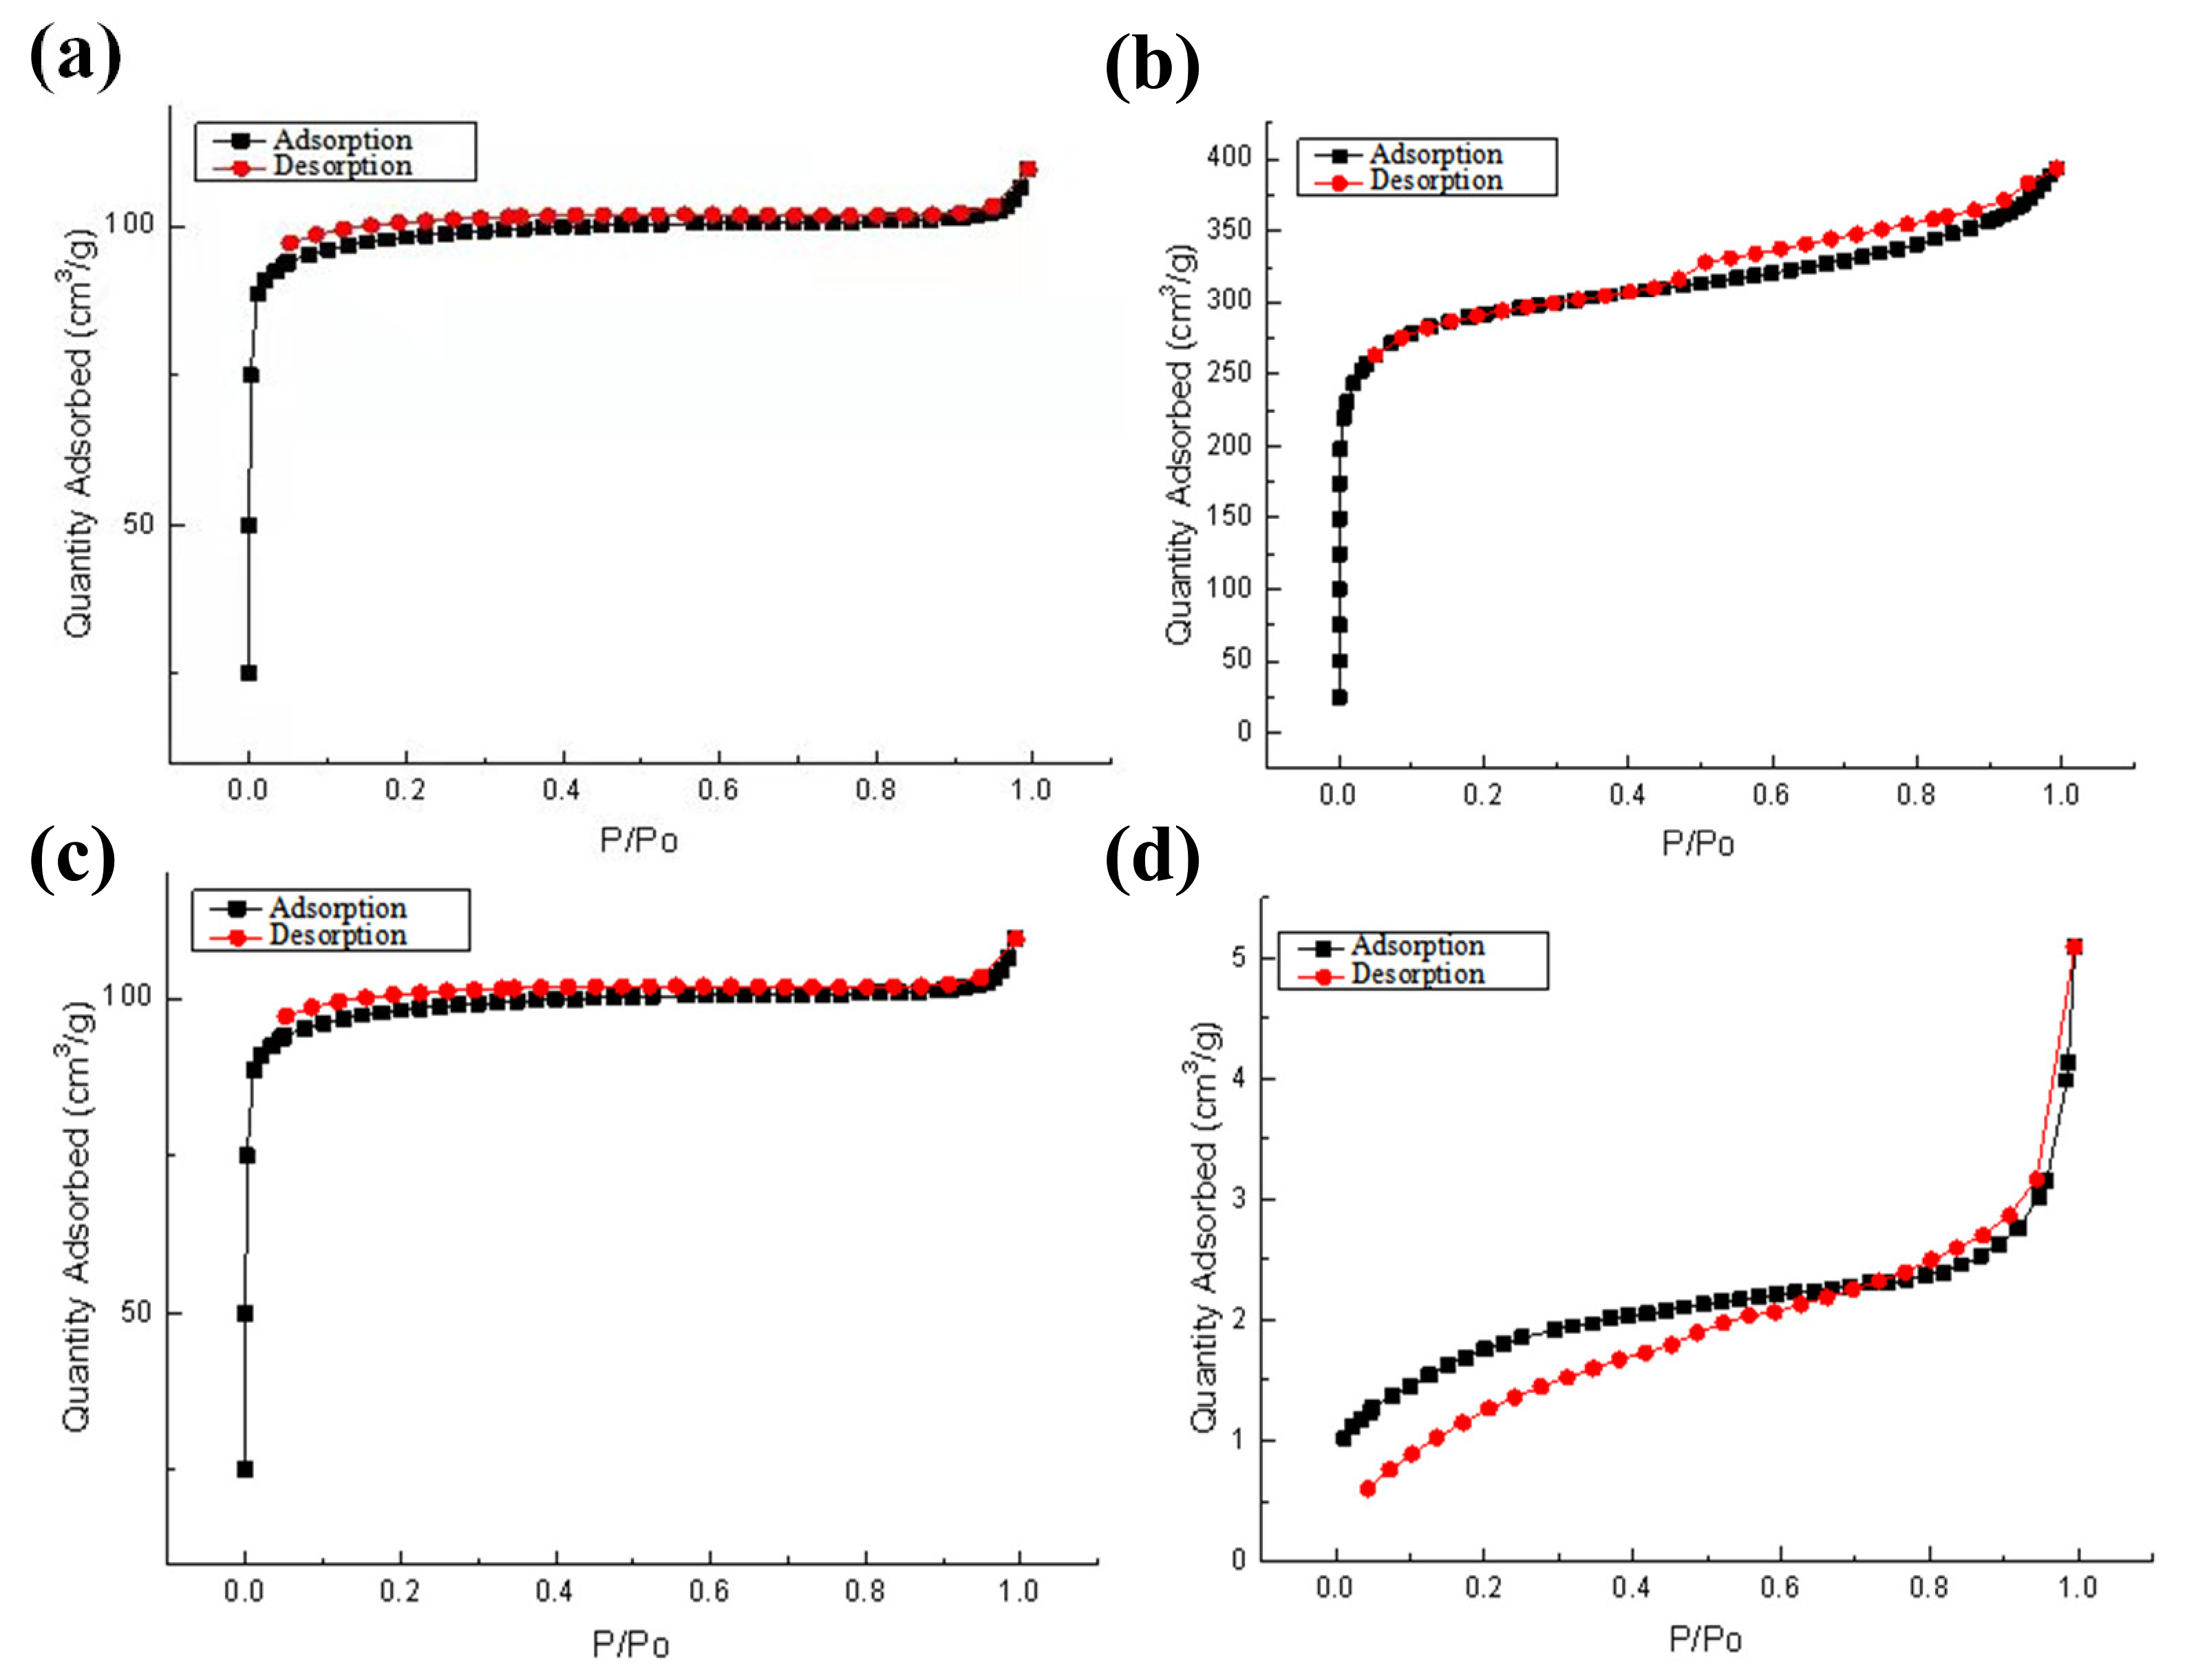
3.1.4. BET
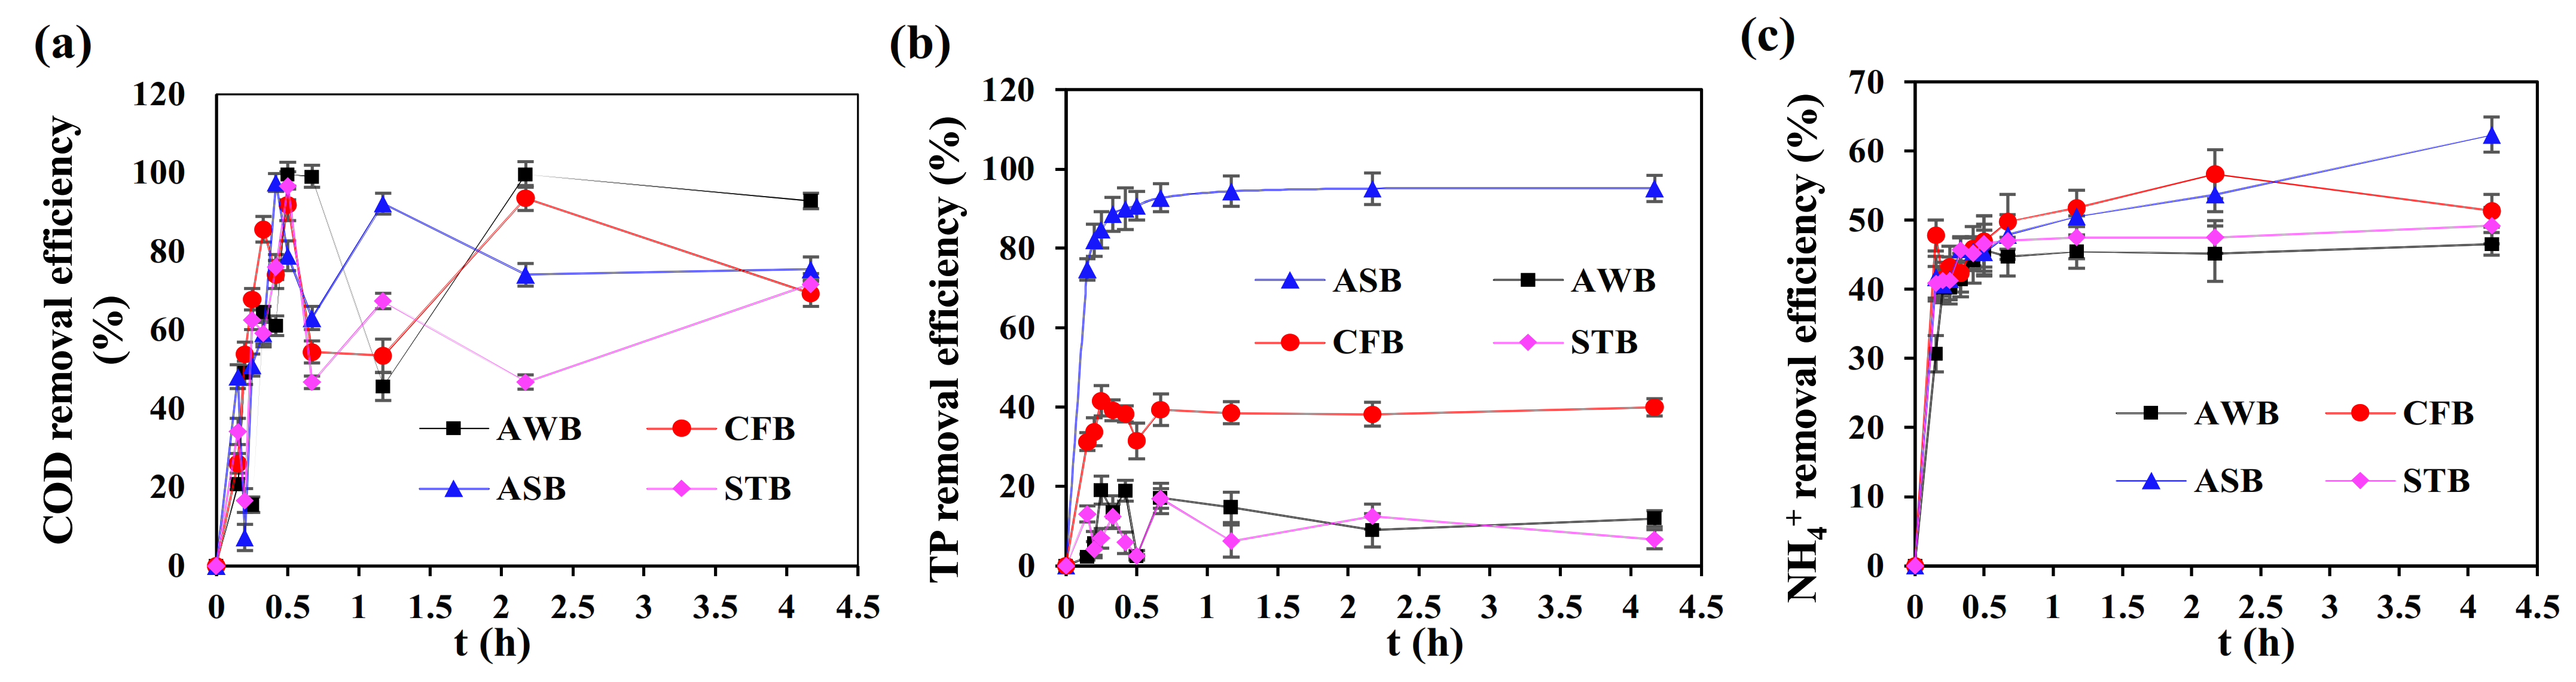
3.2. Adsorption Removal of COD, TP and NH4+-N
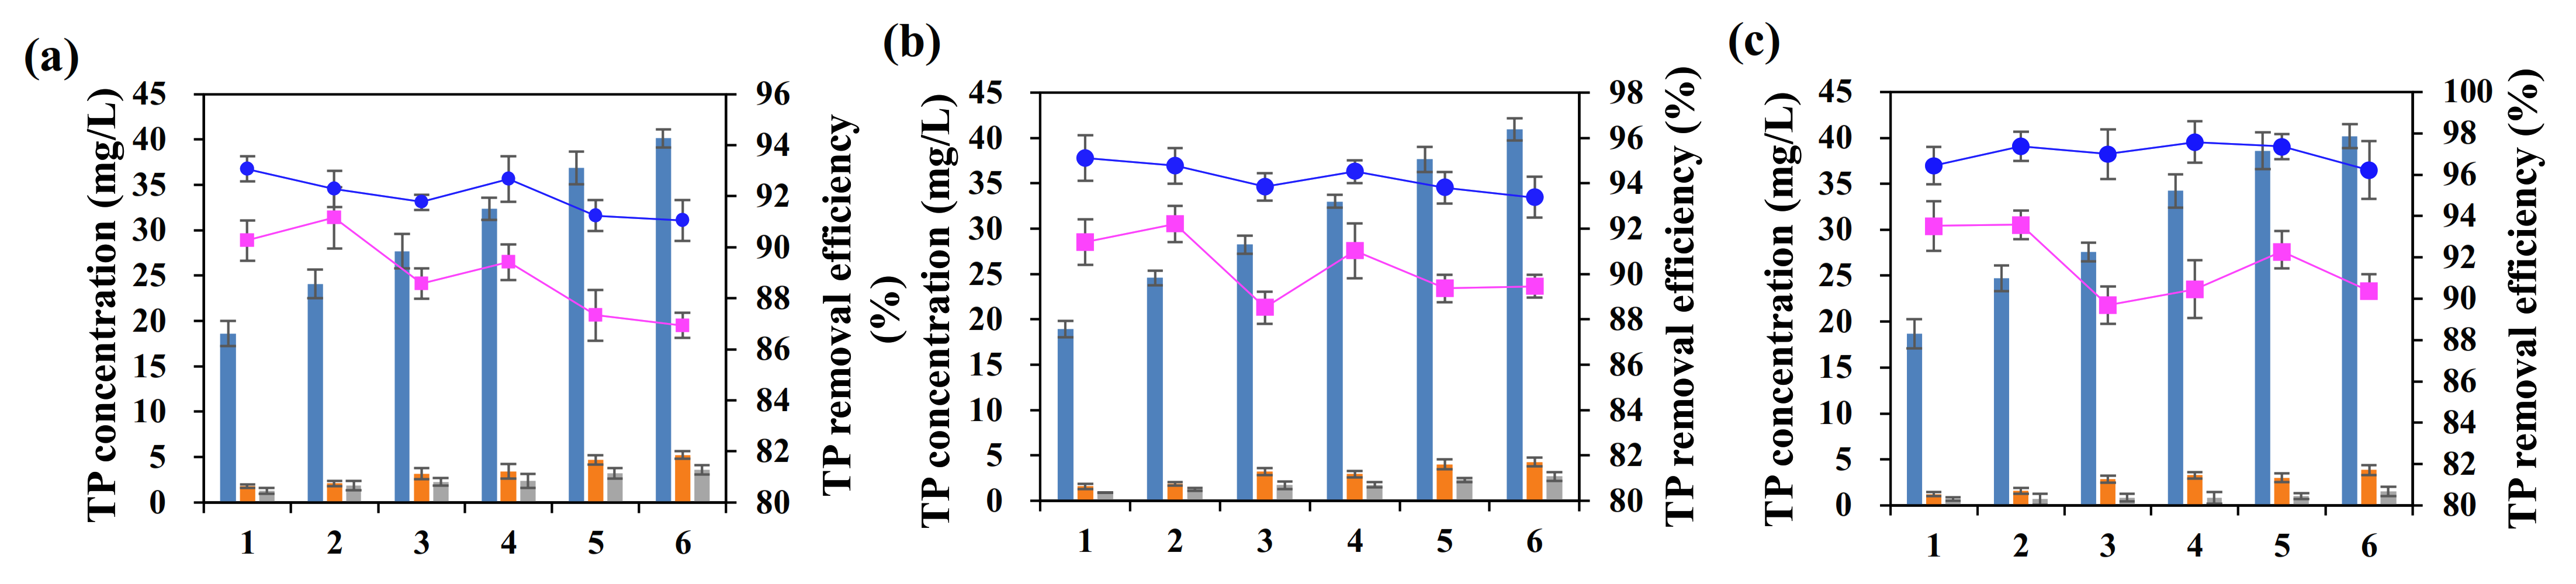
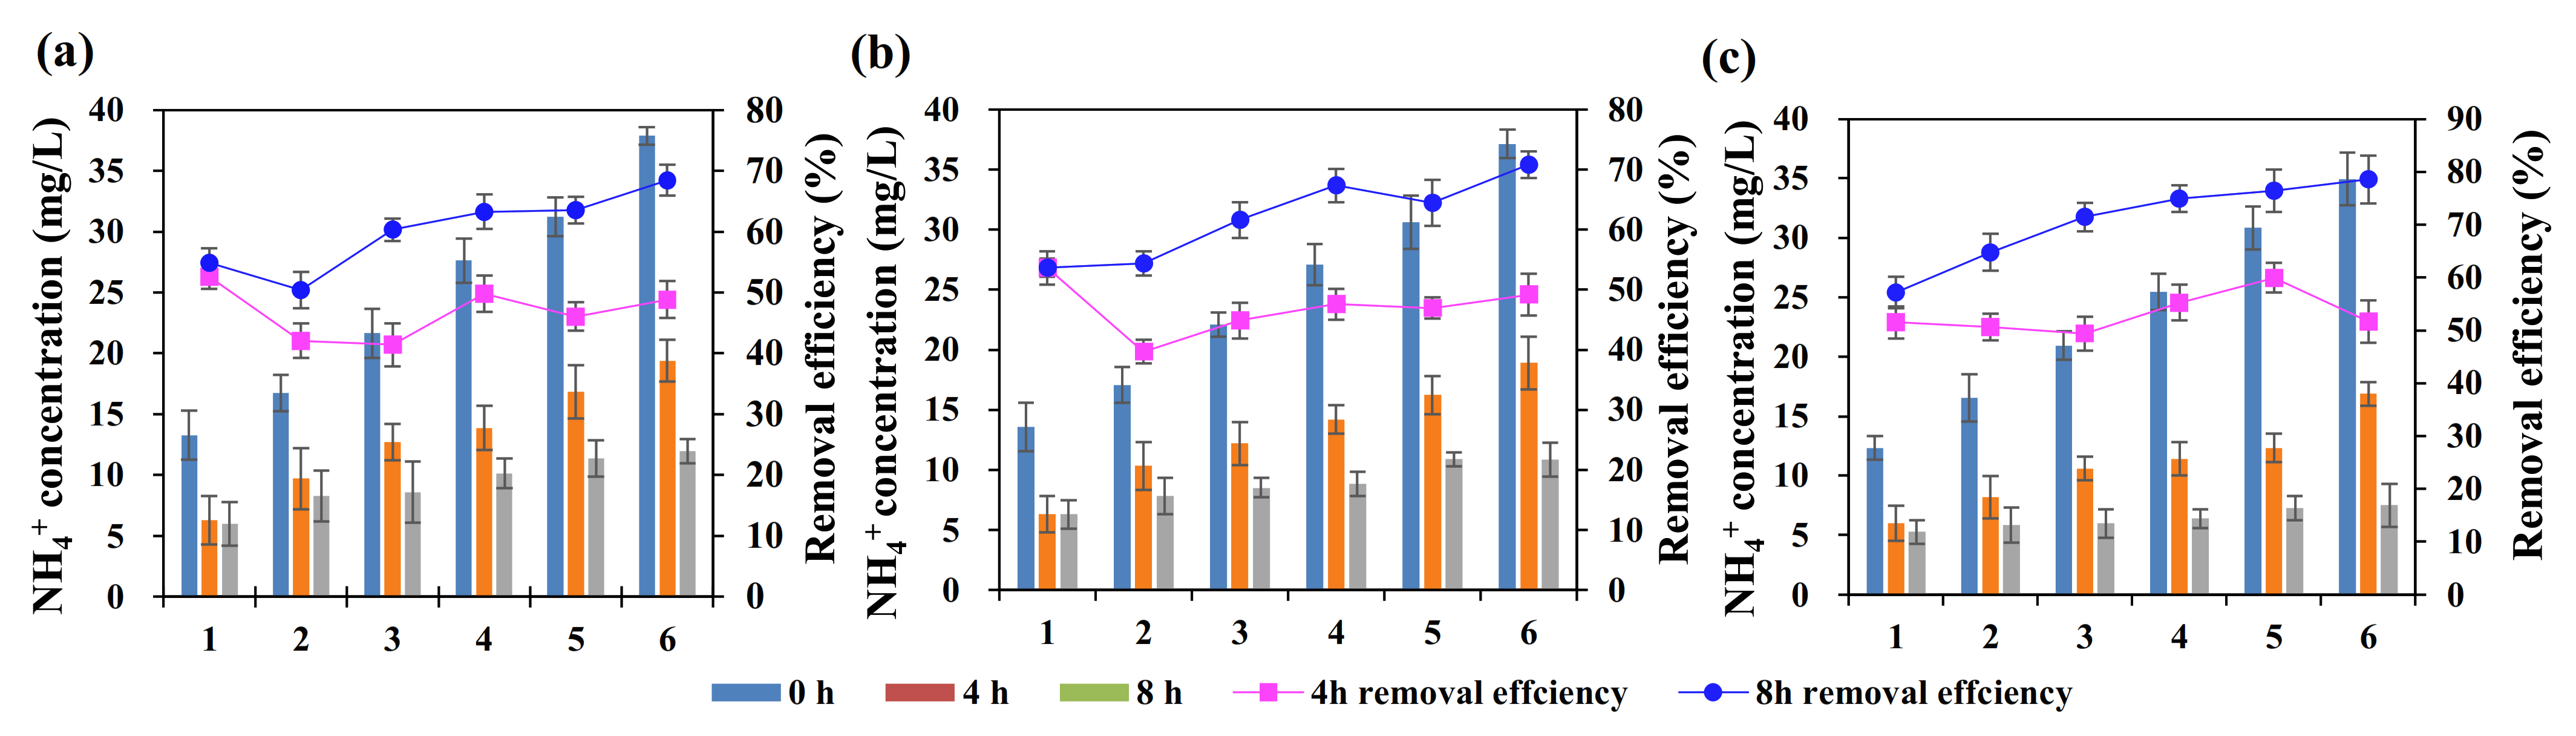
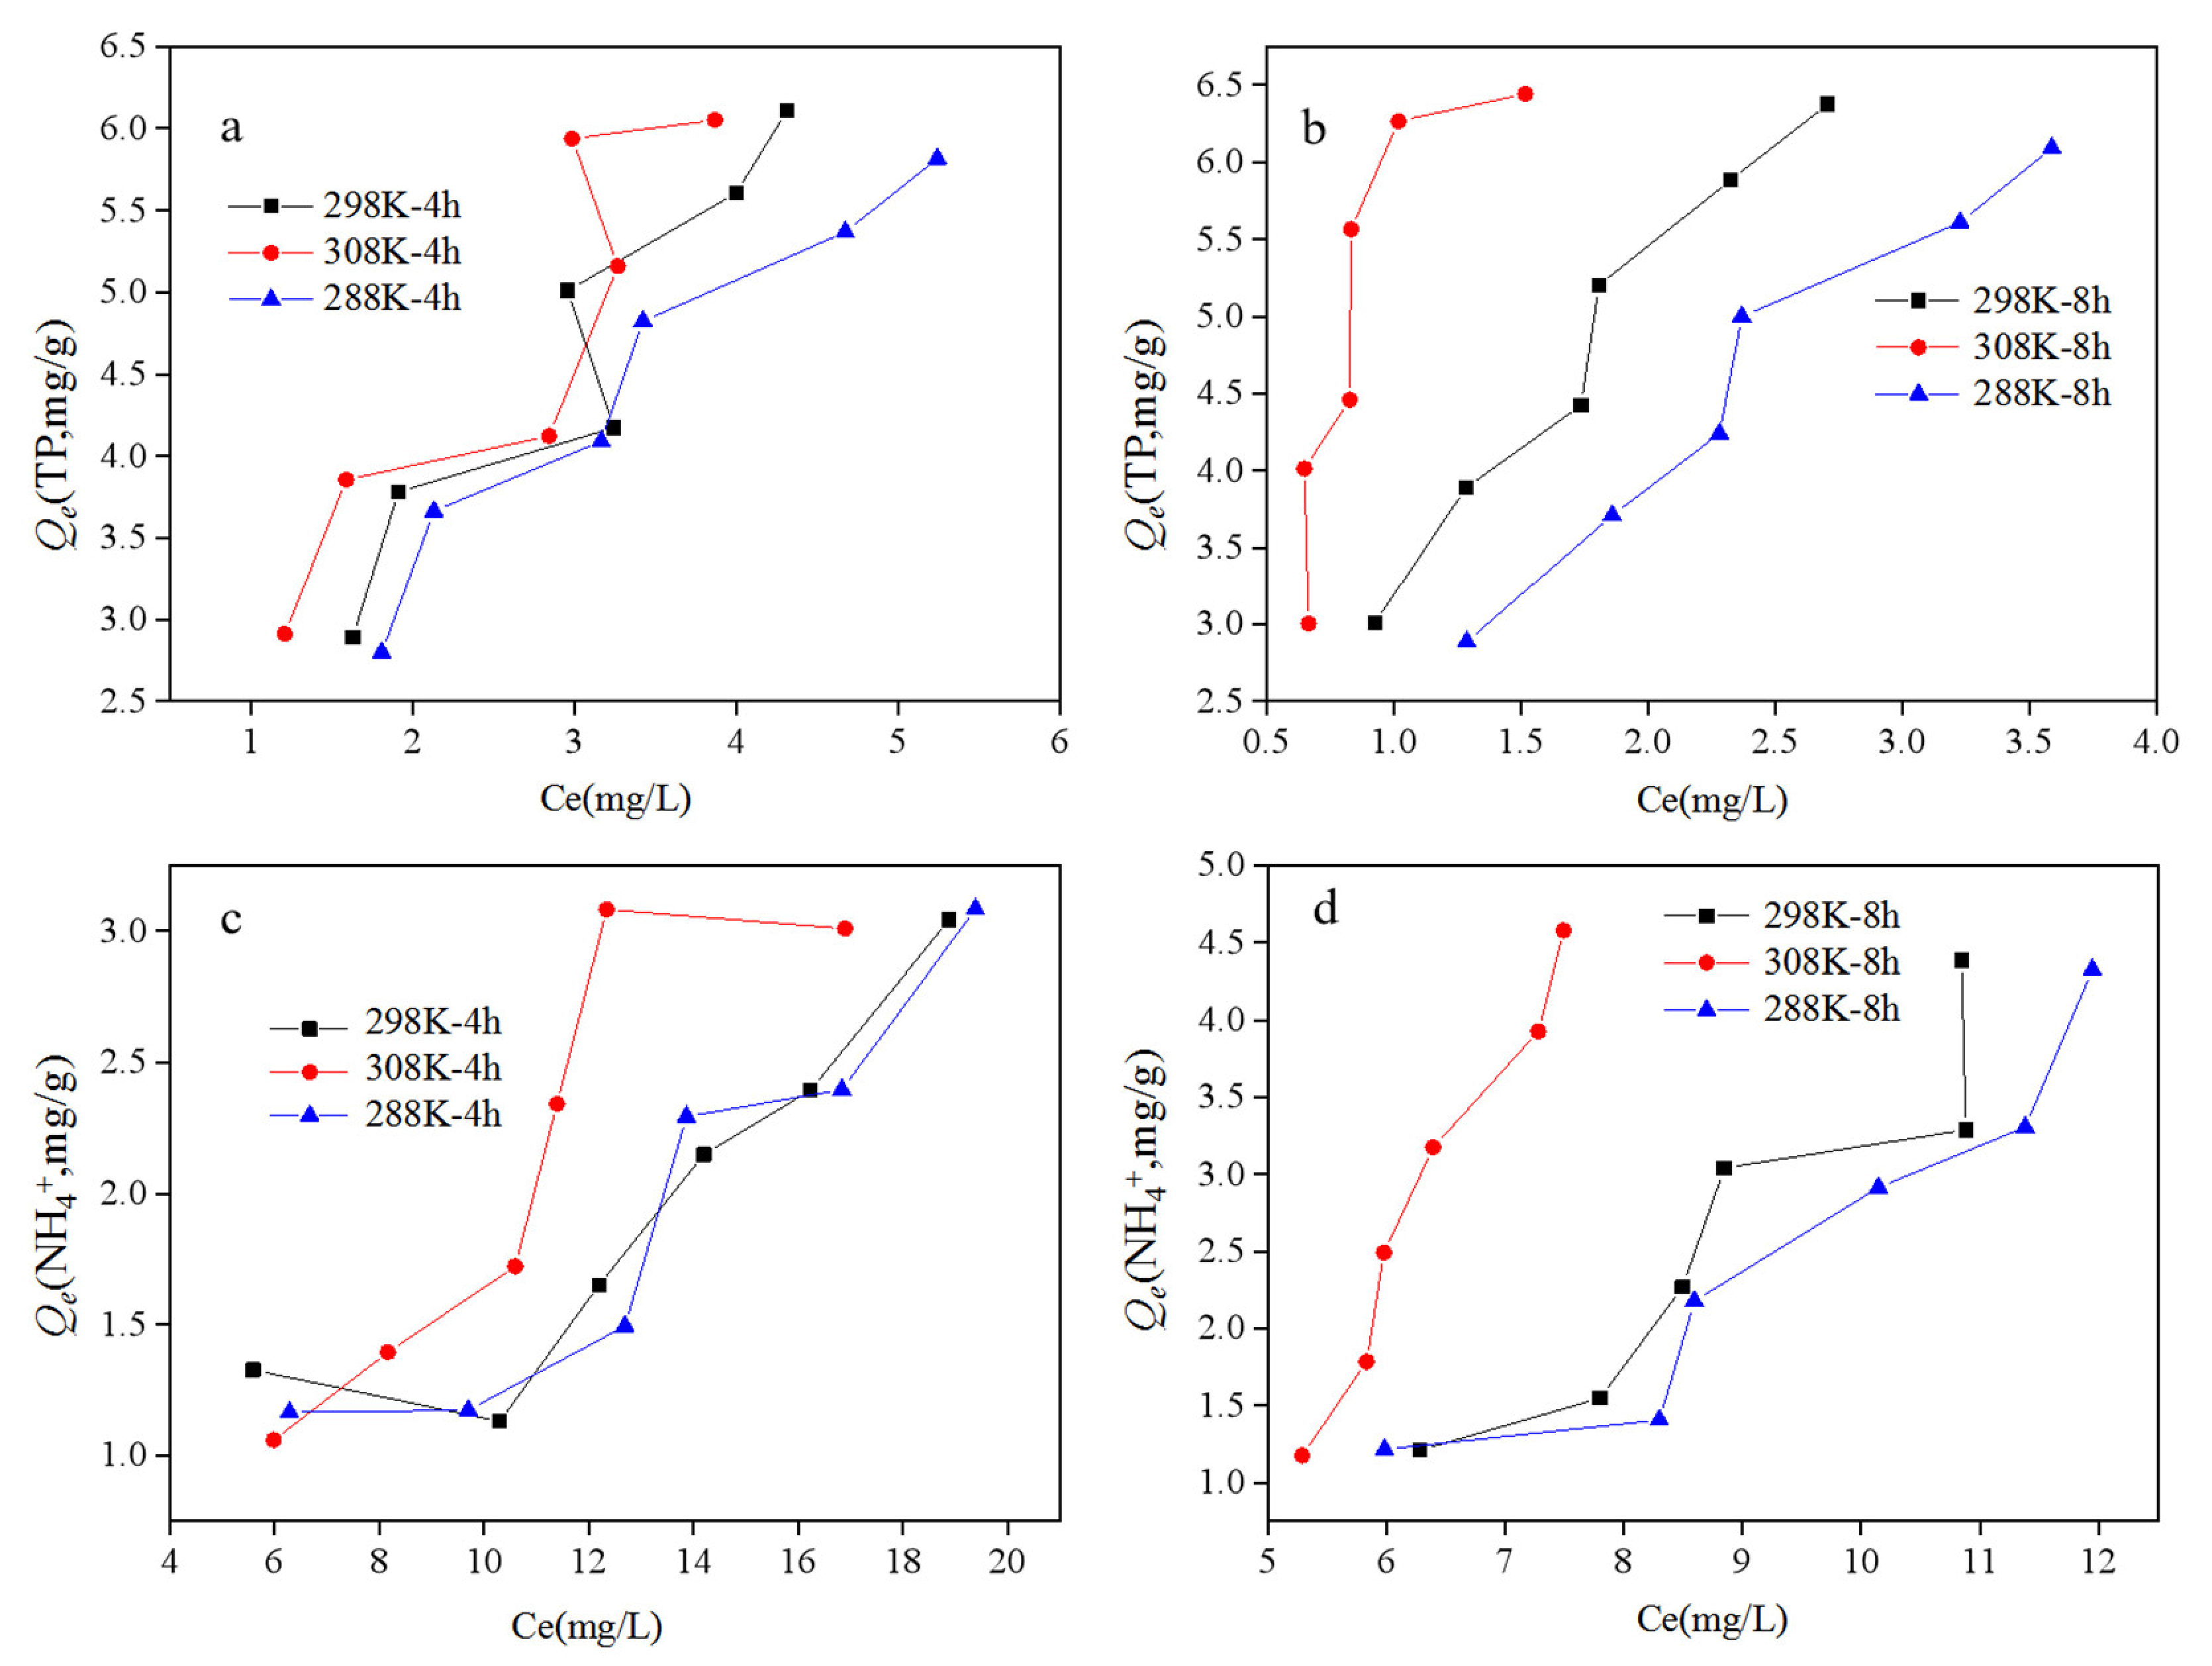
3.3. Effects of Temperature on Adsorption-Removal Efficiency
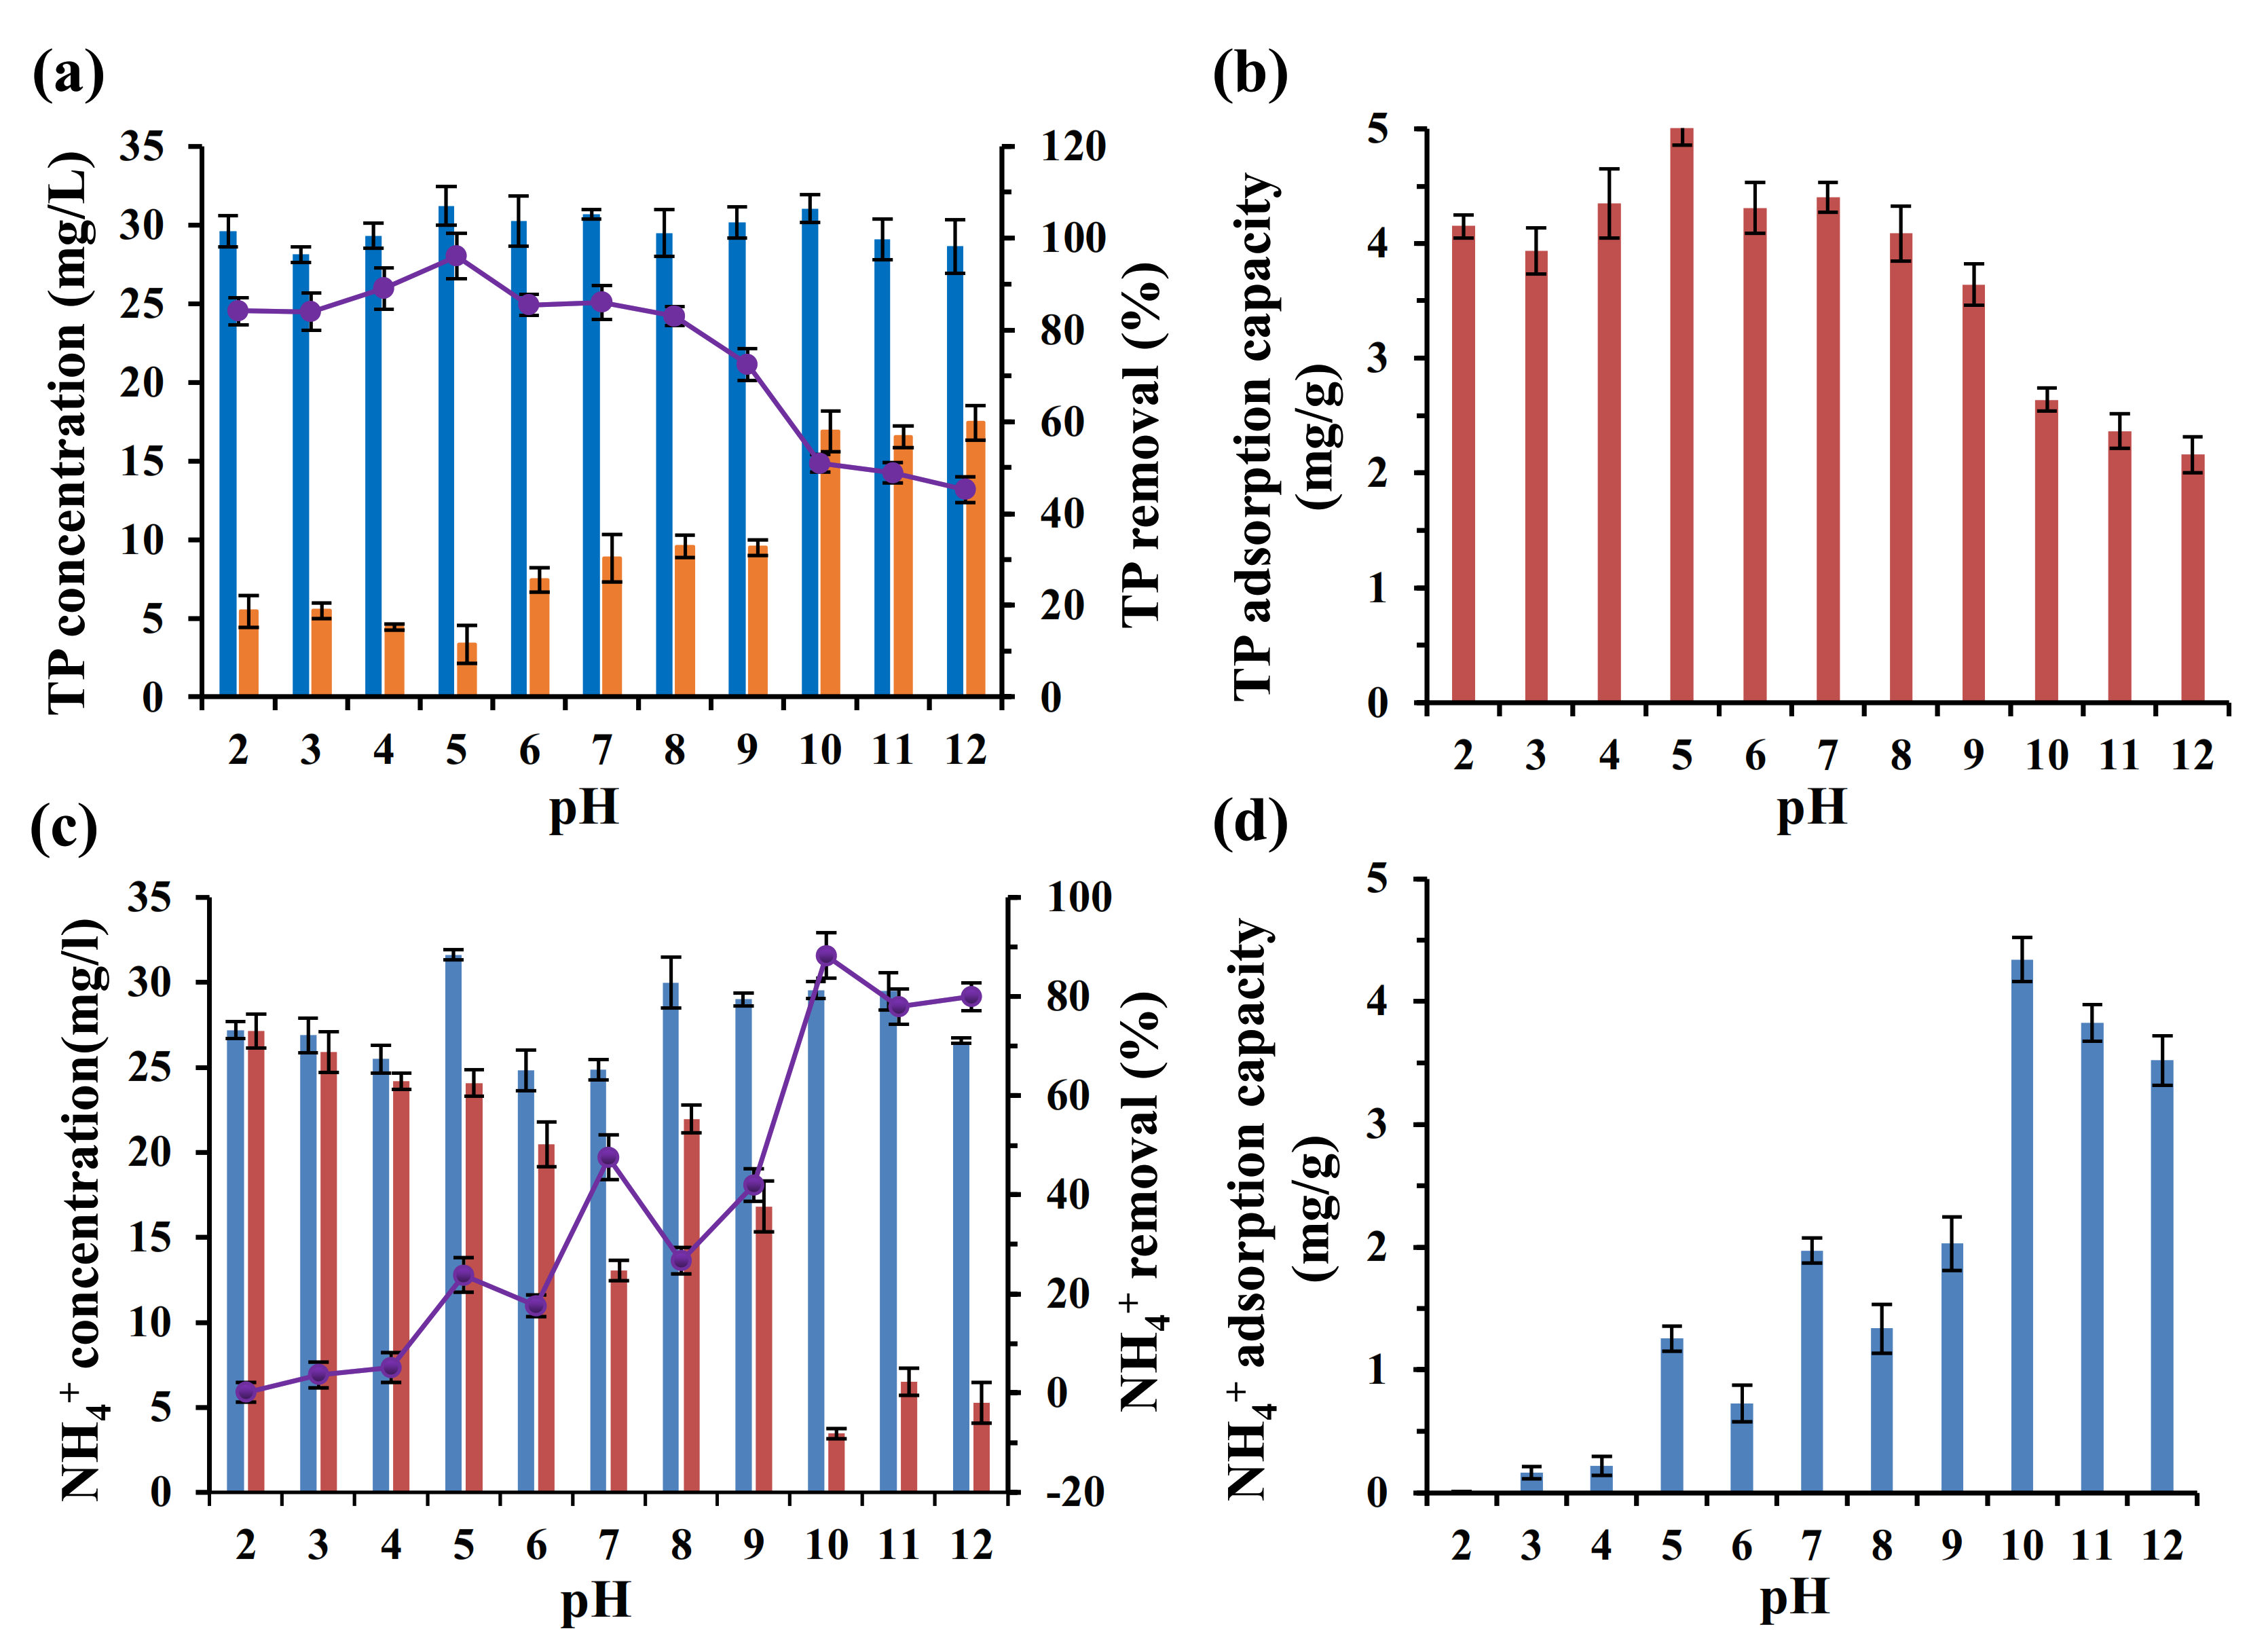
3.4. Effects of pH on Adsorption-removal Efficiency
3.5. Adsorption Dynamics and Adsorption Isotherm
4. Conclusions
Author Contributions
Funding
Institutional Review Board Statement
Data Availability Statement
Conflicts of Interest
References
- Coimbra, K.T.O.; Alcântara, E.; de Souza Filho, C.R. Satellite evidence for pervasive water eutrophication in the Doce River reservoirs following the collapse of the Fundao dam in Brazil☆. Environ. Pollut. 2021, 272, 116014. [Google Scholar] [CrossRef] [PubMed]
- Zhou, L.; Wang, X.; Zhang, X.; Zhao, Y.; Zhu, P.; Zhao, X.; Li, X. Spatiotemporal variations in nitrogen and phosphorus in a large man-made lake and their relationships with human activities. Water 2020, 12, 1106. [Google Scholar] [CrossRef] [Green Version]
- Lee, G.F.; Rast, W.; Jones, R.A. Water Report: Eutrophication of water bodies: Insights for an age old problem. Environ. Sci. Technol. 1978, 12, 900–908. [Google Scholar] [CrossRef]
- Tong, Y.; Bu, X.; Chen, C.; Yang, X.; Lu, Y.; Liang, H.; Liu, M.; Lin, H.; Zhang, H.; Lin, Y.; et al. Impacts of sanitation improvement on reduction of nitrogen discharges entering the environment from human excreta in China. Sci. Total Environ. 2017, 593–594, 439–448. [Google Scholar] [CrossRef] [PubMed]
- Ministry of Housing and Urban Rural Development of the People’s Republic of China. China Urban Construction Statistical Yearbook; Ministry of Housing and Urban Rural Development of the People’s Republic of China: Beijing, China, 2020. [Google Scholar]
- Barnard, J.L. Biological nutrient removal without the addition of chemicals. Water Res. 1975, 9, 485–490. [Google Scholar] [CrossRef]
- Xu, R.; Fan, Y.; Wei, Y.; Wang, Y.; Luo, N.; Yang, M.; Yuan, X.; Yu, R. Influence of carbon sources on nutrient removal in A2/O-MBRs: Availability assessment of internal carbon source. J. Environ. Sci. 2016, 48, 59–68. [Google Scholar] [CrossRef]
- Ekama, G.A.; Wentzel, M.C. Difficulties and developments in biological nutrient removal technology and modelling. Water Sci. Technol. 1999, 39, 1–11. [Google Scholar] [CrossRef]
- Chen, P.; Wu, J.; Lu, X.; Yu, R. Denitrifying phosphorus removal and microbial community characteristics of two-sludge DEPHANOX system: Effects of COD/TP ratio. Biochem. Eng. J. 2021, 172, 108059. [Google Scholar] [CrossRef]
- Shi, J.; Lu, X.; Yu, R.; Gu, Q.; Zhou, Y. Influence of wastewater composition on nutrient removal behaviors in the new anaerobic–anoxic/nitrifying/induced crystallization process. Saudi J. Biol. Sci. 2014, 21, 71–80. [Google Scholar] [CrossRef] [Green Version]
- Fu, J.; Lin, Z.; Zhao, P.; Wang, Y.; He, L.; Zhou, J. Establishment and efficiency analysis of a single-stage denitrifying phosphorus removal system treating secondary effluent. Bioresour. Technol. 2019, 288, 121520. [Google Scholar] [CrossRef]
- Wang, M.; Hu, S.; Wang, Q.; Liang, Y.; Liu, C.; Xu, H.; Ye, Q. Enhanced nitrogen and phosphorus adsorption performance and stabilization by novel panda manure biochar modified by CMC stabilized nZVZ composite in aqueous solution: Mechanisms and application potential. J. Clean. Prod. 2021, 291, 125221. [Google Scholar] [CrossRef]
- Sui, Y.; Gao, J.; Liu, C.; Zhang, W.; Lan, Y.; Li, S.; Meng, J.; Xu, Z.; Tang, L. Interactive effects of straw-derived biochar and N fertilization on soil C storage and rice productivity in rice paddies of Northeast China. Sci. Total Environ. 2016, 544, 203–210. [Google Scholar] [CrossRef]
- Lee, M.E.; Steiman, M.W.; St. Angelo, S.K. Biogas digestate as a renewable fertilizer: Effects of digestate application on crop growth and nutrient composition. Renew. Agric. Food Syst. 2021, 36, 173–181. [Google Scholar] [CrossRef]
- Fytili, D.; Zabaniotou, A. Utilization of sewage sludge in EU application of old and new methods—A review. Renew. Sustain. Energy Rev. 2008, 12, 116–140. [Google Scholar] [CrossRef]
- Asai, H.; Samson, B.K.; Stephan, H.M.; Songyikhangsuthor, K.; Homma, K.; Kiyono, Y.; Inoue, Y.; Shiraiwa, T.; Horie, T. Biochar amendment techniques for upland rice production in Northern Laos: 1. Soil physical properties, leaf SPAD and grain yield. Field Crops Res. 2009, 111, 81–84. [Google Scholar] [CrossRef]
- Piccolo, A.; Mbagwu, J.S.C. Effects of different organic waste amendments on soil microaggregates stability and molecular sizes of humic substances. Plant Soil 1990, 123, 27–37. [Google Scholar] [CrossRef]
- Song, X.D.; Xue, X.Y.; Chen, D.Z.; He, P.J.; Dai, X.H. Application of biochar from sewage sludge to plant cultivation: Influence of pyrolysis temperature and biochar-to-soil ratio on yield and heavy metal accumulation. Chemosphere 2014, 109, 213–220. [Google Scholar] [CrossRef]
- Yue, Y.; Cui, L.; Lin, Q.; Li, G.; Zhao, X. Efficiency of sewage sludge biochar in improving urban soil properties and promoting grass growth. Chemosphere 2017, 173, 551–556. [Google Scholar] [CrossRef]
- Yuan, H.; Lu, T.; Wang, Y.; Chen, Y.; Lei, T. Sewage sludge biochar: Nutrient composition and its effect on the leaching of soil nutrients. Geoderma 2016, 267, 17–23. [Google Scholar] [CrossRef]
- Ahmad, A.; Chowdhary, P.; Khan, N.; Chaurasia, D.; Varjani, S.; Pandey, A.; Chaturvedi, P. Effect of sewage sludge biochar on the soil nutrient, microbial abundance, and plant biomass: A sustainable approach towards mitigation of solid waste. Chemosphere 2022, 287, 132112. [Google Scholar] [CrossRef]
- APHA. Standard Methods for the Examination of Water and Wastewater; APHA: Washington, DC, USA, 1998. [Google Scholar]
- Sakhiya, A.K.; Vijay, V.K.; Kaushal, P. Efficacy of rice straw derived biochar for removal of Pb2+ and Zn2+ from aqueous: Adsorption, thermodynamic and cost analysis. Bioresour. Technol. Rep. 2022, 17, 100920. [Google Scholar] [CrossRef]
- Shen, Z.; Hou, D.; Jin, F.; Shi, J.; Fan, X.; Tsang, D.C.W.; Alessi, D.S. Effect of production temperature on lead removal mechanisms by rice straw biochars. Sci. Total Environ. 2019, 655, 751–758. [Google Scholar] [CrossRef] [PubMed]
- Gao, L.-Y.; Deng, J.-H.; Huang, G.-F.; Li, K.; Cai, K.-Z.; Liu, Y.; Huang, F. Relative distribution of Cd2+ adsorption mechanisms on biochars derived from rice straw and sewage sludge. Bioresour. Technol. 2019, 272, 114–122. [Google Scholar] [CrossRef] [PubMed]
- Rajec, P.; Rosskopfová, O.; Galamboš, M.; Frišták, V.; Soja, G.; Dafnomili, A.; Noli, F.; Đukić, A.; Matović, L. Sorption and desorption of pertechnetate on biochar under static batch and dynamic conditions. J. Radioanal. Nucl. Chem. 2016, 310, 253–261. [Google Scholar] [CrossRef]
- Cheng, W.; Li, H.; Yang, Y.; Yin, B.; Bai, J.; Liu, H.; Liu, H. Preparation of biochar with fermented sludge residue by pyrolysis and adsorption of nitrogen and phosphorus. CIESC J. 2016, 67, 1541–1548. [Google Scholar] [CrossRef]
- Xu, X.; Zhao, Y.; Sima, J.; Zhao, L.; Mašek, O.; Cao, X. Indispensable role of biochar-inherent mineral constituents in its environmental applications: A review. Bioresour. Technol. 2017, 241, 887–899. [Google Scholar] [CrossRef] [PubMed] [Green Version]
- Zhang, H.; Voroney, R.P.; Price, G.W. Effects of temperature and processing conditions on biochar chemical properties and their influence on soil C and N transformations. Soil Biol. Biochem. 2015, 83, 19–28. [Google Scholar] [CrossRef]
- Zhao, L.; Cao, X.; Mašek, O.; Zimmerman, A. Heterogeneity of biochar properties as a function of feedstock sources and production temperatures. J. Hazard. Mater. 2013, 256–257, 1–9. [Google Scholar] [CrossRef] [Green Version]
- Chen, B.; Zhou, D.; Zhu, L. Transitional adsorption and partition of nonpolar and polar aromatic contaminants by biochars of pine needles with different pyrolytic temperatures. Environ. Sci. Technol. 2008, 42, 5137–5143. [Google Scholar] [CrossRef]
- Wang, H.; Wang, X.; Zhao, X. Synthesis and characterization of novel fluorine-containing water-based antirust coating. IOP Conf. Ser. Mater. Sci. Eng. 2018, 301, 012005. [Google Scholar] [CrossRef] [Green Version]
- Guo, Q. Polymer Morphology: Principles, Characterization and Processing; John Wiley & Sons, Inc.: Hoboken, NJ, USA, 2016. [Google Scholar]
- Chia, C.H.; Gong, B.; Joseph, S.D.; Marjo, C.E.; Munroe, P.; Rich, A.M. Imaging of mineral-enriched biochar by FTIR, Raman and SEM–EDX. Vib. Spectrosc. 2012, 62, 248–257. [Google Scholar] [CrossRef]
- Keiluweit, M.; Nico, P.S.; Johnson, M.G.; Kleber, M. Dynamic molecular structure of plant biomass-derived black carbon (biochar). Environ. Sci. Technol. 2010, 44, 1247–1253. [Google Scholar] [CrossRef] [Green Version]
- Suhua, G.; Zhongjian, X.; Fangwen, L.; Dandan, X. Adsorption of Pb(II), Zn(II) from aqueous solution by biochars. Chin. J. Environ. Eng. 2015, 9, 3215–3222. [Google Scholar] [CrossRef]
- Agrafioti, E.; Bouras, G.; Kalderis, D.; Diamadopoulos, E. Biochar production by sewage sludge pyrolysis. J. Anal. Appl. Pyrolysis 2013, 101, 72–78. [Google Scholar] [CrossRef]
- Chuan, S.; Panyue, Z.; Guo, J.; Zhang, G. Phosphorus adsorption performance onto sewage sludge biochar. Chin. J. Environ. Eng. 2016, 10, 7202–7208. [Google Scholar] [CrossRef]
- Guo, H.; Chunxia, H.E. Study on physicochemical properties of four biochars and their adsorption to methylene Blue. Dev. Appl. Mater. 2019, 34, 113–119. [Google Scholar] [CrossRef]
- Yavari, S.; Malakahmad, A.; Sapari, N.B. Biochar efficiency in pesticides sorption as a function of production variables-A review. Environ. Sci. Pollut. Res. 2015, 22, 13824–13841. [Google Scholar] [CrossRef]
- Chen, Y.; Zhang, X.; Chen, W.; Yang, H.; Chen, H. The structure evolution of biochar from biomass pyrolysis and its correlation with gas pollutant adsorption performance. Bioresour. Technol. 2017, 246, 101–109. [Google Scholar] [CrossRef]
- Odedishemi Ajibade, F.; Wang, H.-C.; Guadie, A.; Fausat Ajibade, T.; Fang, Y.-K.; Muhammad Adeel Sharif, H.; Liu, W.-Z.; Wang, A.-J. Total nitrogen removal in biochar amended non-aerated vertical flow constructed wetlands for secondary wastewater effluent with low C/N ratio: Microbial community structure and dissolved organic carbon release conditions. Bioresour. Technol. 2021, 322, 124430. [Google Scholar] [CrossRef]
- Yao, Y.; Gao, B.; Inyang, M.; Zimmerman, A.R.; Cao, X.; Pullammanappallil, P.; Yang, L. Removal of phosphate from aqueous solution by biochar derived from anaerobically digested sugar beet tailings. J. Hazard. Mater. 2011, 190, 501–507. [Google Scholar] [CrossRef]
- Chitrakar, R.; Tezuka, S.; Sonoda, A.; Sakane, K.; Ooi, K.; Hirotsu, T. Selective adsorption of phosphate from seawater and wastewater by amorphous zirconium hydroxide. J. Colloid Interface Sci. 2006, 297, 426–433. [Google Scholar] [CrossRef] [PubMed]
- Tan, Z.; Yuan, S.; Hong, M.; Zhang, L.; Huang, Q. Mechanism of negative surface charge formation on biochar and its effect on the fixation of soil Cd. J. Hazard. Mater. 2020, 384, 121370. [Google Scholar] [CrossRef] [PubMed]
- Yuan, H.Y.; Zhang, H.X.; Chen, Y.G.; Zhou, Q. Impact of pH on the generation of COD, phosphorous and ammonia-nitrogen during the anaerobic fermentation of excess activated sludge. Huan Jing Ke Xue 2006, 27, 1358–1361. [Google Scholar] [CrossRef]
- Chang, M.-Y.; Juang, R.-S. Adsorption of tannic acid, humic acid, and dyes from water using the composite of chitosan and activated clay. J. Colloid Interface Sci. 2004, 278, 18–25. [Google Scholar] [CrossRef] [PubMed]
- Ofomaja, A.E.; Naidoo, E.B.; Modise, S.J. Dynamic studies and pseudo-second order modeling of copper(II) biosorption onto pine cone powder. Desalination 2010, 251, 112–122. [Google Scholar] [CrossRef]
- Shin, E.W.; Han, J.S.; Jang, M.; Min, S.-H.; Park, J.K.; Rowell, R.M. Phosphate adsorption on aluminum-impregnated mesoporous silicates: Surface structure and behavior of adsorbents. Environ. Sci. Technol. 2004, 38, 912–917. [Google Scholar] [CrossRef] [Green Version]
- Chung, H.-K.; Kim, W.-H.; Park, J.; Cho, J.; Jeong, T.-Y.; Park, P.-K. Application of Langmuir and Freundlich isotherms to predict adsorbate removal efficiency or required amount of adsorbent. J. Ind. Eng. Chem. 2015, 28, 241–246. [Google Scholar] [CrossRef]
- Doumer, M.E.; Rigol, A.; Vidal, M.; Mangrich, A.S. Removal of Cd, Cu, Pb, and Zn from aqueous solutions by biochars. Environ. Sci. Pollut. Res. 2016, 23, 2684–2692. [Google Scholar] [CrossRef]


| Name | Test 1 | Test 2 | Test 3 | Test 4 | Test 5 | Test 6 |
|---|---|---|---|---|---|---|
| NH4+ adsorption test | ||||||
| NH4+-N (mg/L) | 30 | 30 | 30 | 30 | 30 | 30 |
| TP (mg/L) | 14 | 18 | 22 | 26 | 30 | 34 |
| TP adsorption test | ||||||
| NH4+-N (mg/L) | 15 | 20 | 25 | 30 | 35 | 40 |
| TP (mg/L) | 30 | 30 | 30 | 30 | 30 | 30 |
| Biochar | Specific Surface Area (m2/g) | Micropore Surface Area (m2/g) | Total Pore Volume (cm3/g) | Micropore Volume (cm3/g) | Average Pore Size (nm) | Iodine Sorption Value (mg/g) |
|---|---|---|---|---|---|---|
| STB | 6.3958 | 0.7819 | 0.0048 | 0.0002 | 6.2728 | 287 |
| AWB | 391.0390 | 353.8750 | 0.1583 | 0.1353 | 4.7700 | 285 |
| CFB | 1116.1316 | 860.9206 | 0.5726 | 0.3384 | 4.5637 | 1115 |
| ASB | 123.3406 | 60.6806 | 0.0995 | 0.0256 | 6.4946 | 187 |
| Pseudo-First Order | Pseudo-Second Order | Intraparticle Diffusion | |||||||
|---|---|---|---|---|---|---|---|---|---|
| K1 (h−1) | Qe1 (mg/g) | R2 | K2 (g/(mg·h)) | Qe2 (mg/g) | R2 | K3 (mg/(g·h)) | B (mg/g) | R2 | |
| TP | 10.3352 | 4.6149 | 0.9351 | 0.0866 | 4.8348 | 0.9623 | 0.4532 | 4.0074 | 0.4716 |
| NH4+-N | 2.1923 | 7.9165 | 0.3579 | 5.3135 | 2.4004 | 0.7125 | 0.5297 | 1.5658 | 0.9653 |
| Temperature | Time | Langmuir | Freundlich | ||||||
|---|---|---|---|---|---|---|---|---|---|
| Qm (mg g−1) | KL (L/mg) | RL | R2 | KF (mg/g) | N | R2 | |||
| TP | 288 K | 4 h | 11.2226 | 0.2020 | 0.2102 | 0.9468 | 2.1508 | 0.6025 | 0.9414 |
| 8 h | 16.4065 | 0.1643 | 0.2465 | 0.9589 | 2.4477 | 0.7186 | 0.9554 | ||
| 298 K | 4 h | 13.3081 | 0.1821 | 0.2244 | 0.8408 | 16.0666 | 0.2286 | 0.8481 | |
| 8 h | 15.9048 | 0.2486 | 0.1749 | 0.9658 | 3.2284 | 0.6965 | 0.9648 | ||
| 308 K | 4 h | 10.3890 | 0.3319 | 0.1389 | 0.7406 | 2.7344 | 0.5730 | 0.7482 | |
| 8 h | 14.8483 | 0.5657 | 0.0864 | 0.6320 | 5.2987 | 0.6401 | 0.5962 | ||
| NH4+-N | 288 K | 4 h | - | - | - | - | 0.1075 | 1.1174 | 0.8501 |
| 8 h | - | - | - | - | 0.0193 | 2.1540 | 0.9089 | ||
| 298 K | 4 h | - | - | - | - | 0.1409 | 1.0227 | 0.7638 | |
| 8 h | - | - | - | - | 0.0250 | 2.1166 | 0.8118 | ||
| 308 K | 4 h | 68.5823 | 0.0029 | 0.9651 | 0.7493 | 0.1913 | 1.0048 | 0.7482 | |
| 8 h | - | - | - | - | 0.0074 | 3.1919 | 0.9271 | ||
Publisher’s Note: MDPI stays neutral with regard to jurisdictional claims in published maps and institutional affiliations. |
© 2022 by the authors. Licensee MDPI, Basel, Switzerland. This article is an open access article distributed under the terms and conditions of the Creative Commons Attribution (CC BY) license (https://creativecommons.org/licenses/by/4.0/).
Share and Cite
Chen, P.; Wu, J.; He, Y.; Zhang, Y.; Yu, R.; Lu, X. Enhanced Nutrient Removal in A2N Effluent by Reclaimed Biochar Adsorption. Int. J. Environ. Res. Public Health 2022, 19, 4016. https://doi.org/10.3390/ijerph19074016
Chen P, Wu J, He Y, Zhang Y, Yu R, Lu X. Enhanced Nutrient Removal in A2N Effluent by Reclaimed Biochar Adsorption. International Journal of Environmental Research and Public Health. 2022; 19(7):4016. https://doi.org/10.3390/ijerph19074016
Chicago/Turabian StyleChen, Peng, Junkang Wu, Yue He, Yaping Zhang, Ran Yu, and Xiwu Lu. 2022. "Enhanced Nutrient Removal in A2N Effluent by Reclaimed Biochar Adsorption" International Journal of Environmental Research and Public Health 19, no. 7: 4016. https://doi.org/10.3390/ijerph19074016
APA StyleChen, P., Wu, J., He, Y., Zhang, Y., Yu, R., & Lu, X. (2022). Enhanced Nutrient Removal in A2N Effluent by Reclaimed Biochar Adsorption. International Journal of Environmental Research and Public Health, 19(7), 4016. https://doi.org/10.3390/ijerph19074016