
Automated Detection of Hypertension Using Continuous Wavelet Transform and a Deep Neural Network with Ballistocardiography Signals


Abstract
:1. Introduction
2. Cardio-Mechanical Signals
2.1. Seismocardiography (SCG) Signal
2.2. Forcecardiography (FCG)
2.3. Gyrocardiography (GCP)
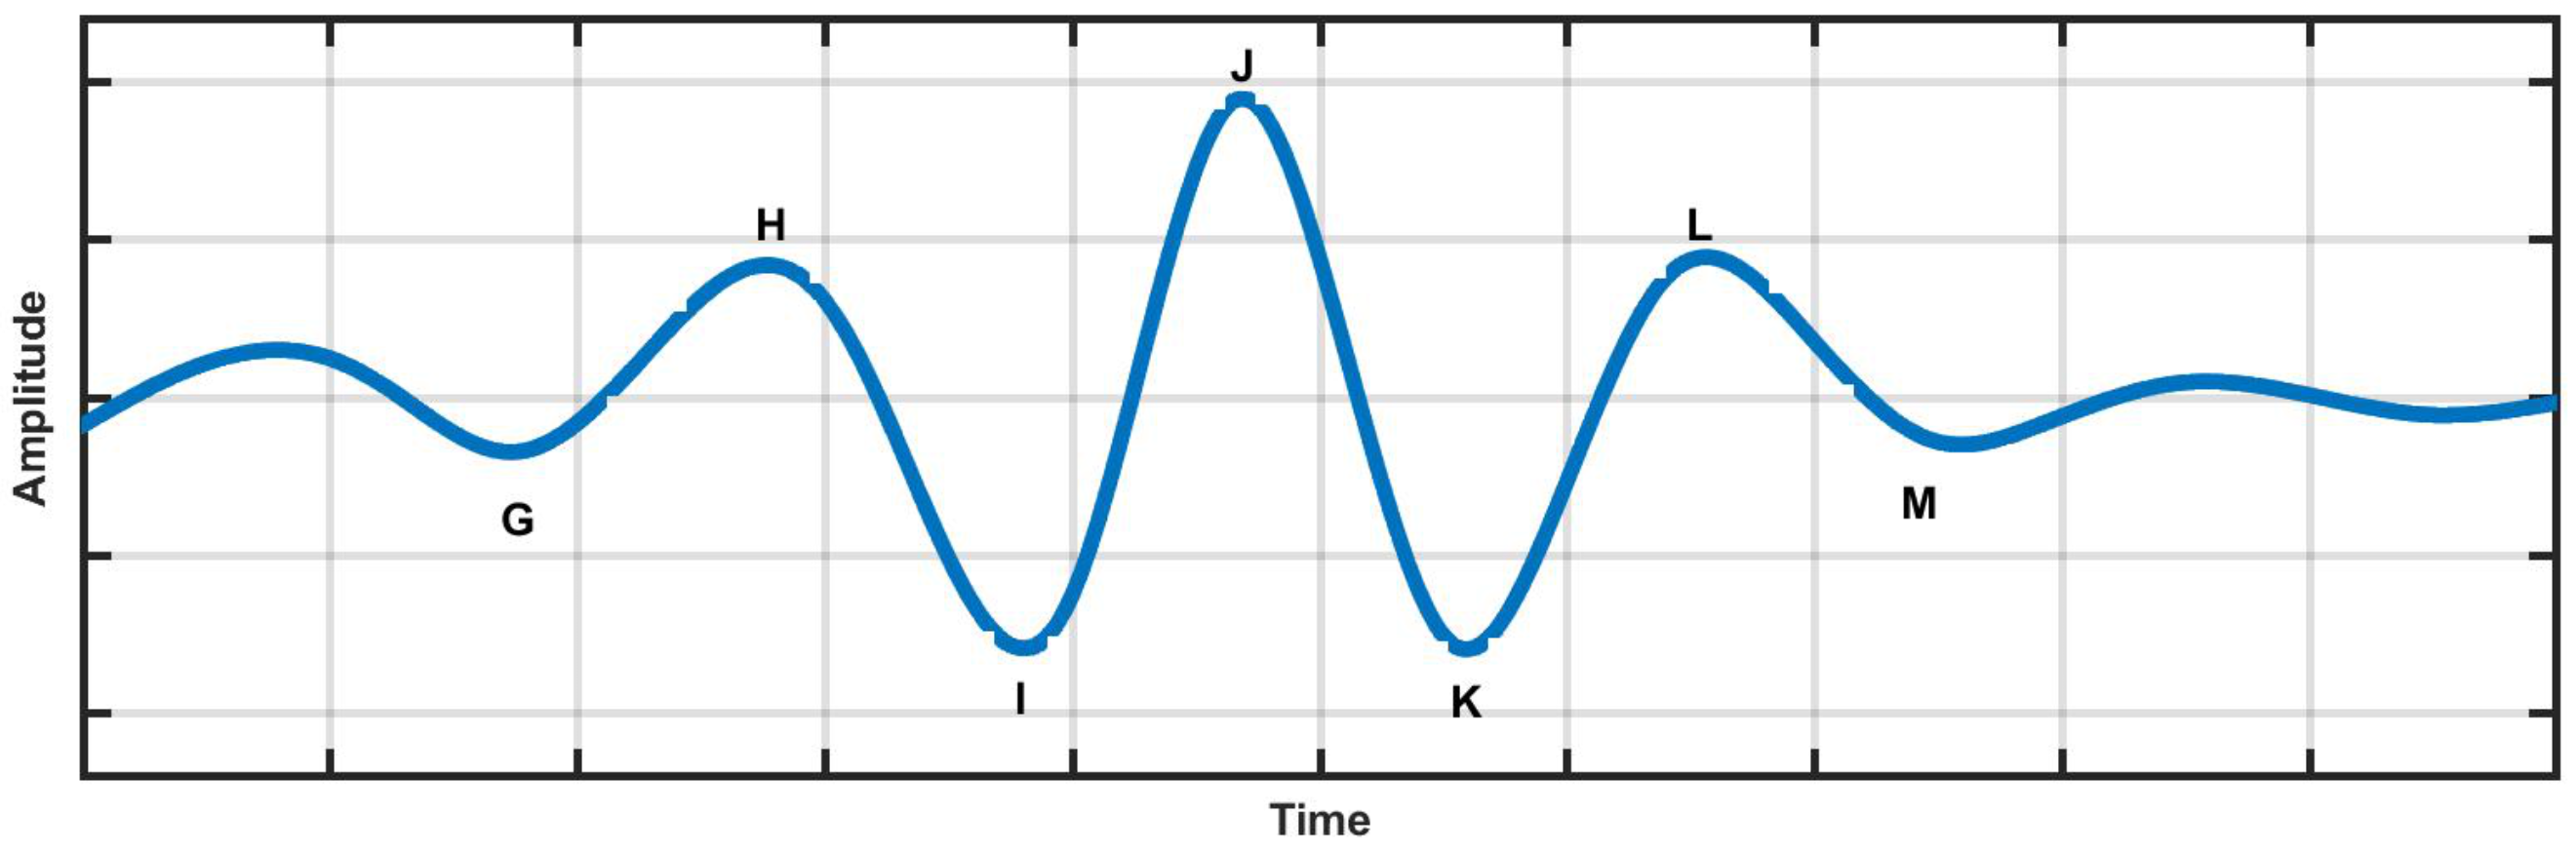
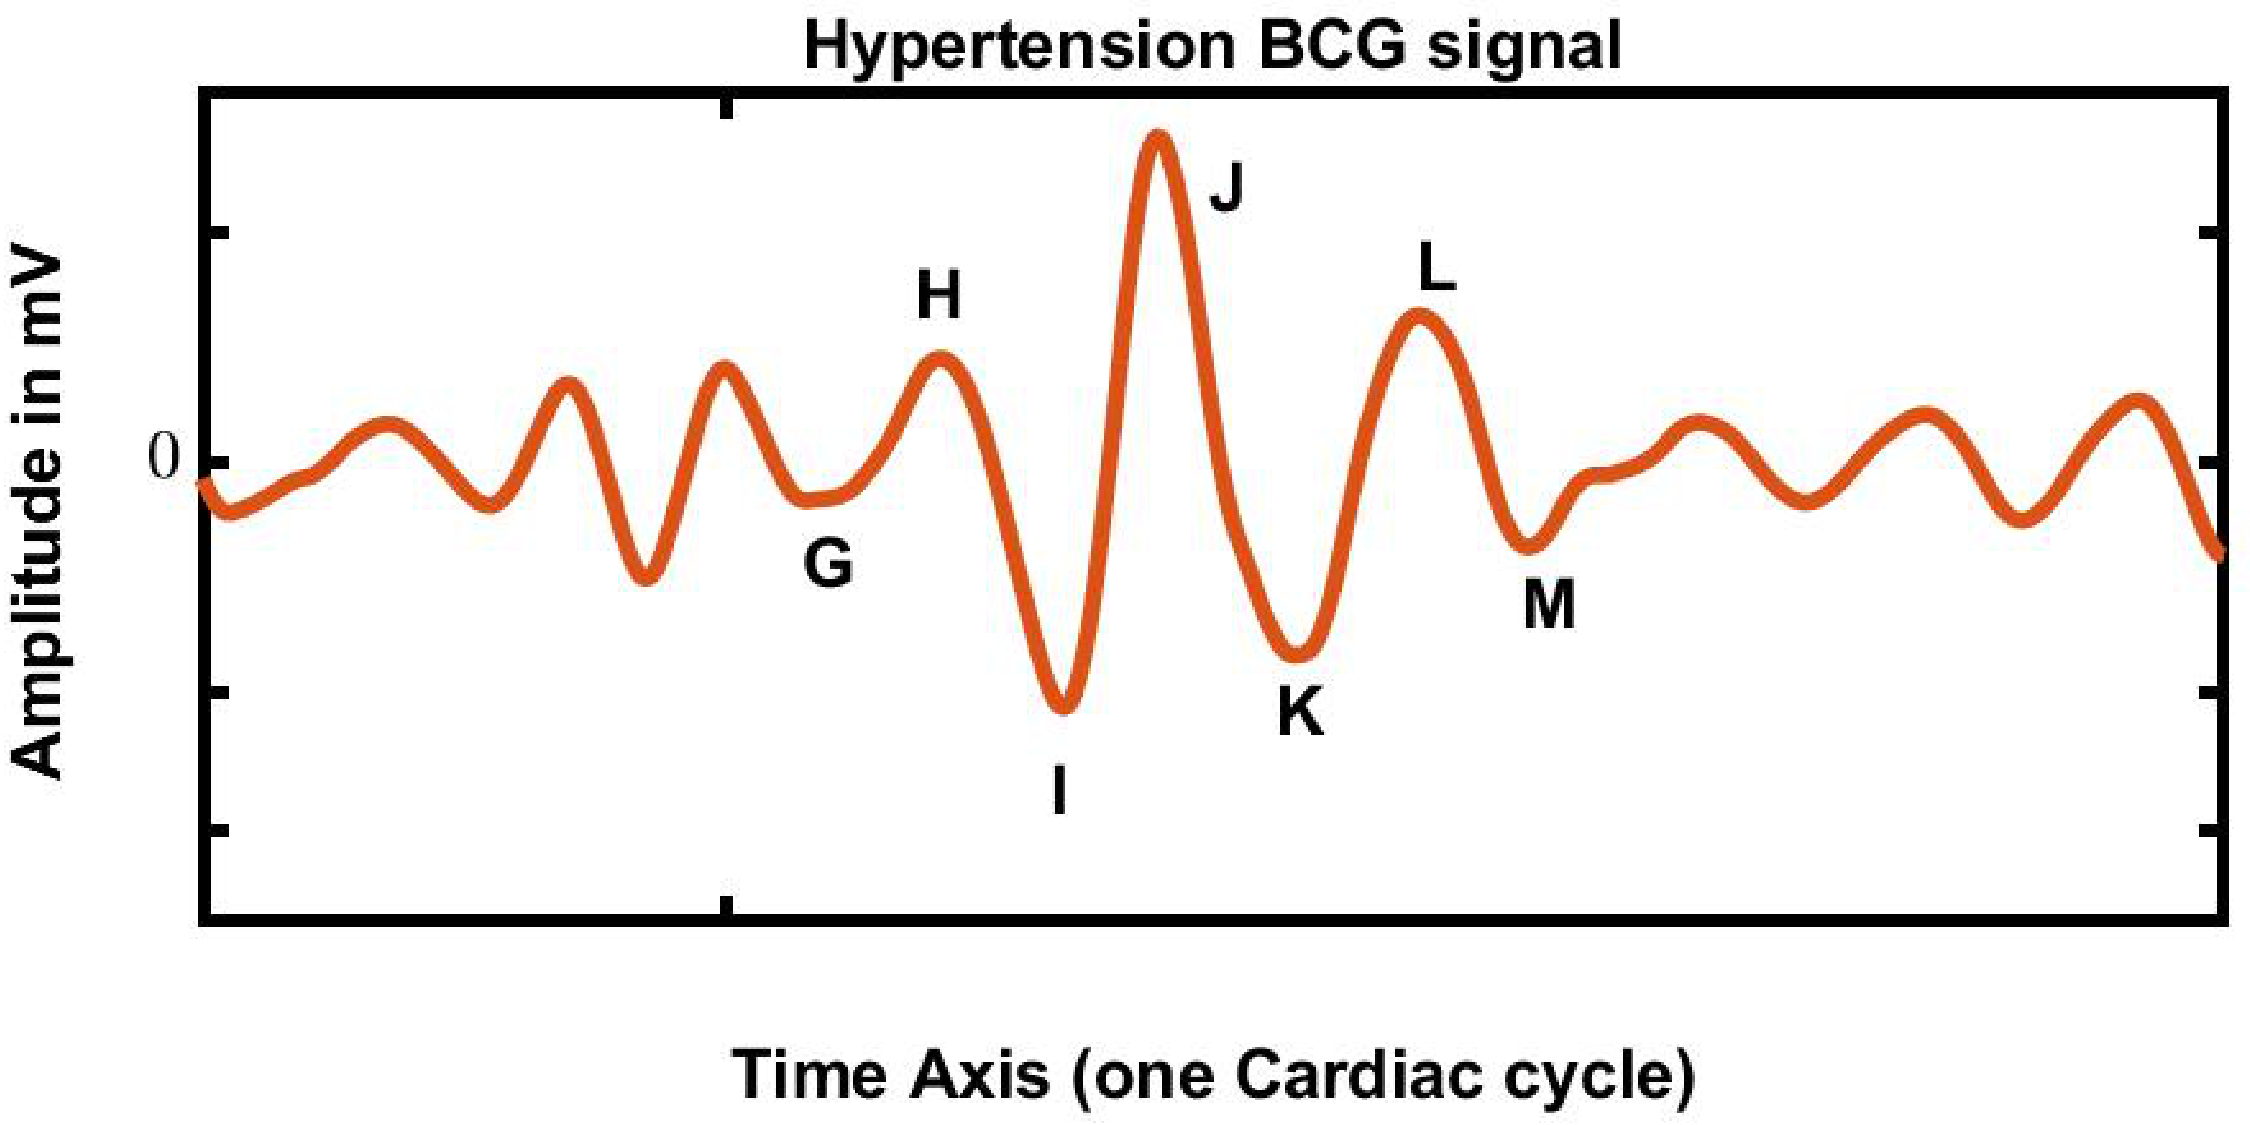
2.4. Ballistocardiography (BCG) Signal
2.5. BCG Signal Related Literature
2.6. Diagnosis of HPT from ECG, Photoplethysmogram (PPG), and HRV Signals
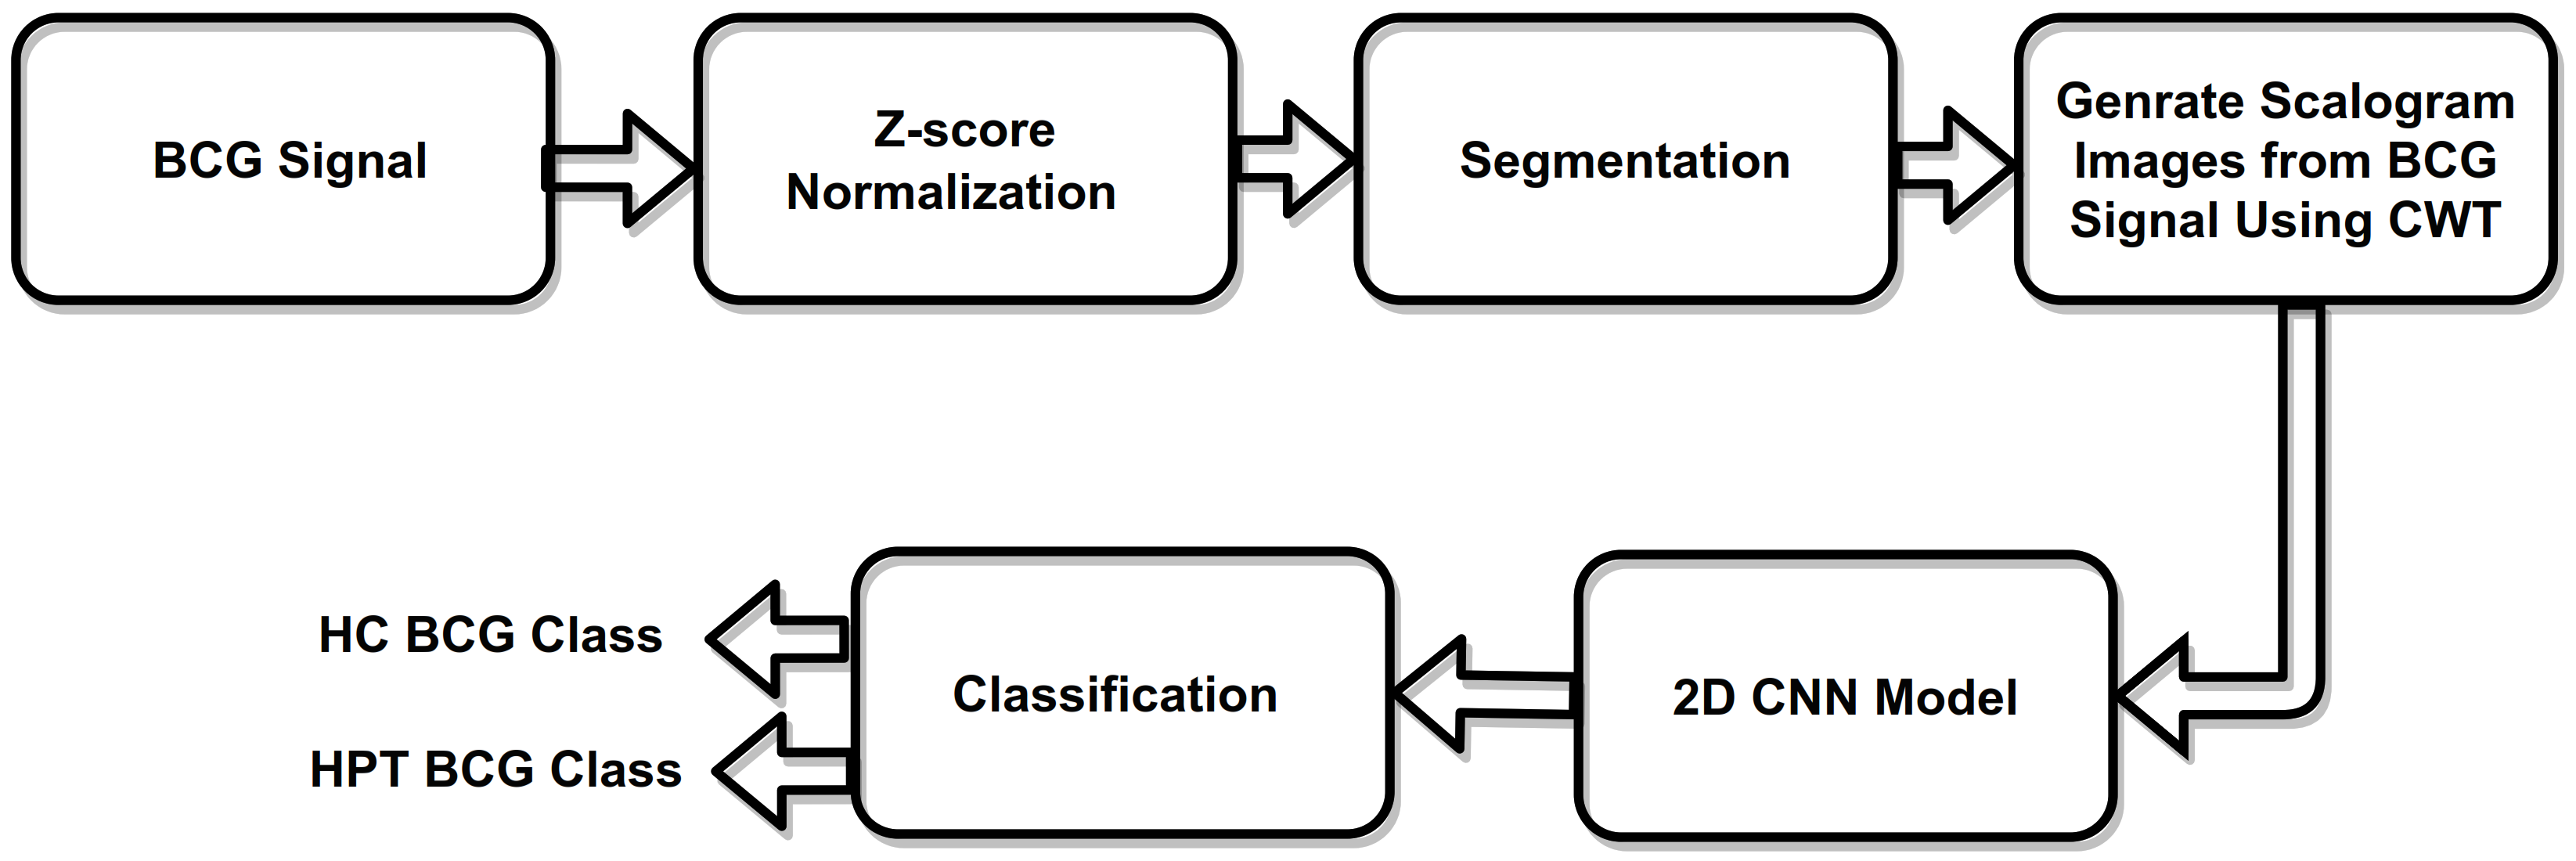
3. Methodology
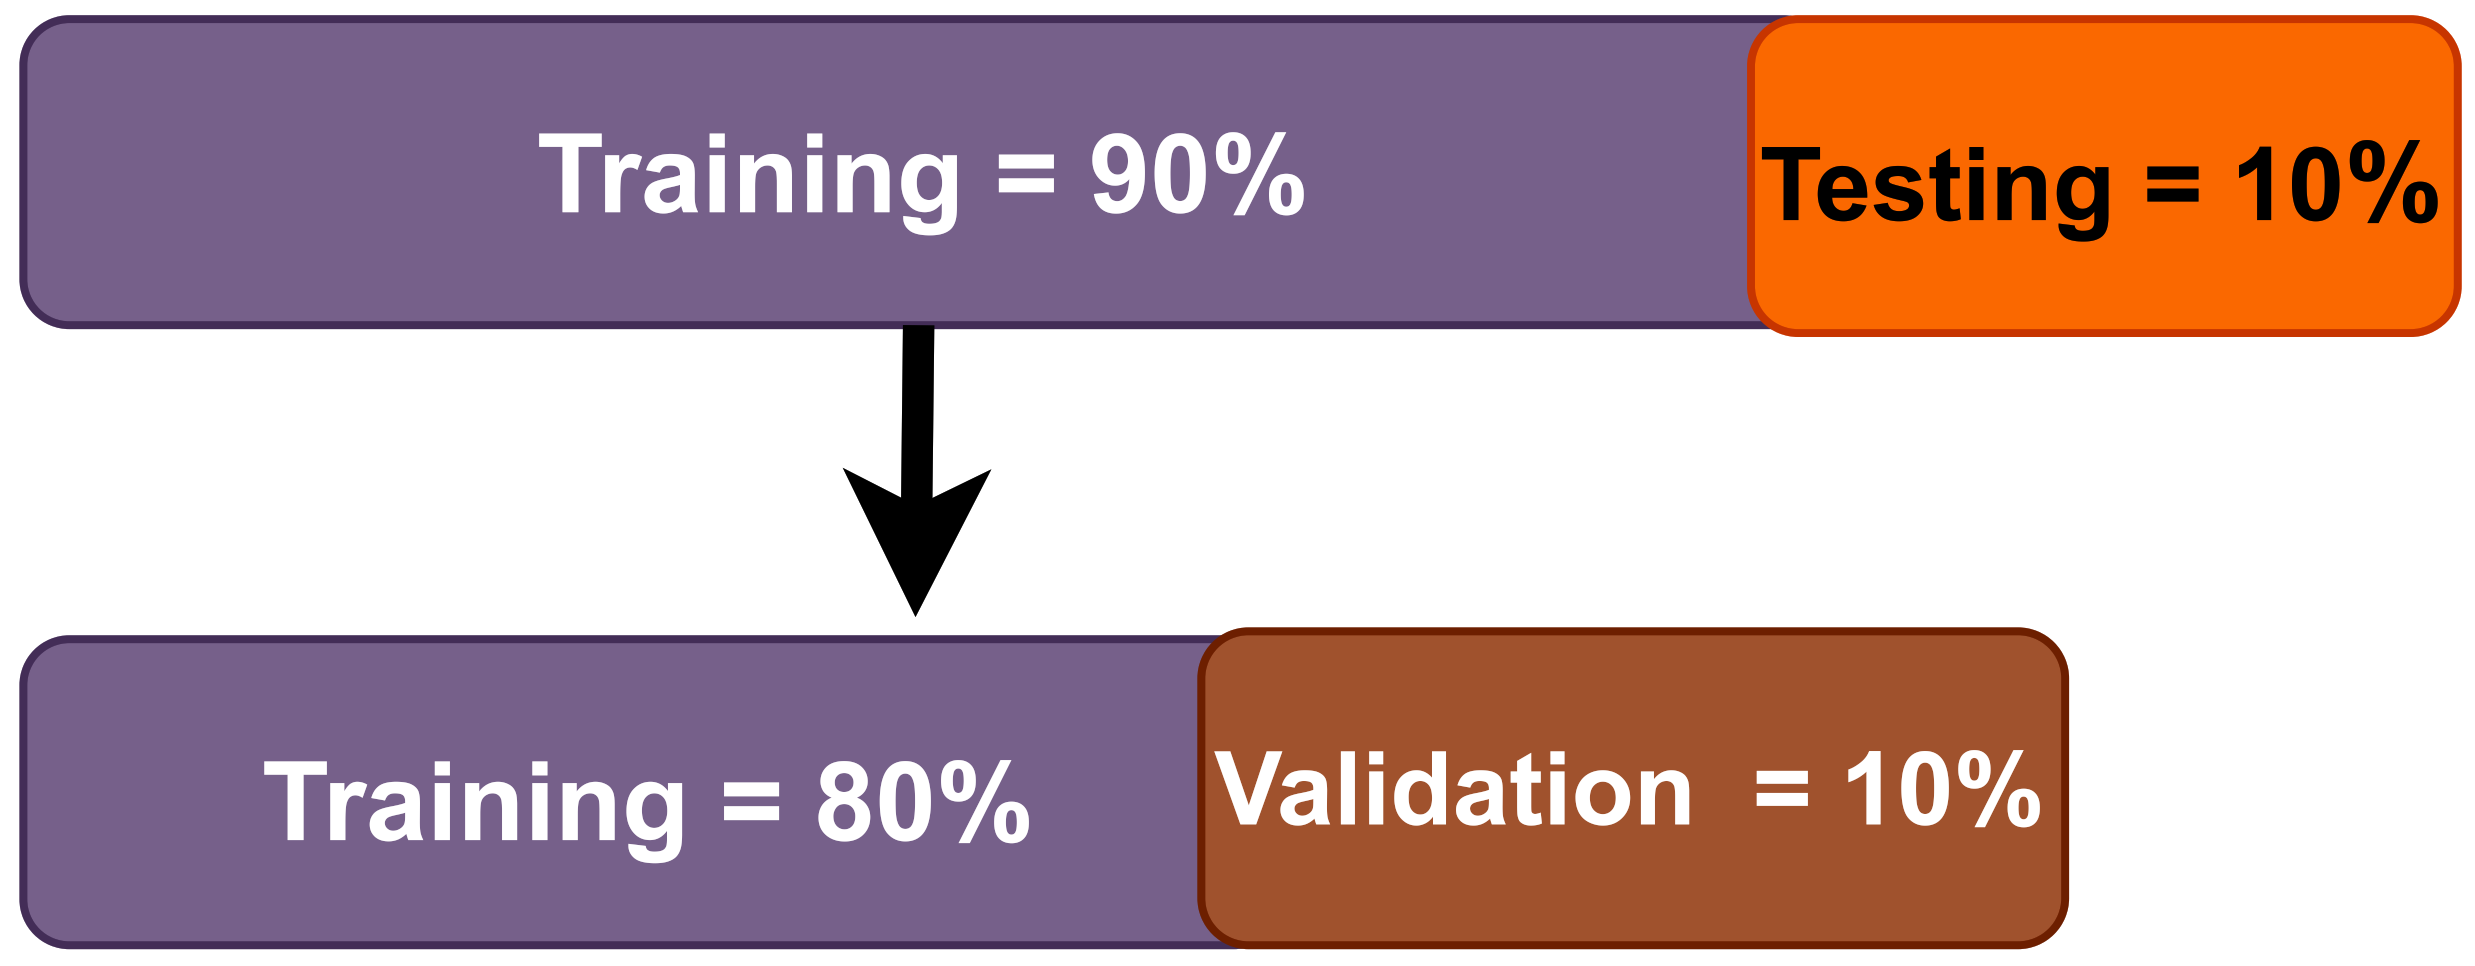
3.1. Database
3.2. Z-Score Normalization
3.3. Scalogram Generated Using CWT
3.4. Convolution Neural Network (CNN)
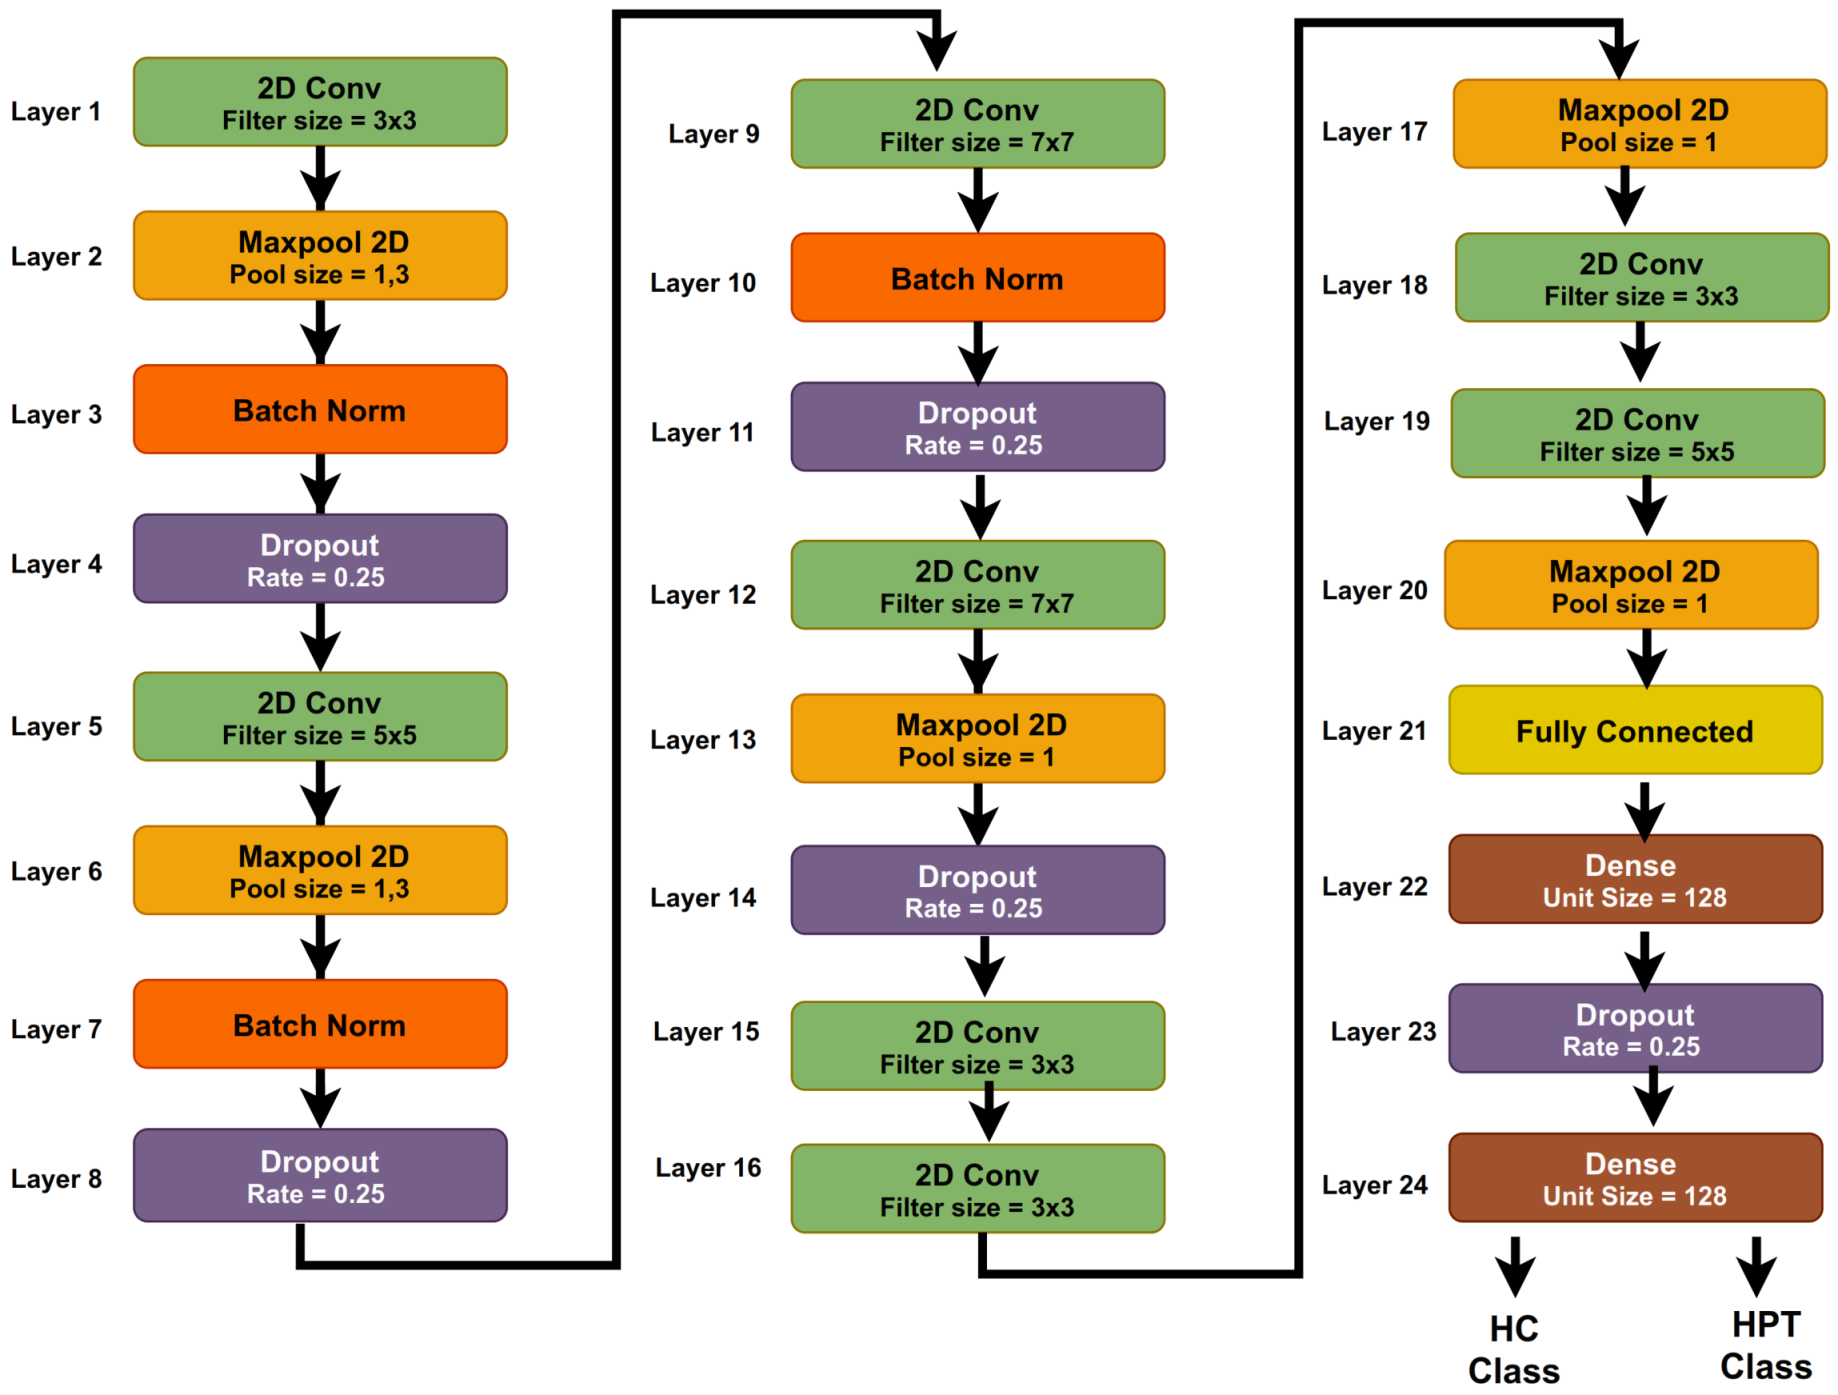
3.5. Proposed 2D-CNN Model
3.6. System Model Parameters
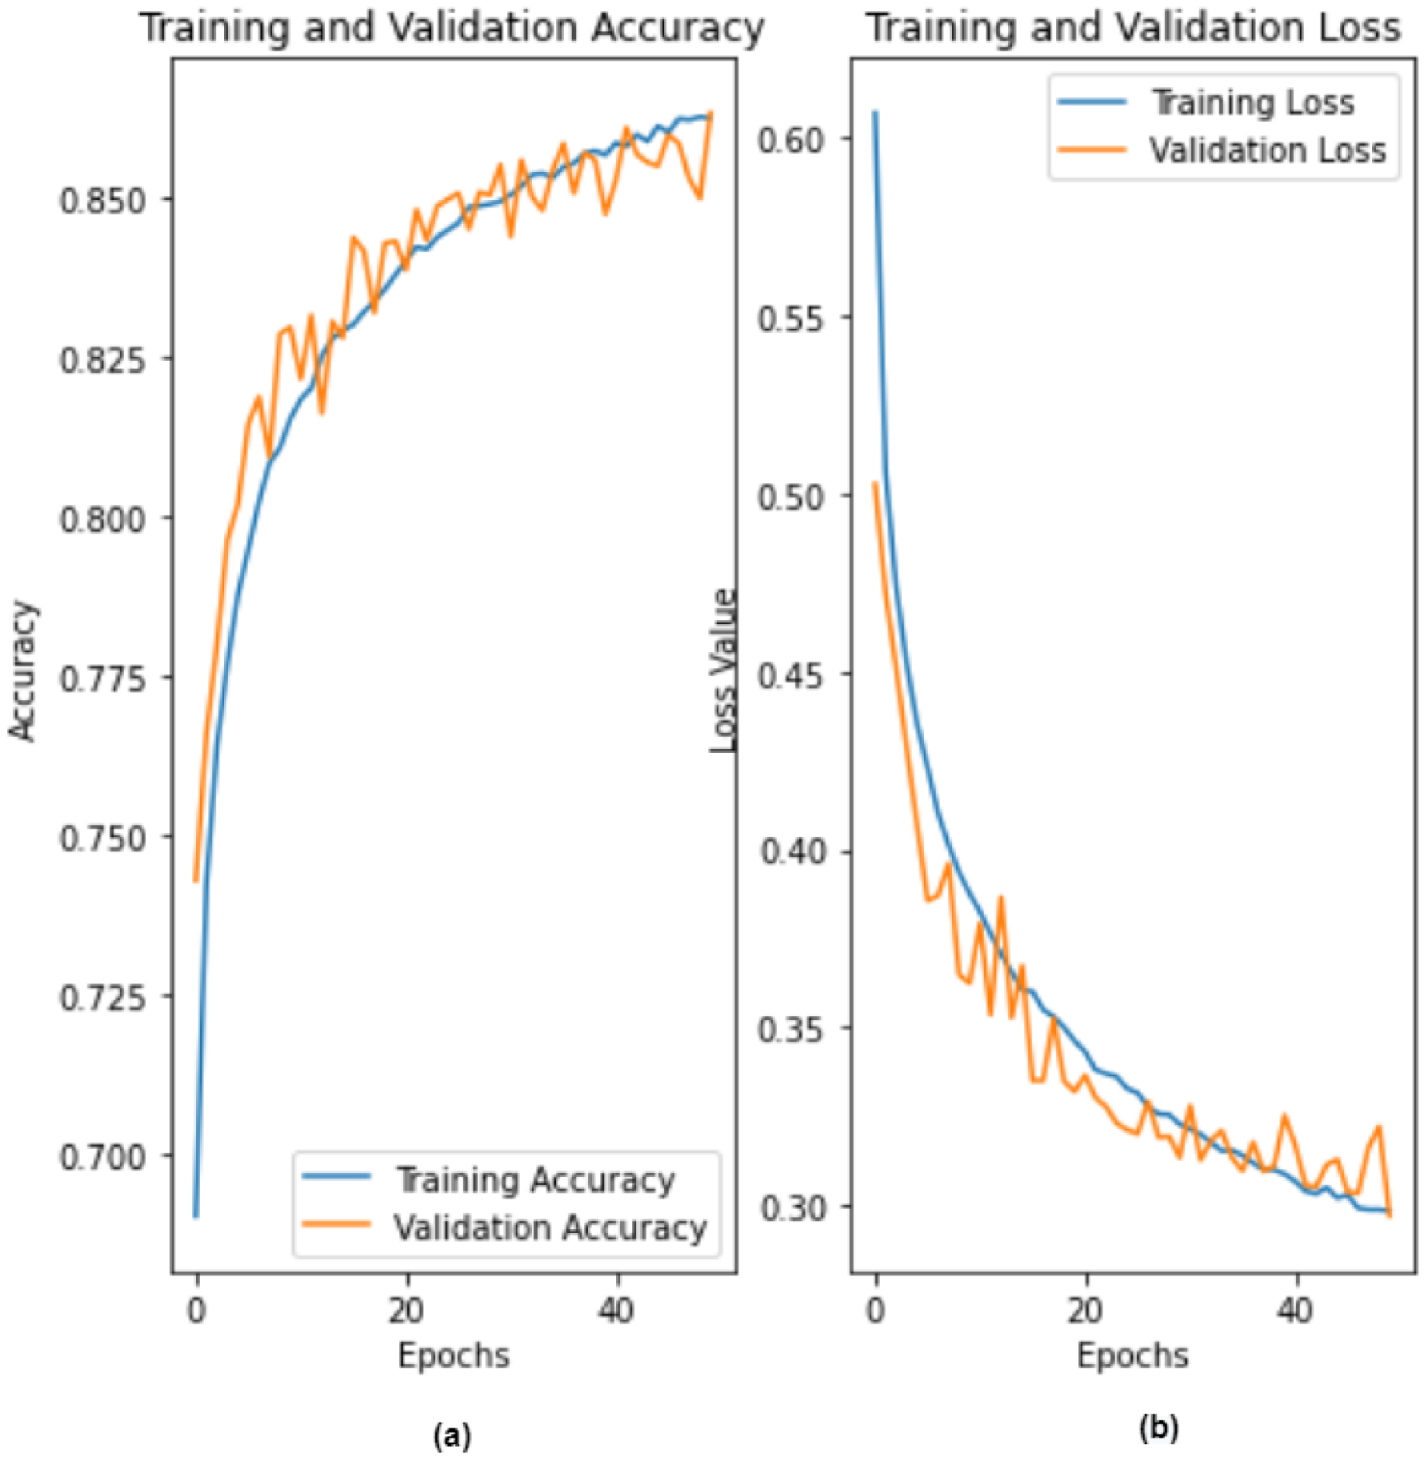
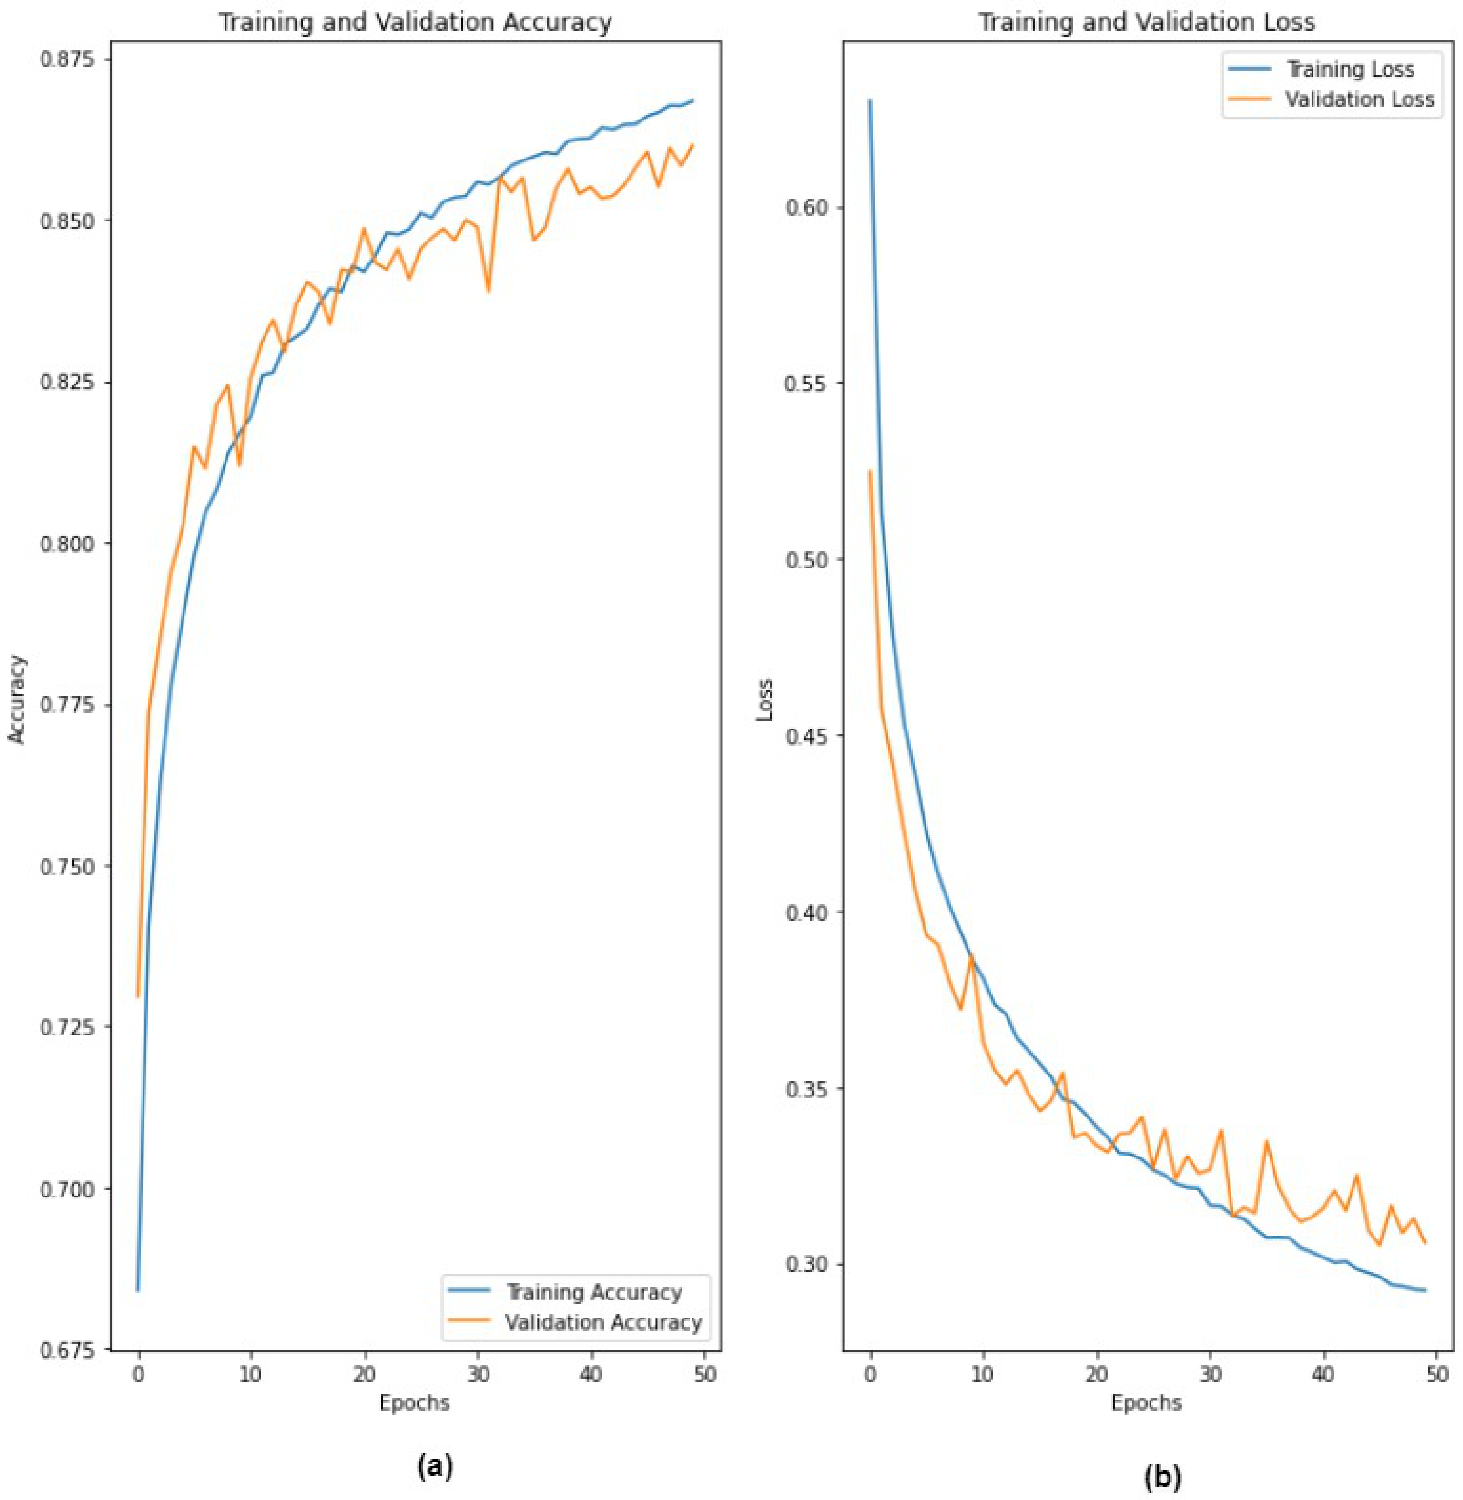
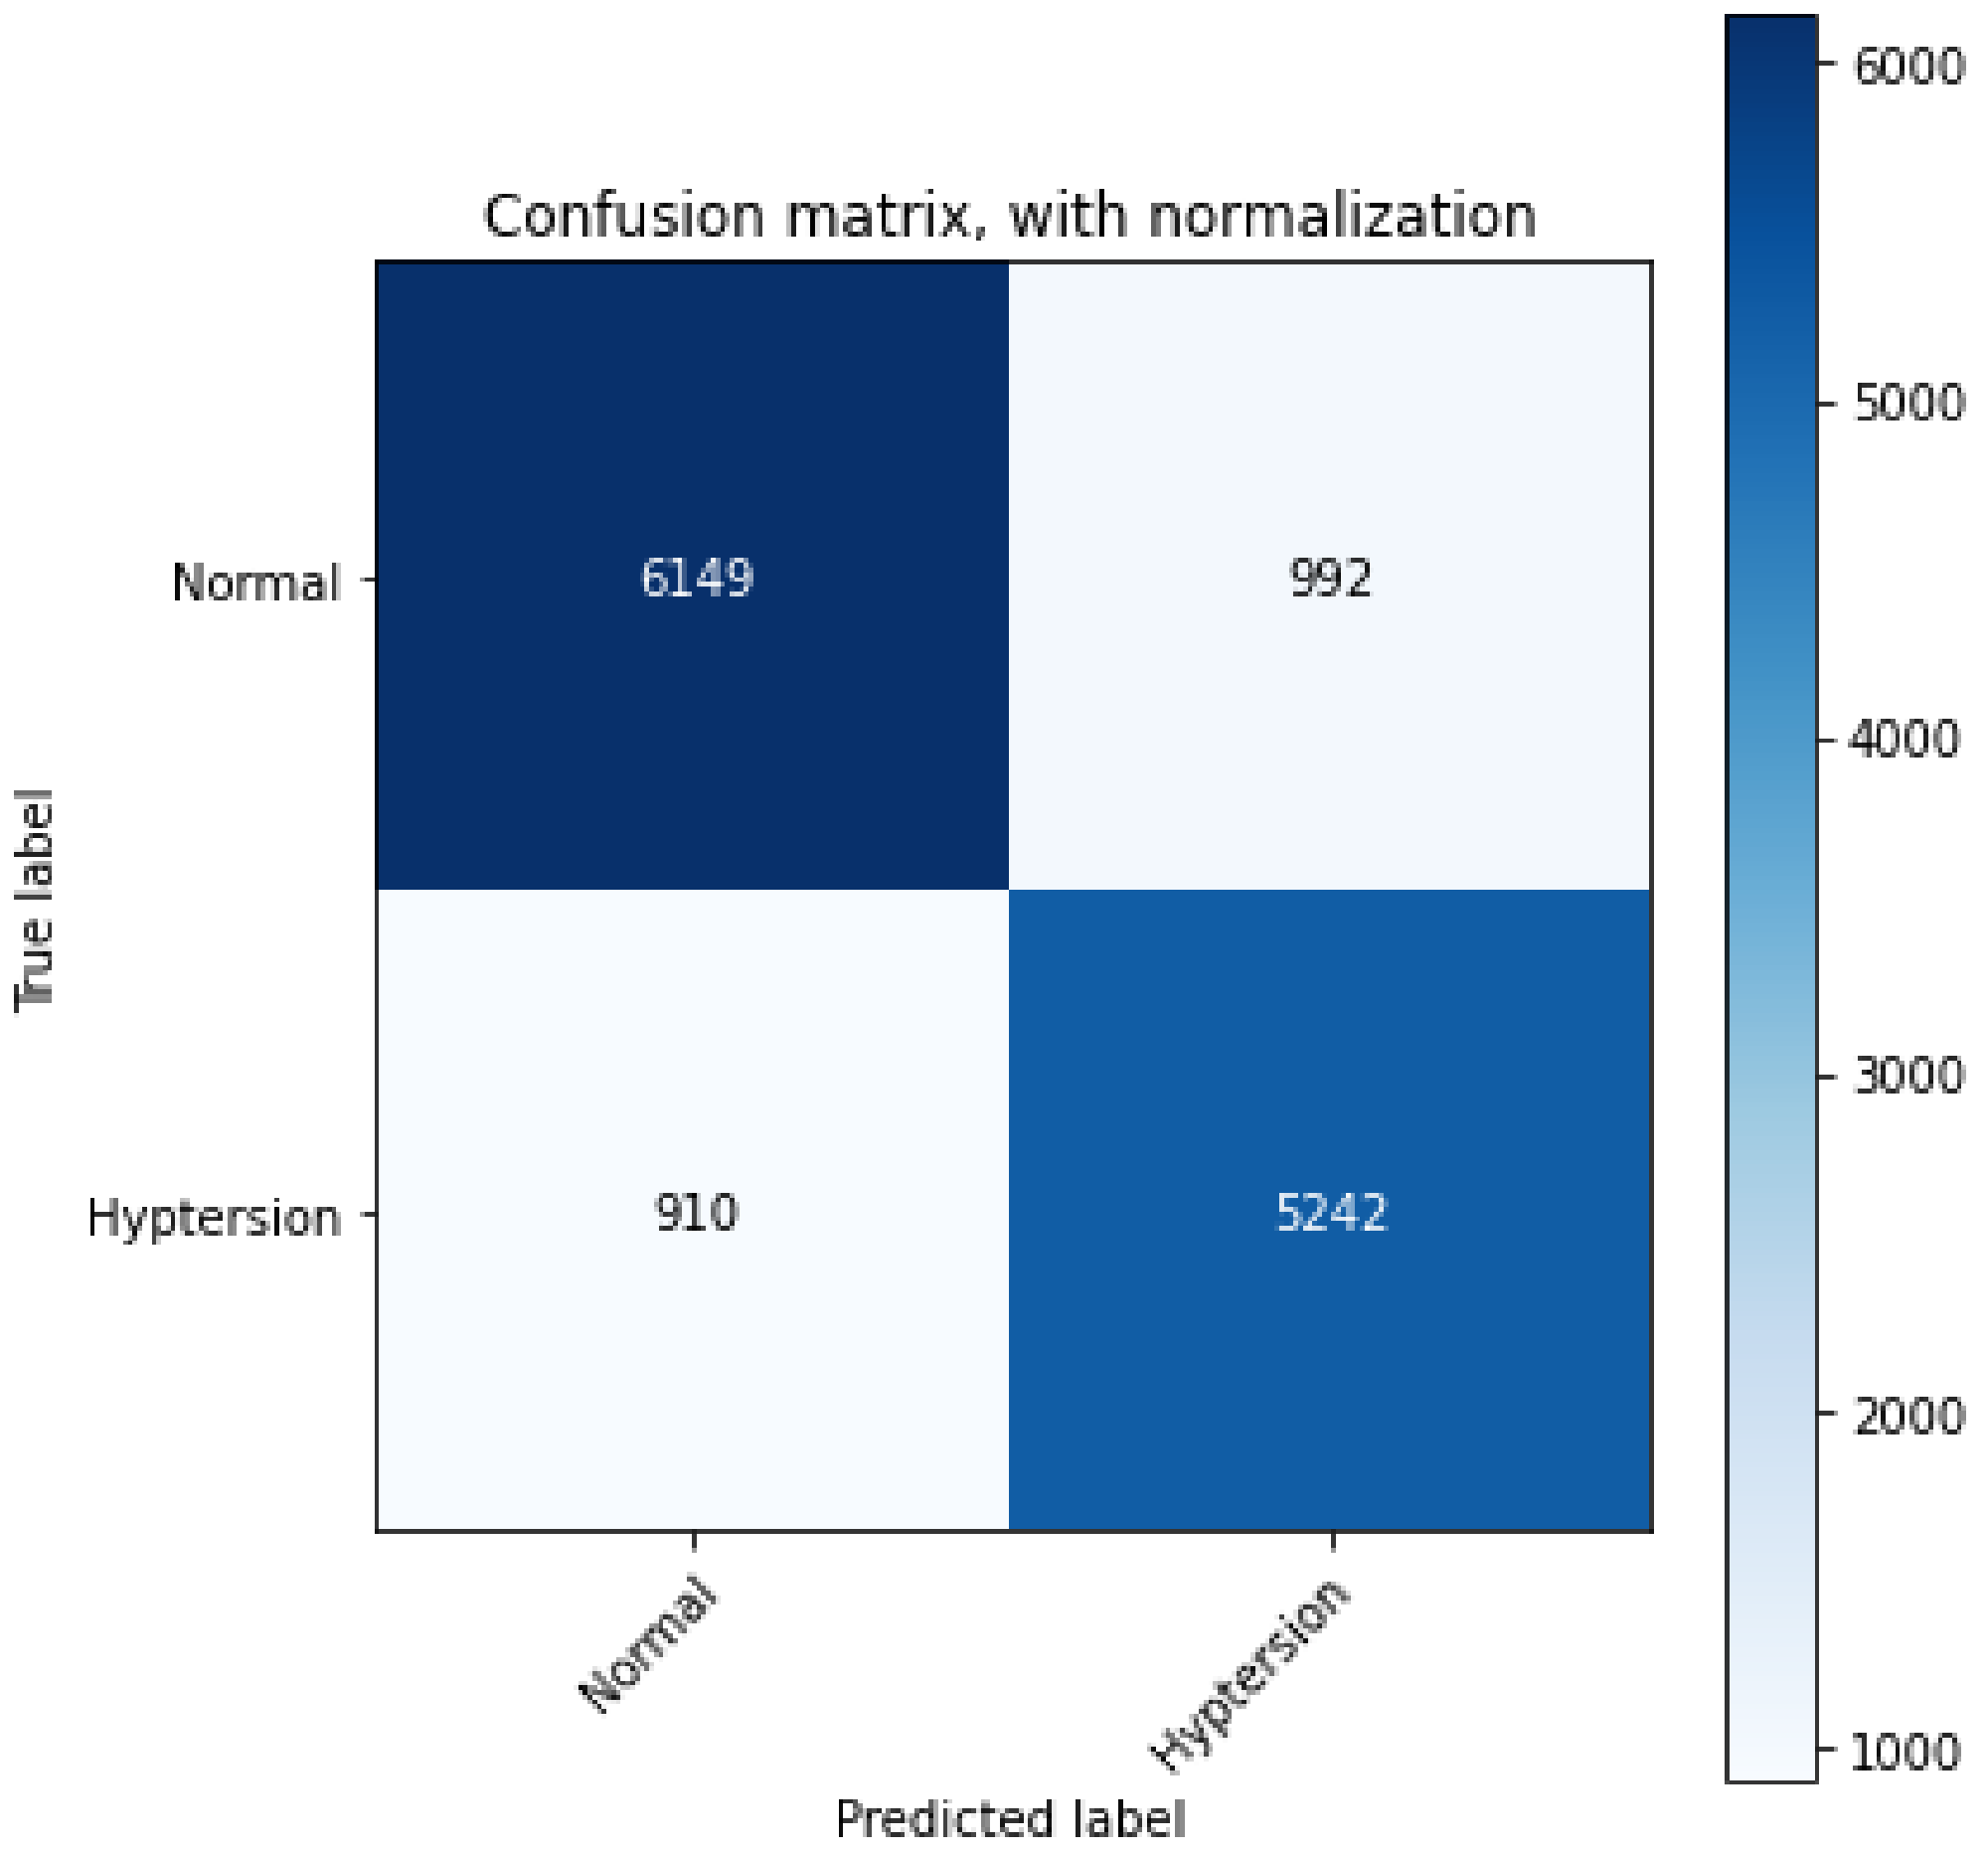
4. Results
5. Discussion
- For the classification of HPT employing BCG signals, the proposed deep-learning-based approach excelled compared to the machine-learning-based approaches employed by Liang et al. and Song et al.
- To the best of our knowledge, this is the first study to distinguish between HPT and HC subjects using direct BCG signals with a deep-learning-based model. Other previous works were developed using HRV signals.
- We segmented BCG signals into epochs of 30 s duration (rather than 1 min or longer); hence, the proposed model can be trained faster and therefore can be implemented in an integrated hardware device.
- Moreover, a CWT method was employed in the proposed method to convert BCG signals to scalograms, which contain useful information about the signal in the time–frequency domain.
6. Conclusions
Author Contributions
Funding
Institutional Review Board Statement
Informed Consent Statement
Data Availability Statement
Conflicts of Interest
References
- Jain, P.; Gajbhiye, P.; Tripathy, R.; Acharya, U.R. A two-stage Deep CNN Architecture for the Classification of Low-risk and High-risk Hypertension Classes using Multi-lead ECG Signals. Inform. Med. Unlocked 2020, 21, 100479. [Google Scholar] [CrossRef]
- Rajput, J.S.; Sharma, M.; Acharya, U.R. Hypertension Diagnosis Index for Discrimination of High-Risk Hypertension ECG Signals Using Optimal Orthogonal Wavelet Filter Bank. Int. J. Environ. Res. Public Health 2019, 16, 4068. [Google Scholar] [CrossRef] [PubMed] [Green Version]
- Rajput, J.S.; Sharma, M.; Tan, R.S.; Acharya, U.R. Automated detection of severity of hypertension ECG signals using an optimal bi-orthogonal wavelet filter bank. Comput. Biol. Med. 2020, 123, 103924. [Google Scholar] [CrossRef] [PubMed]
- Sharma, M.; Rajput, J.S.; Tan, R.S.; Acharya, U.R. Automated Detection of Hypertension Using Physiological Signals: A Review. Int. J. Environ. Res. Public Health 2021, 18, 5838. [Google Scholar] [CrossRef] [PubMed]
- Soh, D.; Ng, E.; Vicnesh, J.; Oh, S.L.; Tan, R.S.; Acharya, U.R. Automated diagnostic tool for hypertension using convolutional neural network. Comput. Biol. Med. 2020, 126, 103999. [Google Scholar] [CrossRef]
- Sharma, M.; Darji, J.; Thakrar, M.; Acharya, U.R. Automated identification of sleep disorders using wavelet-based features extracted from electrooculogram and electromyogram signals. Comput. Biol. Med. 2022, 143, 105224. [Google Scholar] [CrossRef]
- Sharma, M.; Patel, S.; Acharya, U.R. Expert system for detection of congestive heart failure using optimal wavelet and heart rate variability signals for wireless cloud-based environment. Expert Syst. 2021, e12903. [Google Scholar] [CrossRef]
- Taebi, A.; Solar, B.; Bomar, A.; Sandler, R.; Mansy, H.A. Recent Advances in Seismocardiography. Vibration 2019, 2, 64–86. [Google Scholar] [CrossRef] [Green Version]
- Inan, O.; Migeotte, P.F.; Park, K.; Etemadi, M.; Tavakolian, K.; Casanella, R.; Zanetti, J.; Tank, J.; Funtova, I.; Prisk, K.; et al. Ballistocardiography and Seismocardiography: A Review of Recent Advances. IEEE J. Biomed. Health Inform. 2014, 19, 1414–1427. [Google Scholar] [CrossRef] [Green Version]
- Andreozzi, E.; Fratini, A.; Esposito, D.; Naik, G.; Polley, C.; Gargiulo, G.; Bifulco, P. Forcecardiography: A Novel Technique to Measure Heart Mechanical Vibrations onto the Chest Wall. Sensors 2020, 20, 3885. [Google Scholar] [CrossRef]
- Andreozzi, E.; Gargiulo, G.; Esposito, D.; Bifulco, P. A Novel Broadband Forcecardiography Sensor for Simultaneous Monitoring of Respiration, Infrasonic Cardiac Vibrations and Heart Sounds. Front. Physiol. 2021, 12, 725716. [Google Scholar] [CrossRef]
- Dehkordi, P.; Tavakolian, K.; Jafari Tadi, M.; Zakeri, V.; Khosrow-khavar, F. Investigating the estimation of cardiac time intervals using gyrocardiography. Physiol. Meas. 2020, 41, 055004. [Google Scholar] [CrossRef]
- Sieciński, S.; Kostka, P.; Tkacz, E. Gyrocardiography: A Review of the Definition, History, Waveform Description, and Applications. Sensors 2020, 20, 6675. [Google Scholar] [CrossRef]
- Jafari Tadi, M.; Lehtonen, E.; Saraste, A.; Tuominen, J.; Koskinen, J.; Teräs, M.; Airaksinen, J.; Pänkäälä, M.; Koivisto, T. Gyrocardiography: A New Non-invasive Monitoring Method for the Assessment of Cardiac Mechanics and the Estimation of Hemodynamic Variables. Sci. Rep. 2017, 7, 6823. [Google Scholar] [CrossRef]
- Liu, F.; Zhou, X.; Wang, Z.; Cao, J.; Wang, H.; Zhang, Y. Unobtrusive Mattress-Based Identification of Hypertension by Integrating Classification and Association Rule Mining. Sensors 2019, 19, 1489. [Google Scholar] [CrossRef] [Green Version]
- Sadek, I.; Biswas, J.; Abdulrazak, B. Ballistocardiogram signal processing: A review. Health Inf. Sci. Syst. 2019, 7, 10. [Google Scholar] [CrossRef]
- Burger, H.; Korsten, J.; Noordergraaf, A.; Ullersma, P. Physical basis of ballistocardiography. IV. The relative movement of subject and ballistocardiograph. Am. Heart J. 1956, 52, 653–673. [Google Scholar] [CrossRef]
- Starr, I. The relation of the ballistocardiogram to cardiac function. Am. J. Cardiol. 1959, 2, 737–747. [Google Scholar] [CrossRef]
- Knoop, A. Experimental Investigations on Ultra-Low Frequency Displacement Ballistocardiography; NASA TT F-269; NASA Contractor Report; National Aeronautics and Space Administration: Washington, DC, USA, 1965; pp. 1–107. [Google Scholar]
- Scarborough, W.R.; Talbot, S.A.; Braunstein, J.R.; Rappaport, M.B.; Dock, W.; Scarborough, W.R.; Hamilton, W.F.; Smith, J.E.; Nickerson, J.L.; Talbot, S.A.; et al. Proposals for ballistocardiographic nomenclature and conventions: Revised and extended report of Committee on Ballistocardiographic Terminology. Circulation 1956, 14, 435–450. [Google Scholar] [CrossRef] [Green Version]
- Rajput, J.S.; Sharma, M.; Kumbhani, D.; Acharya, U.R. Automated detection of hypertension using wavelet transform and nonlinear techniques with ballistocardiogram signals. Inform. Med. Unlocked 2021, 26, 100736. [Google Scholar] [CrossRef]
- Chen, Z.; Yang, X.; Teo, J.T.; Ng, S. Noninvasive monitoring of blood pressure using optical Ballistocardiography and Photoplethysmograph approaches. In Proceedings of the 2013 35th Annual International Conference of the IEEE Engineering in Medicine and Biology Society (EMBC), Osaka, Japan, 3–7 July 2013; 2425–2428; Volume 2013. [Google Scholar] [CrossRef]
- Lee, K.; Roh, J.; Cho, D.; Hyeong, J.; Kim, S. A Chair-Based Unconstrained/Nonintrusive Cuffless Blood Pressure Monitoring System Using a Two-Channel Ballistocardiogram. Sensors 2019, 19, 595. [Google Scholar] [CrossRef] [PubMed] [Green Version]
- Seok, W.; Lee, K.; Cho, D.; Roh, J.; Kim, S. Blood Pressure Monitoring System Using a Two-Channel Ballistocardiogram and Convolutional Neural Networks. Sensors 2021, 21, 2303. [Google Scholar] [CrossRef] [PubMed]
- Song, Y.; Ni, H.; Zhou, X.; Zhao, W.; Wang, T. Extracting Features for Cardiovascular Disease Classification Based on Ballistocardiography. In Proceedings of the 2015 IEEE 12th International Conference on Ubiquitous Intelligence and Computing and 2015 IEEE 12th International Conference on Autonomic and Trusted Computing and 2015 IEEE 15th International Conference on Scalable Computing and Communications and Its Associated Workshops (UIC-ATC-ScalCom), Beijing, China, 20 October 2015; pp. 1230–1235. [Google Scholar]
- Liang, Y.; Chen, Z.; Ward, R.; Elgendi, M. Hypertension Assessment Using Photoplethysmography: A Risk Stratification Approach. J. Clin. Med. 2018, 8, 12. [Google Scholar] [CrossRef] [PubMed] [Green Version]
- Liang, Y.; Chen, Z.; Ward, R.; Elgendi, M. Hypertension Assessment via ECG and PPG Signals: An Evaluation Using MIMIC Database. Diagnostics 2018, 8, 65. [Google Scholar] [CrossRef] [Green Version]
- Liang, Y.; Chen, Z.; Ward, R.; Elgendi, M. Photoplethysmography and Deep Learning: Enhancing Hypertension Risk Stratification. Biosensors 2018, 8, 101. [Google Scholar] [CrossRef] [Green Version]
- Alkhodari, M.; Islayem, D.; Alskafi, F.; Khandoker, A. Predicting hypertensive patients with higher risk of developing vascular events using heart rate variability and machine learning. IEEE Access 2020, 8, 192727–192739. [Google Scholar] [CrossRef]
- Soh, D.; Ng, E.; Vicnesh, J.; Oh, S.L.; Tan, R.S.; Acharya, U.R. A computational intelligence tool for the detection of hypertension using empirical mode decomposition. Comput. Biol. Med. 2020, 118, 103630. [Google Scholar] [CrossRef]
- Ni, H.; Wang, Y.; Xu, G.; Shao, Z.; Zhang, W.; Zhou, X. Multiscale Fine-Grained Heart Rate Variability Analysis for Recognizing the Severity of Hypertension. Comput. Math. Methods Med. 2019, 2019, 4936179. [Google Scholar] [CrossRef] [Green Version]
- Melillo, P.; Izzo, R.; Orrico, A.; Scala, P.; Attanasio, M.; Mirra, M.; Luca, N.; Pecchia, L. Automatic Prediction of Cardiovascular and Cerebrovascular Events Using HRV Analysis. PLoS ONE 2015, 10, e0118504. [Google Scholar] [CrossRef]
- Poddar, M.; Birajdar, A.C.; Virmani, J.; Kriti. Chapter 5—Automated Classification of Hypertension and Coronary Artery Disease Patients by PNN, KNN, and SVM Classifiers Using HRV Analysis. In Machine Learning in Bio-Signal Analysis and Diagnostic Imaging; Academic Press: Cambridge, MA, USA, 2019; pp. 99–125. [Google Scholar] [CrossRef]
- Mairal, J.; Koniusz, P.; Harchaoui, Z.; Schmid, C. Convolutional Kernel Networks. In Proceedings of the Advances in Neural Information Processing Systems, Montreal, QC, Canada, 8–13 December 2014. [Google Scholar]
- Oshea, K.; Nash, R. An Introduction to Convolutional Neural Networks. arXiv 2015, arXiv:1511.08458. [Google Scholar]
- Jain, A.; Nandakumar, K.; Ross, A. Score normalization in multimodal biometric system. Pattern Recognit. 2005, 38, 2270–2285. [Google Scholar] [CrossRef]
- Sharma, M.; Patel, V.; Acharya, U.R. Automated identification of insomnia using optimal bi-orthogonal wavelet transform technique with single-channel EEG signals. Knowl.-Based Syst. 2021, 224, 107078. [Google Scholar] [CrossRef]
- Sharma, M.; Patel, V.; Tiwari, J.; Acharya, U.R. Automated Characterization of Cyclic Alternating Pattern Using Wavelet-Based Features and Ensemble Learning Techniques with EEG Signals. Diagnostics 2021, 11, 1380. [Google Scholar] [CrossRef]
- Sharma, M.; Tiwari, J.; Patel, V.; Acharya, U.R. Automated Identification of Sleep Disorder Types Using Triplet Half-Band Filter and Ensemble Machine Learning Techniques with EEG Signals. Electronics 2021, 10, 1531. [Google Scholar] [CrossRef]
- Sharma, M.; Tiwari, J.; Acharya, U.R. Automatic Sleep-Stage Scoring in Healthy and Sleep Disorder Patients Using Optimal Wavelet Filter Bank Technique with EEG Signals. Int. J. Environ. Res. Public Health 2021, 18, 3087. [Google Scholar] [CrossRef]
- Sharma, M.; Patel, S.; Choudhary, S.; Acharya, U.R. Automated Detection of Sleep Stages Using Energy-Localized Orthogonal Wavelet Filter Banks. Arab. J. Sci. Eng. 2019, 45, 2531–2544. [Google Scholar] [CrossRef]
- Sharma, M.; Shah, S.; PV, A. A Novel Approach for Epilepsy Detection Using Time-Frequency Localized Bi-Orthogonal Wavelet Filter. J. Mech. Med. Biol. 2019, 19, 1940007. [Google Scholar] [CrossRef]
- Sharma, M.; Acharya, U.R. Automated detection of schizophrenia using optimal wavelet-based l1 norm features extracted from single-channel EEG. Cogn. Neurodyn. 2021, 15, 661–674. [Google Scholar] [CrossRef]
- Sharma, M.; Dhiman, H.S.; Acharya, U.R. Automatic identification of insomnia using optimal antisymmetric biorthogonal wavelet filter bank with ECG signals. Comput. Biol. Med. 2021, 131, 104246. [Google Scholar] [CrossRef]
- Sharma, M.; Kumbhani, D.; Yadav, A.; Acharya, U.R. Automated Sleep apnea detection using optimal duration-frequency concentrated wavelet-based features of pulse oximetry signals. Appl. Intell. 2021, 52, 1325–1337. [Google Scholar] [CrossRef]
- Turk, O.; Ozerdem, M.S. Epilepsy detection by using scalogram based convolutional neural network from EEG signals. Brain Sci. 2019, 9, 115. [Google Scholar] [CrossRef] [PubMed] [Green Version]
- Acharya, U.R.; Oh, S.L.; Hagiwara, Y.; Tan, J.H.; Adeli, H. Deep convolutional neural network for the automated detection and diagnosis of seizure using EEG signals. Comput. Biol. Med. 2017, 100, 270–278. [Google Scholar] [CrossRef] [PubMed]
- Bhatt, D.; Patel, C.; Talsania, H.; Patel, J.; Vaghela, R.; Pandya, S.; Modi, K.; Ghayvat, H. CNN Variants for Computer Vision: History, Architecture, Application, Challenges and Future Scope. Electronics 2021, 10, 2470. [Google Scholar] [CrossRef]


| Nomenclature for BCG | Description |
|---|---|
| (a) SW |
|
| (b) DW |
|
| (c) PSW |
|
| S. No. | Layer | Size of Filters | Size of Kernel | Unit Size | Parameter |
|---|---|---|---|---|---|
| 1 | 2DConv | 64 | 3 | - | RL, STR = 2 |
| 2 | Maxpool2D | - | - | 1,3 | STR = 1 |
| 3 | Batch Norm | - | - | - | - |
| 4 | Dropout | - | - | - | RT = 0.25 |
| 5 | 2DConv | 64 | 5 | - | RL, STR = 2 |
| 6 | Maxpool2D | - | - | 1,3 | STR = 1 |
| 7 | Batch Norm | - | - | - | - |
| 8 | Dropout | - | - | - | RT = 0.25 |
| 9 | 2DConv | 128 | 7 | - | RL, STR = 2 |
| 10 | Batch Norm | - | - | – | - |
| 11 | Dropout | - | RT = 0.25 | ||
| 12 | 2DConv | 128 | 7 | - | RL, STR = 2 |
| 13 | Maxpool2D | - | - | 1 | STR = 1 |
| 14 | Dropout | - | - | - | RT = 0.25 |
| 15 | 2DConv | 256 | 3 | - | RL, STR = 2 |
| 16 | 2DConv | 256 | 3 | - | RL, STR = 2 |
| 17 | Maxpool2D | - | - | 1 | STR = 1 |
| 18 | 2DConv | 64 | 3 | - | RL, STR = 2 |
| 19 | 2DConv | 64 | 5 | - | RL, STR = 2 |
| 20 | Maxpool2D | - | - | 1 | STR = 1 |
| 21 | Flatten | - | - | - | – |
| 22 | Dense | - | - | 128 | RL |
| 23 | Dropout | - | - | - | RT = 0.5 |
| 24 | Dense | - | - | Number of class = 2 | Sigmoid |
| Hyperparameters | |
|---|---|
| BS | 100 |
| KP | Same |
| KR (L1) | 0.001 |
| OM | Adam |
| LRT | 0.001 |
| DR | 0.01 |
| LF | Binary cross-entropy |
| Measure | Highest Value |
|---|---|
| Sensitivity | 0.876 |
| Specificity | 0.843 |
| Precision | 0.861 |
| Accuracy | 0.861 |
| F1-Score | 0.870 |
| S. No | Classifier | Accuracy in % |
|---|---|---|
| 1 | SVM | 84.35 |
| 2 | MLP | 68 |
| 3 | LSTM | 72 |
| 4 | 2D-CNN(Proposed method) | 86.14 |
| Authors | Classifier | Features | Signals Taken | Accuracy (in %) |
|---|---|---|---|---|
| Y.Song et al. [25] | Navie Bayes | Non-Linear | BCG derived HRV signal | 74.5 |
| Liu et.al. [15] | LibSVM, Decision Tree, and Naive–Bayes | Linear, Non-Linear, Time & Frequency domain | BCG derived HRV signal | 84.5 |
| Rajput et al. [3] | KNN and EBT | Sample and Wavelet entropy | ECG | 99.95 |
| Soh et al. [30] | KNN | EMD, Non-linear | ECG | 97.7 |
| Jain et al. [1] | DL, CNN | … | ECG | 99.68 |
| Liang et al. [28] | DL | … | PPG | F1-score = 92.25 |
| Liang et al. [27] | SVM | Linear and non-linear | ECG, PPG | SEN = 94.25 |
| Liang et al. [26] | Data mining | Time and Frequency | ECG, HRV | Acc = 84.52 |
| Proposed method | 2-D CNN (deep-learning model) | … | BCG | 86.14 |
Publisher’s Note: MDPI stays neutral with regard to jurisdictional claims in published maps and institutional affiliations. |
© 2022 by the authors. Licensee MDPI, Basel, Switzerland. This article is an open access article distributed under the terms and conditions of the Creative Commons Attribution (CC BY) license (https://creativecommons.org/licenses/by/4.0/).
Share and Cite
Rajput, J.S.; Sharma, M.; Kumar, T.S.; Acharya, U.R. Automated Detection of Hypertension Using Continuous Wavelet Transform and a Deep Neural Network with Ballistocardiography Signals. Int. J. Environ. Res. Public Health 2022, 19, 4014. https://doi.org/10.3390/ijerph19074014
Rajput JS, Sharma M, Kumar TS, Acharya UR. Automated Detection of Hypertension Using Continuous Wavelet Transform and a Deep Neural Network with Ballistocardiography Signals. International Journal of Environmental Research and Public Health. 2022; 19(7):4014. https://doi.org/10.3390/ijerph19074014
Chicago/Turabian StyleRajput, Jaypal Singh, Manish Sharma, T. Sudheer Kumar, and U. Rajendra Acharya. 2022. "Automated Detection of Hypertension Using Continuous Wavelet Transform and a Deep Neural Network with Ballistocardiography Signals" International Journal of Environmental Research and Public Health 19, no. 7: 4014. https://doi.org/10.3390/ijerph19074014
APA StyleRajput, J. S., Sharma, M., Kumar, T. S., & Acharya, U. R. (2022). Automated Detection of Hypertension Using Continuous Wavelet Transform and a Deep Neural Network with Ballistocardiography Signals. International Journal of Environmental Research and Public Health, 19(7), 4014. https://doi.org/10.3390/ijerph19074014