

Mortality Related to Air Temperature in European Cities, Based on Threshold Regression Models

 ,
,  ,
,  ,
, 

Abstract
:1. Introduction
2. Materials and Methods
2.1. Data
2.2. Methodological Framework
3. Results
4. Discussion
5. Conclusions
Author Contributions
Funding
Institutional Review Board Statement
Informed Consent Statement
Data Availability Statement
Conflicts of Interest
References
- Semenza, J.C. Climate Change and Human Health. Int. J. Environ. Res. Public Health 2014, 11, 7347–7353. [Google Scholar] [CrossRef] [PubMed] [Green Version]
- Danek, T.; Zaręba, M. The use of public data from low-cost sensors for the geospatial analysis of air pollution from solid fuel heating during the COVID-19 pandemic spring period in Krakow, Poland. Sensors 2021, 21, 5208. [Google Scholar] [CrossRef] [PubMed]
- Luo, Q.; Li, S.; Guo, Y.; Han, X.; Jaakkola, J.J.K. A systematic review and meta-analysis of the association between daily mean temperature and mortality in China. Environ. Res. 2019, 173, 281–299. [Google Scholar] [CrossRef] [PubMed]
- Iñiguez, C.; Ballester, F.; Ferrandiz, J.; Perez-Hoyos, S.; Saez, M.; Lopez, A. Relation between temperature and mortality in thirteen Spanish cities. Int. J. Environ. Res. Public Health 2010, 7, 3196–3210. [Google Scholar] [CrossRef]
- Barnett, A.G.; Tong, S.; Clements, A.C.A. What measure of temperature is the best predictor of mortality? Environ. Res. 2010, 110, 604–611. [Google Scholar] [CrossRef] [Green Version]
- Basu, R.; Malig, B. High ambient temperature and mortality in California: Exploring the roles of age, disease, and mortality displacement. Environ. Res. 2011, 111, 1286–1292. [Google Scholar] [CrossRef]
- Pachauri, R.K.; Allen, M.R.; Barros, V.R.; Broome, J.; Cramer, W.; Christ, R.; Church, J.A.; Clarke, L.; Dahe, Q.; Dasgupta, P.; et al. Climate Change 2014: Synthesis Report. Contribution of Working Groups I, II and III to the Fifth Assessment Report of the Intergovernmental Panel on Climate Change; IPCC: Geneva, Switzerland, 2014; 151p, ISBN 9789291691432. Available online: https://www.ipcc.ch/pdf/assessment-report/ar5/syr/SYR_AR5_FINAL_full_wcover.pdf (accessed on 9 February 2022).
- Makinen, T.M. Different types of cold adaptation in humans. Front. Biosci. 2010, 2, 1047–1067. [Google Scholar] [CrossRef]
- Taylor, N.A.S. Human heat adaptation. Compr. Physiol. 2014, 4, 325–365. [Google Scholar] [CrossRef]
- Arbuthnott, K.; Hajat, S.; Heaviside, C.; Vardoulakis, S. Changes in population susceptibility to heat and cold over time: Assessing adaptation to climate change. Environ. Health 2016, 15 (Suppl. 1), 33. [Google Scholar] [CrossRef] [Green Version]
- McMichael, A.J. Globalization, Climate Change, and Human Health. N. Engl. J. Med. 2013, 368, 1335–1343. [Google Scholar] [CrossRef] [Green Version]
- Martínez-Solanas, È.; Quijal-Zamorano, M.; Achebak, H.; Petrova, D.; Robine, J.-M.; Herrmann, F.R.; Rodo, X.; Ballester, J. Projections of temperature-attributable mortality in Europe: A time series analysis of 147 contiguous regions in 16 countries. Lancet Planet. Health 2021, 5, e446–e454. [Google Scholar] [CrossRef]
- Zhang, B.; Li, G.; Ma, Y.; Pan, X. Projection of temperature-related mortality due to cardiovascular disease in Beijing under different climate change, population, and adaptation scenarios. Environ. Res. 2018, 162, 152–159. [Google Scholar] [CrossRef]
- Hunt, A.; Watkiss, P. Climate change impacts and adaptation in cities: A review of the literature. Clim. Chang. 2011, 104, 13–49. [Google Scholar] [CrossRef] [Green Version]
- Carter, J.G. Climate change adaptation in European cities. Curr. Opin. Environ. Sustain. 2011, 3, 193–198. [Google Scholar] [CrossRef]
- Broto, V.C.; Bulkeley, H. A survey of urban climate change experiments in 100 cities. Glob. Environ. Chang. 2013, 23, 92–102. [Google Scholar] [CrossRef] [PubMed] [Green Version]
- Bastin, J.F.; Clark, E.; Elliott, T.; Hart, S.; van den Hoogen, J.; Hordijk, I.; Ma, H.; Majumder, S.; Manoli, G.; Maschler, J.; et al. Correction: Understanding climate change from a global analysis of city analogues. PLoS ONE 2019, 14, e0224120. [Google Scholar] [CrossRef]
- Keatinge, W.R.; Donaldson, G.C.; Cordioli, E.; Martinelli, M.; Kunst, A.E.; Mackenbach, J.P.; Nayha, S.; Vuori, I. Heat related mortality in warm and cold regions of Europe: Observational study. Br. Med. J. 2000, 321, 670–673. [Google Scholar] [CrossRef] [Green Version]
- Martin, S.L.; Cakmak, S.; Hebbern, C.A.; Avramescu, M.L.; Tremblay, N. Climate change and future temperature-related mortality in 15 Canadian cities. Int. J. Biometeorol. 2012, 56, 605–619. [Google Scholar] [CrossRef]
- Hajat, S.; Vardoulakis, S.; Heaviside, C.; Eggen, B. Climate change effects on human health: Projections of temperature-related mortality for the UK during the 2020s, 2050s and 2080s. J. Epidemiol. Community Health 2014, 68, 641–648. [Google Scholar] [CrossRef] [Green Version]
- Nastos, P.T.; Matzarakis, A. The effect of air temperature and human thermal indices on mortality in Athens, Greece. Theor. Appl. Climatol. 2012, 108, 591–599. [Google Scholar] [CrossRef]
- McKee, C.M. Deaths in winter: Can Britain learn from Europe? Eur. J. Epidemiol. 1989, 5, 178–182. [Google Scholar] [CrossRef] [PubMed]
- Keatinge, W.R. Cold exposure and winter mortality from ischaemic heart disease, cerebrovascular disease, respiratory disease, and all causes in warm and cold regions of Europe. Lancet 1997, 349, 1341–1346. [Google Scholar] [CrossRef]
- Oudin Åström, D.; Tornevi, A.; Ebi, K.L.; Rocklöv, J.; Forsberg, B. Evolution of minimum mortality temperature in Stockholm, Sweden, 1901–2009. Environ. Health Perspect. 2016, 124, 740–744. [Google Scholar] [CrossRef] [PubMed]
- Yin, Q.; Wang, J.; Ren, Z.; Li, J.; Guo, Y. Mapping the increased minimum mortality temperatures in the context of global climate change. Nat. Commun. 2019, 10, 4640. [Google Scholar] [CrossRef] [PubMed] [Green Version]
- López-Bueno, J.A.; Diaz, J.; Follos, F.; Vellon, J.M.; Vavas, M.A.; Culqui, D.; Luna, M.Y.; Sanchez-Martinez, G.; Linares, C. Evolution of the threshold temperature definition of a heat wave vs. evolution of the minimum mortality temperature: A case study in Spain during the 1983–2018 period. Environ. Sci. Eur. 2021, 33, 101. [Google Scholar] [CrossRef]
- Ballester, J.; Robine, J.M.; Herrmann, F.R.; Rodó, X. Long-term projections and acclimatization scenarios of temperature-related mortality in Europe. Nat. Commun. 2011, 2, 358. [Google Scholar] [CrossRef] [Green Version]
- Hales, S.; Blakely, T.; Foster, R.H.; Baker, M.G.; Howden-Chapman, P. Seasonal patterns of mortality in relation to social factors. J. Epidemiol. Community Health 2012, 66, 379–384. [Google Scholar] [CrossRef] [Green Version]
- Michelozzi, P.; De’ Donato, F.; Scortichini, M.; De Sario, M.; Asta, F.; Agabiti, N.; Guerra, R.; de Martino, A.; Davoli, M. On the increase in mortality in Italy in 2015: Analysis of seasonal mortality in the 32 municipalities included in the Surveillance system of daily mortality. Epidemiol. Prev. 2016, 40, 22–28. [Google Scholar] [CrossRef]
- Guo, Y.; Gasparrini, A.; Armstrong, B.; Li, S.; Tawatsupa, B.; Tobias, A.; Lavigne, E.; de Sousa Zanotti Stagliorio Coelho, M.; Leone, M.; Pan, X.; et al. Global variation in the effects of ambient temperature on mortality: A systematic evaluation. Epidemiology 2014, 25, 781–789. [Google Scholar] [CrossRef] [Green Version]
- Linares, C.; Montero, J.C. Perspectives/Correspondence. Environ. Health Perspect. 2014, 122, 118–119. [Google Scholar] [CrossRef] [Green Version]
- Basu, R.; Samet, J.M. Relation between elevated ambient temperature and mortality: A review of the epidemiologic evidence. Epidemiol. Rev. 2002, 24, 190–202. [Google Scholar] [CrossRef] [PubMed]
- Basu, R. High ambient temperature and mortality: A review of epidemiologic studies from 2001 to 2008. Environ. Health 2009, 8, 40. [Google Scholar] [CrossRef] [PubMed] [Green Version]
- Pattenden, S.; Nikiforov, B.; Armstrong, B.G. Mortality and temperature in Sofia and London. J. Epidemiol. Community Health 2003, 57, 628–633. [Google Scholar] [CrossRef] [PubMed] [Green Version]
- Kinney, P.L.; O’Neill, M.S.; Bell, M.L.; Schwartz, J. Approaches for estimating effects of climate change on heat-related deaths: Challenges and opportunities. Environ. Sci. Policy 2008, 11, 87–96. [Google Scholar] [CrossRef]
- Lee, W.; Kim, H.; Hwang, S.; Zanobetti, A.; Schwartz, J.D.; Chung, Y. Monte Carlo simulation-based estimation for the minimum mortality temperature in temperature-mortality association study. BMC Med. Res. Methodol. 2017, 17, 137. [Google Scholar] [CrossRef] [Green Version]
- Rodrigues, M.; Santana, P.; Rocha, A. Effects of extreme temperatures on cerebrovascular mortality in Lisbon: A distributed lag non-linear model. Int. J. Biometeorol. 2019, 63, 549–559. [Google Scholar] [CrossRef]
- Tobías, A.; Armstrong, B.; Gasparrini, A. Brief report: Investigating uncertainty in the minimum mortality temperature. Epidemiology 2017, 28, 72–76. [Google Scholar] [CrossRef]
- Follos, F.; Linares, C.; Vellon, J.M.; Lopez-Bueno, J.A.; Luna, M.Y.; Sanchez-Martinez, G.; Diaz, J. The evolution of minimum mortality temperatures as an indicator of heat adaptation: The cases of Madrid and Seville (Spain). Sci. Total Environ. 2020, 747, 141259. [Google Scholar] [CrossRef]
- Fong, Y.; Huang, Y.; Gilbert, P.B.; Permar, S.R. chngpt: Threshold regression model estimation and inference. BMC Bioinform. 2017, 18, 454. [Google Scholar] [CrossRef] [Green Version]
- Bai, J.; Perron, P. Estimating and Testing Linear Models with Multiple Structural Changes. Econometrica 1998, 66, 47. [Google Scholar] [CrossRef]
- Bai, J.; Perron, P. Computation and analysis of multiple structural change models. J. Appl. Econom. 2003, 18, 1–22. [Google Scholar] [CrossRef] [Green Version]
- Xu, Z.; Cheng, J.; Hu, W.; Tong, S. Heatwave and health events: A systematic evaluation of different temperature indicators, heatwave intensities and durations. Sci. Total Environ. 2018, 630, 679–689. [Google Scholar] [CrossRef] [PubMed] [Green Version]
- Yu, W.; Guo, Y.; Ye, X.; Wang, X.; Huang, C.; Pan, X.; Tong, S. The effect of various temperature indicators on different mortality categories in a subtropical city of Brisbane, Australia. Sci. Total Environ. 2011, 409, 3431–3437. [Google Scholar] [CrossRef] [PubMed] [Green Version]
- Tawatsupa, B.; Dear, K.; Kjellstrom, T.; Sleigh, A. The association between temperature and mortality in tropical middle income Thailand from 1999 to 2008. Int. J. Biometeorol. 2014, 58, 203–215. [Google Scholar] [CrossRef] [PubMed]
- Curriero, F.C.; Heiner, K.S.; Samet, J.M.; Zeger, S.L.; Strug, L.; Patz, J.A. Temperature and mortality in 11 cities of the eastern United States. Am. J. Epidemiol. 2002, 155, 80–87. [Google Scholar] [CrossRef] [PubMed]
- Nafstad, P.; Skrondal, A.; Bjertness, E. Mortality and temperature in Oslo, Norway, 1990–1995. Eur. J. Epidemiol. 2001, 17, 621–627. [Google Scholar] [CrossRef]
- Folkerts, M.A.; Brode, P.; Botzen, W.J.W.; Martinius, M.L.; Gerrett, N.; Harmsen, C.N.; Daanen, H.A.M. Long Term Adaptation to Heat Stress: Shifts in the Minimum Mortality Temperature in the Netherlands. Front. Physiol. 2020, 11, 1–7. [Google Scholar] [CrossRef]


| Country | Region | Period | Cause of Mortality |
|---|---|---|---|
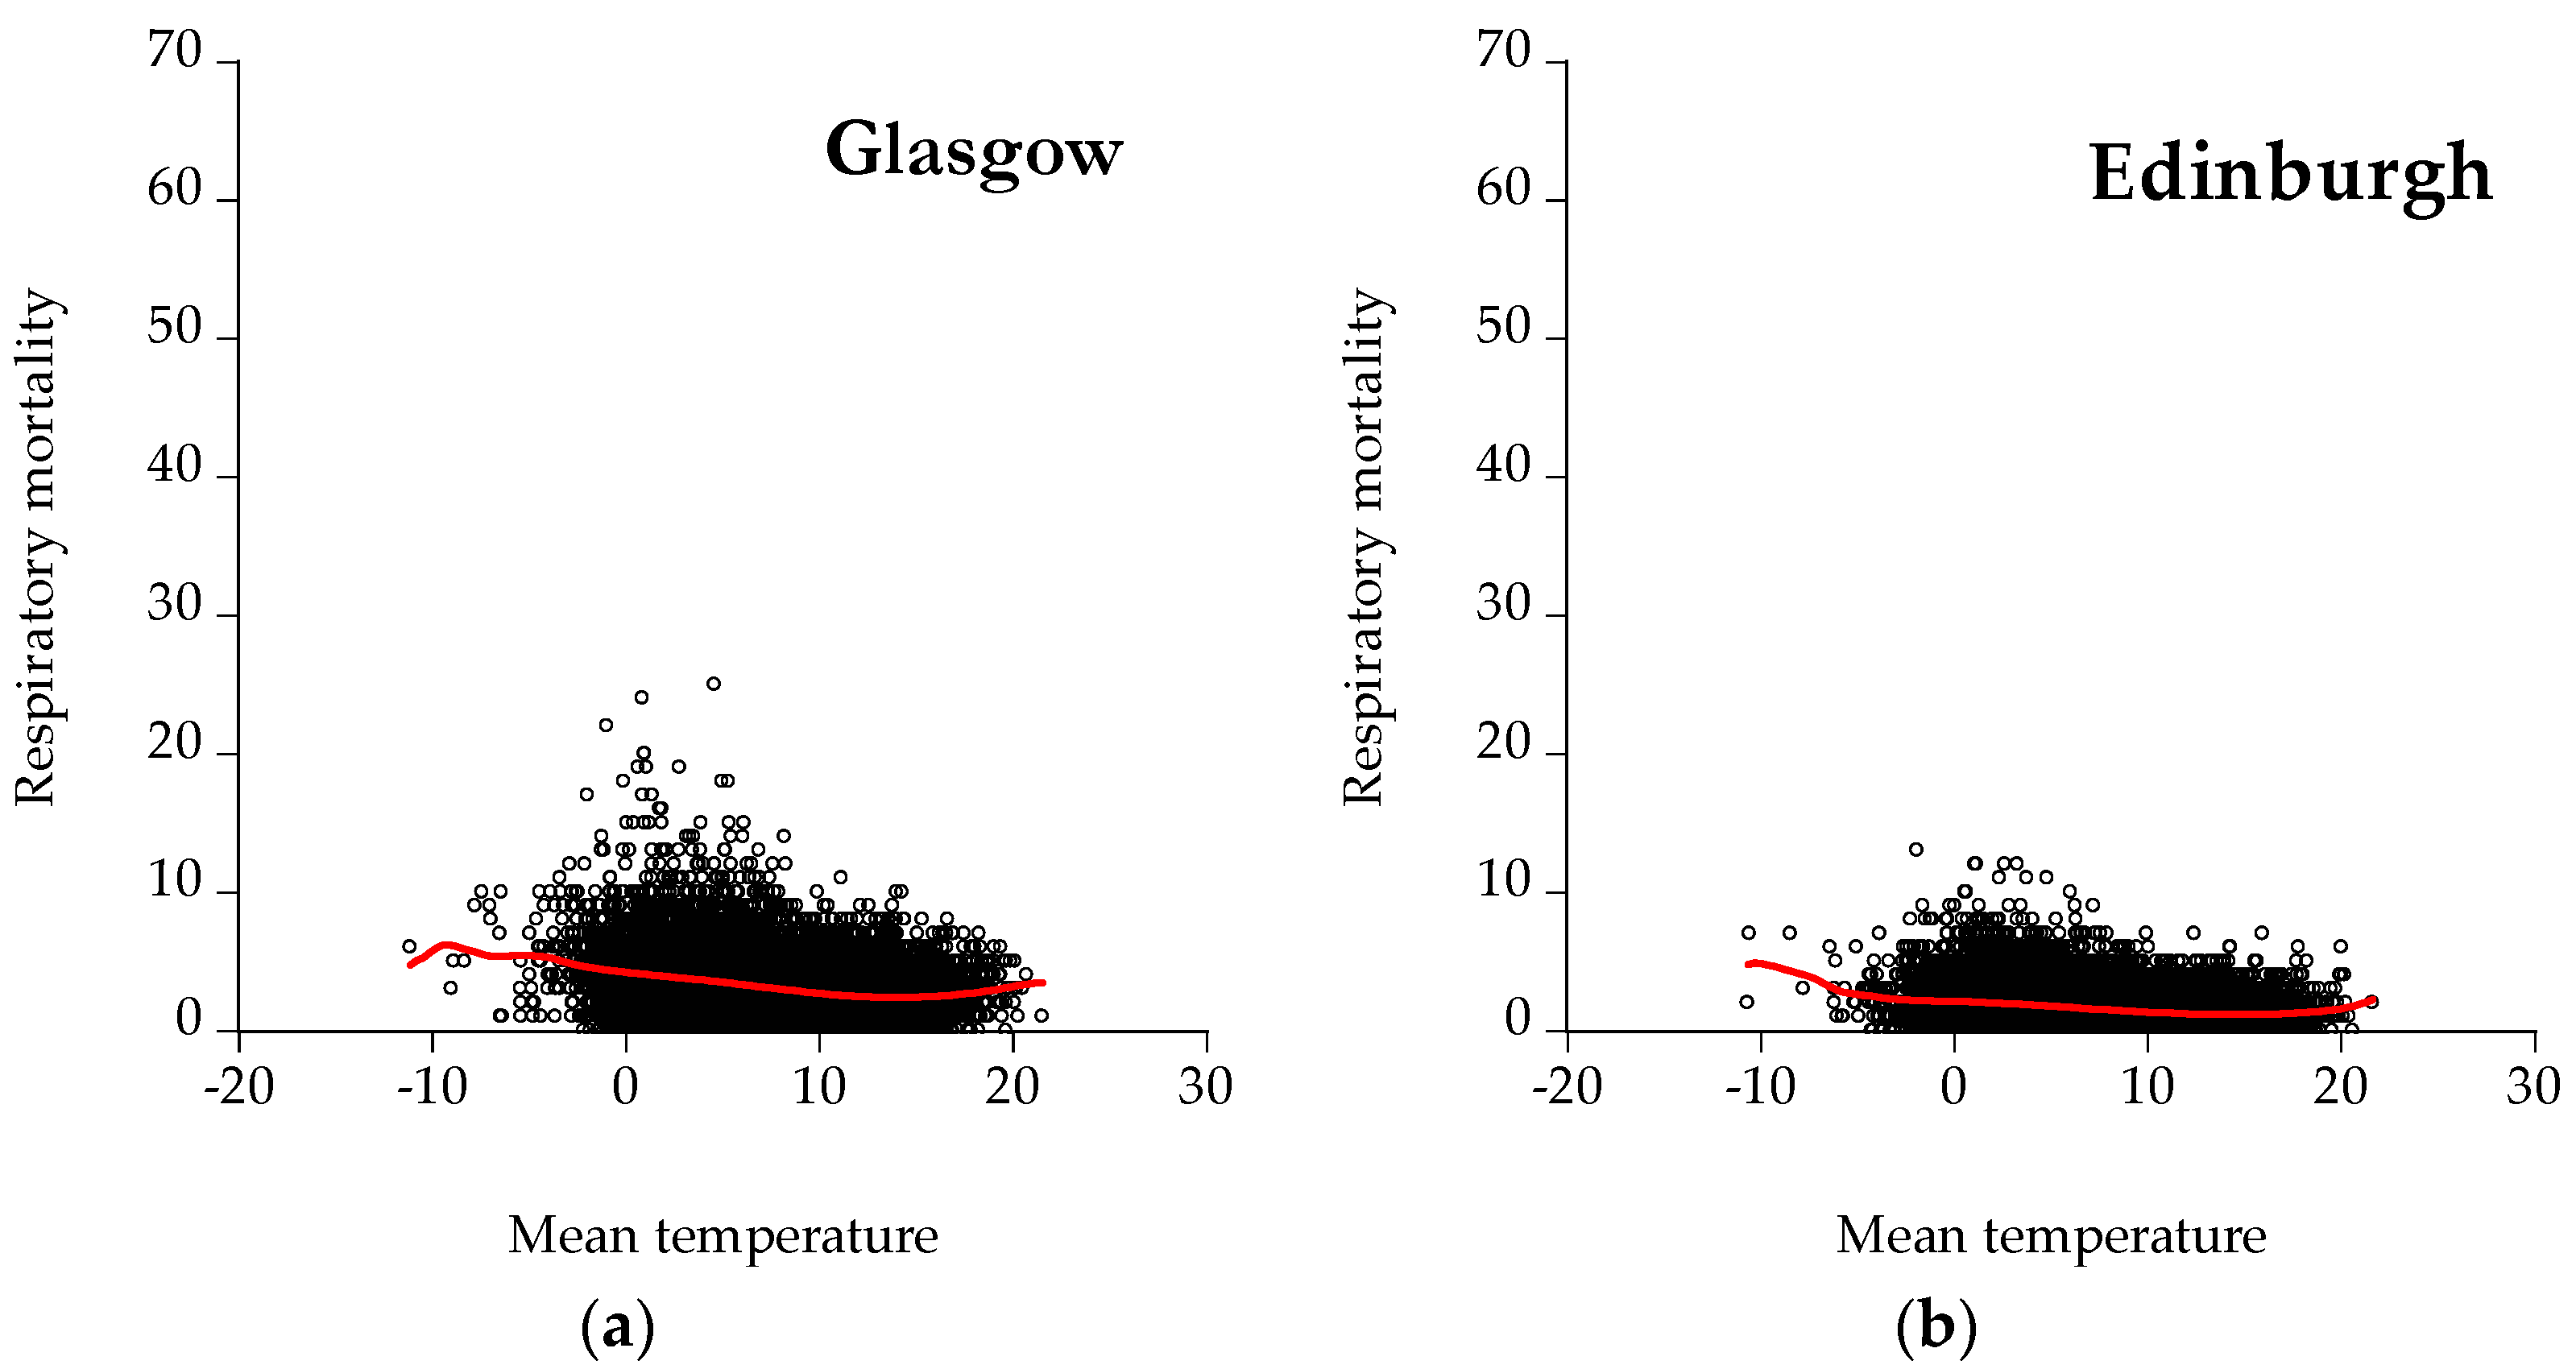
| Scotland | Glasgow | 1974–2018 | Cardiological, respiratory, cardiorespiratory |
| Edinburgh | 1974–2018 | Cardiological, respiratory, cardiorespiratory | |
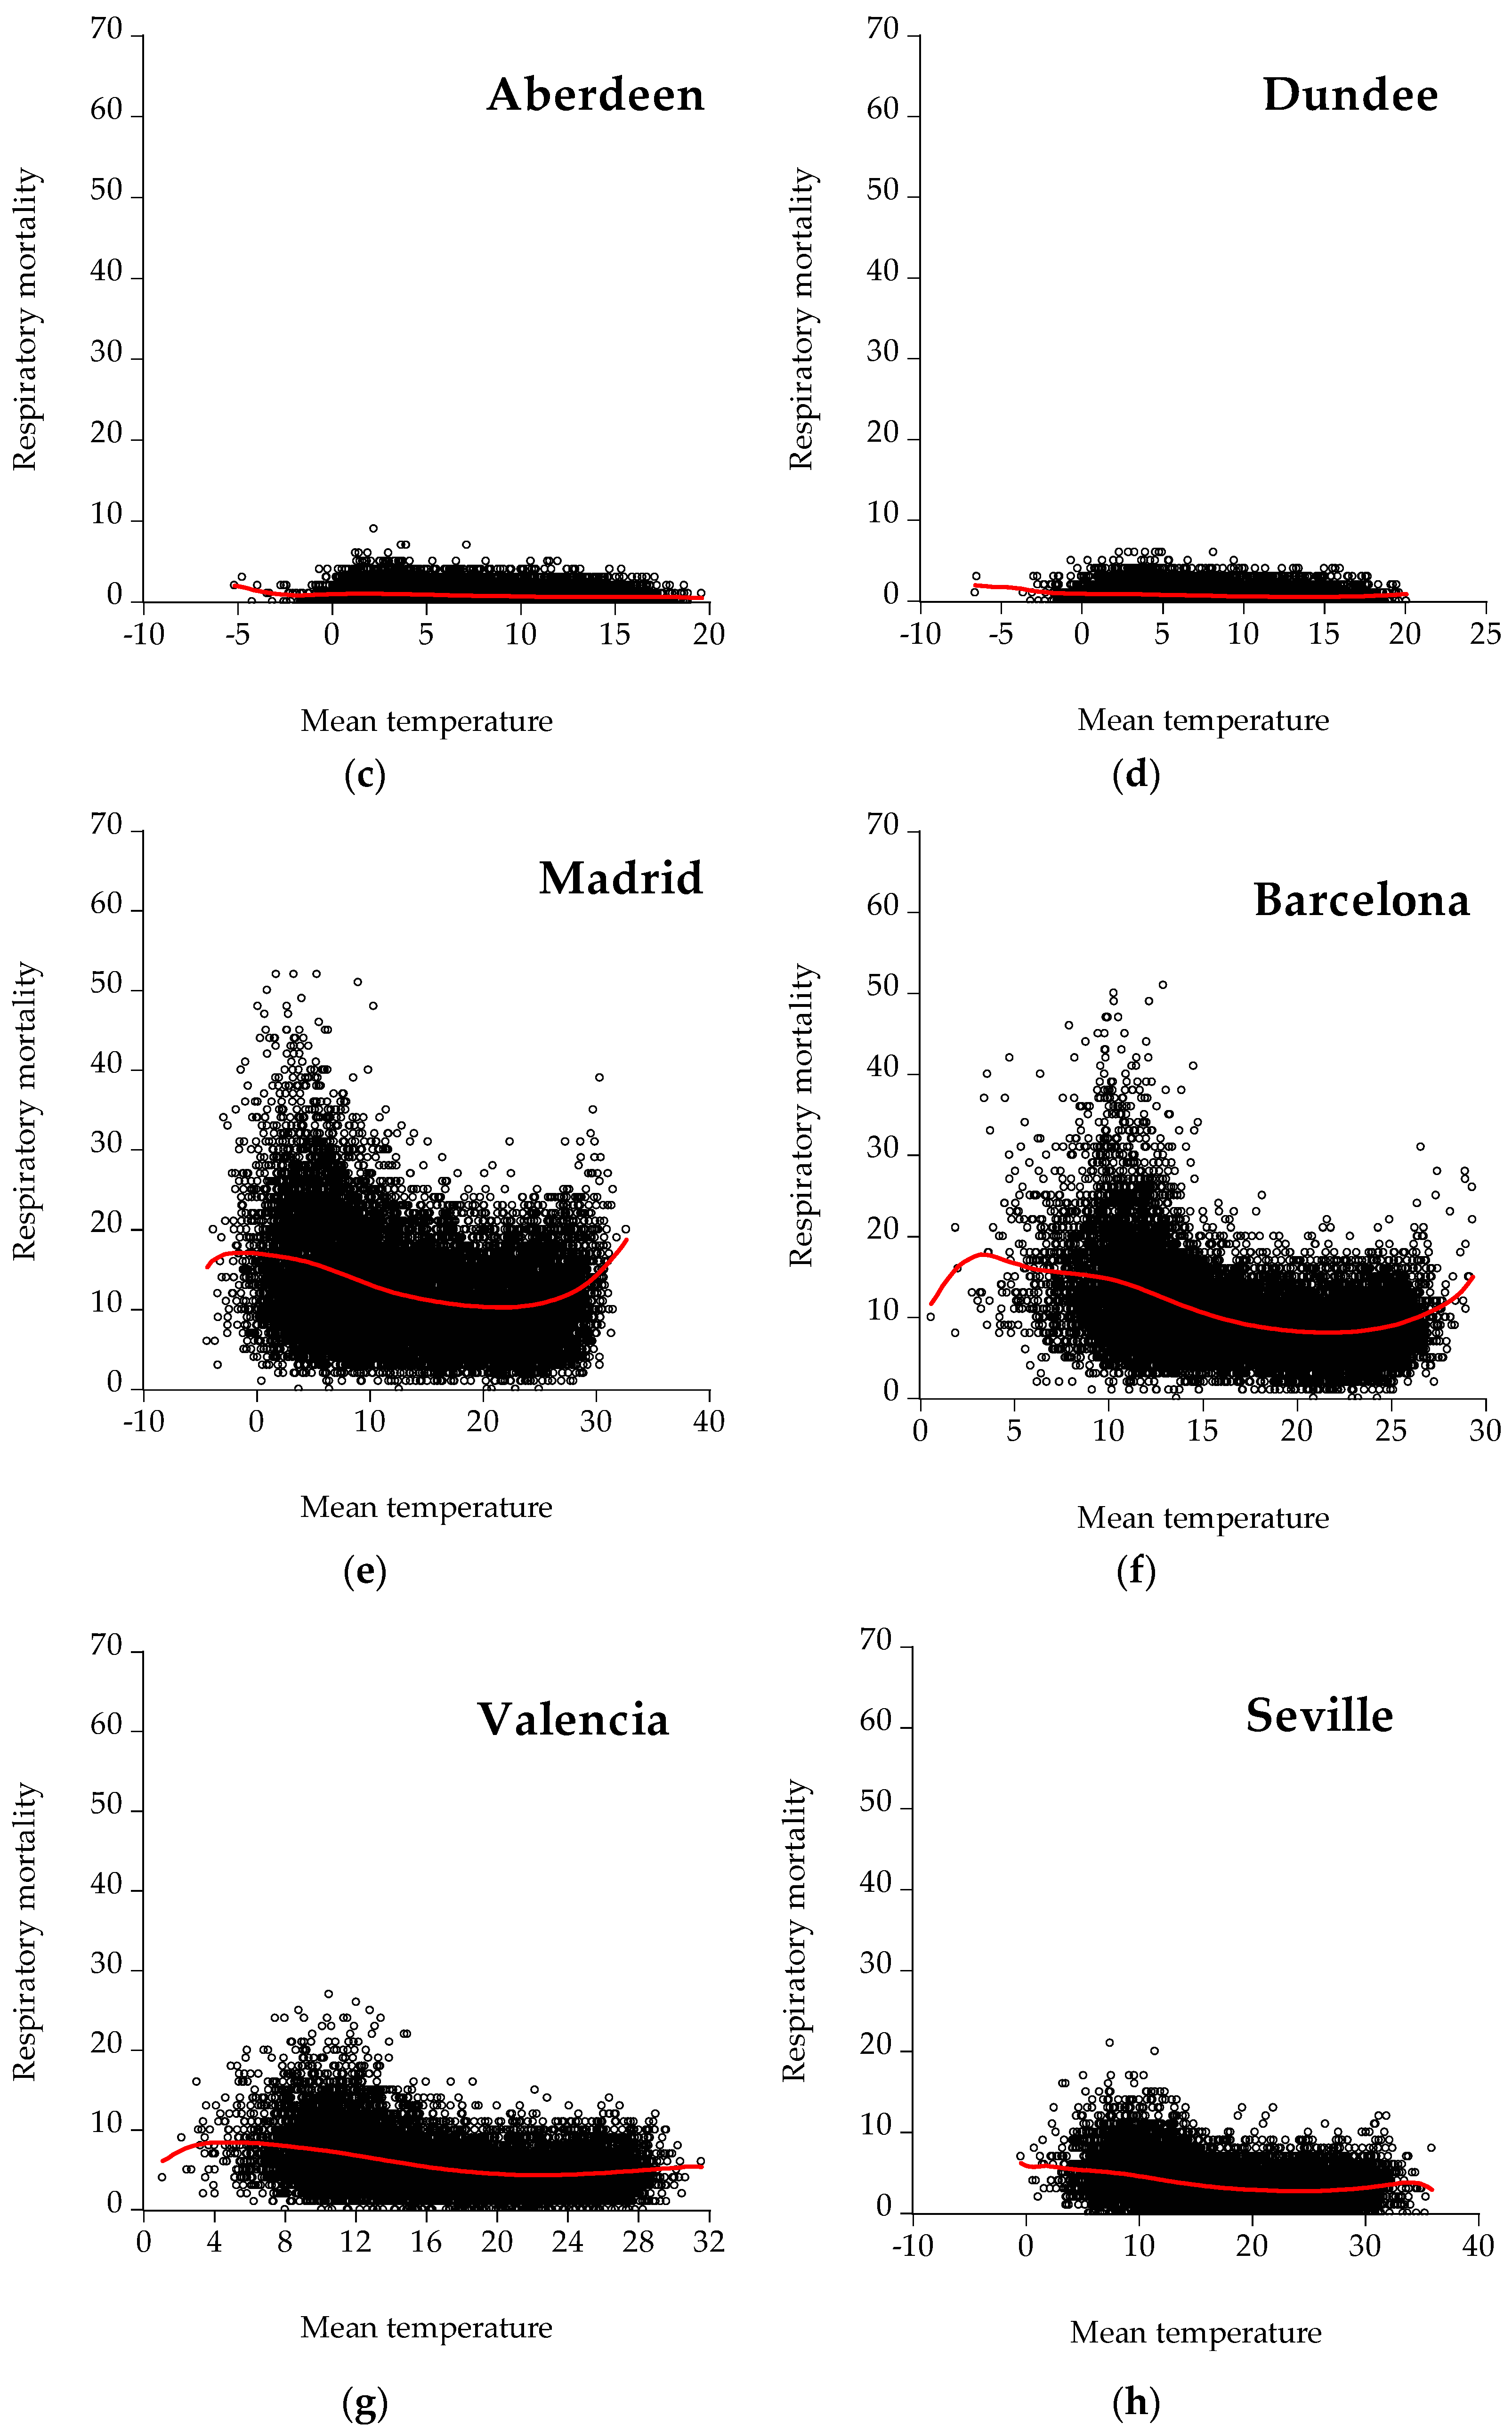
| Aberdeen | 1974–2018 | Cardiological, respiratory, cardiorespiratory | |
| Dundee | 1974–2018 | Cardiological, respiratory, cardiorespiratory | |
| Spain | Madrid | 1980–2018 | Cardiological, respiratory, cardiorespiratory |
| Barcelona | 1980–2018 | Cardiological, respiratory, cardiorespiratory | |
| Valencia | 1980–2018 | Cardiological, respiratory, cardiorespiratory | |
| Seville | 1980–2018 | Cardiological, respiratory, cardiorespiratory | |
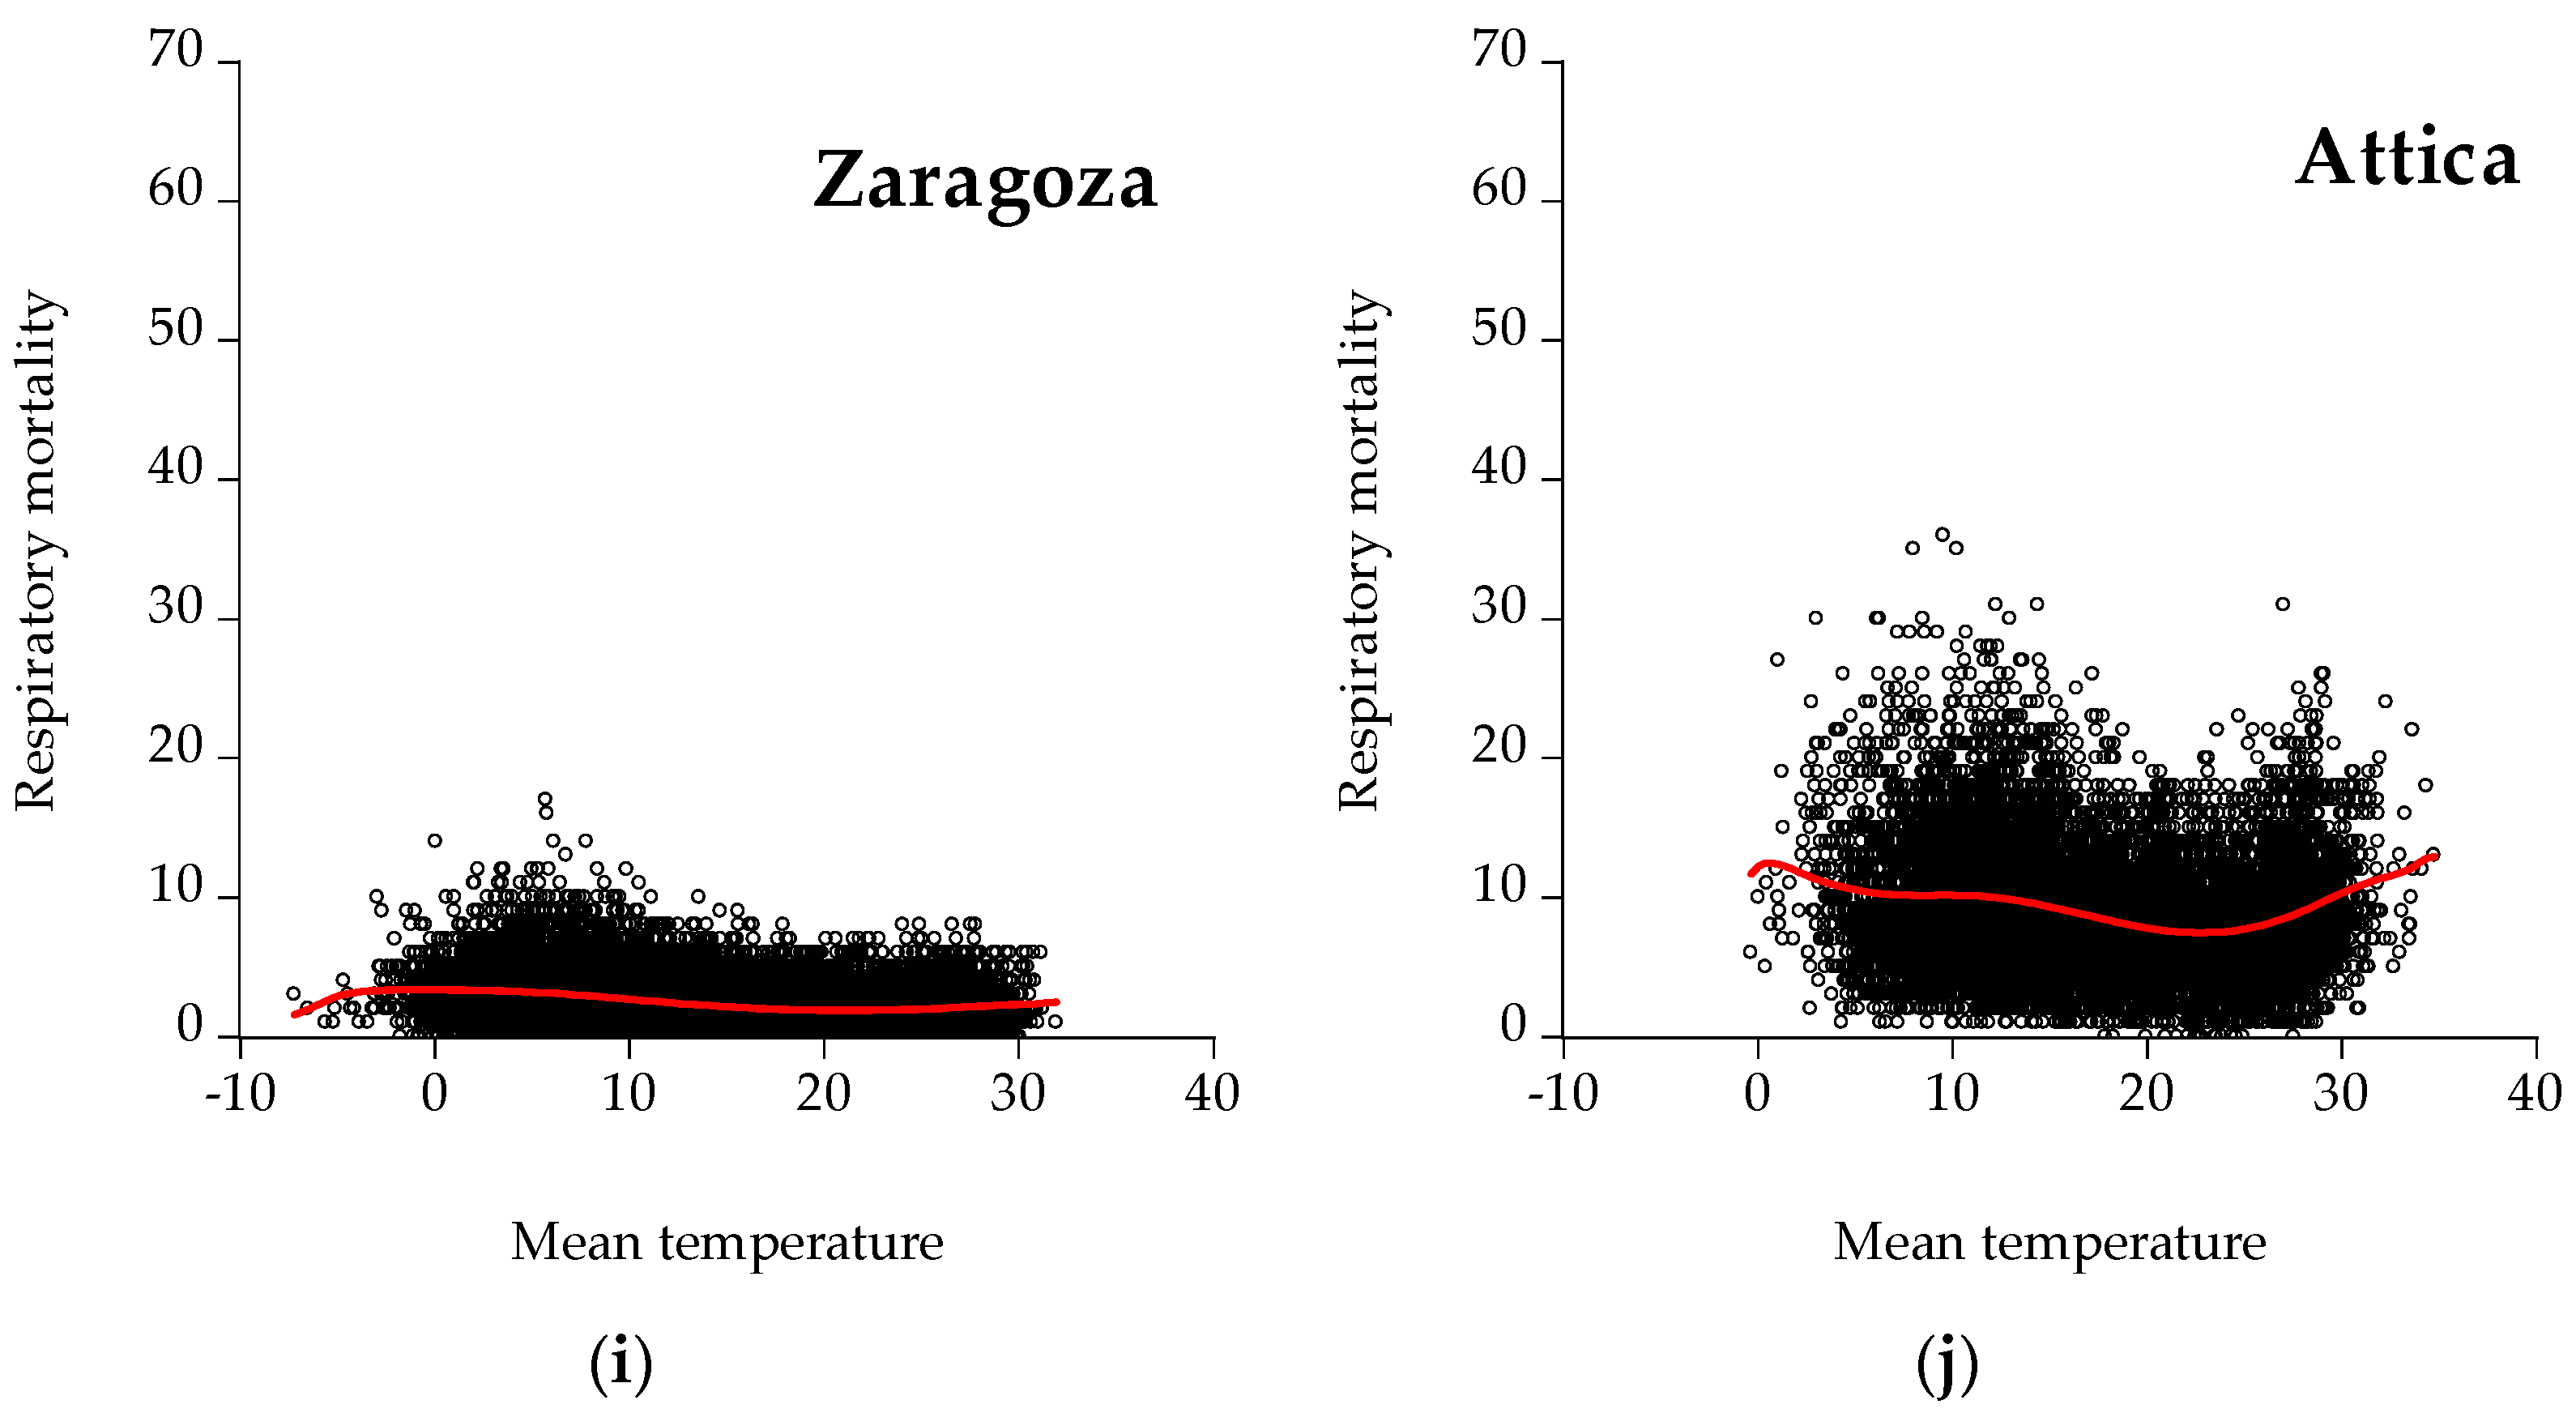
| Zaragoza | 1980–2018 | Cardiological, respiratory, cardiorespiratory | |
| Greece | Attica | 1992–2016 | Cardiological, respiratory, cardiorespiratory |
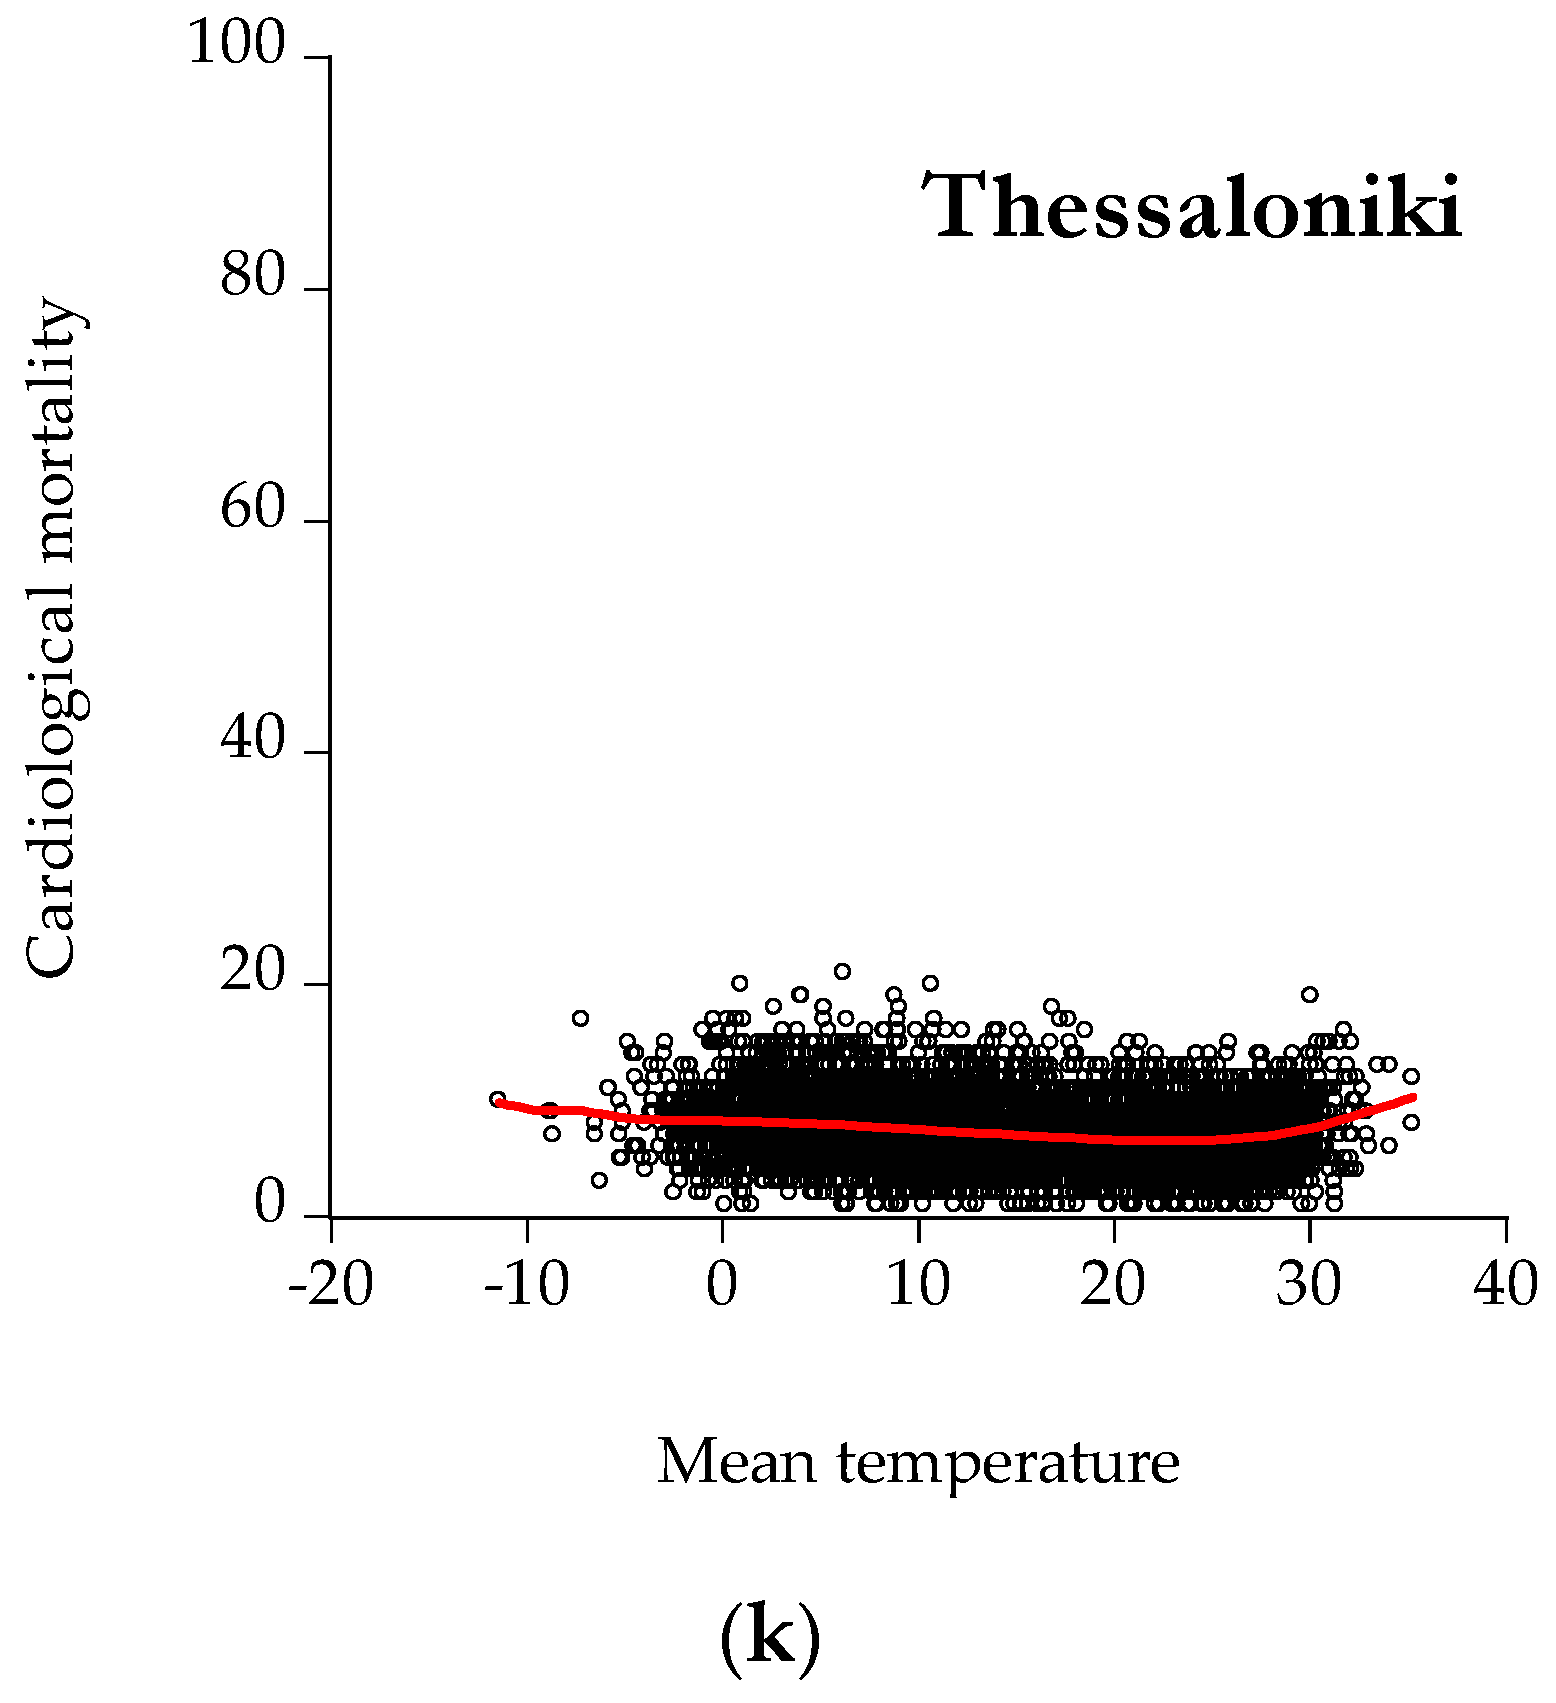
| Thessaloniki | 1999–2016 | Cardiological |
| City | Cardiological Mort. | Respiratory Mort. | Cardiorespiratory Mort. |
|---|---|---|---|
| Glasgow | 16,535 | 8464 | 24,999 |
| Edinburgh | 13,871 | 5858 | 19,729 |
| Aberdeen | 13,762 | 5800 | 19,562 |
| Dundee | 15,579 | 7193 | 22,772 |
| Madrid | 9629 | 3392 | 13,021 |
| Barcelona | 12,130 | 3362 | 15,492 |
| Valencia | 38,125 | 10,281 | 48,406 |
| Seville | 30,987 | 7237 | 38,224 |
| Zaragoza | 18,193 | 5425 | 23,618 |
| Attica | 8840 | 2796 | 11,636 |
| Thessaloniki | 5903 | - | - |
| Total | 183,554 | 59,808 | 243,362 |
| Min | Mean | Max | St. Deviation | |
|---|---|---|---|---|
| Glasgow | ||||
| Cardiological mortality | 0.00 | 1.02 | 3.95 | 0.0 |
| Respiratory mortality | 0.00 | 0.51 | 3.95 | 0.36 |
| CR a | 0.00 | 1.54 | 6.00 | 0.78 |
| Edinburgh | ||||
| Cardiological mortality | 0.00 | 0.72 | 3.43 | 0.45 |
| Respiratory mortality | 0.00 | 0.31 | 2.86 | 0.28 |
| CR a | 0.00 | 1.03 | 5.90 | 0.56 |
| Aberdeen | ||||
| Cardiological mortality | 0.00 | 0.79 | 4.37 | 0.63 |
| Respiratory mortality | 0.00 | 0.33 | 3.94 | 0.40 |
| CR a | 0.00 | 1.12 | 5.69 | 0.76 |
| Dundee | ||||
| Cardiological mortality | 0.00 | 0.99 | 6.03 | 0.88 |
| Respiratory mortality | 0.00 | 0.45 | 4.02 | 0.58 |
| CR a | 0.00 | 1.45 | 7.37 | 1.08 |
| Madrid | ||||
| Cardiological mortality | 0.15 | 1.03 | 2.40 | 0.25 |
| Respiratory mortality | 0.00 | 0.38 | 1.60 | 0.21 |
| CR a | 0.15 | 1.41 | 3.35 | 0.34 |
| Barcelona | ||||
| Cardiological mortality | 0.68 | 2.31 | 5.43 | 0.57 |
| Respiratory mortality | 0.00 | 0.66 | 3.15 | 0.36 |
| CR a | 0.74 | 2.97 | 7.96 | 0.78 |
| Valencia | ||||
| Cardiological mortality | 0.37 | 2.53 | 6.26 | 0.75 |
| Respiratory mortality | 0.00 | 0.68 | 3.31 | 0.40 |
| CR a | 0.61 | 3.21 | 9.58 | 0.93 |
| Seville | ||||
| Cardiological mortality | 0.00 | 2.13 | 7.39 | 0.73 |
| Respiratory mortality | 0.00 | 0.50 | 2.99 | 0.33 |
| CR a | 0.00 | 2.63 | 8.53 | 0.90 |
| Zaragoza | ||||
| Cardiological mortality | 0.00 | 1.20 | 3.41 | 0.46 |
| Respiratory mortality | 0.00 | 0.36 | 2.52 | 0.27 |
| CR a | 0.15 | 1.56 | 5.04 | 0.57 |
| Athens | ||||
| Cardiological mortality | 0.21 | 0.74 | 2.32 | 0.19 |
| Respiratory mortality | 0.00 | 0.23 | 0.94 | 0.12 |
| CR a | 0.26 | 0.97 | 2.69 | 0.25 |
| Thessaloniki | ||||
| Cardiological mortality | 0.00 | 0.38 | 1.12 | 0.15 |
| Country | Region/Cities | Longitude | Latitude | Lower Threshold | Upper Threshold | |
|---|---|---|---|---|---|---|
| CM | Scotland | Glasgow | −4.25143 | 55.86092 | 1.04 | 13.77 |
| Edinburgh | −3.18827 | 55.95325 | 0.55 | 14.53 | ||
| Aberdeen | −2.09908 | 57.14965 | 6.98 | 14.39 | ||
| Dundee | −2.97070 | 56.46200 | 1.73 | 15.20 | ||
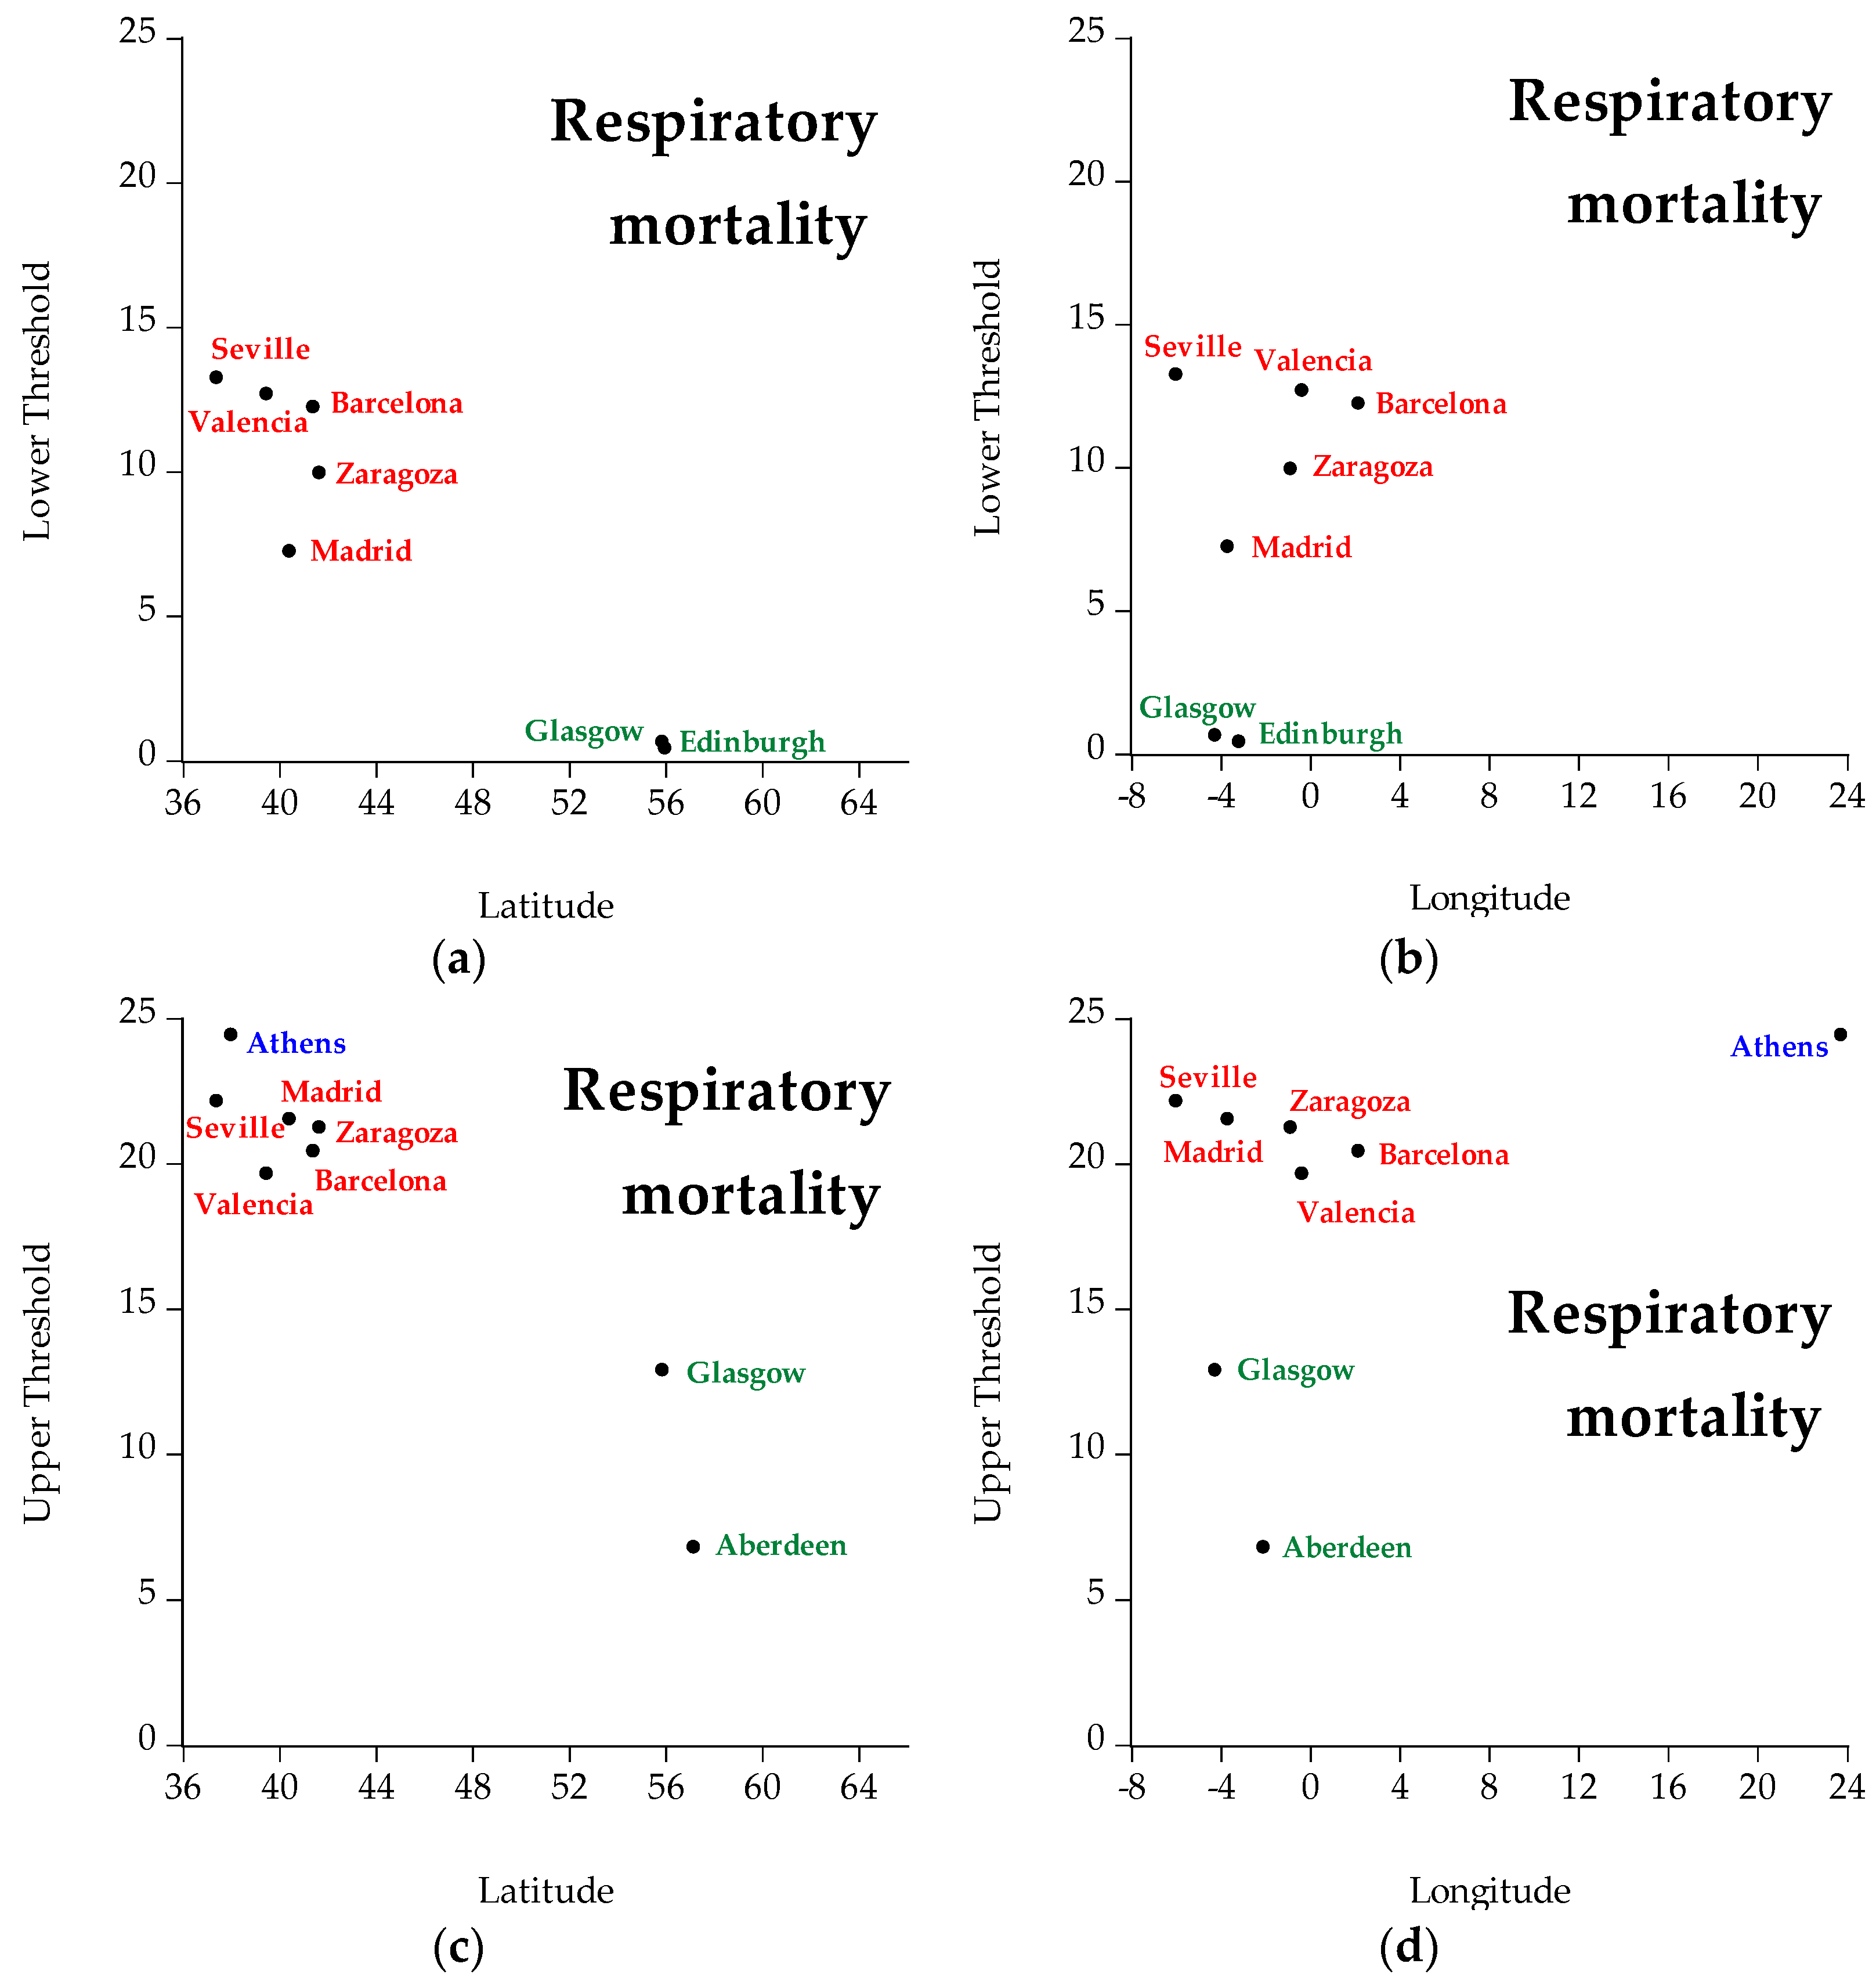
| RM | Scotland | Glasgow | −4.25143 | 55.86092 | 0.65 | 12.90 |
| Edinburgh | −3.18827 | 55.95325 | 0.43 | 11.06 | ||
| Aberdeen | −2.09908 | 57.14965 | 4.37 | 6.81 | ||
| Dundee | −2.97070 | 56.46200 | 3.76 | 9.46 | ||
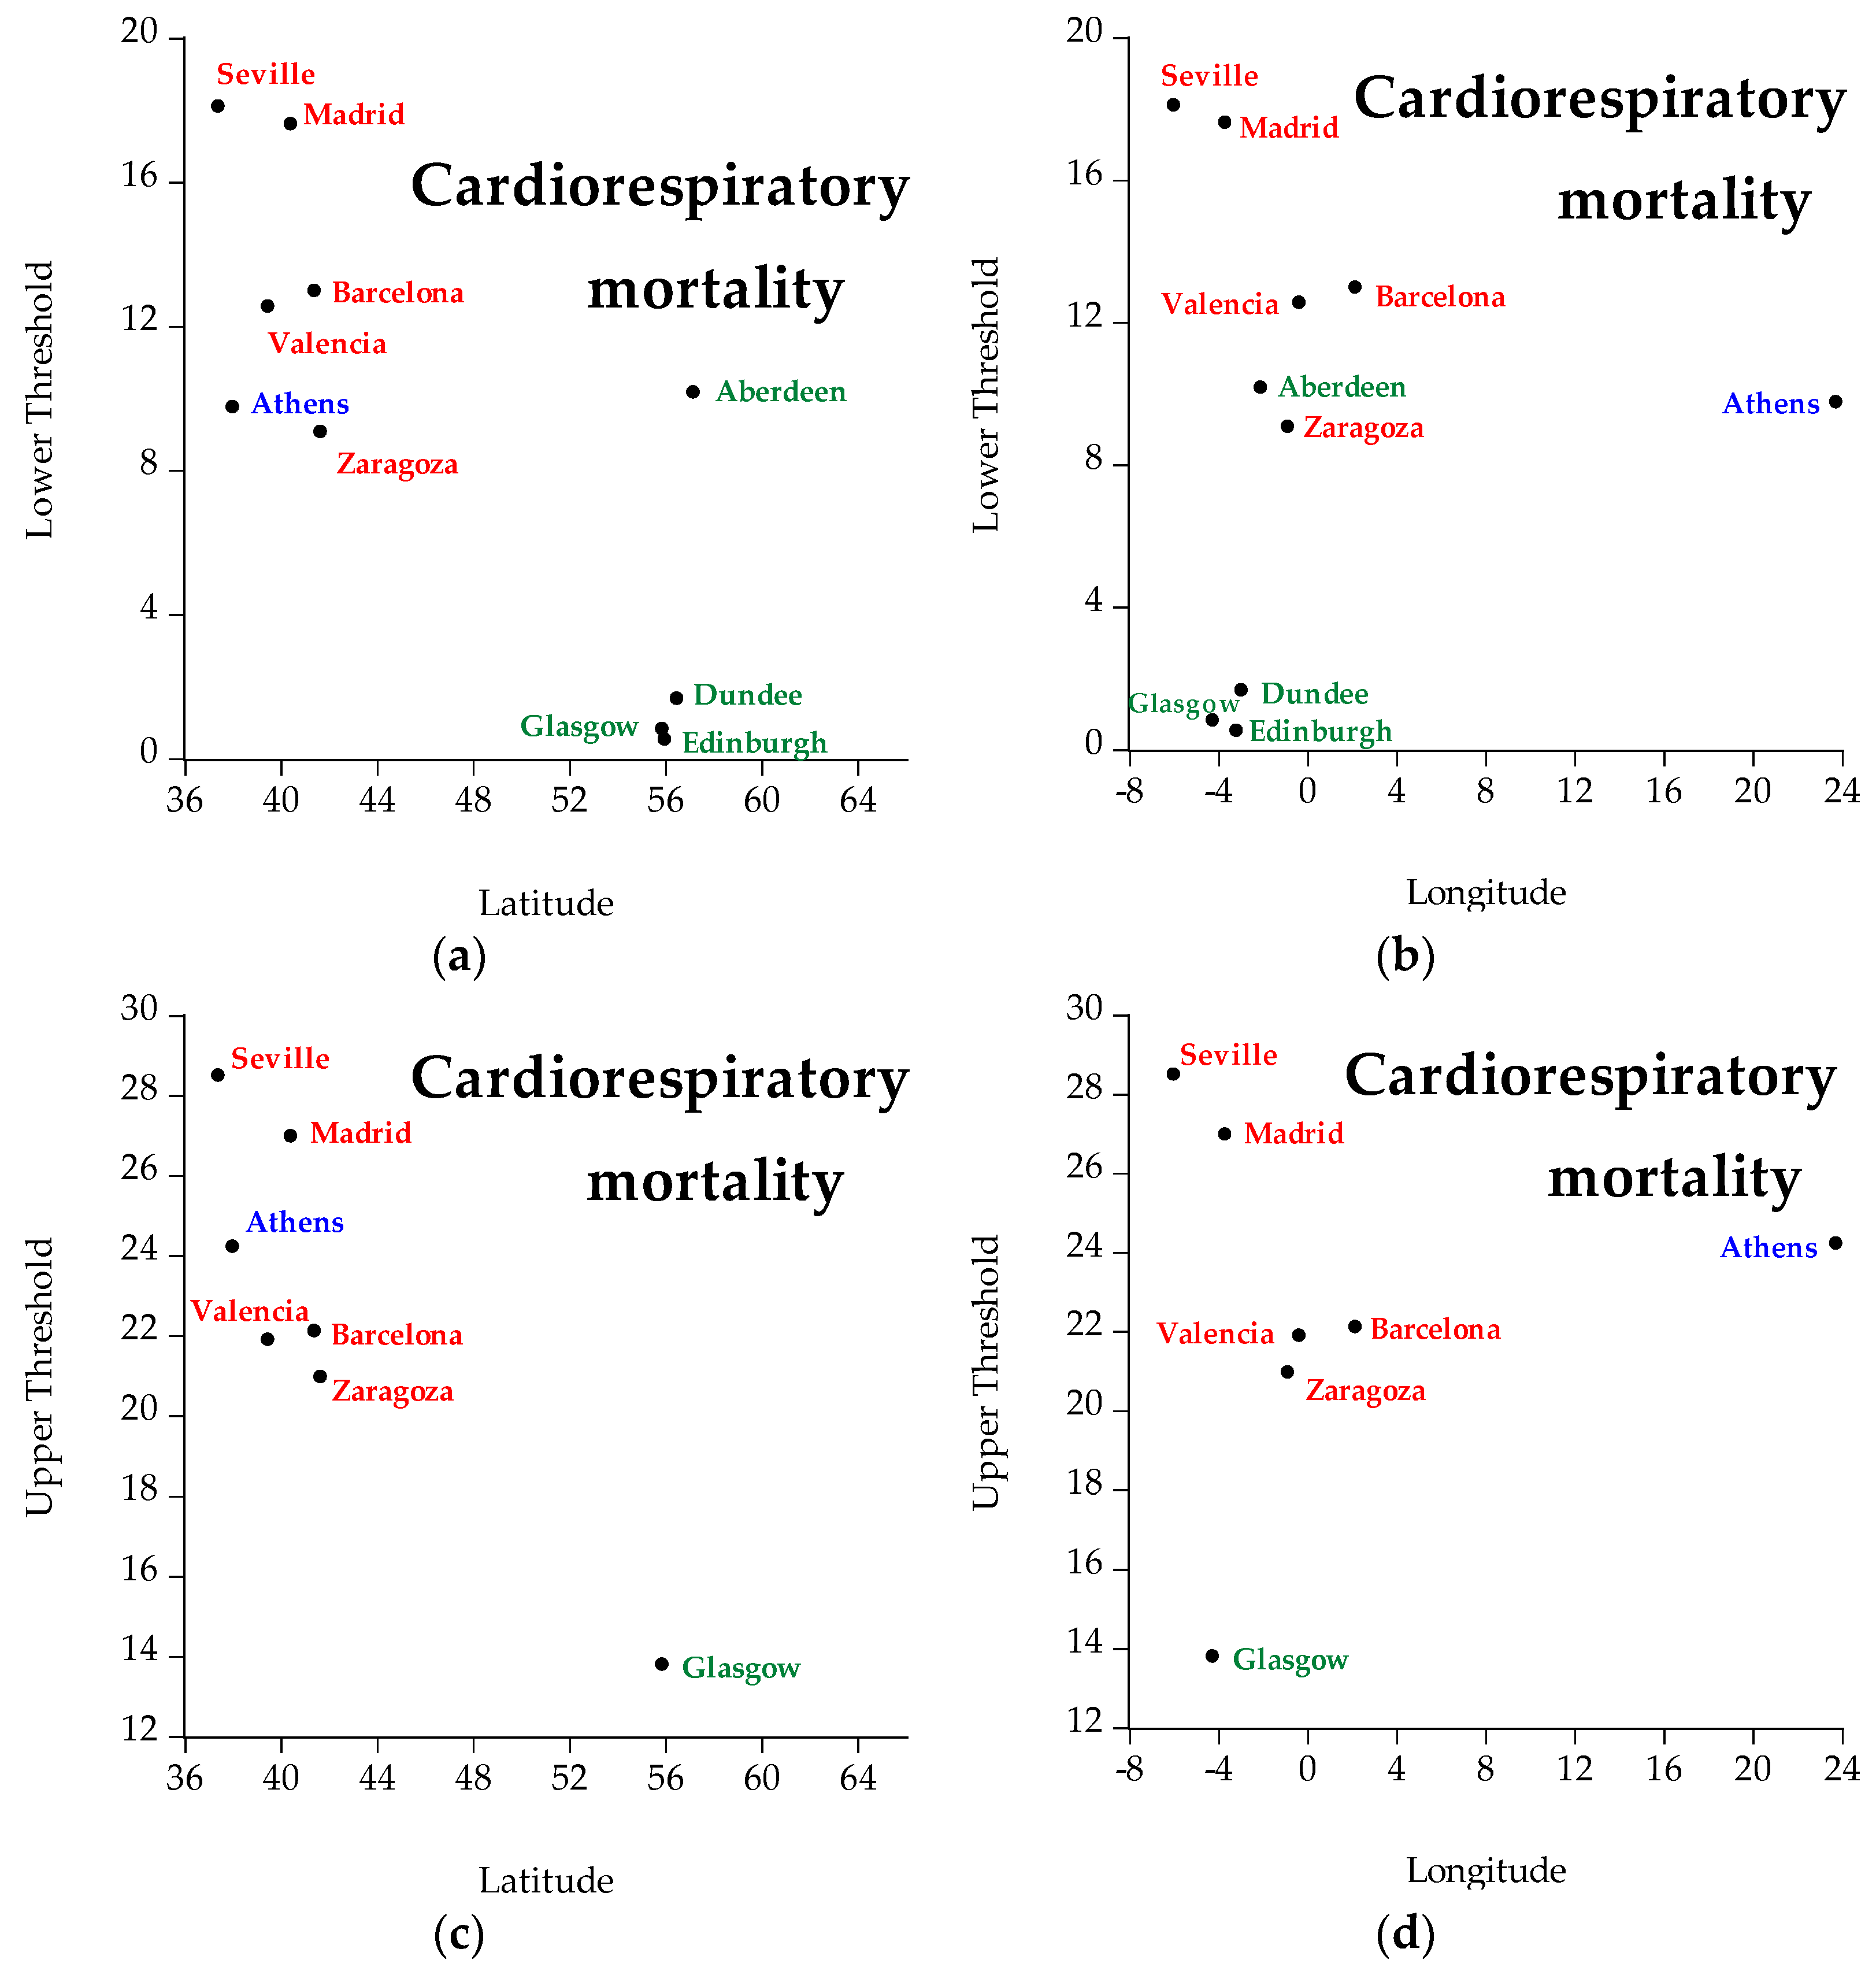
| CRM | Scotland | Glasgow | −4.25143 | 55.86092 | 0.82 | 13.80 |
| Edinburgh | −3.18827 | 55.95325 | 0.53 | 11.29 | ||
| Aberdeen | −2.09908 | 57.14965 | 10.17 | 14.39 | ||
| Dundee | −2.97070 | 56.46200 | 1.67 | 15.20 | ||
| CM | Spain | Madrid | −3.70379 | 40.41678 | 17.61 | 27.24 |
| Barcelona | 2.15401 | 41.39021 | 12.98 | 22.13 | ||
| Valencia | −0.375000 | 39.46667 | 12.45 | 22.26 | ||
| Seville | −5.99407 | 37.39253 | 20.83 | 29.31 | ||
| Zaragoza | −0.88771 | 41.64969 | 9.07 | 19.98 | ||
| RM | Spain | Madrid | −3.70379 | 40.41678 | 7.24 | 21.54 |
| Barcelona | 2.15401 | 41.39021 | 12.24 | 20.44 | ||
| Valencia | −0.375000 | 39.46667 | 12.69 | 19.65 | ||
| Seville | −5.99407 | 37.39253 | 13.25 | 22.16 | ||
| Zaragoza | −0.88771 | 41.64969 | 9.95 | 21.25 | ||
| CRM | Spain | Madrid | −3.70379 | 40.41678 | 17.61 | 26.98 |
| Barcelona | 2.15401 | 41.39021 | 12.98 | 22.12 | ||
| Valencia | −0.375000 | 39.46667 | 12.55 | 21.90 | ||
| Seville | −5.99407 | 37.39253 | 18.10 | 28.50 | ||
| Zaragoza | −0.88771 | 41.64969 | 9.07 | 20.97 | ||
| CM | Greece | Athens | 23.72754 | 37.98381 | 13.55 | 24.53 |
| Thessaloniki | 22.94741 | 40.62927 | 7.61 | 27.48 | ||
| RM | Greece | Athens | 23.72754 | 37.98381 | 15.00 | 24.44 |
| CRM | Greece | Athens | 23.72754 | 37.98381 | 9.76 | 24.23 |
Publisher’s Note: MDPI stays neutral with regard to jurisdictional claims in published maps and institutional affiliations. |
© 2022 by the authors. Licensee MDPI, Basel, Switzerland. This article is an open access article distributed under the terms and conditions of the Creative Commons Attribution (CC BY) license (https://creativecommons.org/licenses/by/4.0/).
Share and Cite
Dimitriadou, L.; Nastos, P.; Eleftheratos, K.; Kapsomenakis, J.; Zerefos, C. Mortality Related to Air Temperature in European Cities, Based on Threshold Regression Models. Int. J. Environ. Res. Public Health 2022, 19, 4017. https://doi.org/10.3390/ijerph19074017
Dimitriadou L, Nastos P, Eleftheratos K, Kapsomenakis J, Zerefos C. Mortality Related to Air Temperature in European Cities, Based on Threshold Regression Models. International Journal of Environmental Research and Public Health. 2022; 19(7):4017. https://doi.org/10.3390/ijerph19074017
Chicago/Turabian StyleDimitriadou, Lida, Panagiotis Nastos, Kostas Eleftheratos, John Kapsomenakis, and Christos Zerefos. 2022. "Mortality Related to Air Temperature in European Cities, Based on Threshold Regression Models" International Journal of Environmental Research and Public Health 19, no. 7: 4017. https://doi.org/10.3390/ijerph19074017
APA StyleDimitriadou, L., Nastos, P., Eleftheratos, K., Kapsomenakis, J., & Zerefos, C. (2022). Mortality Related to Air Temperature in European Cities, Based on Threshold Regression Models. International Journal of Environmental Research and Public Health, 19(7), 4017. https://doi.org/10.3390/ijerph19074017