
Indicators of Climate Change, Geospatial and Analytical Mapping of Trends in India, Pakistan and Bangladesh: An Observational Study


 , and
, and 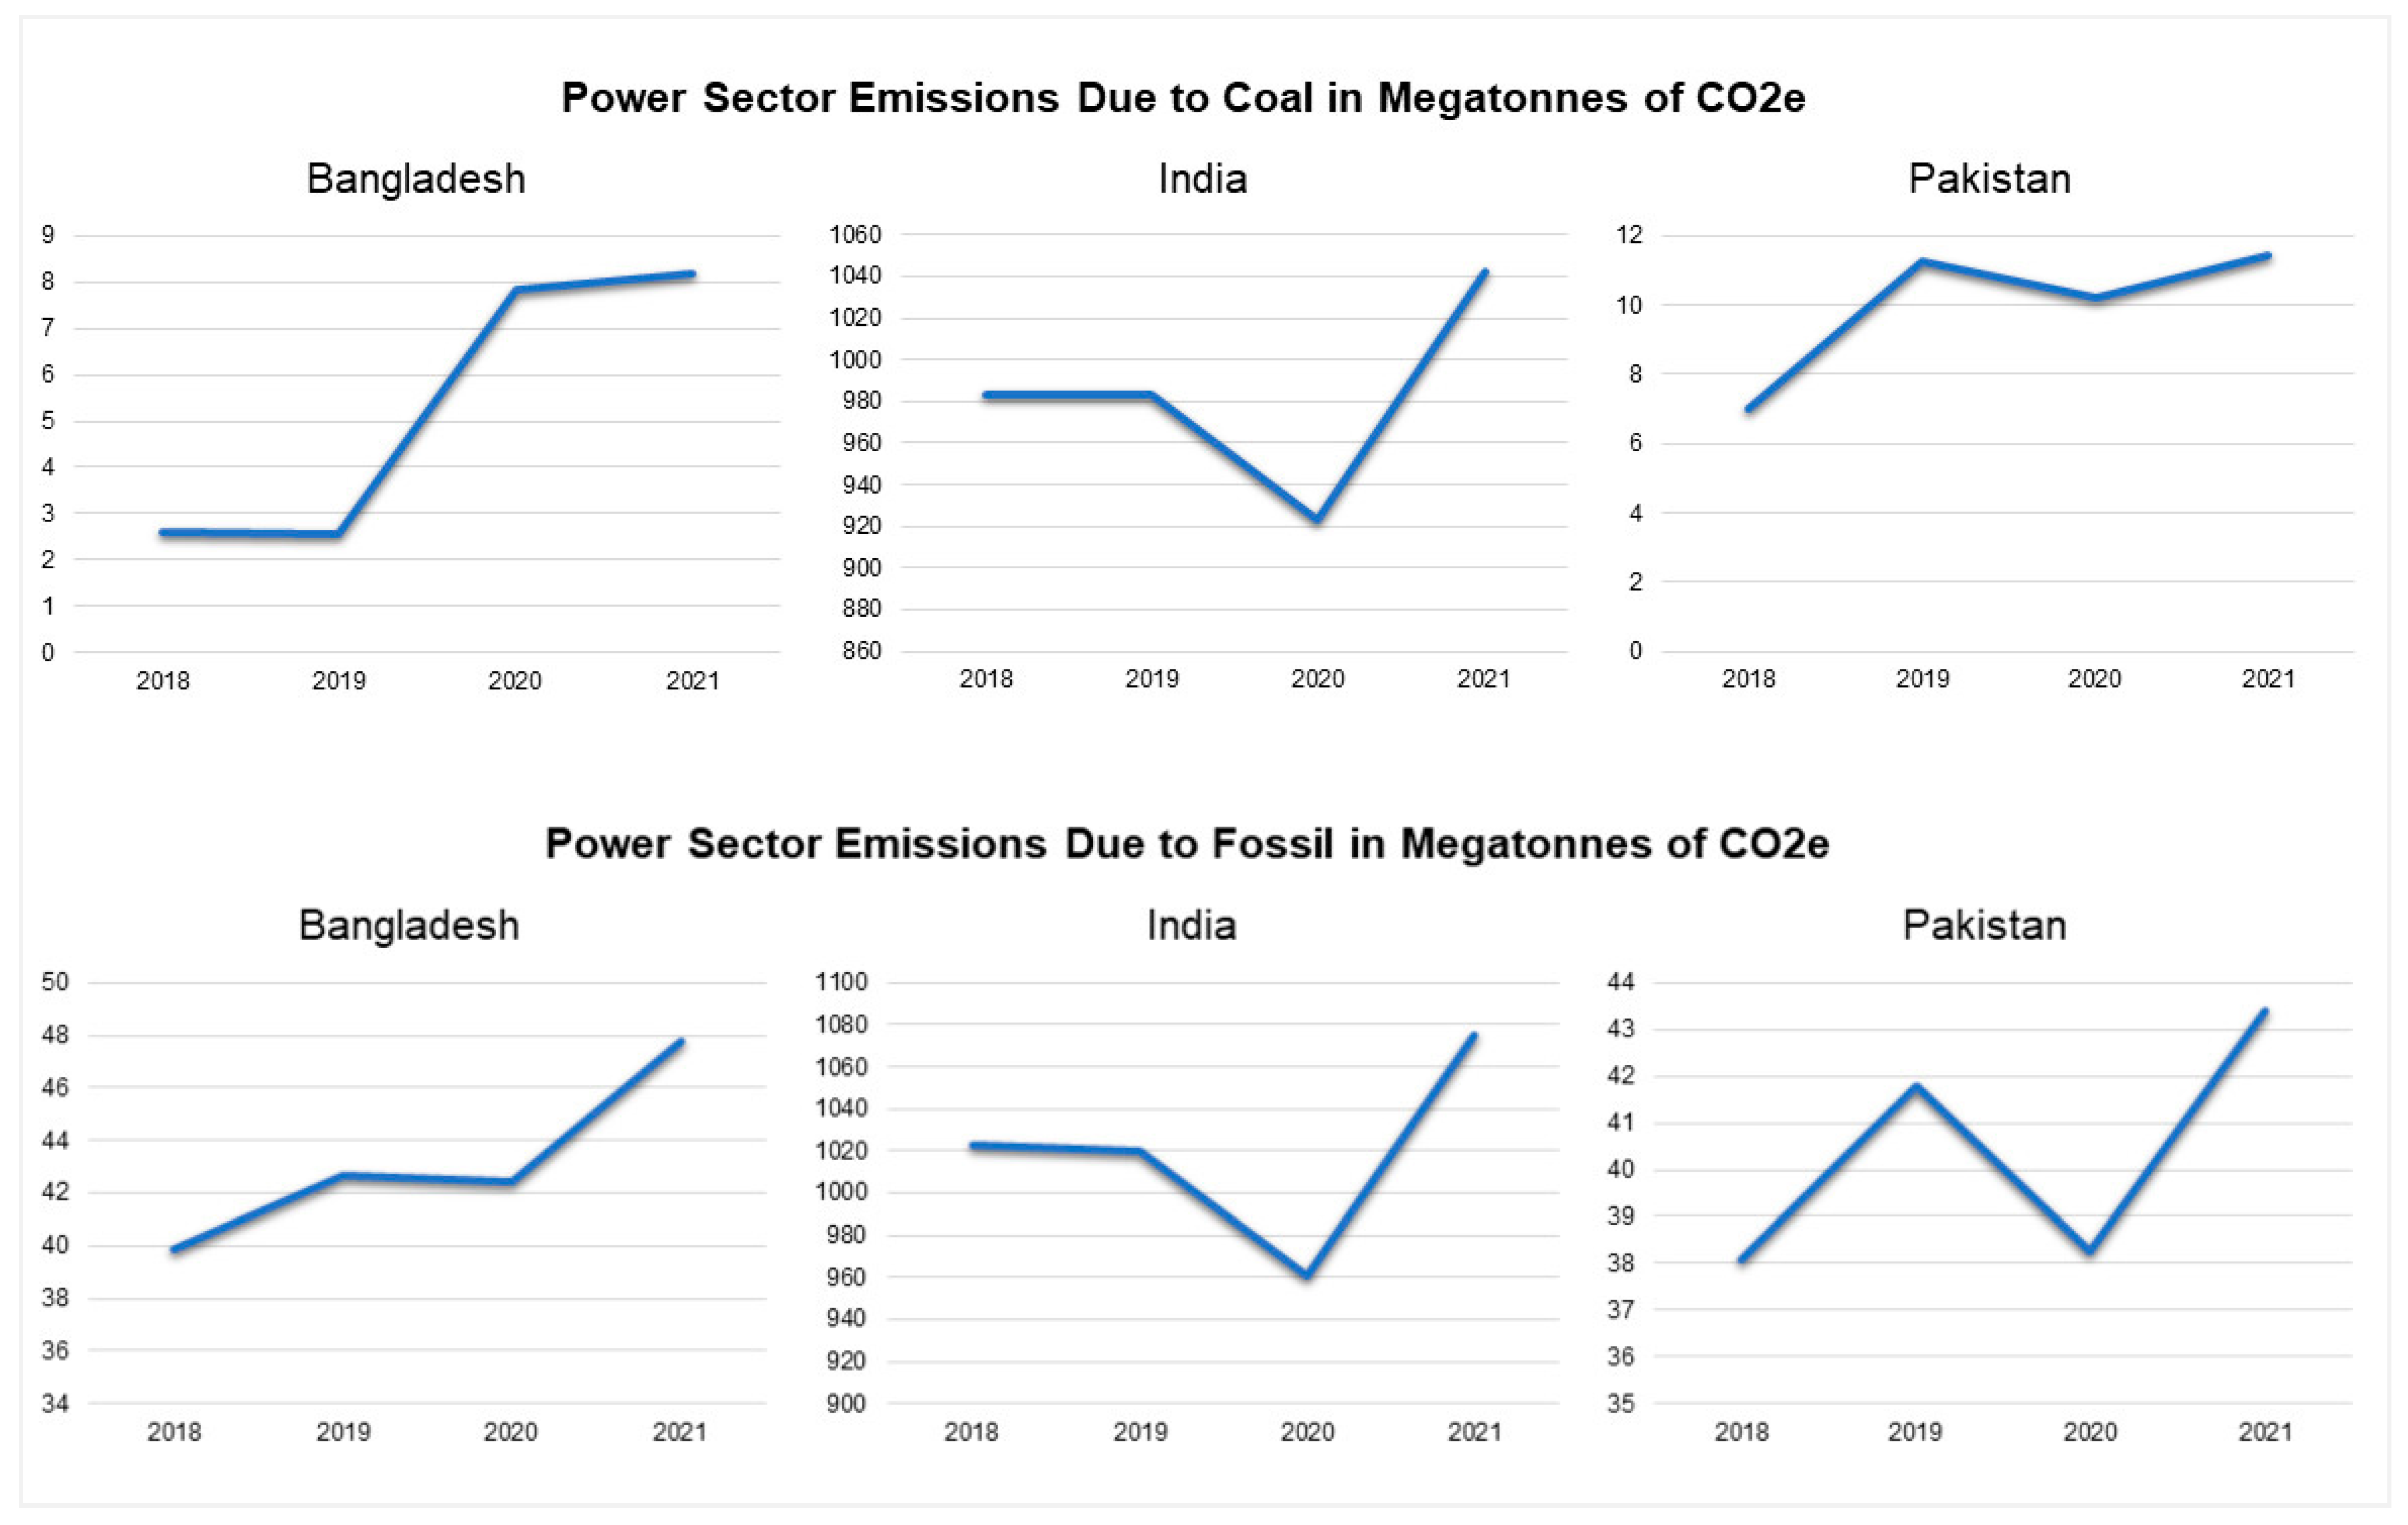
Abstract
1. Introduction
2. Materials and Methods
- i.
- Agricultural area per capita: Agricultural land is the total of land and cropland used as pasture for grazing livestock;
- ii.
- Deforestation: The permanent conversion of natural forest land to other uses including infrastructure development, settlements, and shifting cultivation;
- iii.
- AQI: The air quality index (AQI) scale measures the number of pollutants in a specific region at a selected time interval—to help assess the quality of air;
- iv.
- CO2: Carbon dioxide is a colorless greenhouse gas formed when any material containing carbon is combusted;
- v.
- Coal: A brownish-black or black sedimentary rock that is typically burned for fuel to generate electricity;
- vi.
- Dry days: Days with rainfall <0.85 mm within a typically defined period of 24 h;
- vii.
- Fossil fuel: A class of hydrocarbon-containing materials of biological origin that can be used as a source of energy;
- viii.
- Heat index: An equation that combines relative humidity and air temperature to determine the perceived temperature;
- ix.
- kWh: A unit of energy, which means one kilowatt hour (kWh) of power;
- x.
- Mean drought index (projected change, unitless): The standardized precipitation evapotranspiration index (SPEI), or mean drought index, calculated for a specific period, is closely related to drought impacts on ecosystems, water, and crop resources. The SPEI accounts for potential evapotranspiration and precipitation in determining drought;
- xi.
- Nitrogen dioxide tropospheric column: A two-dimensional field of the total amount of nitrogen dioxide molecules per unit area in an atmospheric column extending from the Earth’s surface to the tropopause;
- xii.
- NO2: Nitrogen dioxide is a gaseous air pollutant composed of nitrogen and oxygen;
- xiii.
- NOx: Gases nitric oxide and nitrogen dioxide that is produced when fuel is burned;
- xiv.
- Power sector emissions: Emissions of gas or radiation into the atmosphere due to power sectors.
3. Results
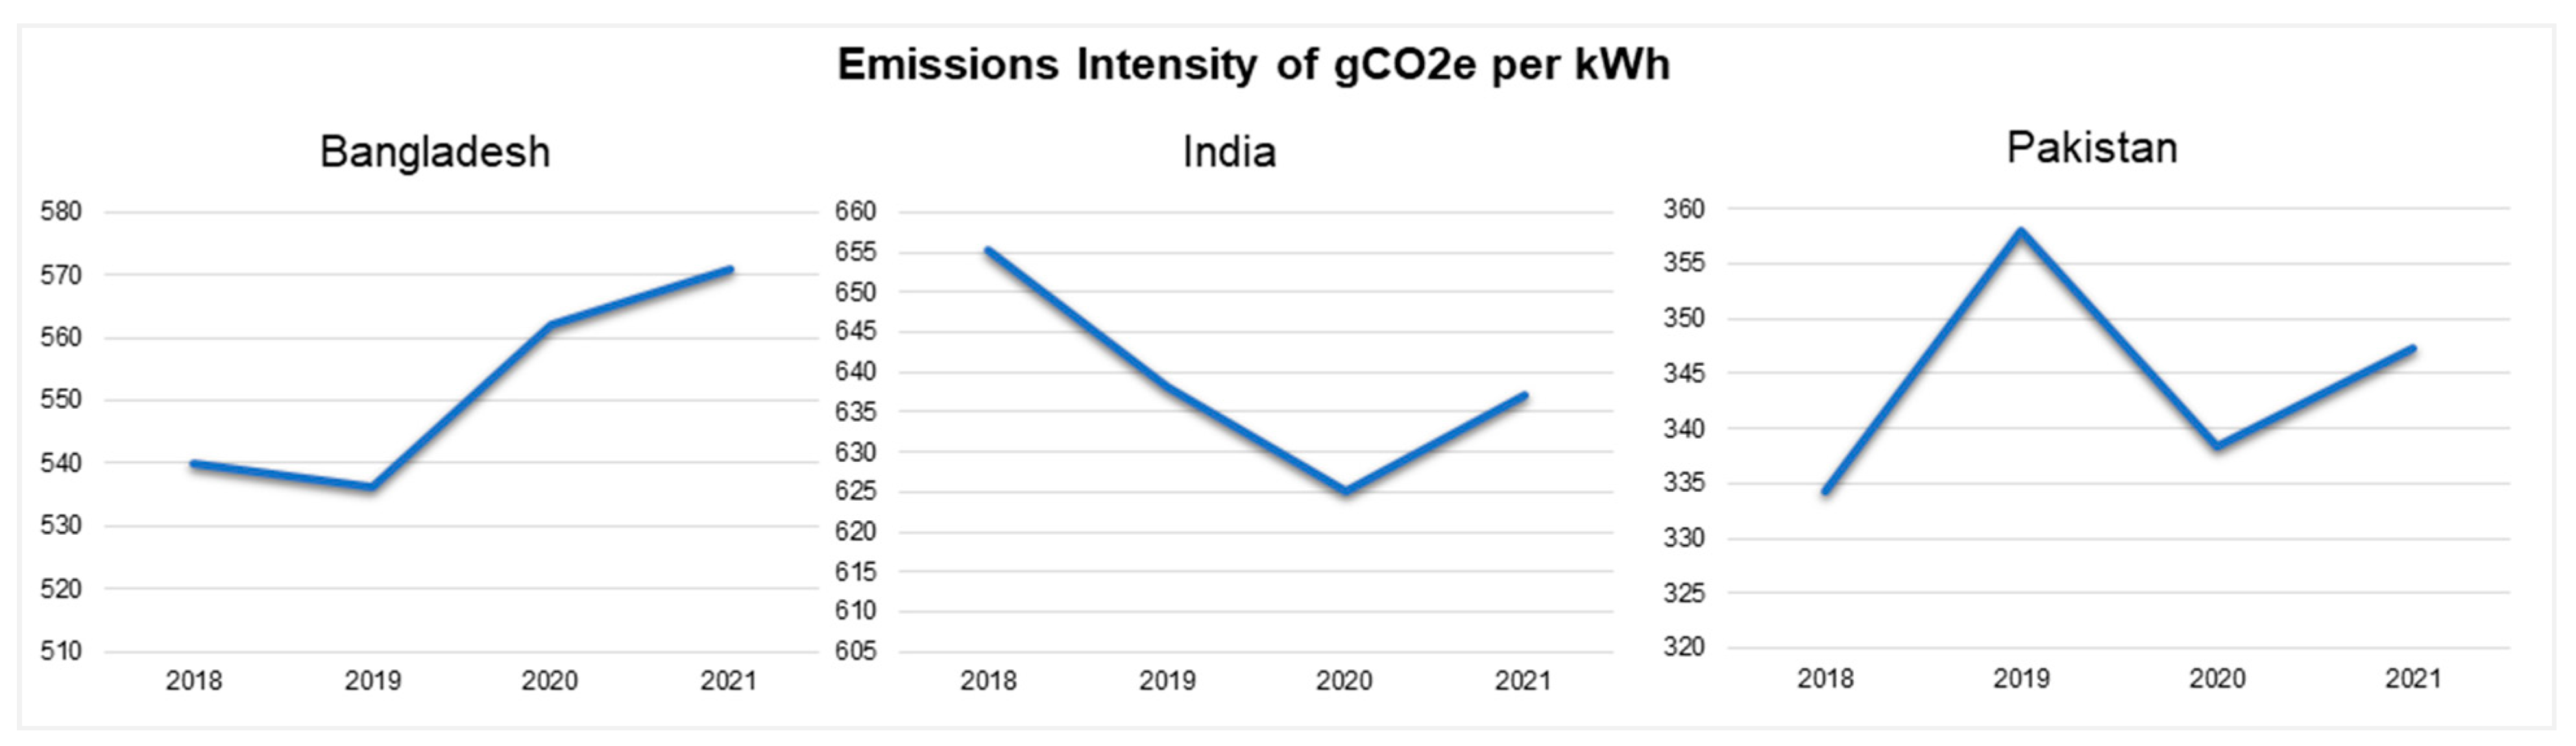
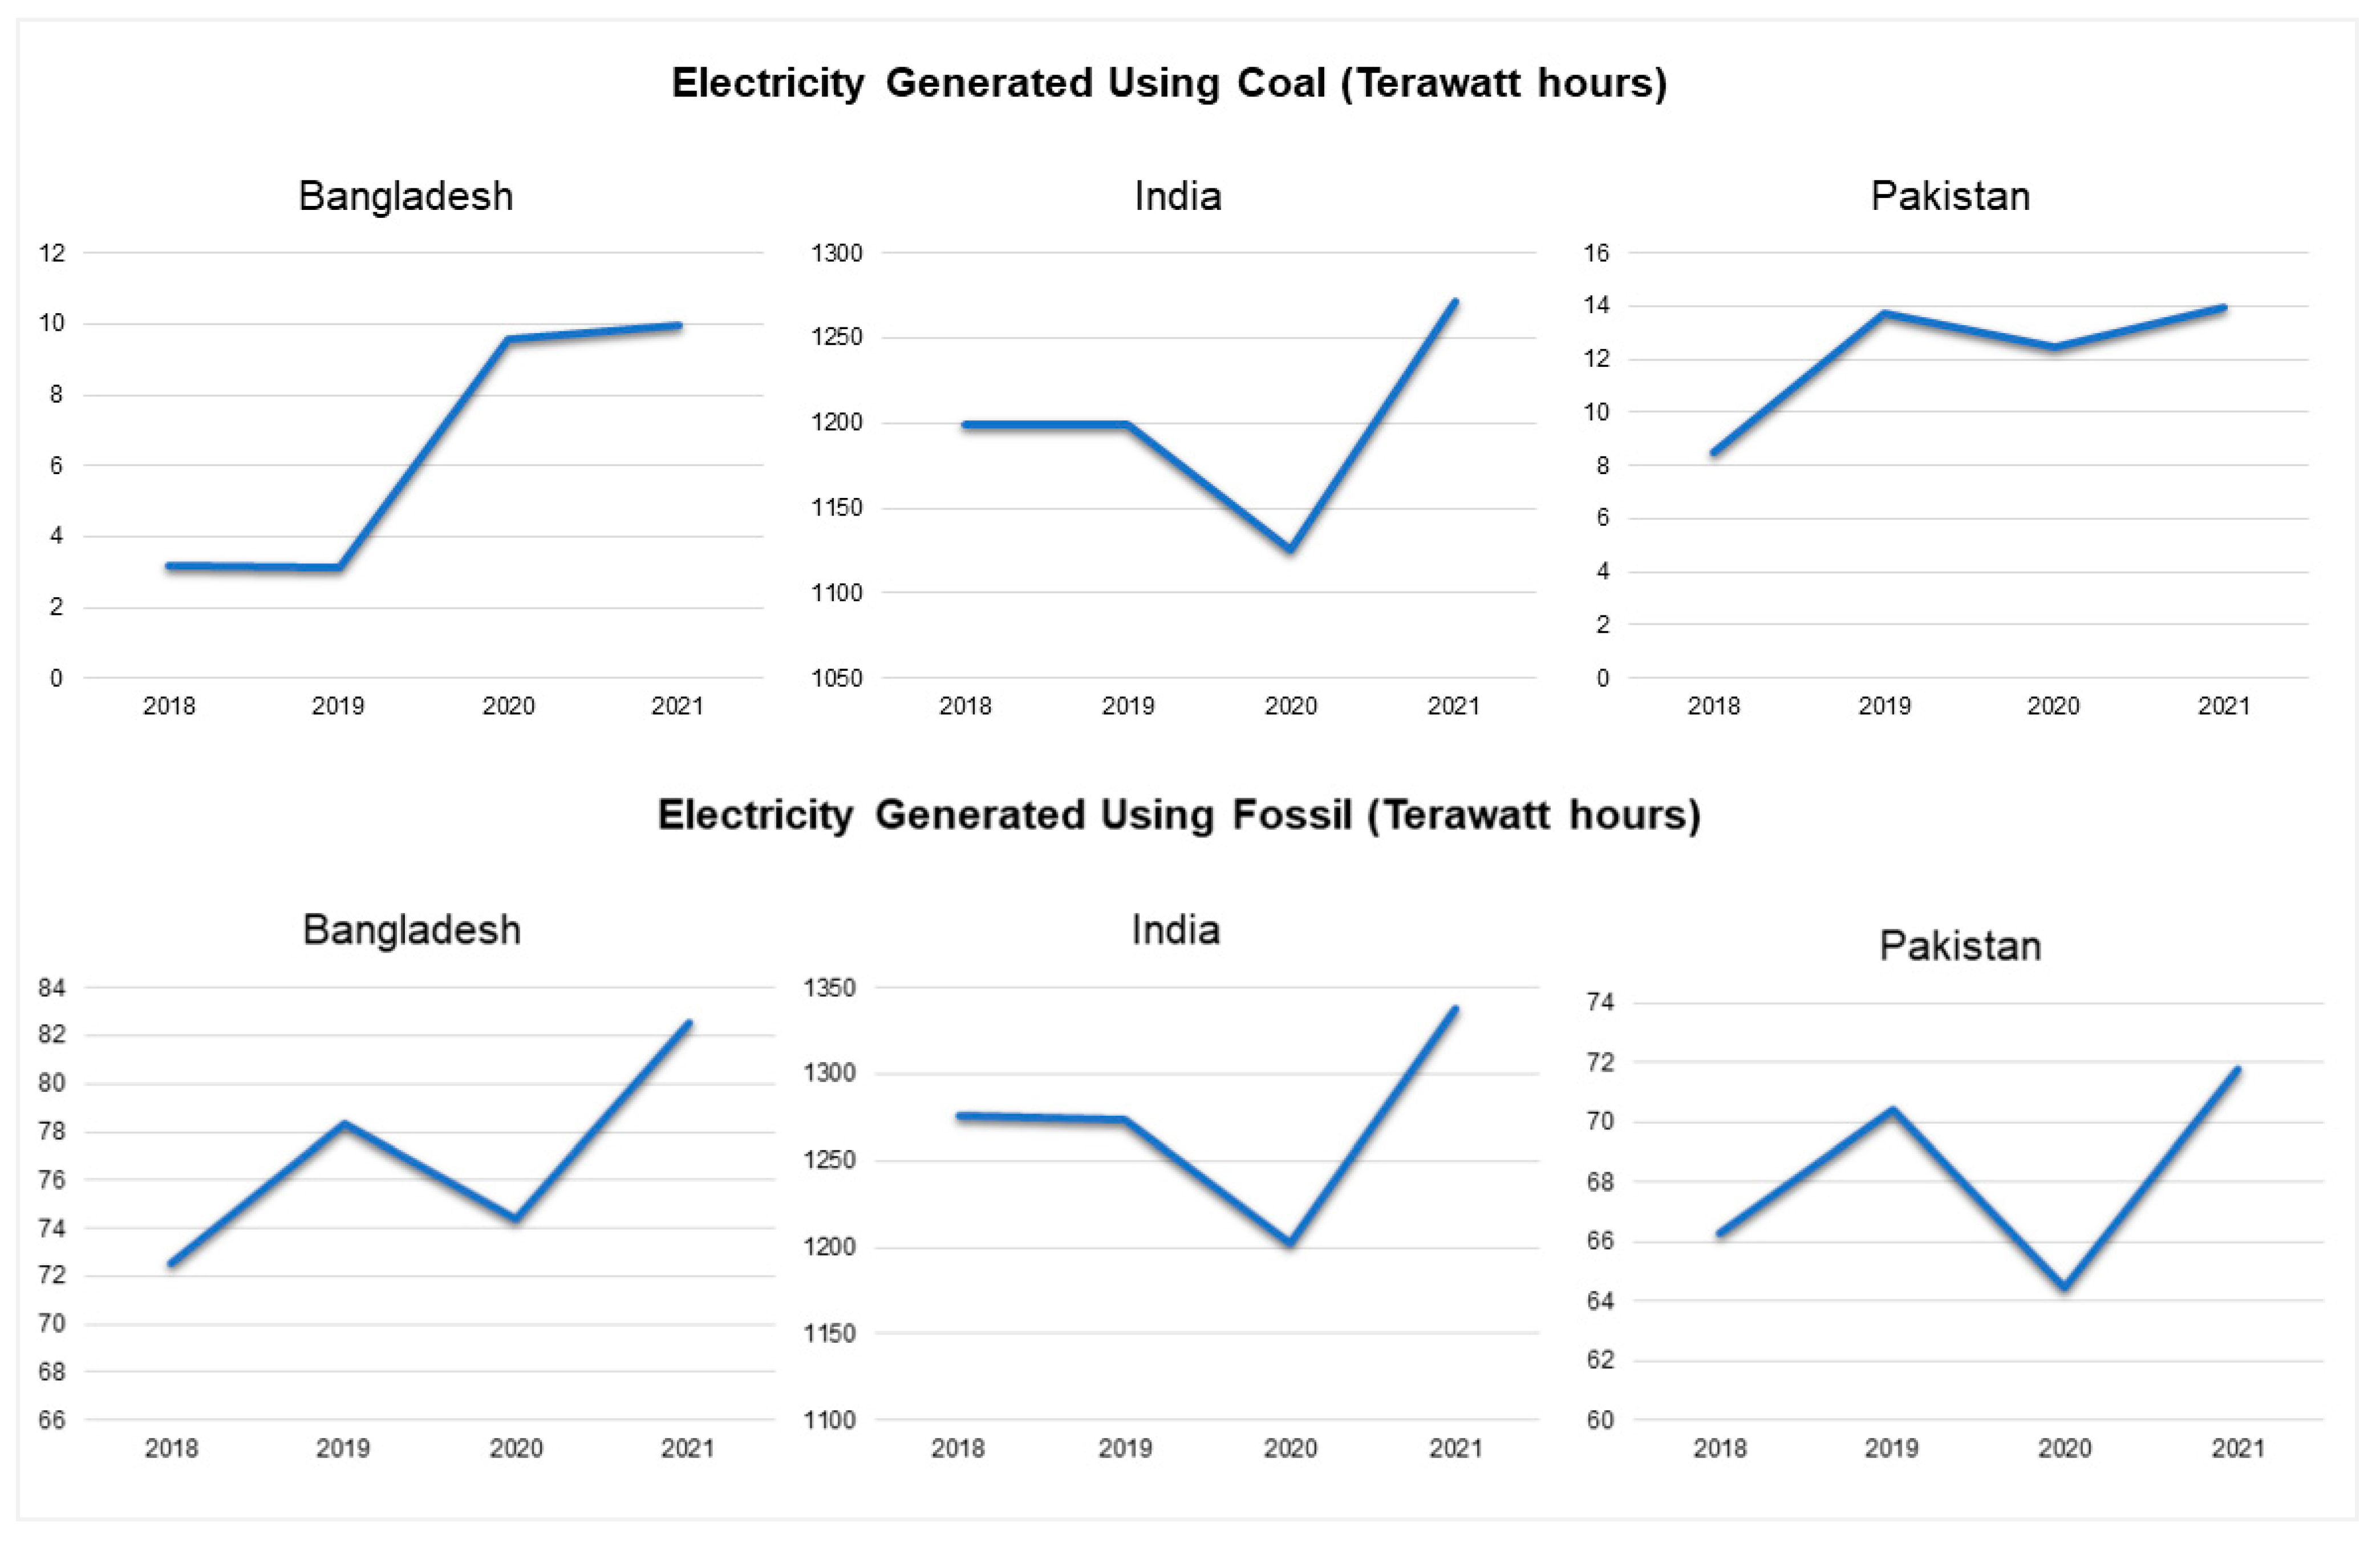
3.1. Power Sector Usage and Emissions of Coal, Fossil, and Carbon Dioxide
3.1.1. Power Section Emissions Due to Coal and Fossil (2018–2021)
3.1.2. Emissions Intensity of Carbon Dioxide per kWh (2018–2021)
3.1.3. Electricity Generated Using Coal and Fossil in Terawatt Hours (2018–2021)
3.2. Geographic Mapping of Low Air Quality, Annual Deforestation, and Agricultural Area
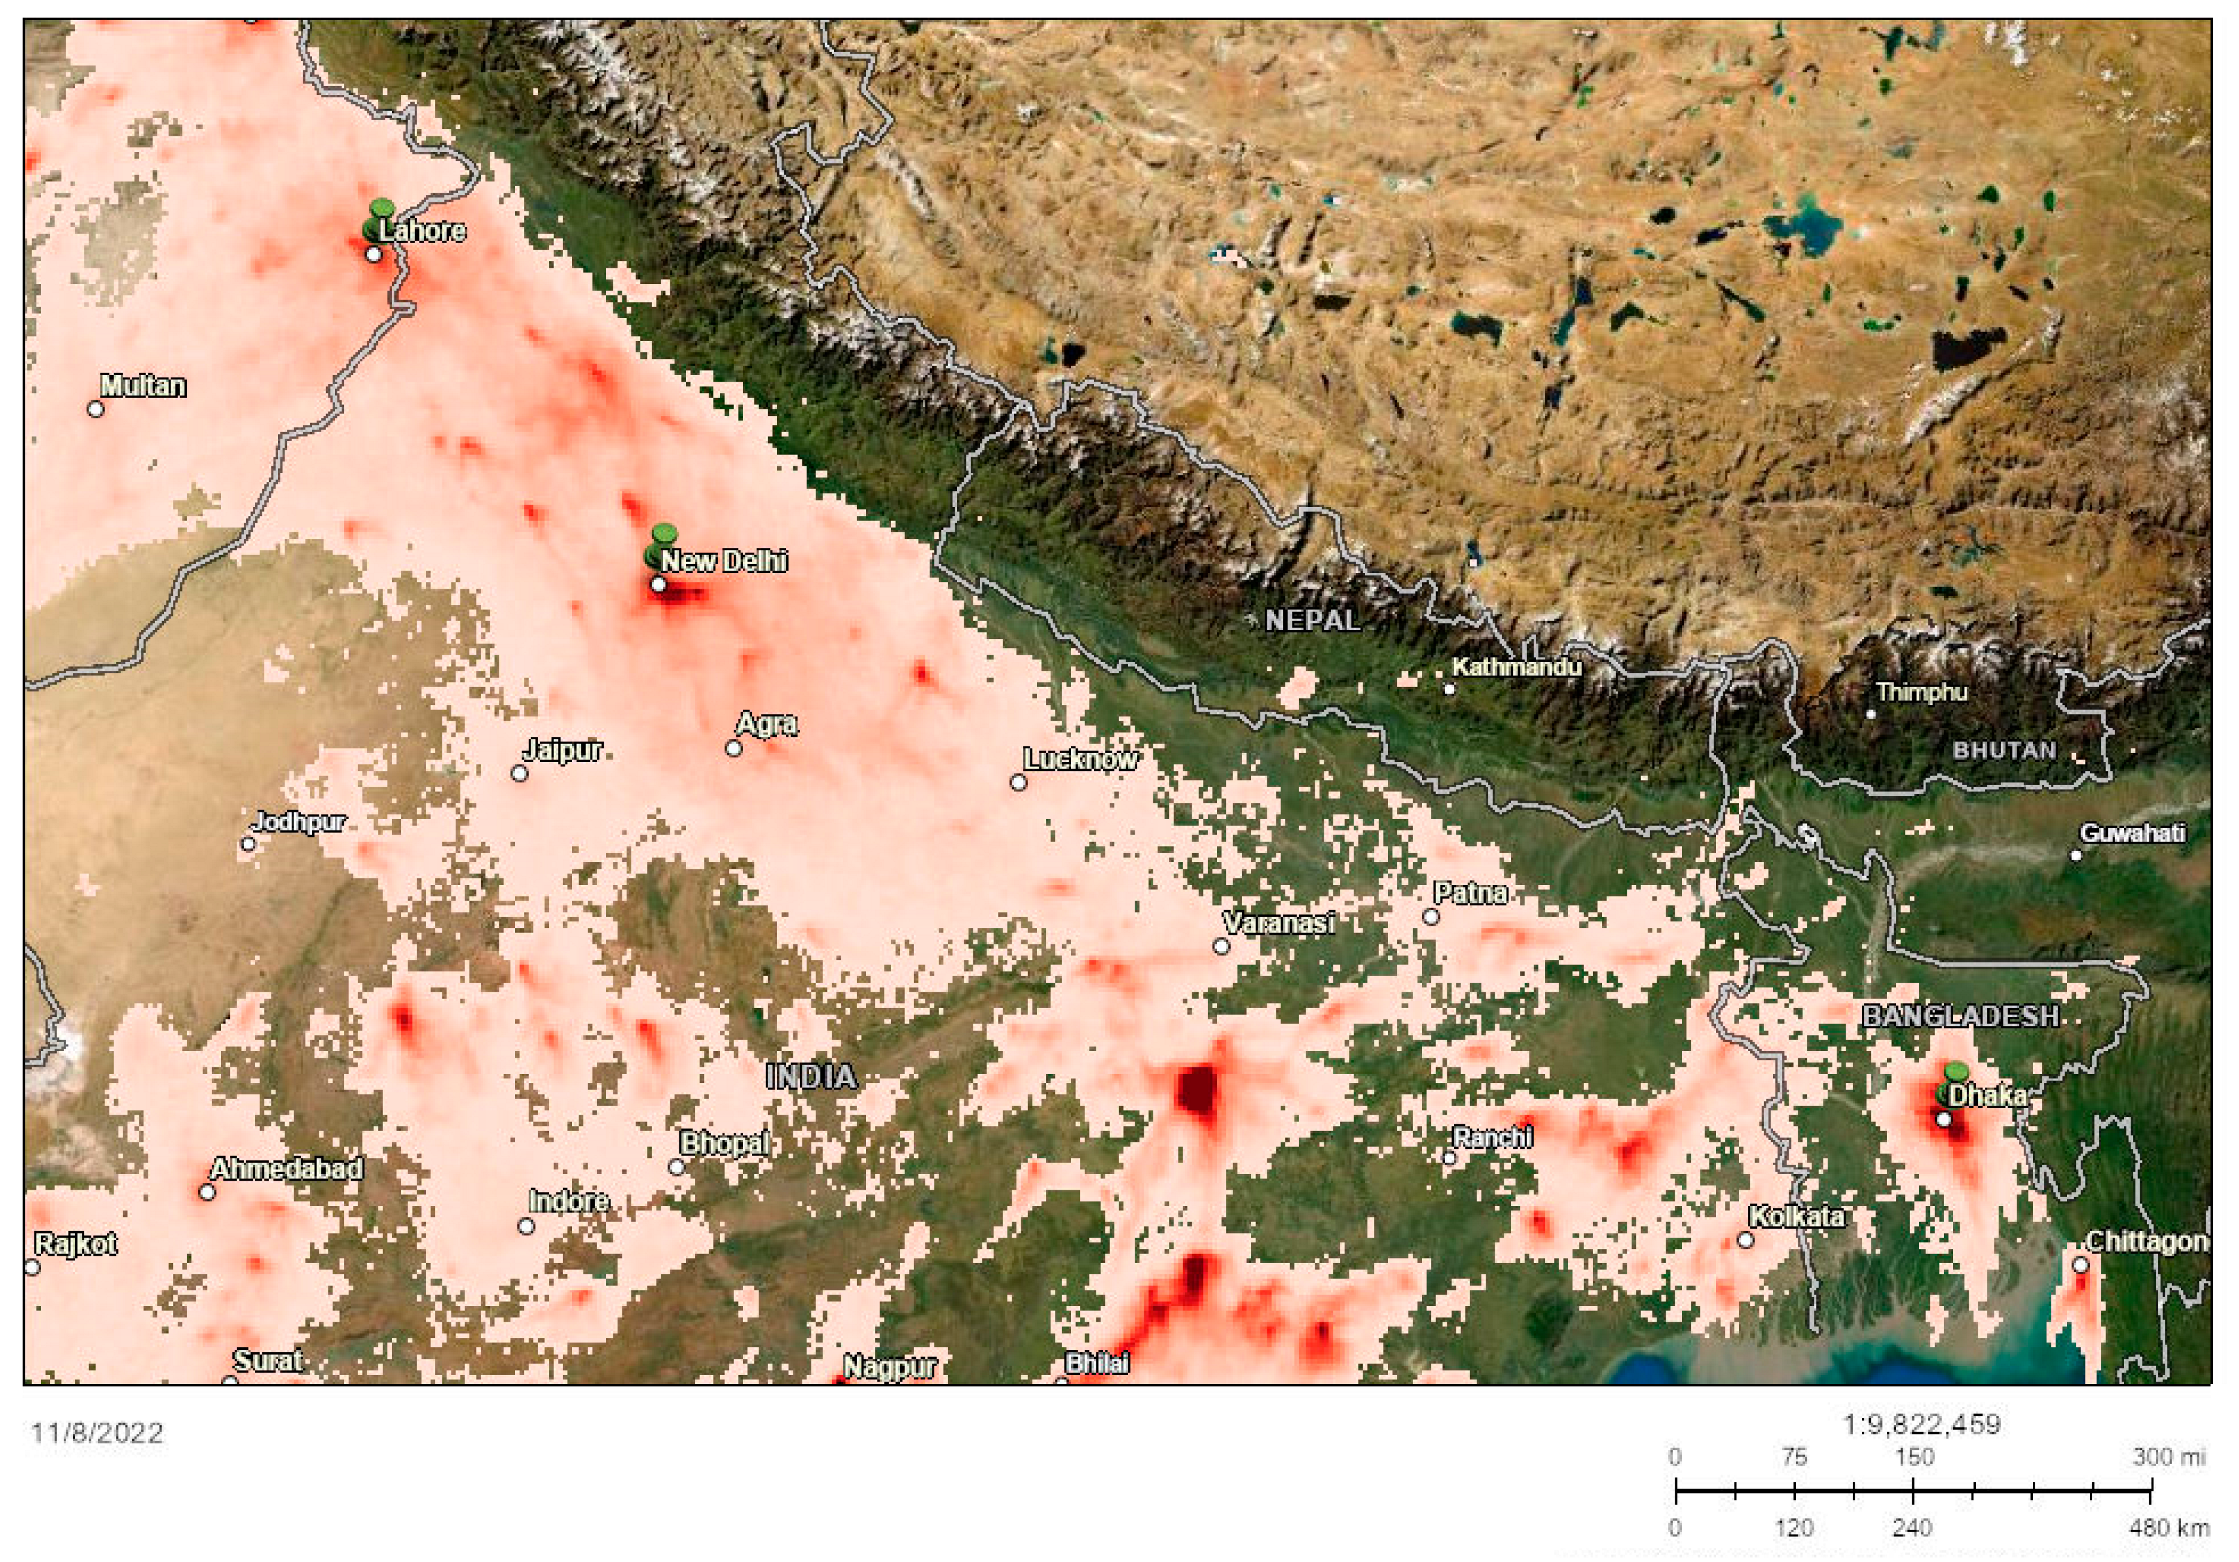
3.2.1. Geospatial Map of Low Air Quality Hot Spots in South Asia
- Lahore: Nitrogen dioxide tropospheric column (140 μmol/m2); Air quality index: 193 (US AQI)
- New Delhi: Nitrogen dioxide tropospheric column (262 μmol/m2); Air quality index: 251 (US AQI)
- Dhaka: Nitrogen dioxide tropospheric column (212 μmol/m2); Air quality index: 140 (US AQI)
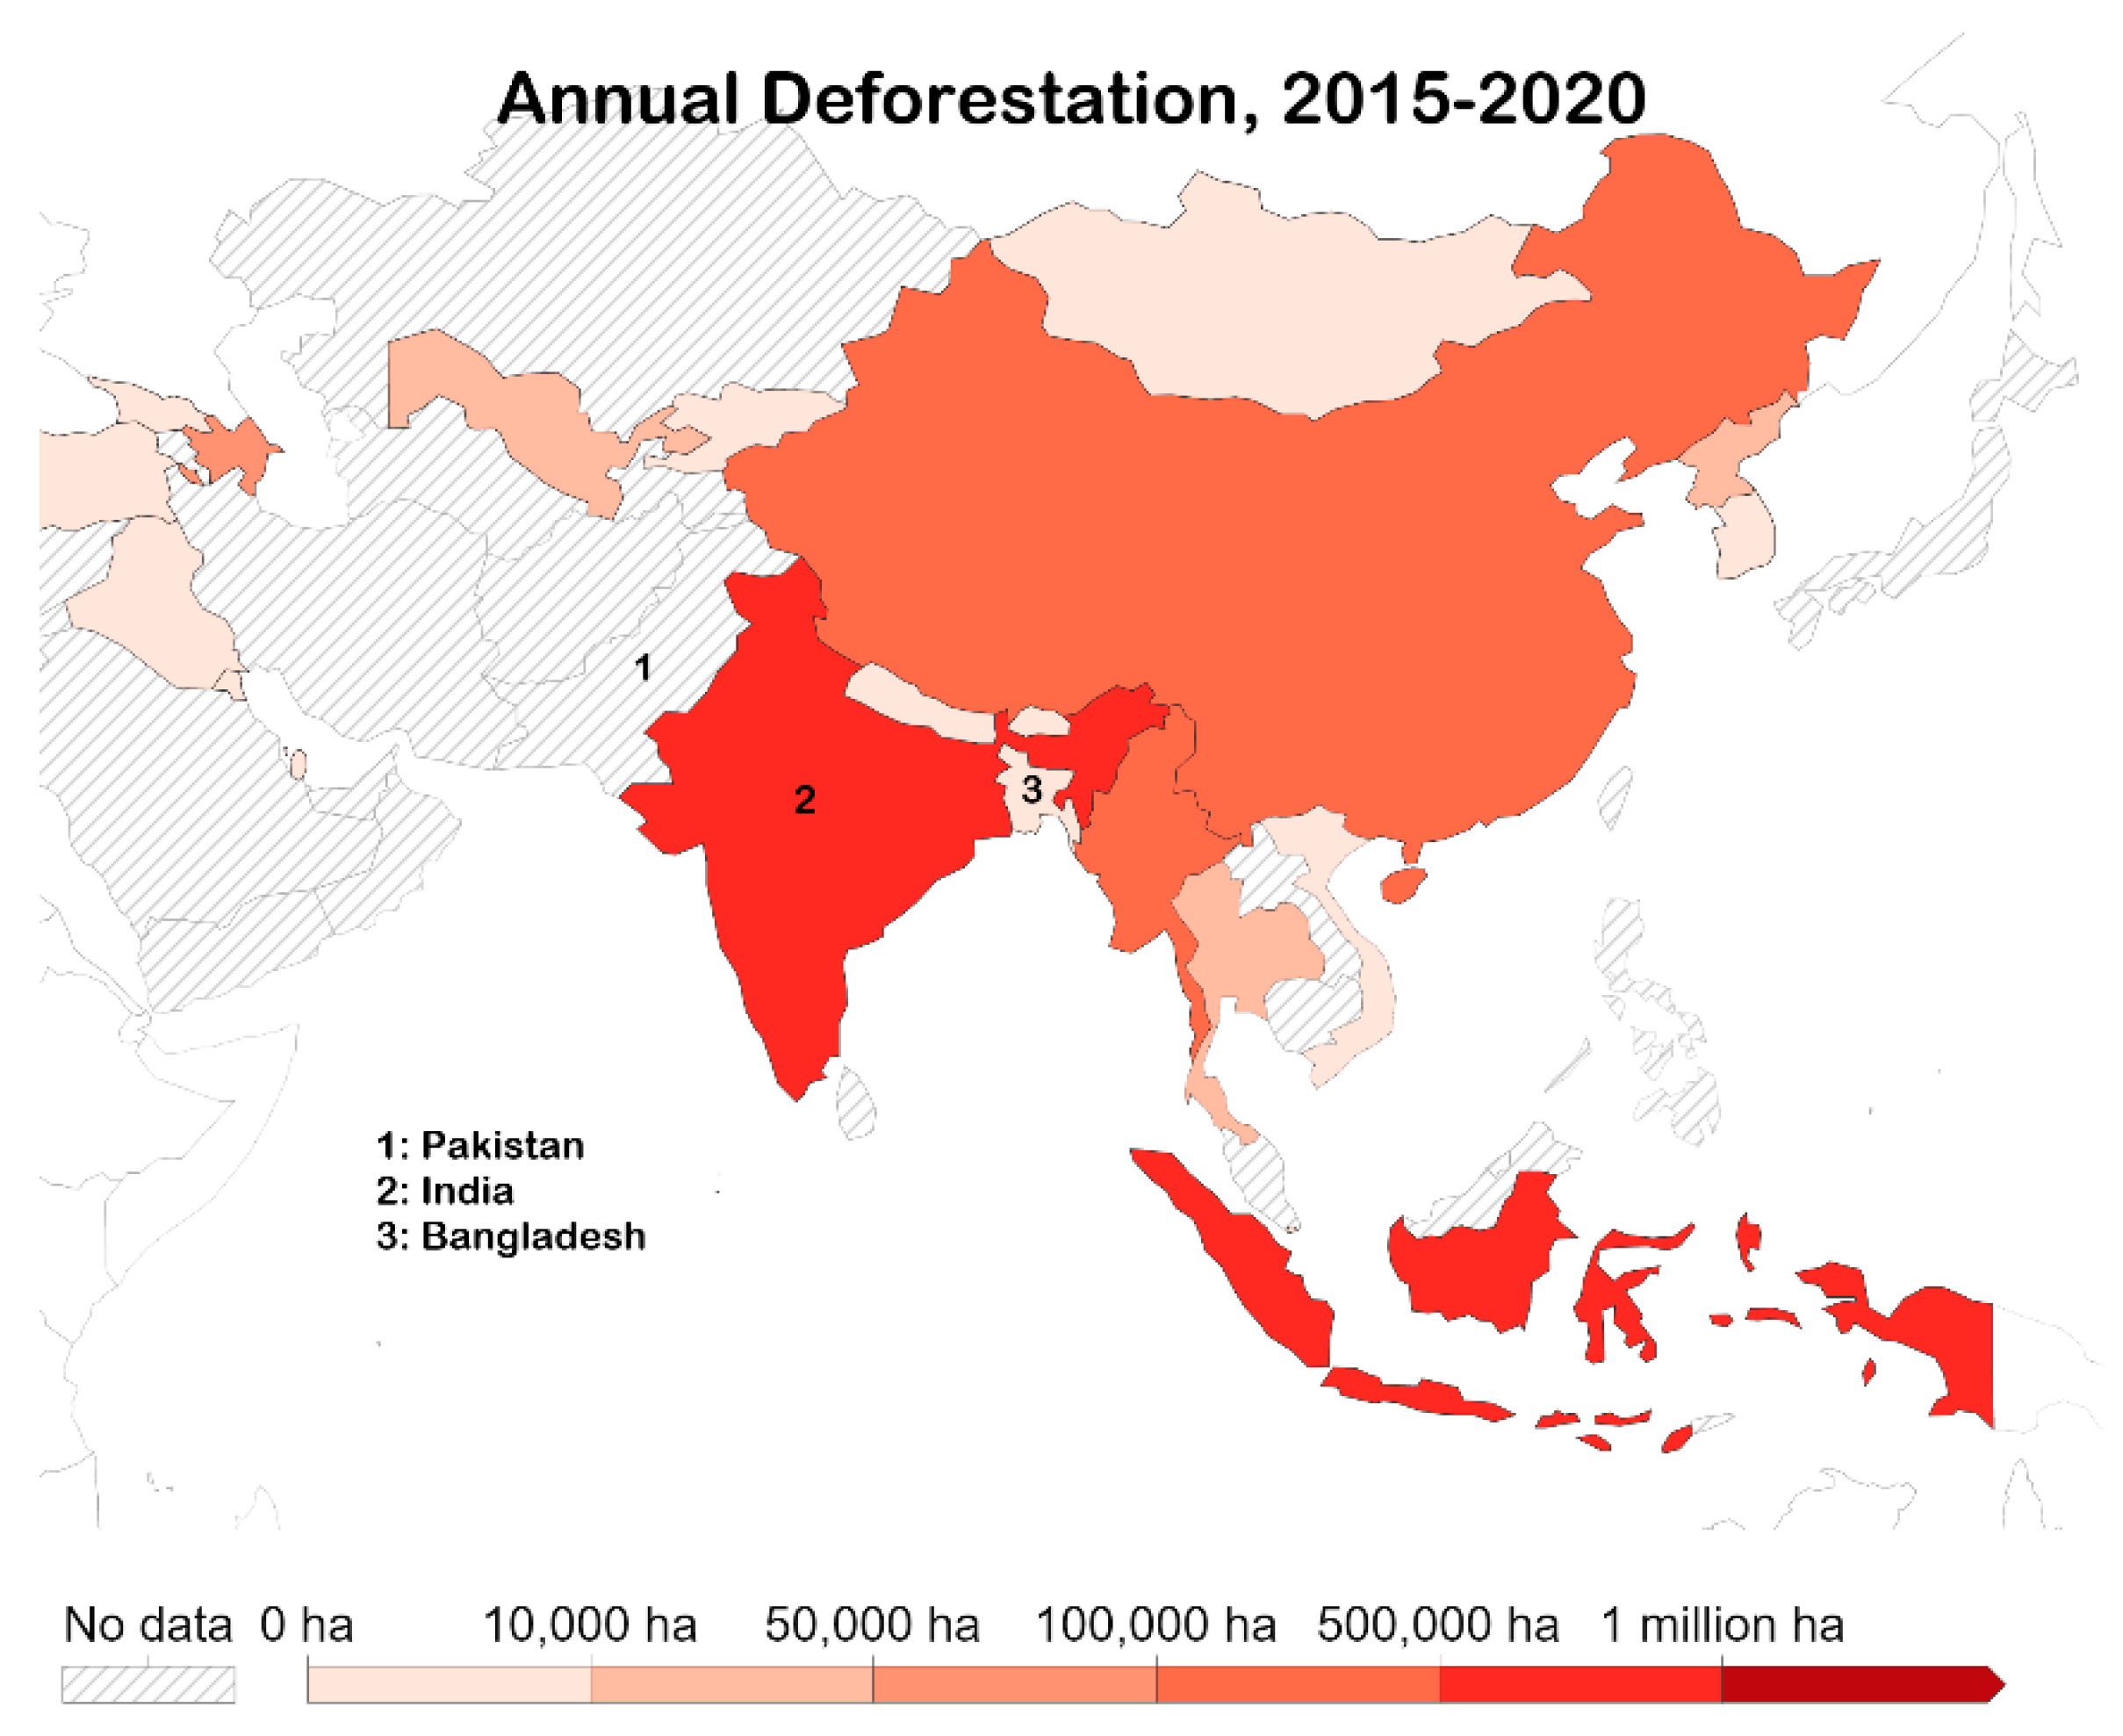
3.2.2. Map Representing Annual Deforestation between 2015 and 2020 in South Asia
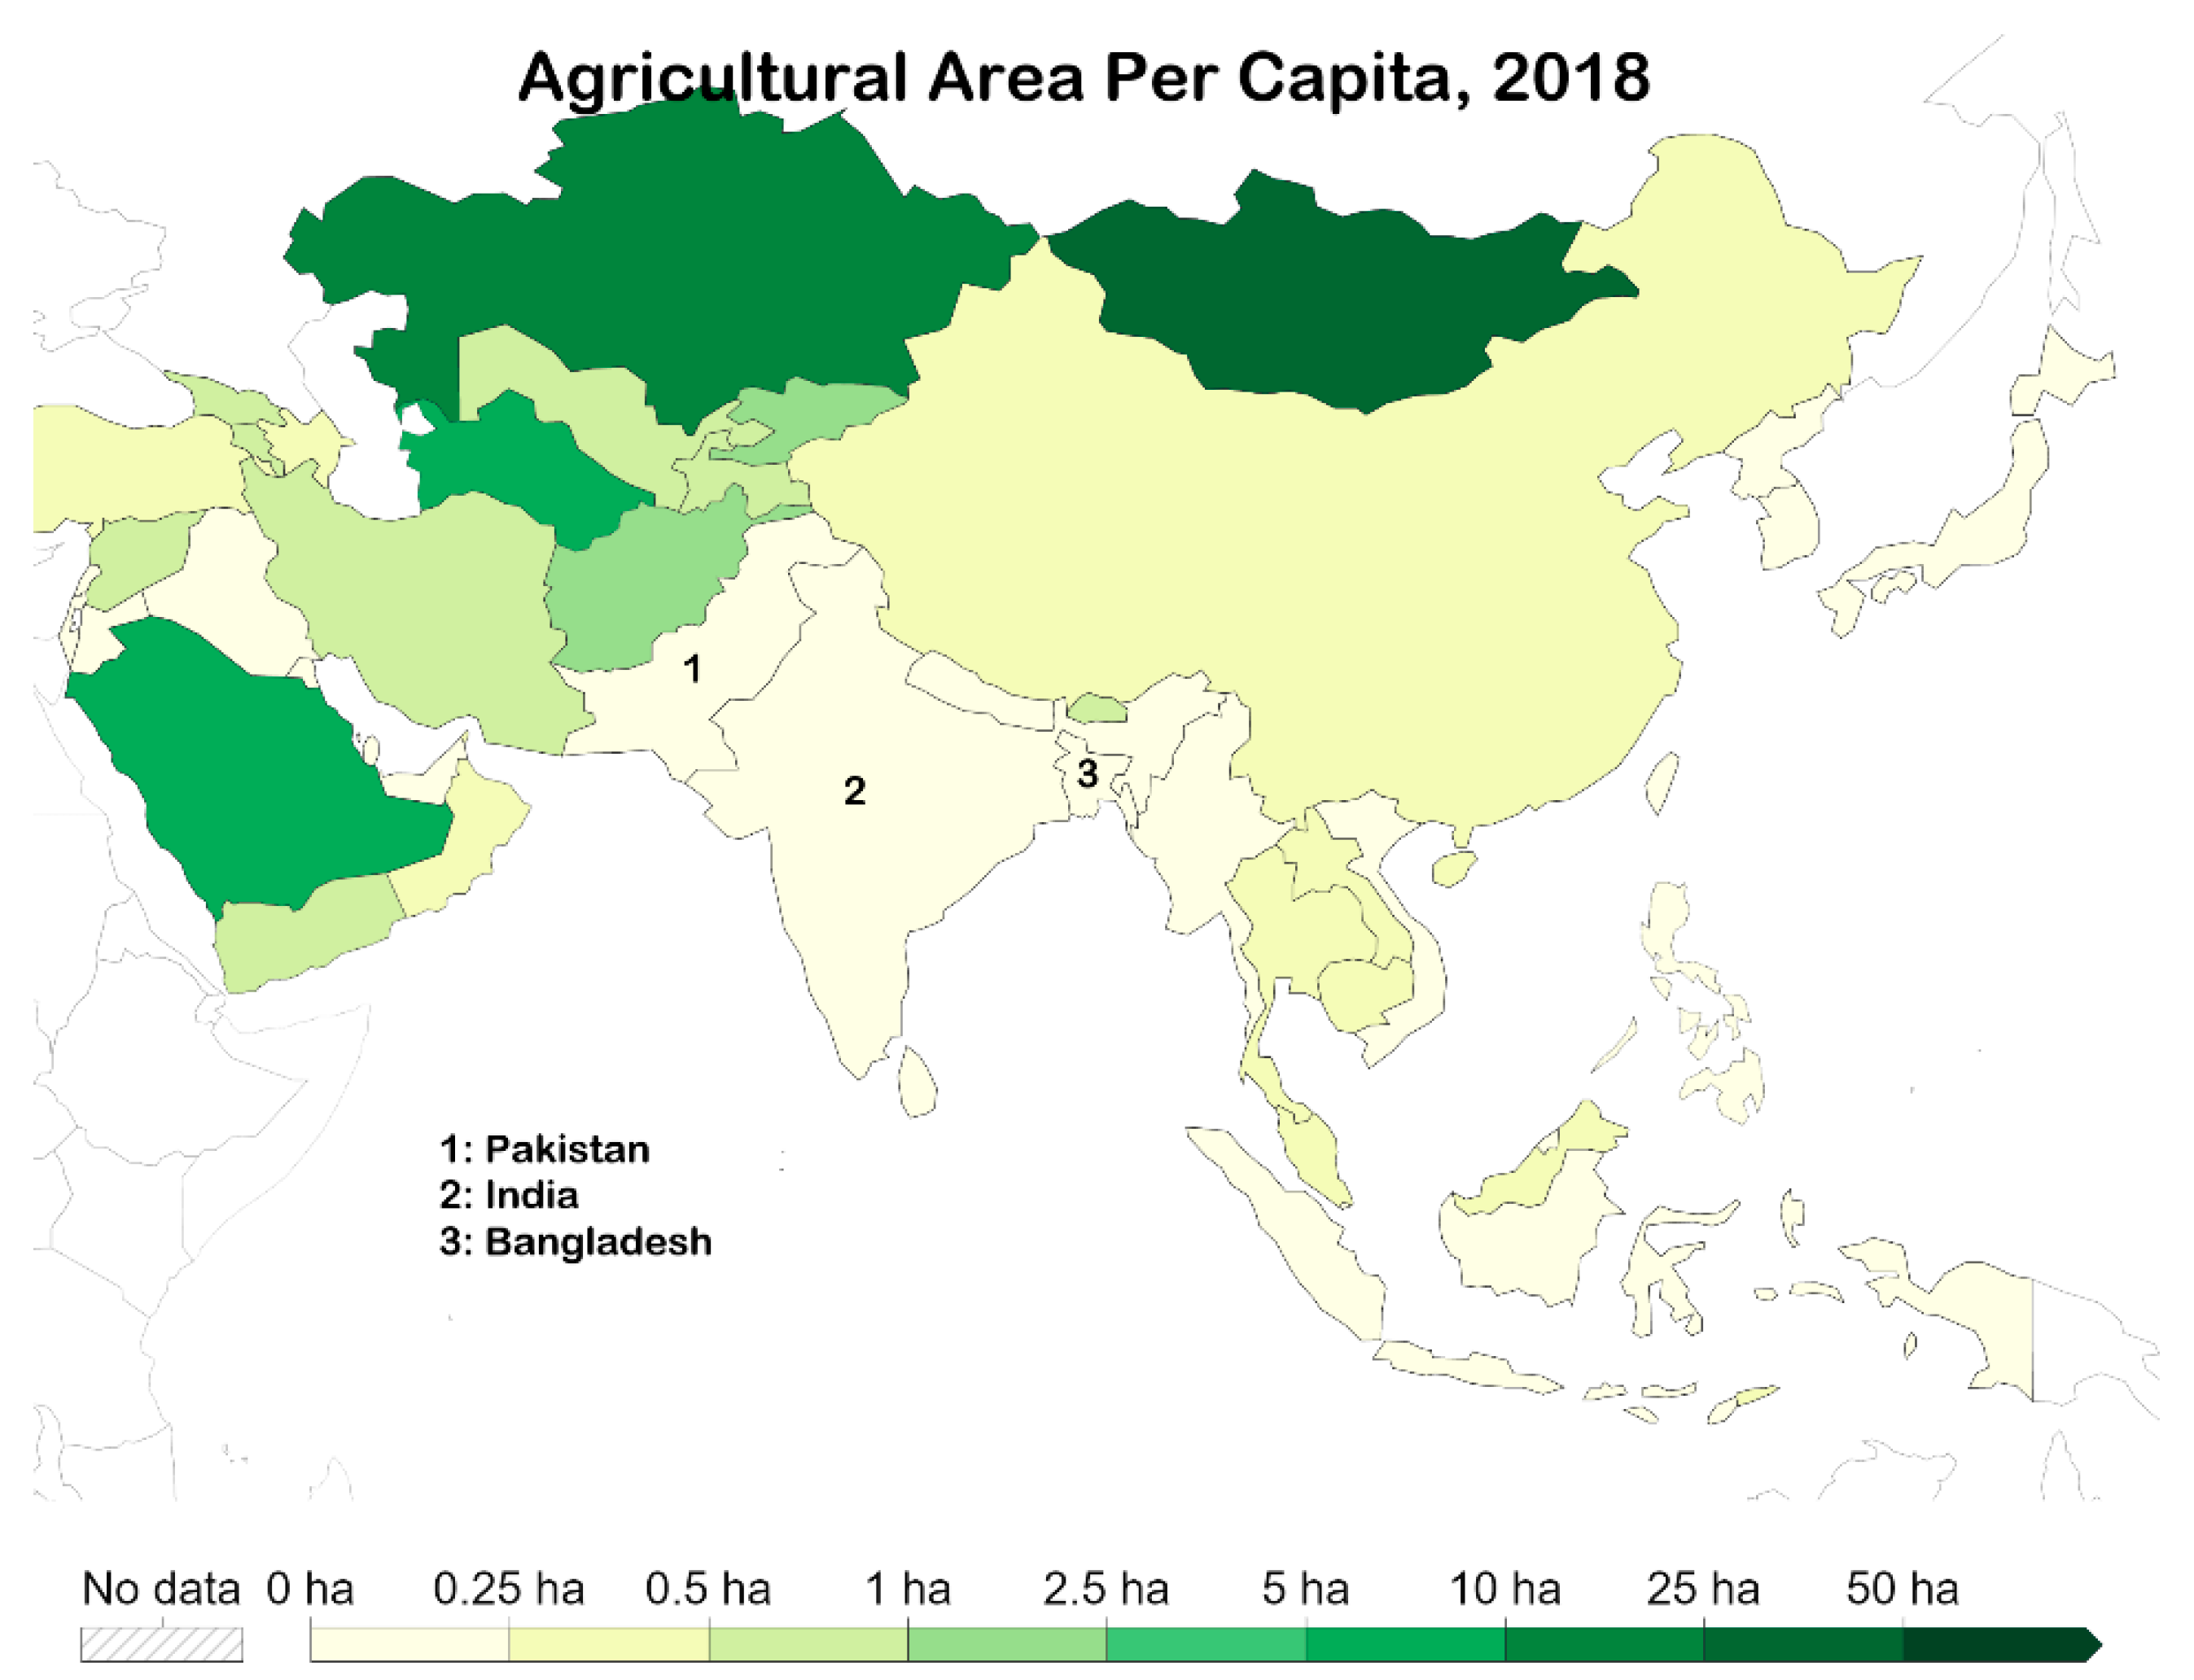
3.2.3. Map Depicting Agricultural Area per Capita in 2018 across South Asia
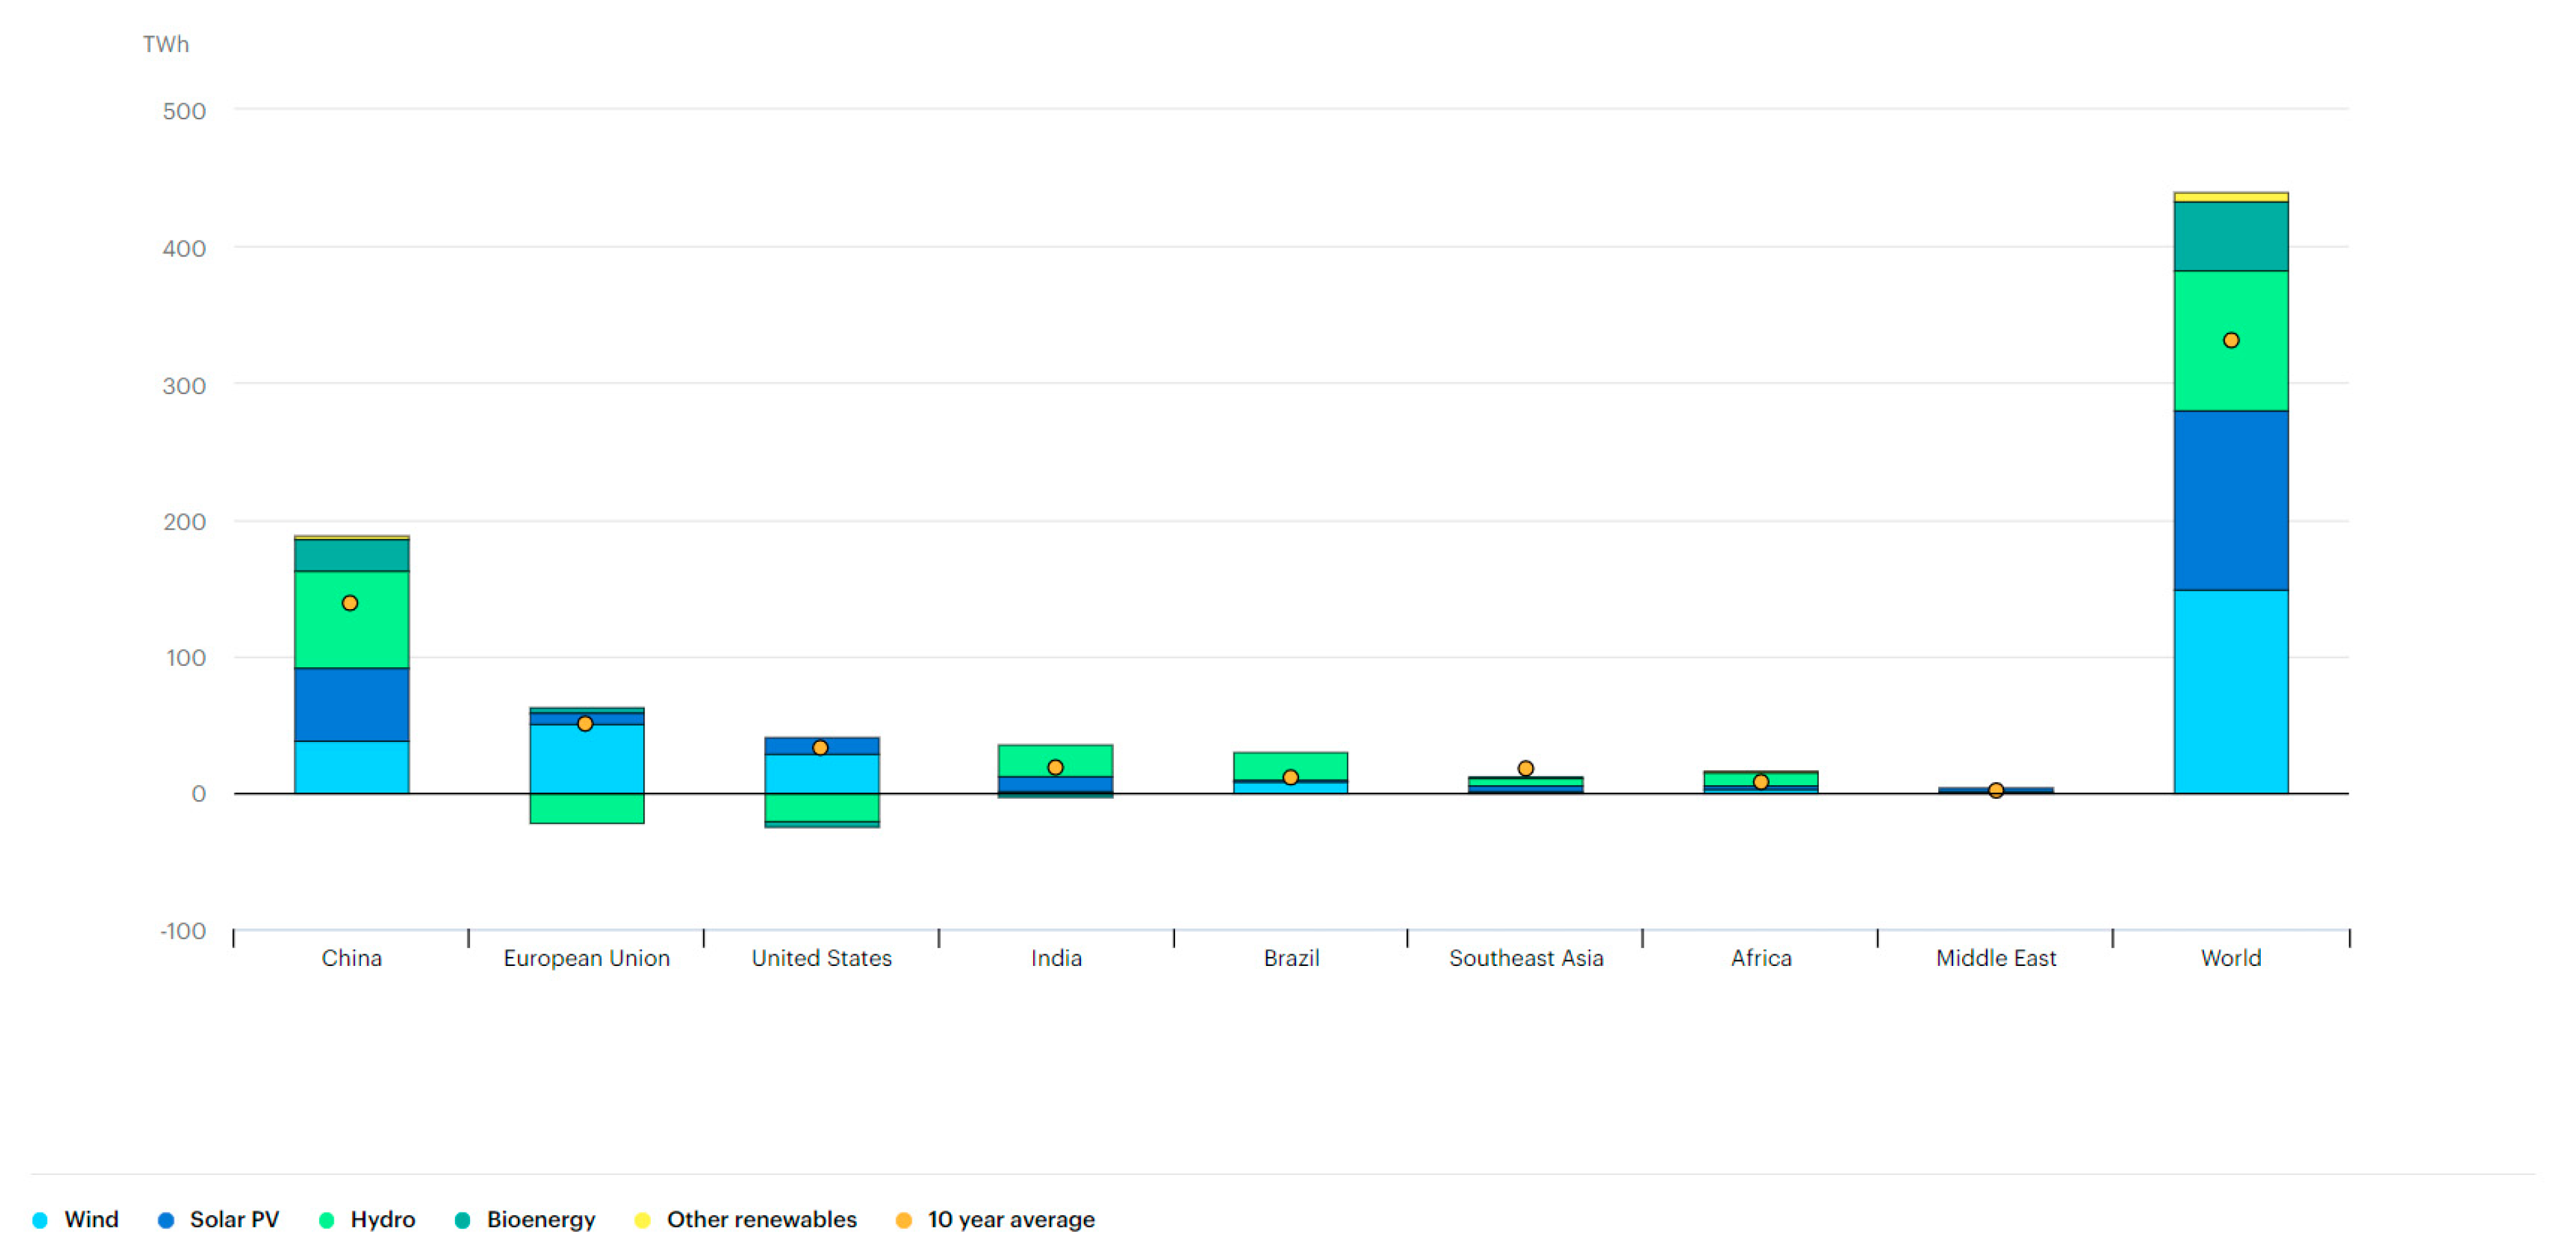
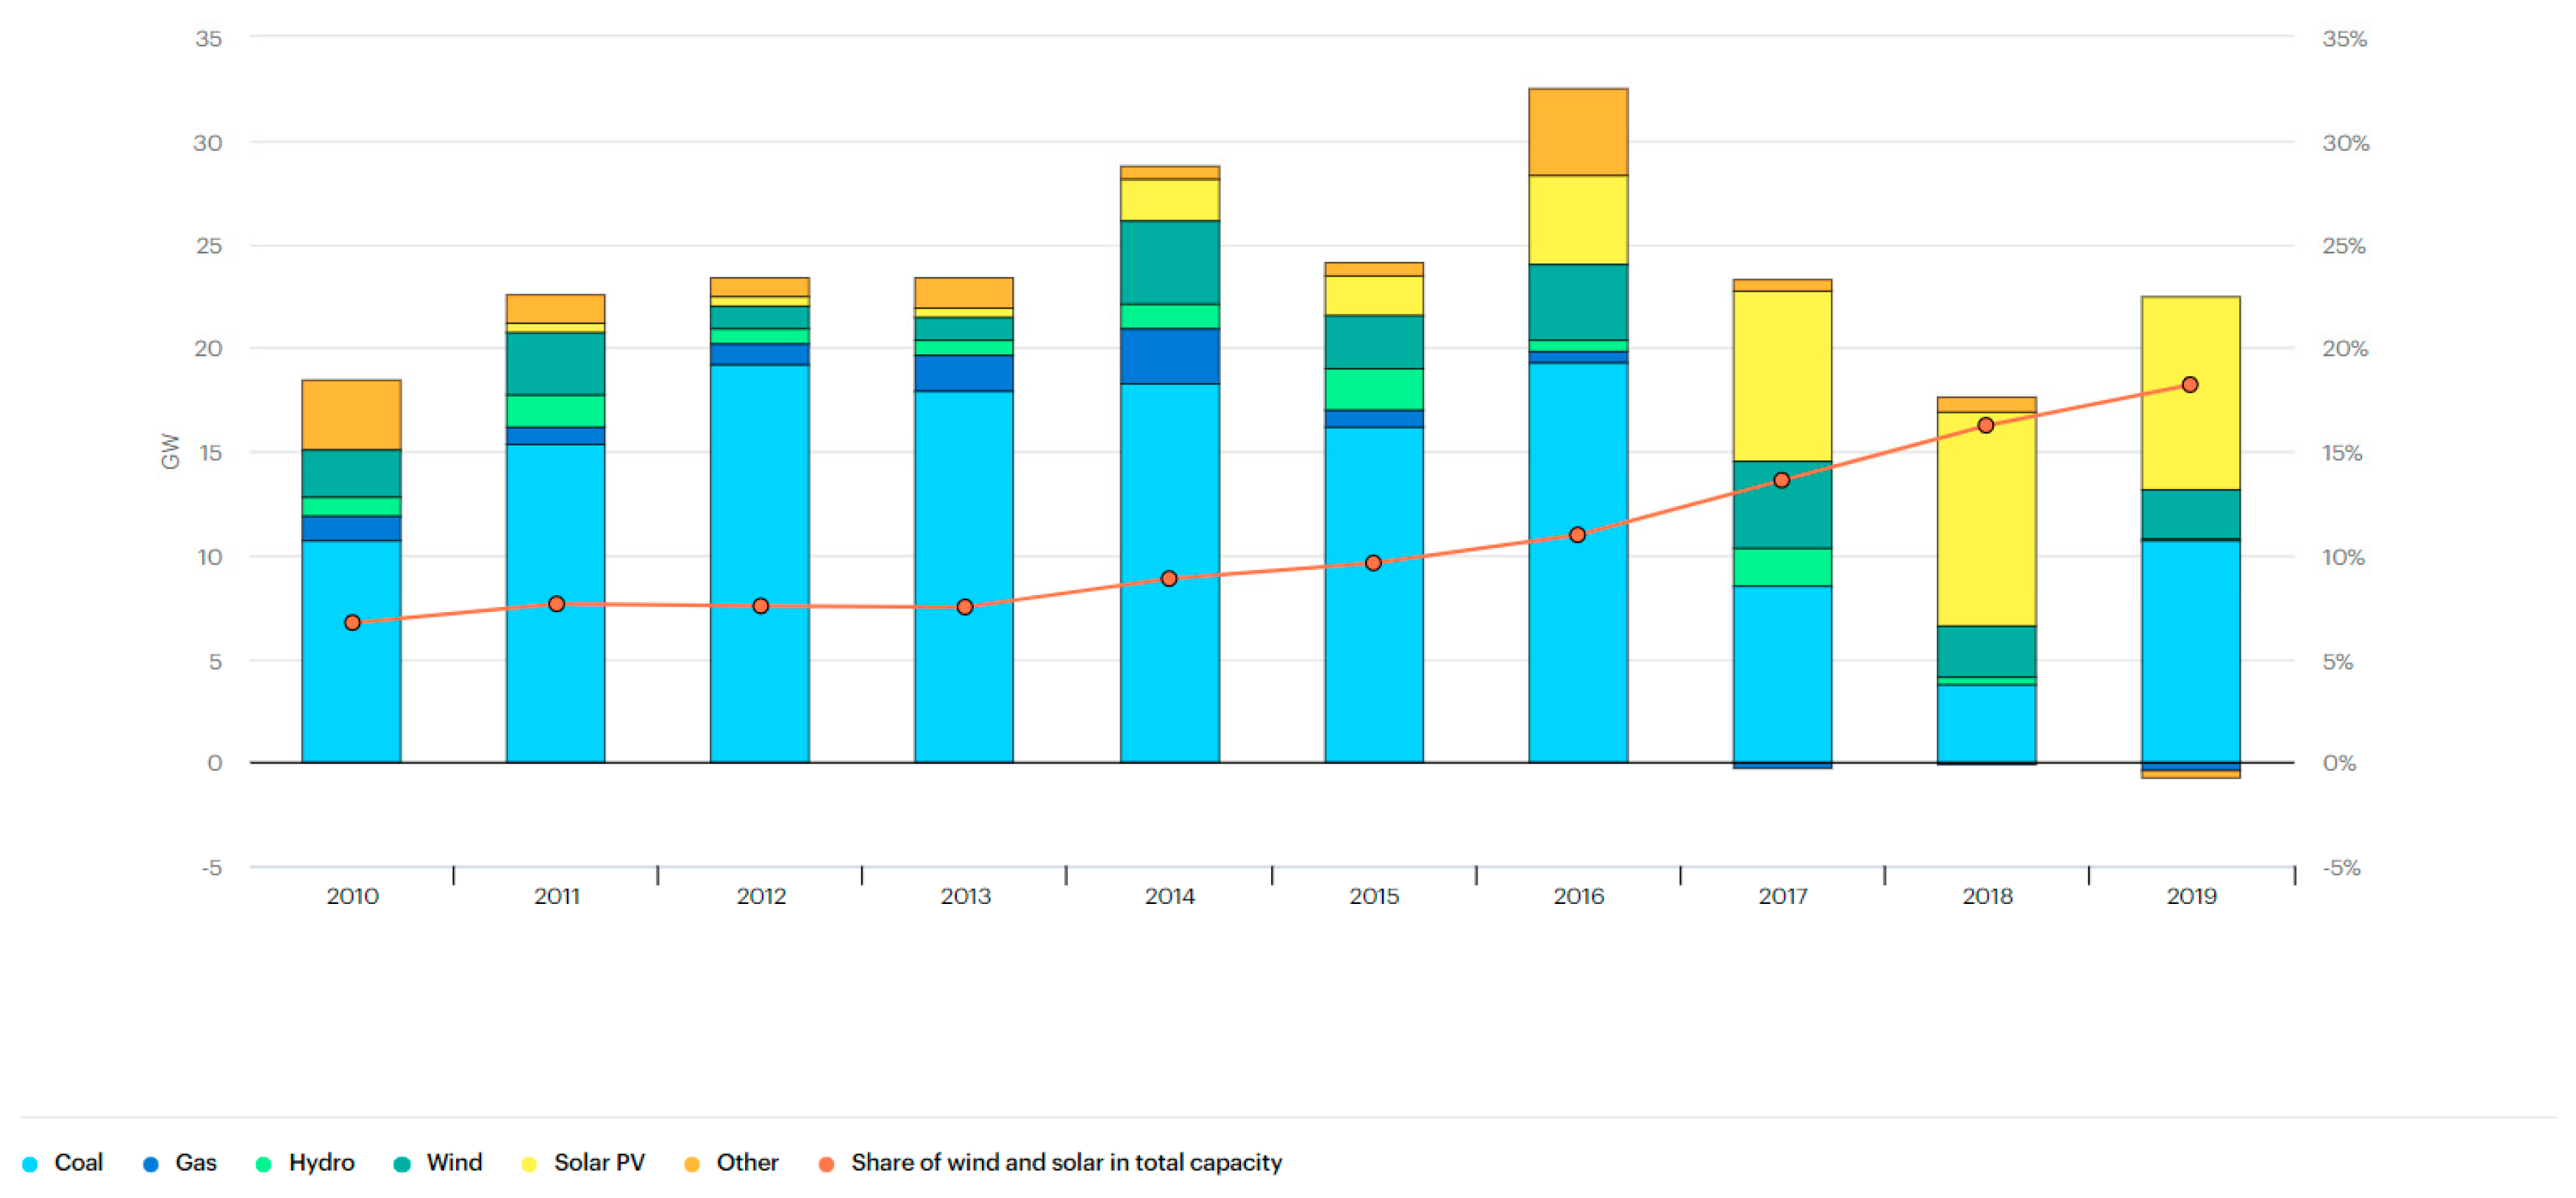
3.3. Power Sector and Electricity Generation Trends in India and the World
3.4. Projected Changes in Weather Conditions from 2020–2100
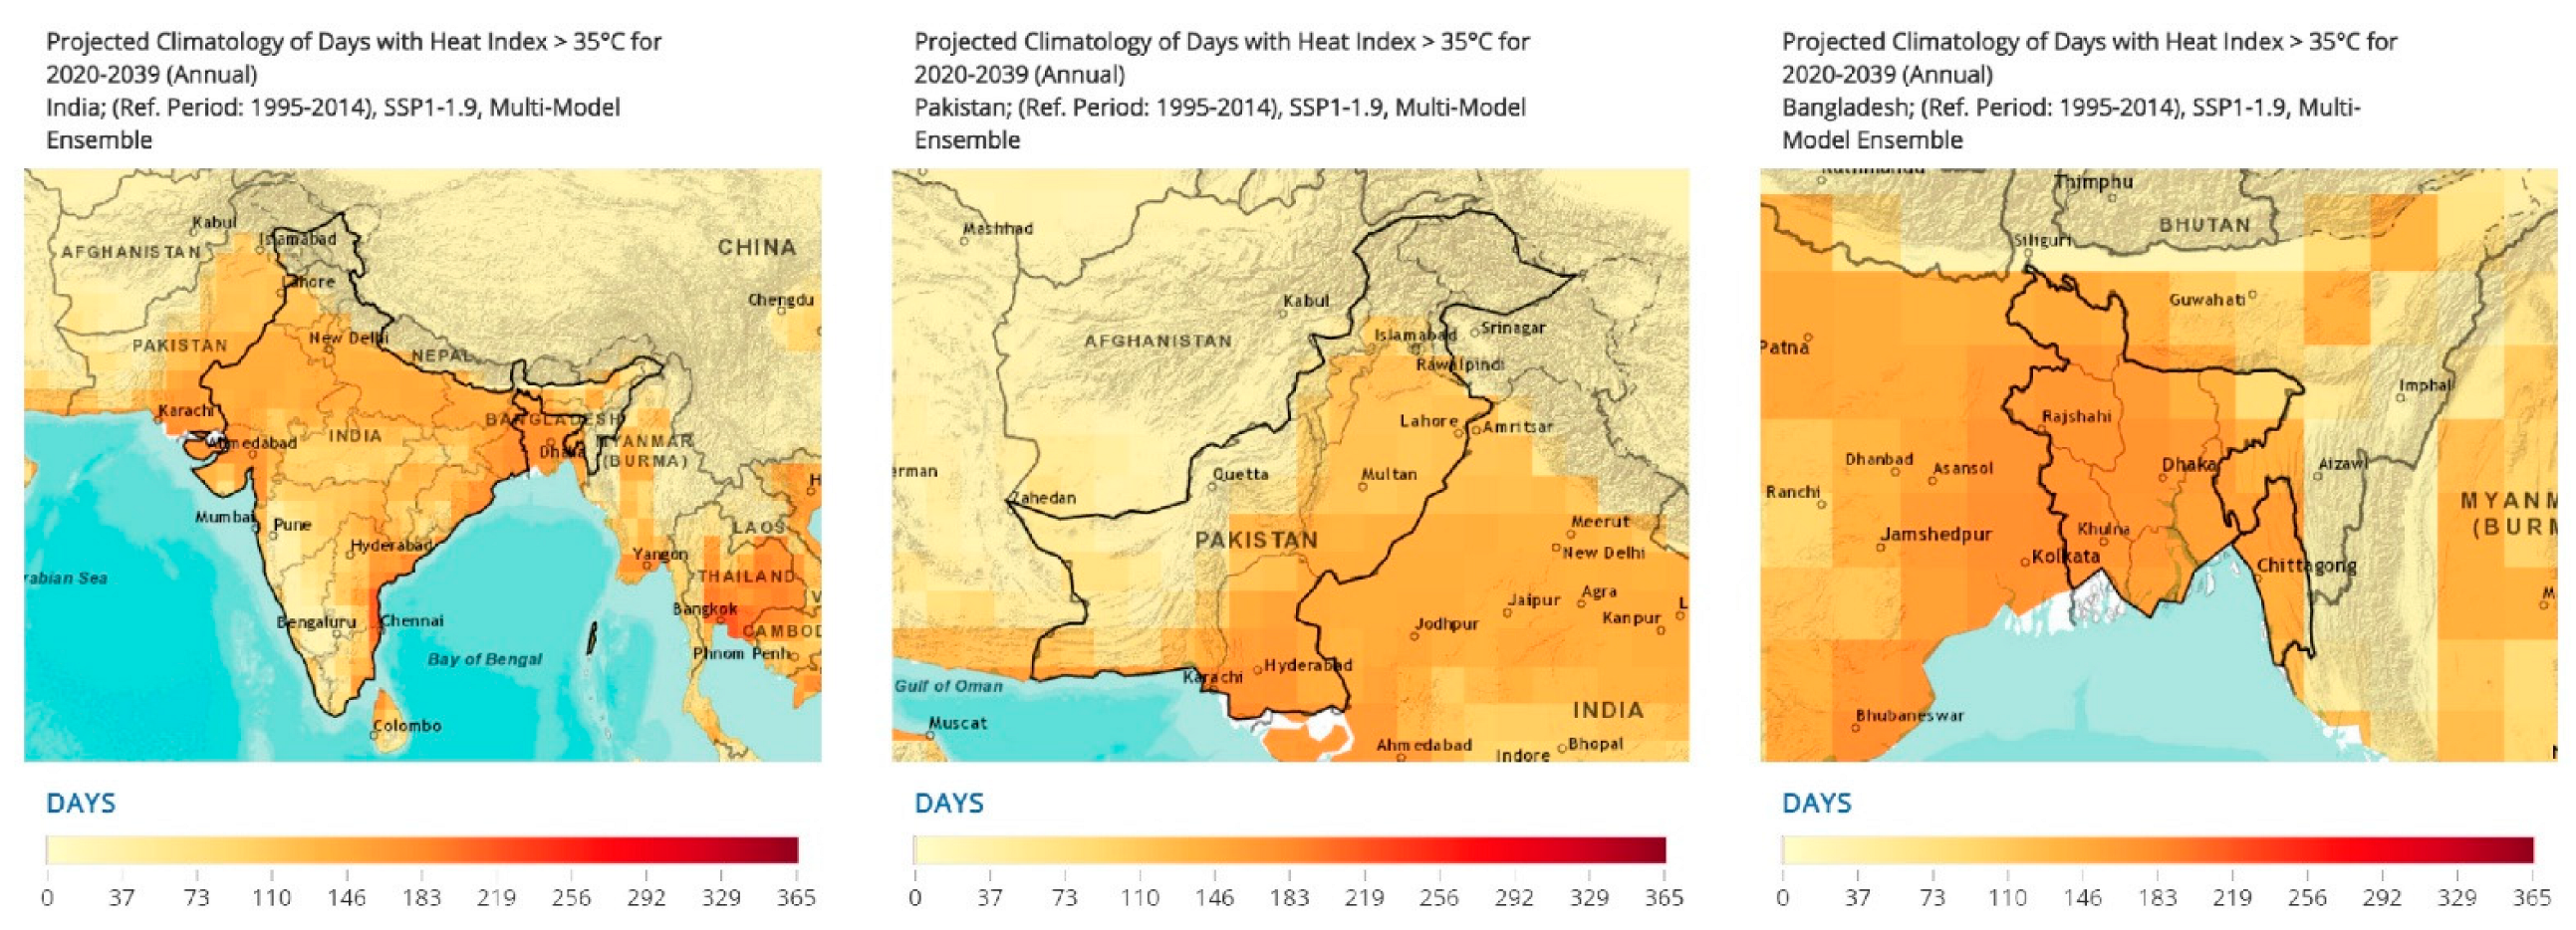
3.4.1. Heat Index Surpassing 35 °C Projections
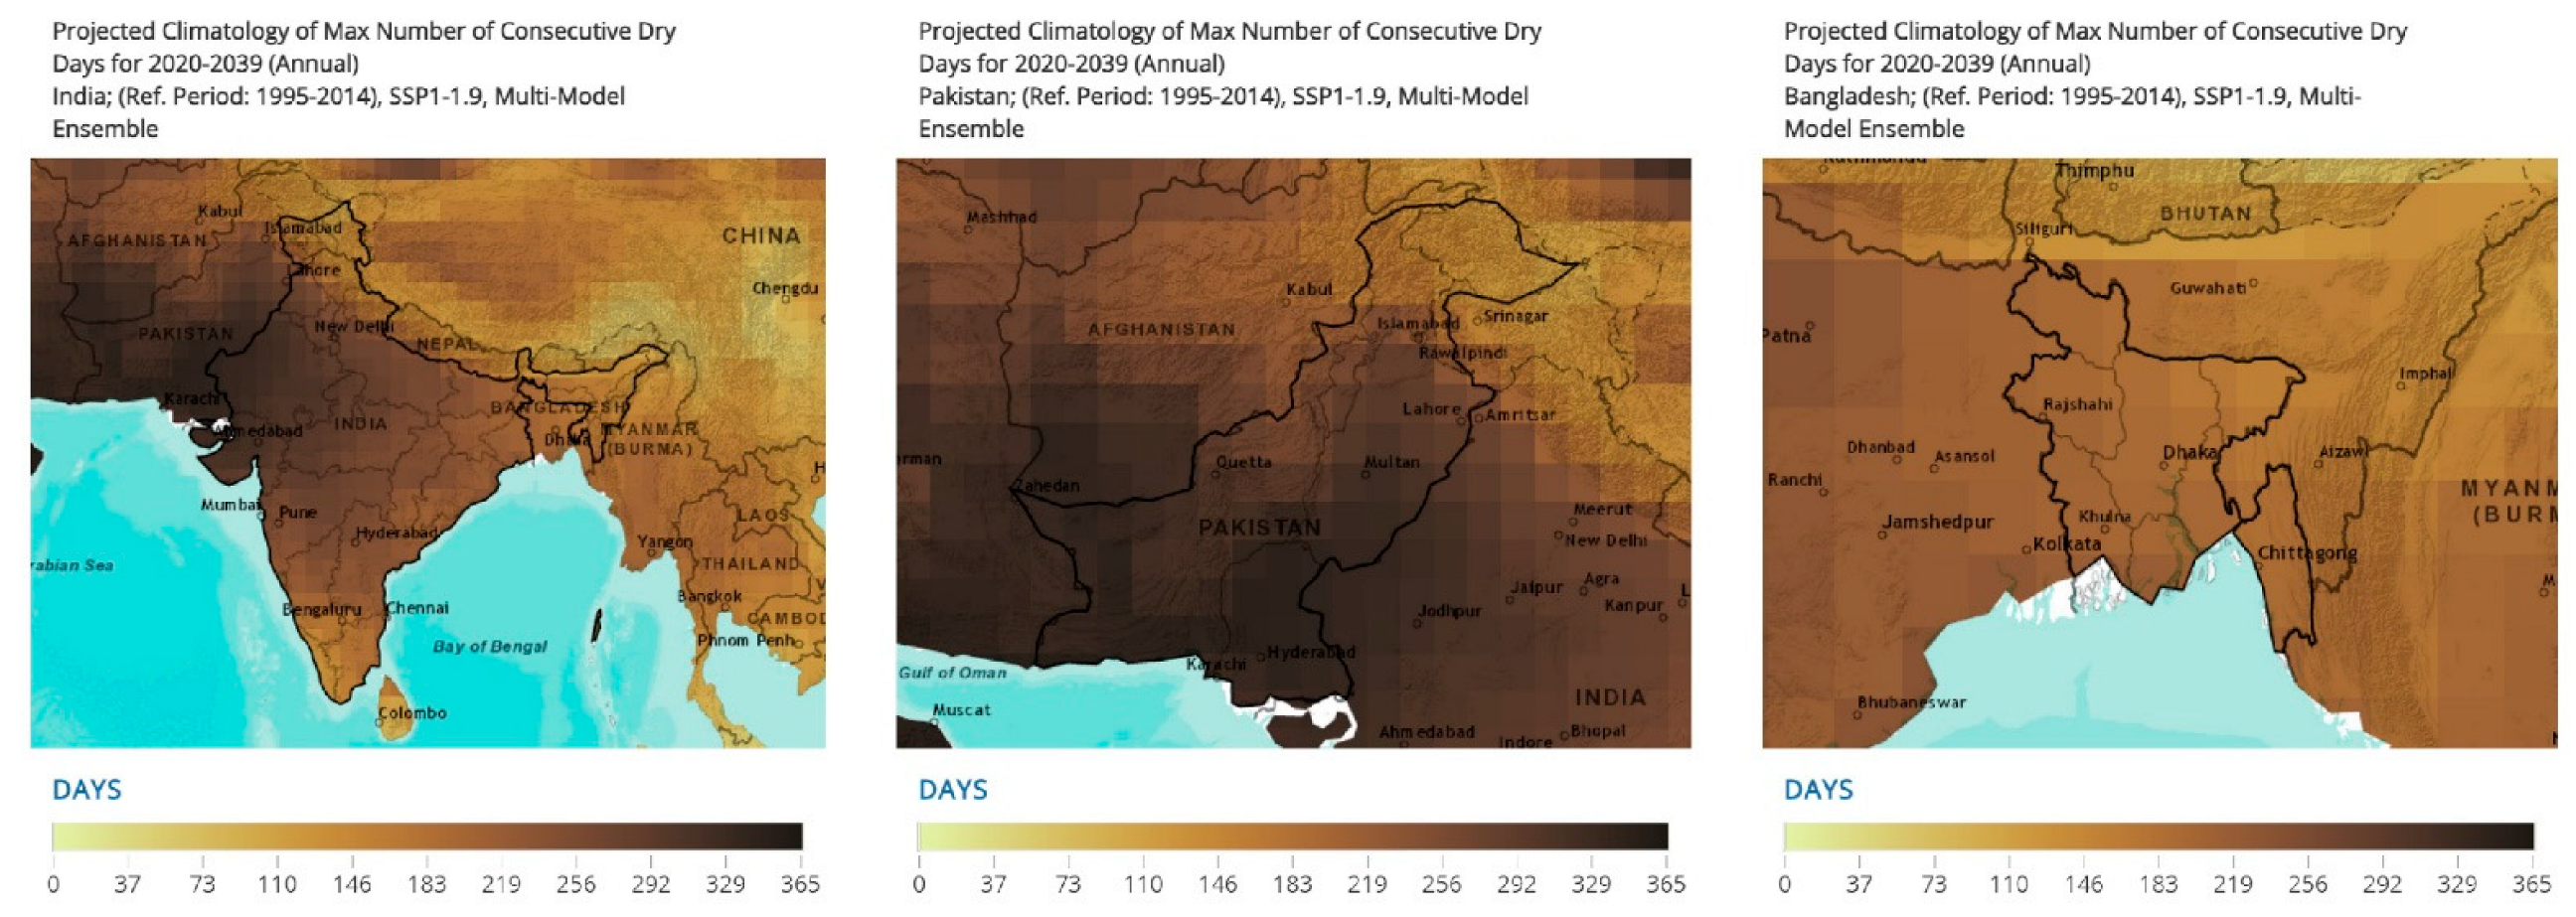
3.4.2. Consecutive Dry Days Projections
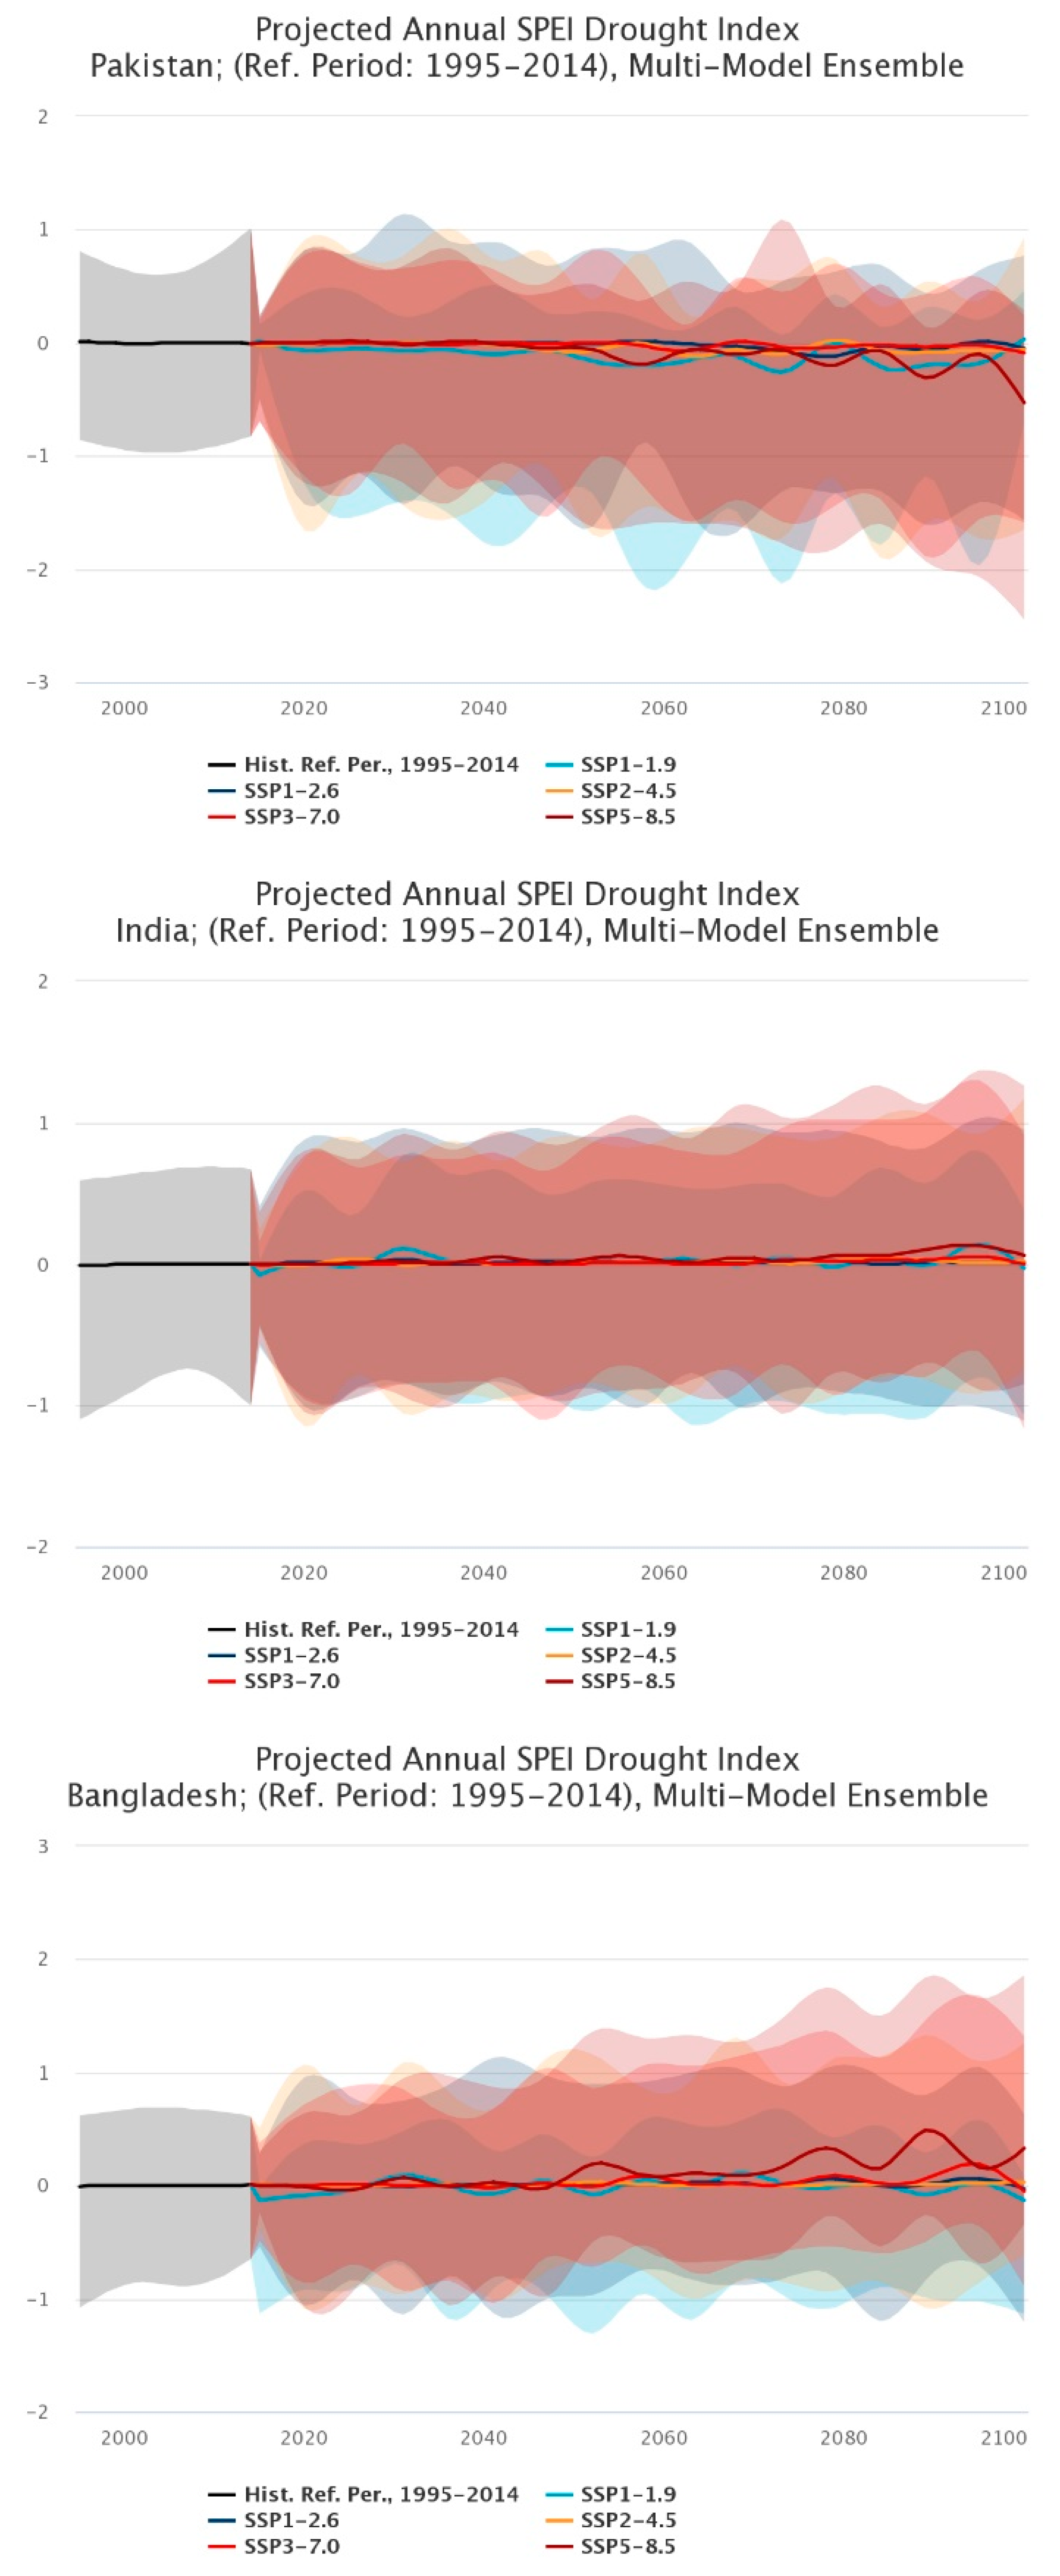
3.4.3. Projected Annual SPEI Drought Index until the Year 2100
4. Discussion
Recommendations
5. Conclusions
Author Contributions
Funding
Institutional Review Board Statement
Informed Consent Statement
Data Availability Statement
Conflicts of Interest
References
- The World Bank Climate and Development in South Asia. Available online: https://www.worldbank.org/en/region/sar/brief/integrating-climate-and-development-in-south-asia/integrating-climate-and-development-in-south-asia-region (accessed on 10 November 2022).
- World Bank Group Warming Climate to Hit South Asia Hard with Extreme Heat, Floods & Disease, World Bank Report Says. Available online: https://www.worldbank.org/en/news/press-release/2013/06/19/nepal-warming-climate-to-hit-south-asia-hard-with-extreme-heat-floods-disease-world-bank-report-says (accessed on 10 November 2022).
- World Bank Group Warmer World Threatens Livelihoods in South East Asia. Available online: https://www.worldbank.org/en/news/press-release/2013/06/19/warmer-world-threatens-livelihoods-in-south-east-asia (accessed on 10 November 2022).
- World Bank Group Infographic: What Climate Change Means for Africa and Asia. Available online: https://www.worldbank.org/en/news/feature/2013/06/19/Infographic-Climate-Change-in-Sub-Saharan-Africa-South-Asia-South-East-Asia (accessed on 10 November 2022).
- World Bank Group India: Climate Change Impacts. Available online: https://www.worldbank.org/en/news/feature/2013/06/19/india-climate-change-impacts (accessed on 10 November 2022).
- The World Bank Pakistan: Flood Damages and Economic Losses Over USD 30 Billion and Reconstruction Needs Over USD 16 Billion-New Assessment. Available online: https://www.worldbank.org/en/news/press-release/2022/10/28/pakistan-flood-damages-and-economic-losses-over-usd-30-billion-and-reconstruction-needs-over-usd-16-billion-new-assessme (accessed on 10 November 2022).
- Shahzad, A. Pakistan out of Money for Flood Recovery, UN Boosts Aid Request- Minister. Available online: https://www.reuters.com/world/asia-pacific/pakistan-says-no-space-give-economy-any-stimulus-2022-10-04/?UTM_CAMPAIGN=Big_Moments&UTM_SOURCE=Google&UTM_MEDIUM=Sponsored (accessed on 10 November 2022).
- NDTV News Desk Maharashtra, Telangana On Flood Watch After Monsoon Fury: 10 Facts. Available online: https://www.ndtv.com/india-news/monsoon-fury-prompts-flood-alert-in-several-states-10-facts-3143981 (accessed on 11 November 2022).
- Sajwan, R. Monsoon 2022: Why a Drought Wasn’t Declared in 4 States with Drought-Like Conditions. Available online: https://www.downtoearth.org.in/news/agriculture/monsoon-2022-why-a-drought-wasn-t-declared-in-4-states-with-drought-like-conditions-84881 (accessed on 11 November 2022).
- Sarkar, S. Pakistan Floods Pose Serious Health Challenges. BMJ 2022, 378, o2141. [Google Scholar] [CrossRef]
- World Weather Atribution Climate Change Likely Increased Extreme Monsoon Rainfall, Flooding Highly Vulnerable Communities in Pakistan–World Weather Attribution. Available online: https://www.worldweatherattribution.org/climate-change-likely-increased-extreme-monsoon-rainfall-flooding-highly-vulnerable-communities-in-pakistan/ (accessed on 11 November 2022).
- Abdul Jabbar, S.; Tul Qadar, L.; Ghafoor, S.; Rasheed, L.; Sarfraz, Z.; Sarfraz, A.; Sarfraz, M.; Felix, M.; Cherrez-Ojeda, I. Air Quality, Pollution and Sustainability Trends in South Asia: A Population-Based Study. Int. J. Environ. Res. Public Health 2022, 19, 7534. [Google Scholar] [CrossRef] [PubMed]
- Tollefson, J. Climate Change Is Hitting the Planet Faster than Scientists Originally Thought. Nature 2022. [Google Scholar] [CrossRef]
- Butt, A. It’s Time for South Asia to Talk Climate. Available online: https://www.usip.org/publications/2022/10/its-time-south-asia-talk-climate (accessed on 10 November 2022).
- Haider, E. South Asia’s Climate Crisis: Policymakers Need to Feel the Heat. Available online: https://www.atlanticcouncil.org/blogs/southasiasource/south-asias-climate-crisis-policymakers-need-to-feel-the-heat/ (accessed on 11 November 2022).
- Prakash, A. The Impact of Climate Change in Southeast Asia. Available online: https://www.imf.org/en/Publications/fandd/issues/2018/09/southeast-asia-climate-change-and-greenhouse-gas-emissions-prakash (accessed on 11 November 2022).
- Malhi, G.S.; Kaur, M.; Kaushik, P. Impact of Climate Change on Agriculture and Its Mitigation Strategies: A Review. Sustainability 2021, 13, 1318. [Google Scholar] [CrossRef]
- Mufson, S.; Kaplan, S. Nations ‘Nowhere near’ Emissions Cuts Needed to Avoid Climate Disaster, U.N. Says. Available online: https://www.washingtonpost.com/climate-environment/2022/10/26/united-nations-climate-pledges-report/ (accessed on 11 November 2022).
- Arnold, C. Death by Climate Change. Nat. Clim. Chang. 2022, 12, 607–609. [Google Scholar] [CrossRef]
- Romanello, M.; Di Napoli, C.; Drummond, P.; Green, C.; Kennard, H.; Lampard, P.; Scamman, D.; Arnell, N.; Ayeb-Karlsson, S.; Ford, L.B. The 2022 Report of the Lancet Countdown on Health and Climate Change: Health at the Mercy of Fossil Fuels. Lancet 2022, 400, 1619–1654. [Google Scholar] [CrossRef] [PubMed]
- Clarke, B.; Otto, F.; Stuart-Smith, R.; Harrington, L. Extreme Weather Impacts of Climate Change: An Attribution Perspective. Environ. Res. Clim. 2022, 1, 12001. [Google Scholar] [CrossRef]
- World Meteorological Organization Climate Change Made Heatwaves in India and Pakistan “30 Times More Likely”. Available online: https://public.wmo.int/en/media/news/climate-change-made-heatwaves-india-and-pakistan-30-times-more-likely (accessed on 11 November 2022).
- Iqbal, A. Pakistan, India and Bangladesh to See 20pc Rise in Surface Ozone Levels. Available online: https://www.dawn.com/news/1709019 (accessed on 10 November 2022).
- Sultan, H.; Zhan, J.; Rashid, W.; Chu, X.; Bohnett, E. Systematic Review of Multi-Dimensional Vulnerabilities in the Himalayas. Int. J. Environ. Res. Public Health 2022, 19, 12177. [Google Scholar] [CrossRef]
- Berglee, R. World Regional Geography: People, Places and Globalization; FlatWorld: Boston, MA, USA, 2012; ISBN 1453323368. [Google Scholar]
- Hasnat, G.N.T.; Kabir, M.A.; Hossain, M.A. Major Environmental Issues and Problems of South Asia, Particularly Bangladesh. Handb. Environ. Mater. Manag. 2018, 1–40. [Google Scholar]
- Barkat, A.; Ali, A.; Hayat, U.; Crowley, Q.G.; Rehman, K.; Siddique, N.; Haidar, T.; Iqbal, T. Time Series Analysis of Soil Radon in Northern Pakistan: Implications for Earthquake Forecasting. Appl. Geochem. 2018, 97, 197–208. [Google Scholar] [CrossRef]
- Rashid, M.B.; Ahsan, K.; Majlis, A.B.K.; Ahsan, M.K.; Mahmud, A. Sedimentation and Coastal Area Management in the Human-Modified Ganges–Brahmaputra Tidal Delta Plain of Bangladesh. Int. J. River Basin Manag. 2022, 1–13. [Google Scholar] [CrossRef]
- Whitehead, P.G. Biophysical Modelling of the Ganges, Brahmaputra, and Meghna Catchment. In Ecosystem Services for Well-Being in Deltas; Palgrave Macmillan: Cham, Switzerland, 2018; pp. 249–262. [Google Scholar]
- Bianchi, E.; Malki-Epshtein, L. Evaluating the Risk to Bangladeshi Coastal Infrastructure from Tropical Cyclones under Climate Change. Int. J. Disaster Risk Reduct. 2021, 57, 102147. [Google Scholar] [CrossRef]
- Oberschelp, C.; Pfister, S.; Raptis, C.E.; Hellweg, S. Global Emission Hotspots of Coal Power Generation. Nat. Sustain. 2019, 2, 113–121. [Google Scholar] [CrossRef]
- Giang, A.; Stokes, L.C.; Streets, D.G.; Corbitt, E.S.; Selin, N.E. Impacts of the Minamata Convention on Mercury Emissions and Global Deposition from Coal-Fired Power Generation in Asia. Environ. Sci. Technol. 2015, 49, 5326–5335. [Google Scholar] [CrossRef]
- Syed, A.; Liu, X.; Moniruzzaman, M.; Rousta, I.; Syed, W.; Zhang, J.; Olafsson, H. Assessment of Climate Variability among Seasonal Trends Using in Situ Measurements: A Case Study of Punjab, Pakistan. Atmosphere 2021, 12, 939. [Google Scholar] [CrossRef]
- Javid, K.; Akram, M.; Mumtaz, M.; Siddiqui, R. Modeling and Mapping of Climatic Classification of Pakistan by Using Remote Sensing Climate Compound Index (2000 to 2018). Appl. Water Sci. 2019, 9, 1–9. [Google Scholar] [CrossRef]
- Ali, G.; Sajjad, M.; Kanwal, S.; Xiao, T.; Khalid, S.; Shoaib, F.; Gul, H.N. Spatial–Temporal Characterization of Rainfall in Pakistan during the Past Half-Century (1961–2020). Sci. Rep. 2021, 11, 6935. [Google Scholar] [CrossRef]
- Hussain, S.; Qin, S.; Nasim, W.; Bukhari, M.A.; Mubeen, M.; Fahad, S.; Raza, A.; Abdo, H.G.; Tariq, A.; Mousa, B.G. Monitoring the Dynamic Changes in Vegetation Cover Using Spatio-Temporal Remote Sensing Data from 1984 to 2020. Atmosphere 2022, 13, 1609. [Google Scholar] [CrossRef]
- Dilawar, A.; Chen, B.; Ashraf, A.; Alphonse, K.; Hussain, Y.; Ali, S.; Jinghong, J.; Shafeeque, M.; Boyang, S.; Sun, X. Development of a GIS Based Hazard, Exposure, and Vulnerability Analyzing Method for Monitoring Drought Risk at Karachi, Pakistan. Geomatics, Nat. Hazards Risk 2022, 13, 1700–1720. [Google Scholar] [CrossRef]
- Salman, H.M.; Syed, J.; Riaz, A.; Sarfraz, Z.; Sarfraz, A.; Bokhari, S.H.A.A.; Ojeda, I.C. An Epidemiological, Strategic and Response Analysis of the COVID-19 Pandemic in South Asia: A Population-Based Observational Study. BMC Public Health 2022, 22, 457. [Google Scholar] [CrossRef]
- Sultan, H.; Rashid, W.; Shi, J.; Rahim, I.; Nafees, M.; Bohnett, E.; Rashid, S.; Khan, M.T.; Shah, I.A.; Han, H. Horizon Scan of Transboundary Concerns Impacting Snow Leopard Landscapes in Asia. Land 2022, 11, 248. [Google Scholar] [CrossRef]
- Li, A.; Deng, W.; Zhao, W.; Liu, B.; Zhang, J.; Kong, B.; Nan, X.; Bian, J.; Koirala, H.L.; Gilani, H. A Geo-Spatial Database about the Eco-Environment and Its Key Issues in South Asia. Big Earth Data 2018, 2, 298–319. [Google Scholar] [CrossRef]
- Noll, K.E.; Miller, T.L.; Norco, J.E.; Raufer, R.K. An Objective Air Monitoring Site Selection Methodology for Large Point Sources. Atmos. Environ. 1977, 11, 1051–1059. [Google Scholar] [CrossRef]
- Myers, D.E. Spatial Interpolation: An Overview. Geoderma 1994, 62, 17–28. [Google Scholar] [CrossRef]
- Ember Open Source Global Electricity Data. Available online: https://ember-climate.org/data/data-explorer/ (accessed on 10 November 2022).
- UKRI GCRF South Asian Nitrogen Hub|South Asian Nitrogen Hub. Available online: https://sanh.inms.international/ (accessed on 15 December 2022).
- Global GIS Database: Digital Atlas of South Asia|Map and Data Library. Available online: https://mdl.library.utoronto.ca/collections/geospatial-data/global-gis-database-digital-atlas-south-asia (accessed on 15 December 2022).
- Global Forest Resources Assessment 2020. 2020. Available online: https://www.fao.org/3/CA8753EN/CA8753EN.pdf (accessed on 11 November 2022).
- IEA. Annual Growth of Renewable Electricity Generation by Region and Technology. 2019. Available online: https://www.iea.org/data-and-statistics/charts/annual-growth-of-renewable-electricity-generation-by-region-and-technology-2019 (accessed on 10 November 2022).
- IEA. Annual Power Sector Capacity Additions in India, 2010–2019. Available online: https://www.iea.org/data-and-statistics/charts/annual-power-sector-capacity-additions-in-india-2010-2019 (accessed on 10 November 2022).
- World Bank Group Climate Change Knowledge Portal. Available online: https://climateknowledgeportal.worldbank.org/ (accessed on 10 November 2022).
- Rehman, A.; Cismas, L.M.; Otil, M.D. Electrical Energy Dilemma and CO2 Emission in Pakistan: Decomposing the Positive and Negative Shocks by Using an Asymmetric Technique. Sustainability 2022, 14, 8957. [Google Scholar] [CrossRef]
- Raza, M.Y.; Lin, B. Analysis of Pakistan’s Electricity Generation and CO2 Emissions: Based on Decomposition and Decoupling Approach. J. Clean. Prod. 2022, 359, 132074. [Google Scholar] [CrossRef]
- Xiuhui, J.; Raza, M.Y. Delving into Pakistan’s Industrial Economy and Carbon Mitigation: An Effort toward Sustainable Development Goals. Energy Strateg. Rev. 2022, 41, 100839. [Google Scholar] [CrossRef]
- Warner, K.J.; Jones, G.A. The 21st Century Coal Question: China, India, Development, and Climate Change. Atmosphere 2019, 10, 476. [Google Scholar] [CrossRef]
- Sahu, S.K.; Ohara, T.; Beig, G. The Role of Coal Technology in Redefining India’s Climate Change Agents and Other Pollutants. Environ. Res. Lett. 2017, 12, 105006. [Google Scholar] [CrossRef]
- Edwards, G.A.S. Coal and Climate Change. Wiley Interdiscip. Rev. Clim. Chang. 2019, 10, e607. [Google Scholar] [CrossRef]
- Chaturvedi, V.; Malyan, A. Implications of a Net-Zero Target for India’s Sectoral Energy Transitions and Climate Policy. Oxford Open Clim. Chang. 2022, 2, kgac001. [Google Scholar] [CrossRef]
- Debnath, K.B.; Mourshed, M. Why Is Bangladesh’s Electricity Generation Heading towards a GHG Emissions-Intensive Future? Carbon Manag. 2022, 13, 216–237. [Google Scholar] [CrossRef]
- Baky, M.A.H.; Rahman, M.M.; Islam, A.K.M.S. Development of Renewable Energy Sector in Bangladesh: Current Status and Future Potentials. Renew. Sustain. Energy Rev. 2017, 73, 1184–1197. [Google Scholar] [CrossRef]
- Islam, A.; Hossain, M.B.; Mondal, M.A.H.; Ahmed, M.T.; Hossain, M.A.; Monir, M.U.; Khan, M.F.H.; Islam, K.; Khandaker, S.; Choudhury, T.R. Energy Challenges for a Clean Environment: Bangladesh’s Experience. Energy Rep. 2021, 7, 3373–3389. [Google Scholar] [CrossRef]
- Vision, M. 2041 a Reality: Perspective Plan of Bangladesh 2021–2041. 2020. Available online: http://oldweb.lged.gov.bd/uploadeddocument/unitpublication/1/1049/vision%202021-2041.pdf (accessed on 11 November 2022).
- Abdulrazak, L.F.; Islam, A.; Hossain, M.B. Towards Energy Sustainability: Bangladesh Perspectives. Energy Strateg. Rev. 2021, 38, 100738. [Google Scholar] [CrossRef]
- Myllyvirta, L. Assessment of the Matarbari Phase II Coal Power Project EIA–Centre for Research on Energy and Clean Air. Available online: https://energyandcleanair.org/assessment-of-matarbari-phase-ii-eia/ (accessed on 11 November 2022).
- Chowdhury, M. Behind Bangladesh’s Carbon Catastrophe. Available online: https://thediplomat.com/2022/06/behind-bangladeshs-carbon-catastrophe/ (accessed on 11 November 2022).
- Mohan, M. Dynamics of Urban Pollution a Curative Strategy Using RS and GIS Techniques: A Case Study of Mega City Delhi. ISRO Rep. 2010, 2, 1274–1283. [Google Scholar]
- Bisht, A.; Gerber, J.-F. Ecological Distribution Conflicts (EDCs) over Mineral Extraction in India: An Overview. Extr. Ind. Soc. 2017, 4, 548–563. [Google Scholar] [CrossRef]
- Gaffney, J.S.; Marley, N.A.; Frederick, J.E. Formation and Effects of Smog. Environ. Ecol. Chem. 2009, 2, 25–51. [Google Scholar]
- Kalivitis, N.; Papatheodorou, S.; Maesano, C.N.; Annesi-Maesano, I. Air Quality and Health Impacts. In Atmospheric Chemistry in the Mediterranean Region; Springer: New York, NY, USA, 2022; pp. 459–486. [Google Scholar]
- Ramachandran, A.; Jain, N.K.; Sharma, S.A.; Pallipad, J. Recent Trends in Tropospheric NO2 over India Observed by SCIAMACHY: Identification of Hot Spots. Atmos. Pollut. Res. 2013, 4, 354–361. [Google Scholar] [CrossRef]
- Pakkattil, A.; Muhsin, M.; Varma, M.K.R. COVID-19 Lockdown: Effects on Selected Volatile Organic Compound (VOC) Emissions over the Major Indian Metro Cities. Urban Clim. 2021, 37, 100838. [Google Scholar] [CrossRef]
- Siddiqui, A.; Halder, S.; Chauhan, P.; Kumar, P. COVID-19 Pandemic and City-Level Nitrogen Dioxide (NO2) Reduction for Urban Centres of India. J. Indian Soc. Remote Sens. 2020, 48, 999–1006. [Google Scholar] [CrossRef]
- Misra, P.; Takigawa, M.; Khatri, P.; Dhaka, S.K.; Dimri, A.P.; Yamaji, K.; Kajino, M.; Takeuchi, W.; Imasu, R.; Nitta, K. Nitrogen Oxides Concentration and Emission Change Detection during COVID-19 Restrictions in North India. Sci. Rep. 2021, 11, 513–525. [Google Scholar] [CrossRef] [PubMed]
- Smith, K.R.; Mehta, S. The Burden of Disease from Indoor Air Pollution in Developing Countries: Comparison of Estimates. Int. J. Hyg. Environ. Health 2003, 206, 279–289. [Google Scholar] [CrossRef] [PubMed]
- Meng, J.; Yang, H.; Yi, K.; Liu, J.; Guan, D.; Liu, Z.; Mi, Z.; Coffman, D.; Wang, X.; Zhong, Q. The Slowdown in Global Air-Pollutant Emission Growth and Driving Factors. One Earth 2019, 1, 138–148. [Google Scholar] [CrossRef]
- Miro, M.E.; Marlier, M.E.; Girven, R. Transboundary Environmental Stressors on India-Pakistan Relations: An Analysis of Shared Air and Water Resources; RAND: Santa Monica, CA, USA, 2019. [Google Scholar]
- SDPI Self-Monitoring and Reporting Tool (SMART). Available online: https://sdpi.org/self-monitoring-and-reporting-tool-smart/project_detail (accessed on 11 November 2022).
- Islam, M.S.; Kieu, E. Tackling Regional Climate Change Impacts and Food Security Issues: A Critical Analysis across ASEAN, PIF, and SAARC. Sustainability 2020, 12, 883. [Google Scholar] [CrossRef]
- Khanal, R.H. Development of Procedures and the Assessment of EBD of Local Levels Due to Major Environmental Risk Factors. 2006. Available online: http://library.nhrc.gov.np:8080/nhrc/handle/123456789/561 (accessed on 11 November 2022).
- Ullah, I.; Saleem, F.; Iyakaremye, V.; Yin, J.; Ma, X.; Syed, S.; Hina, S.; Asfaw, T.G.; Omer, A. Projected Changes in Socioeconomic Exposure to Heatwaves in South Asia under Changing Climate. Earth’s Futur. 2022, 10, e2021EF002240. [Google Scholar] [CrossRef]
- Daron, J.; Soares, M.B.; Janes, T.; Colledge, F.; Srinivasan, G.; Agarwal, A.; Hewitt, C.; Richardson, K.; Nepal, S.; Shrestha, M.S. Advancing Climate Services in South Asia. Clim. Serv. 2022, 26, 100295. [Google Scholar] [CrossRef]
- Enamul Haque, A.K.; Mukhopadhyay, P.; Nepal, M.; Shammin, M.R. Climate Change and Community Resilience: Insights from South Asia; Springer Nature: Berlin, Germany, 2022. [Google Scholar]


Publisher’s Note: MDPI stays neutral with regard to jurisdictional claims in published maps and institutional affiliations. |
© 2022 by the authors. Licensee MDPI, Basel, Switzerland. This article is an open access article distributed under the terms and conditions of the Creative Commons Attribution (CC BY) license (https://creativecommons.org/licenses/by/4.0/).
Share and Cite
Falak, F.; Ayub, F.; Zahid, Z.; Sarfraz, Z.; Sarfraz, A.; Robles-Velasco, K.; Cherrez-Ojeda, I. Indicators of Climate Change, Geospatial and Analytical Mapping of Trends in India, Pakistan and Bangladesh: An Observational Study. Int. J. Environ. Res. Public Health 2022, 19, 17039. https://doi.org/10.3390/ijerph192417039
Falak F, Ayub F, Zahid Z, Sarfraz Z, Sarfraz A, Robles-Velasco K, Cherrez-Ojeda I. Indicators of Climate Change, Geospatial and Analytical Mapping of Trends in India, Pakistan and Bangladesh: An Observational Study. International Journal of Environmental Research and Public Health. 2022; 19(24):17039. https://doi.org/10.3390/ijerph192417039
Chicago/Turabian StyleFalak, Faiqa, Farsom Ayub, Zunaira Zahid, Zouina Sarfraz, Azza Sarfraz, Karla Robles-Velasco, and Ivan Cherrez-Ojeda. 2022. "Indicators of Climate Change, Geospatial and Analytical Mapping of Trends in India, Pakistan and Bangladesh: An Observational Study" International Journal of Environmental Research and Public Health 19, no. 24: 17039. https://doi.org/10.3390/ijerph192417039
APA StyleFalak, F., Ayub, F., Zahid, Z., Sarfraz, Z., Sarfraz, A., Robles-Velasco, K., & Cherrez-Ojeda, I. (2022). Indicators of Climate Change, Geospatial and Analytical Mapping of Trends in India, Pakistan and Bangladesh: An Observational Study. International Journal of Environmental Research and Public Health, 19(24), 17039. https://doi.org/10.3390/ijerph192417039