
Longitudinal Study Comparing Mental Health Outcomes in Frontline Emergency Department Healthcare Workers through the Different Waves of the COVID-19 Pandemic

 ,
,
Abstract
1. Introduction
2. Materials and Methods
2.1. Study Design and Participants
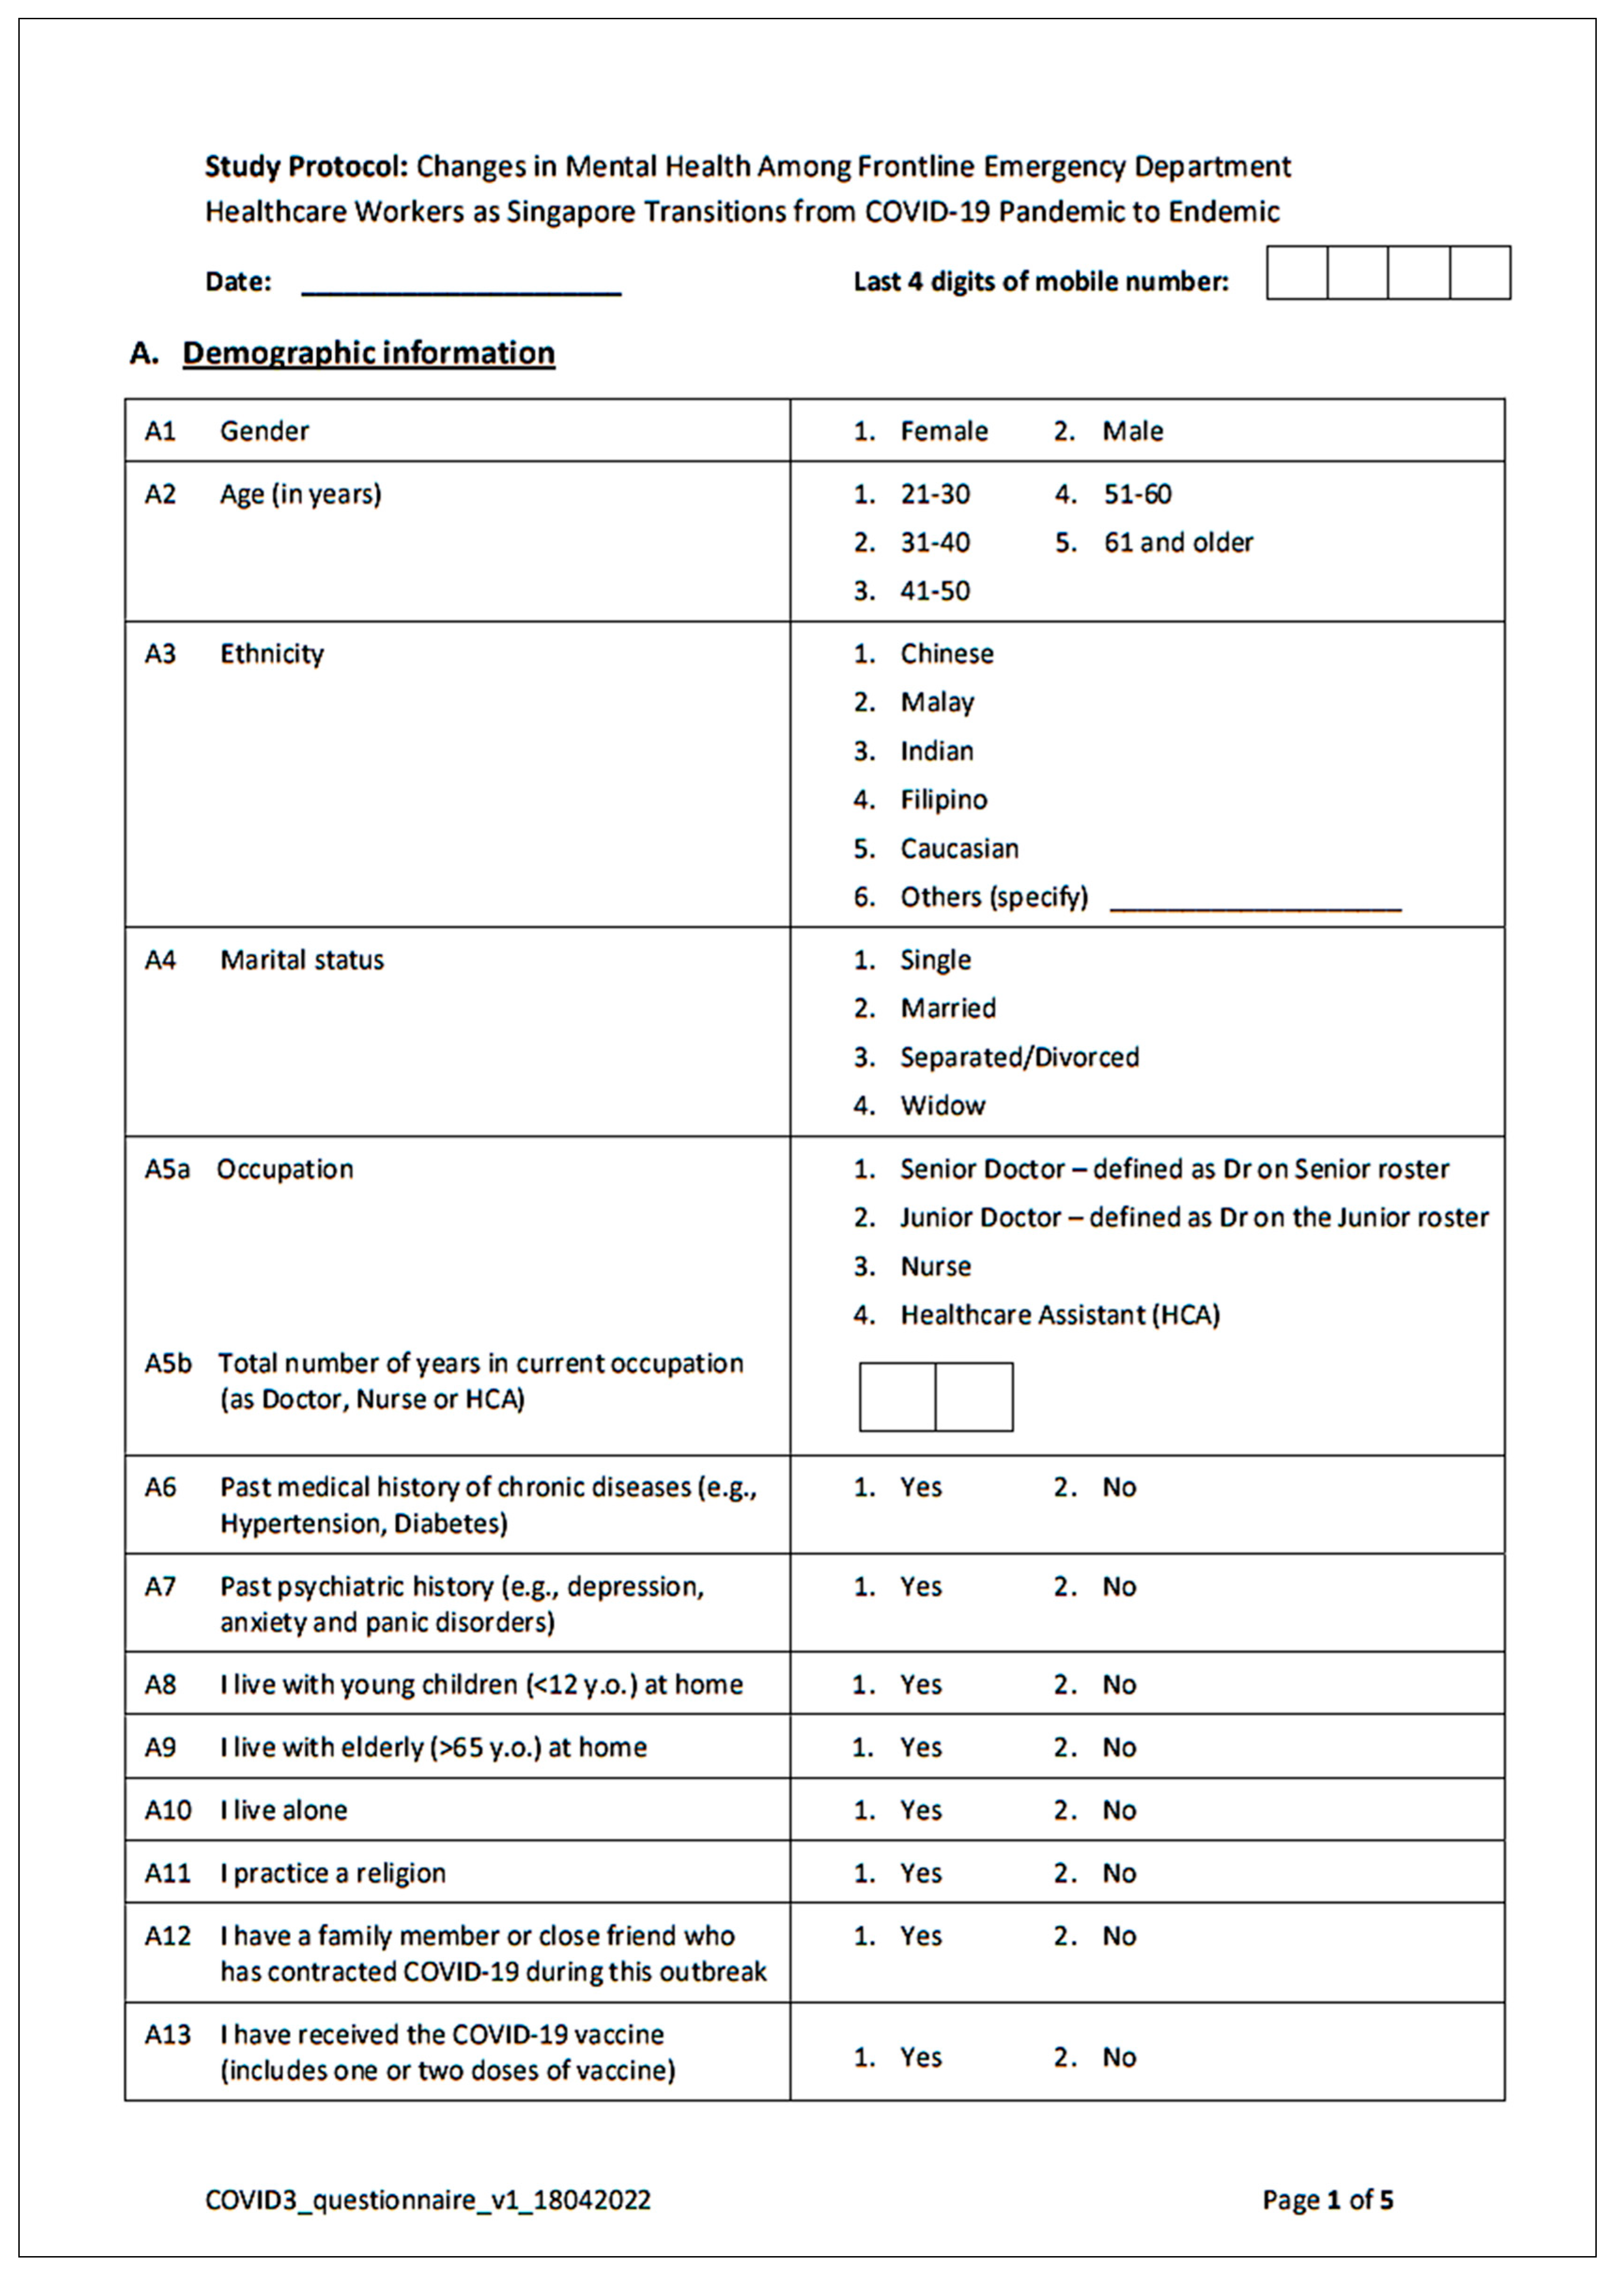
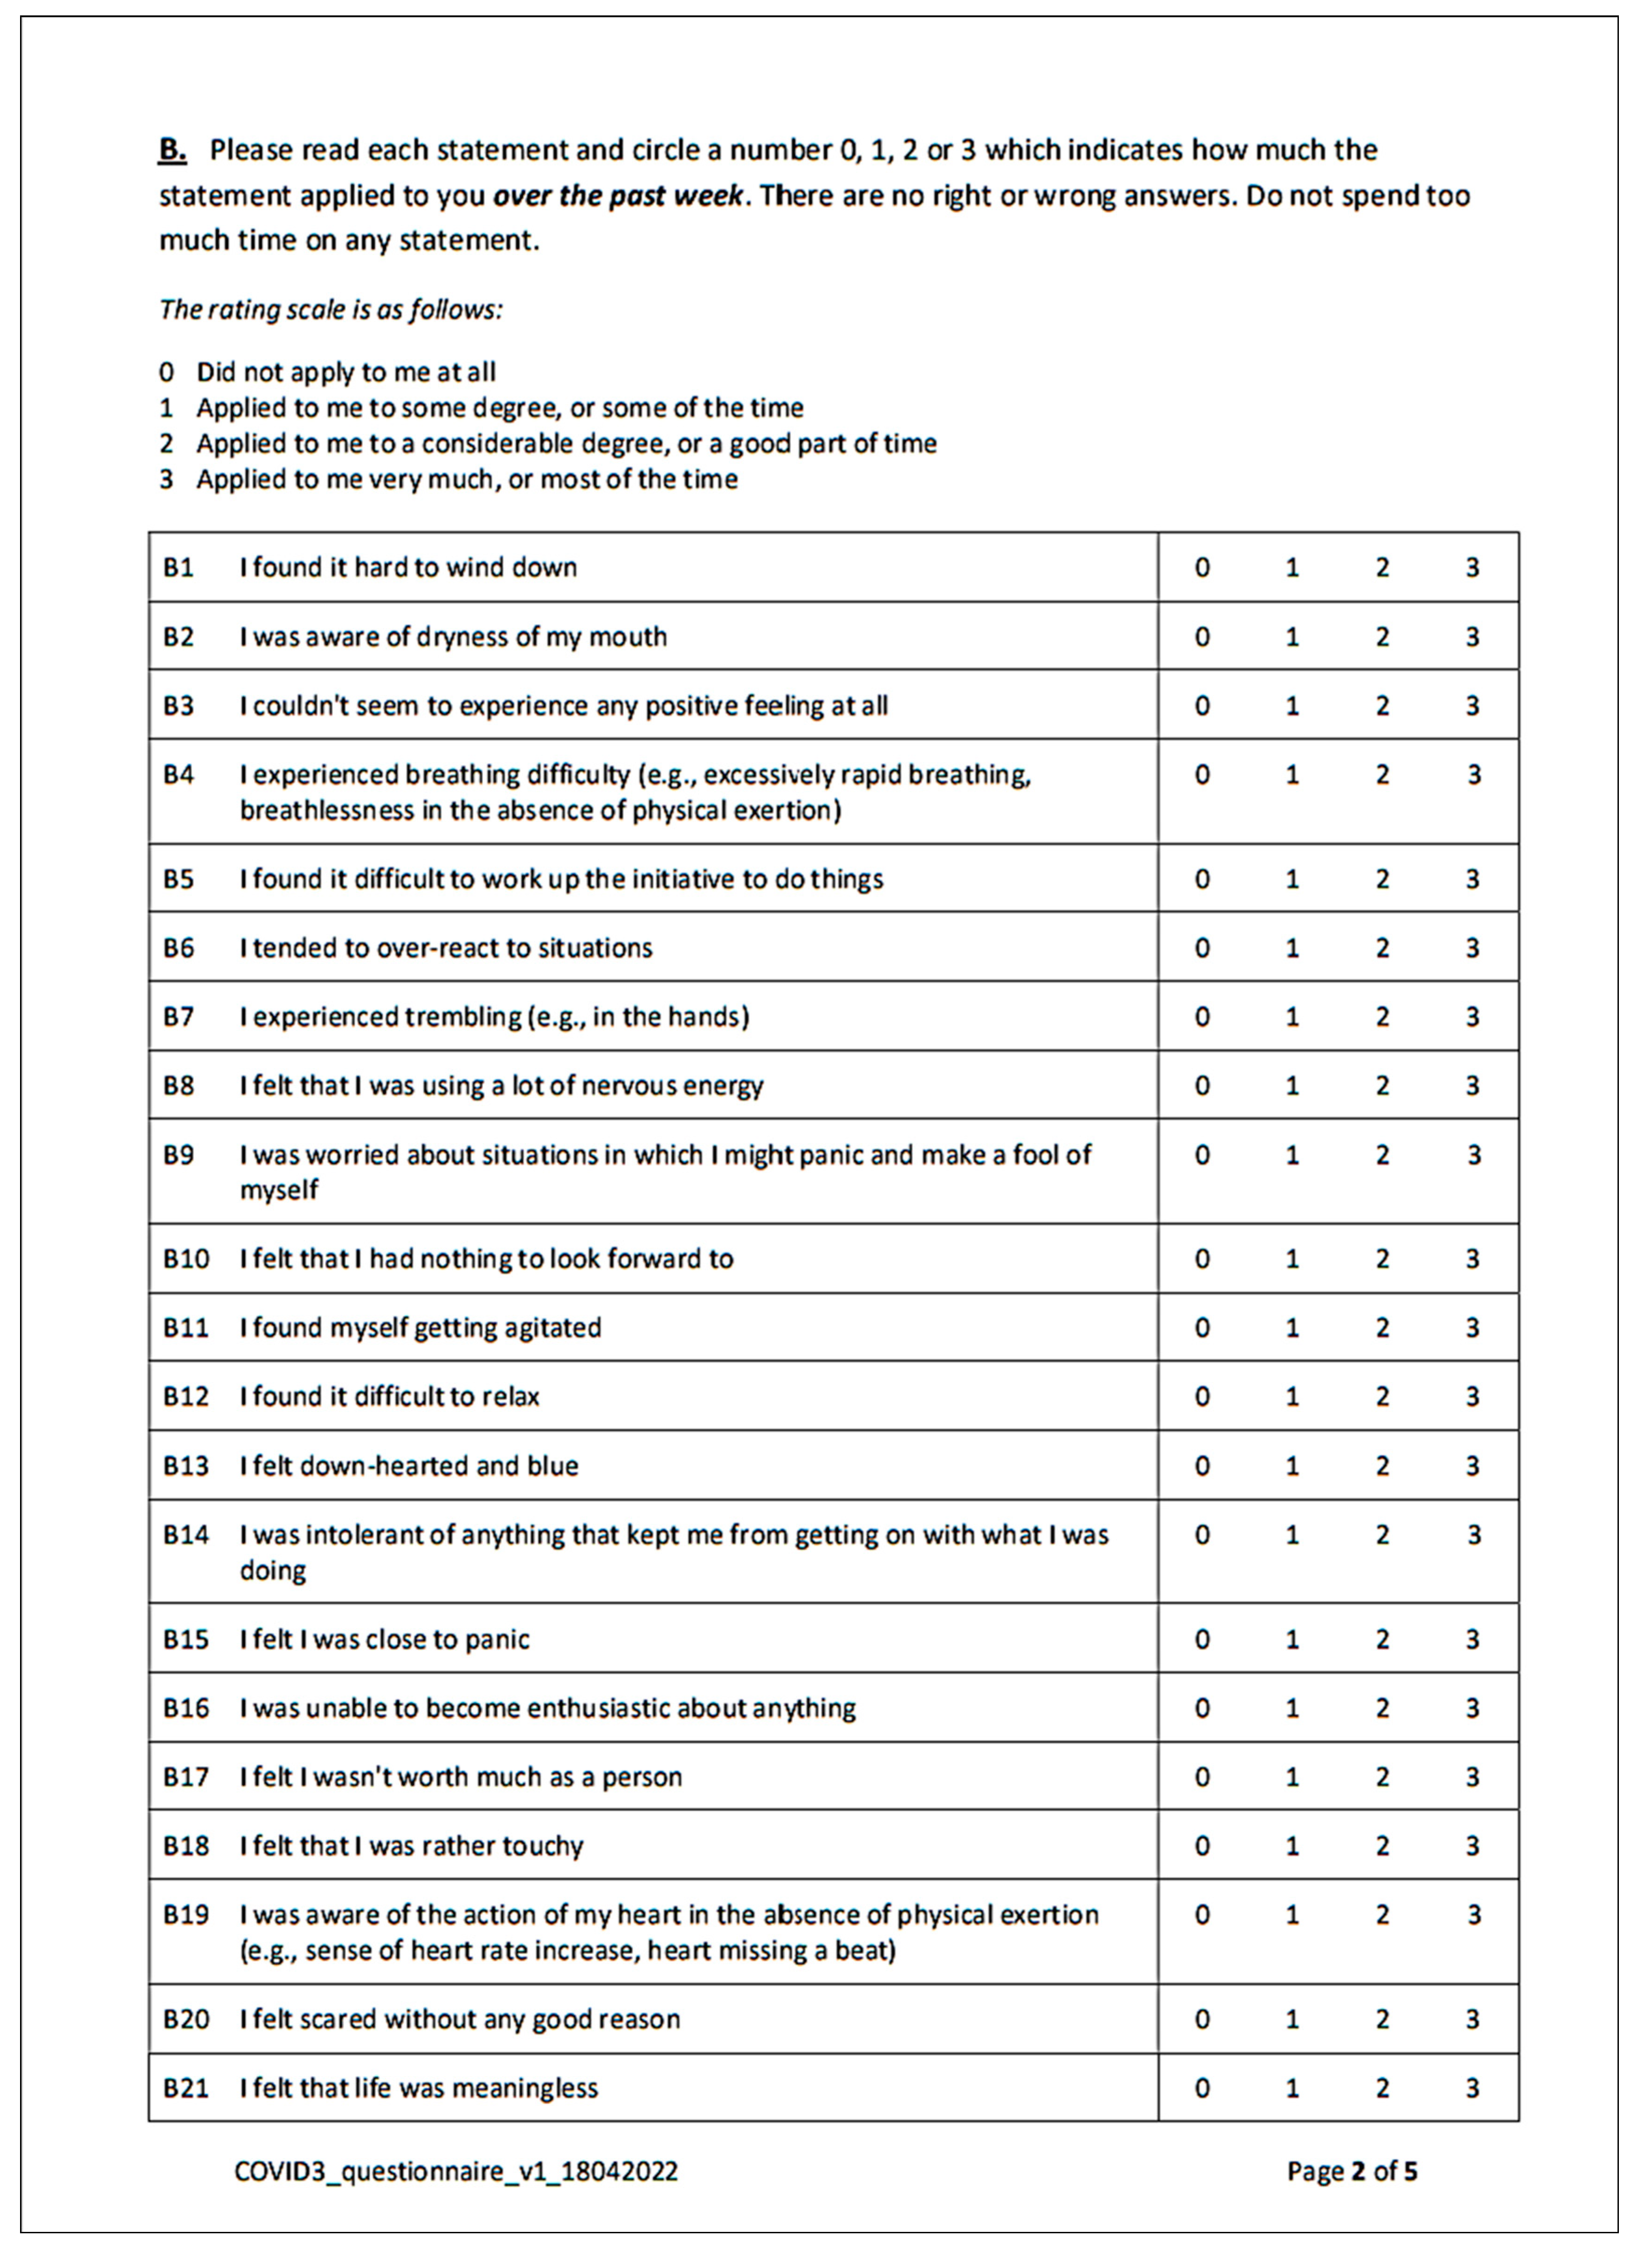
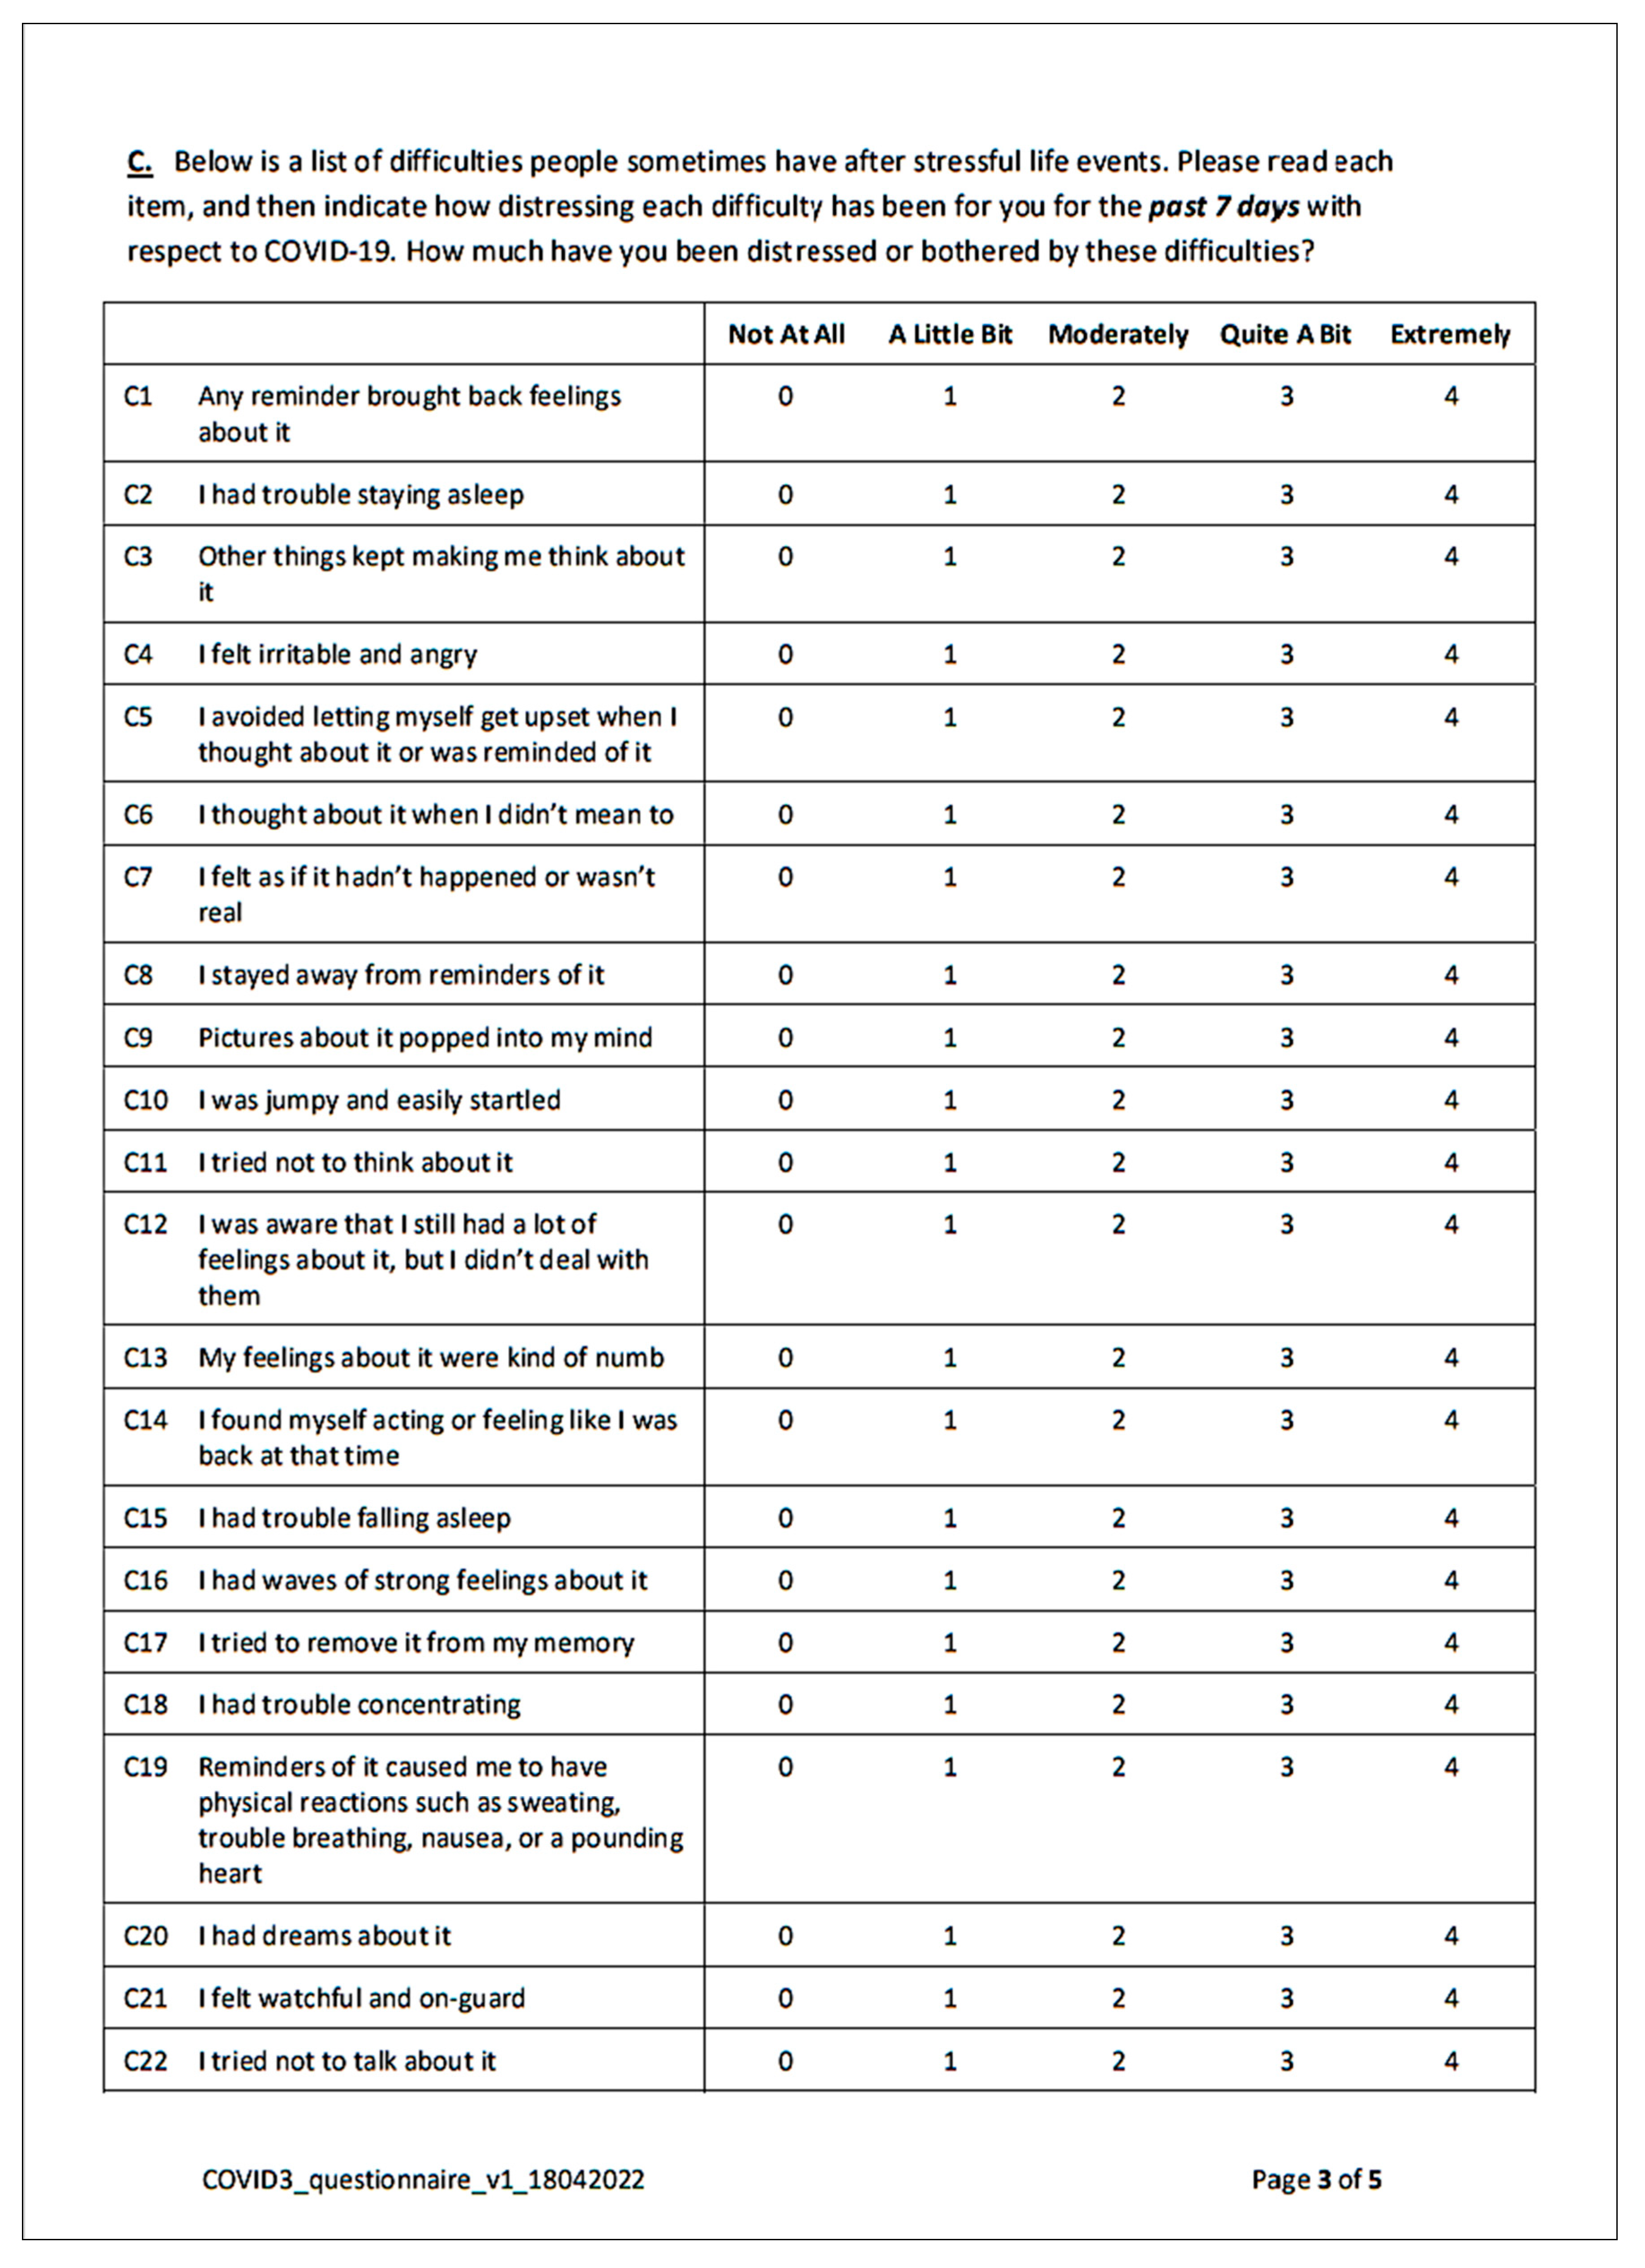
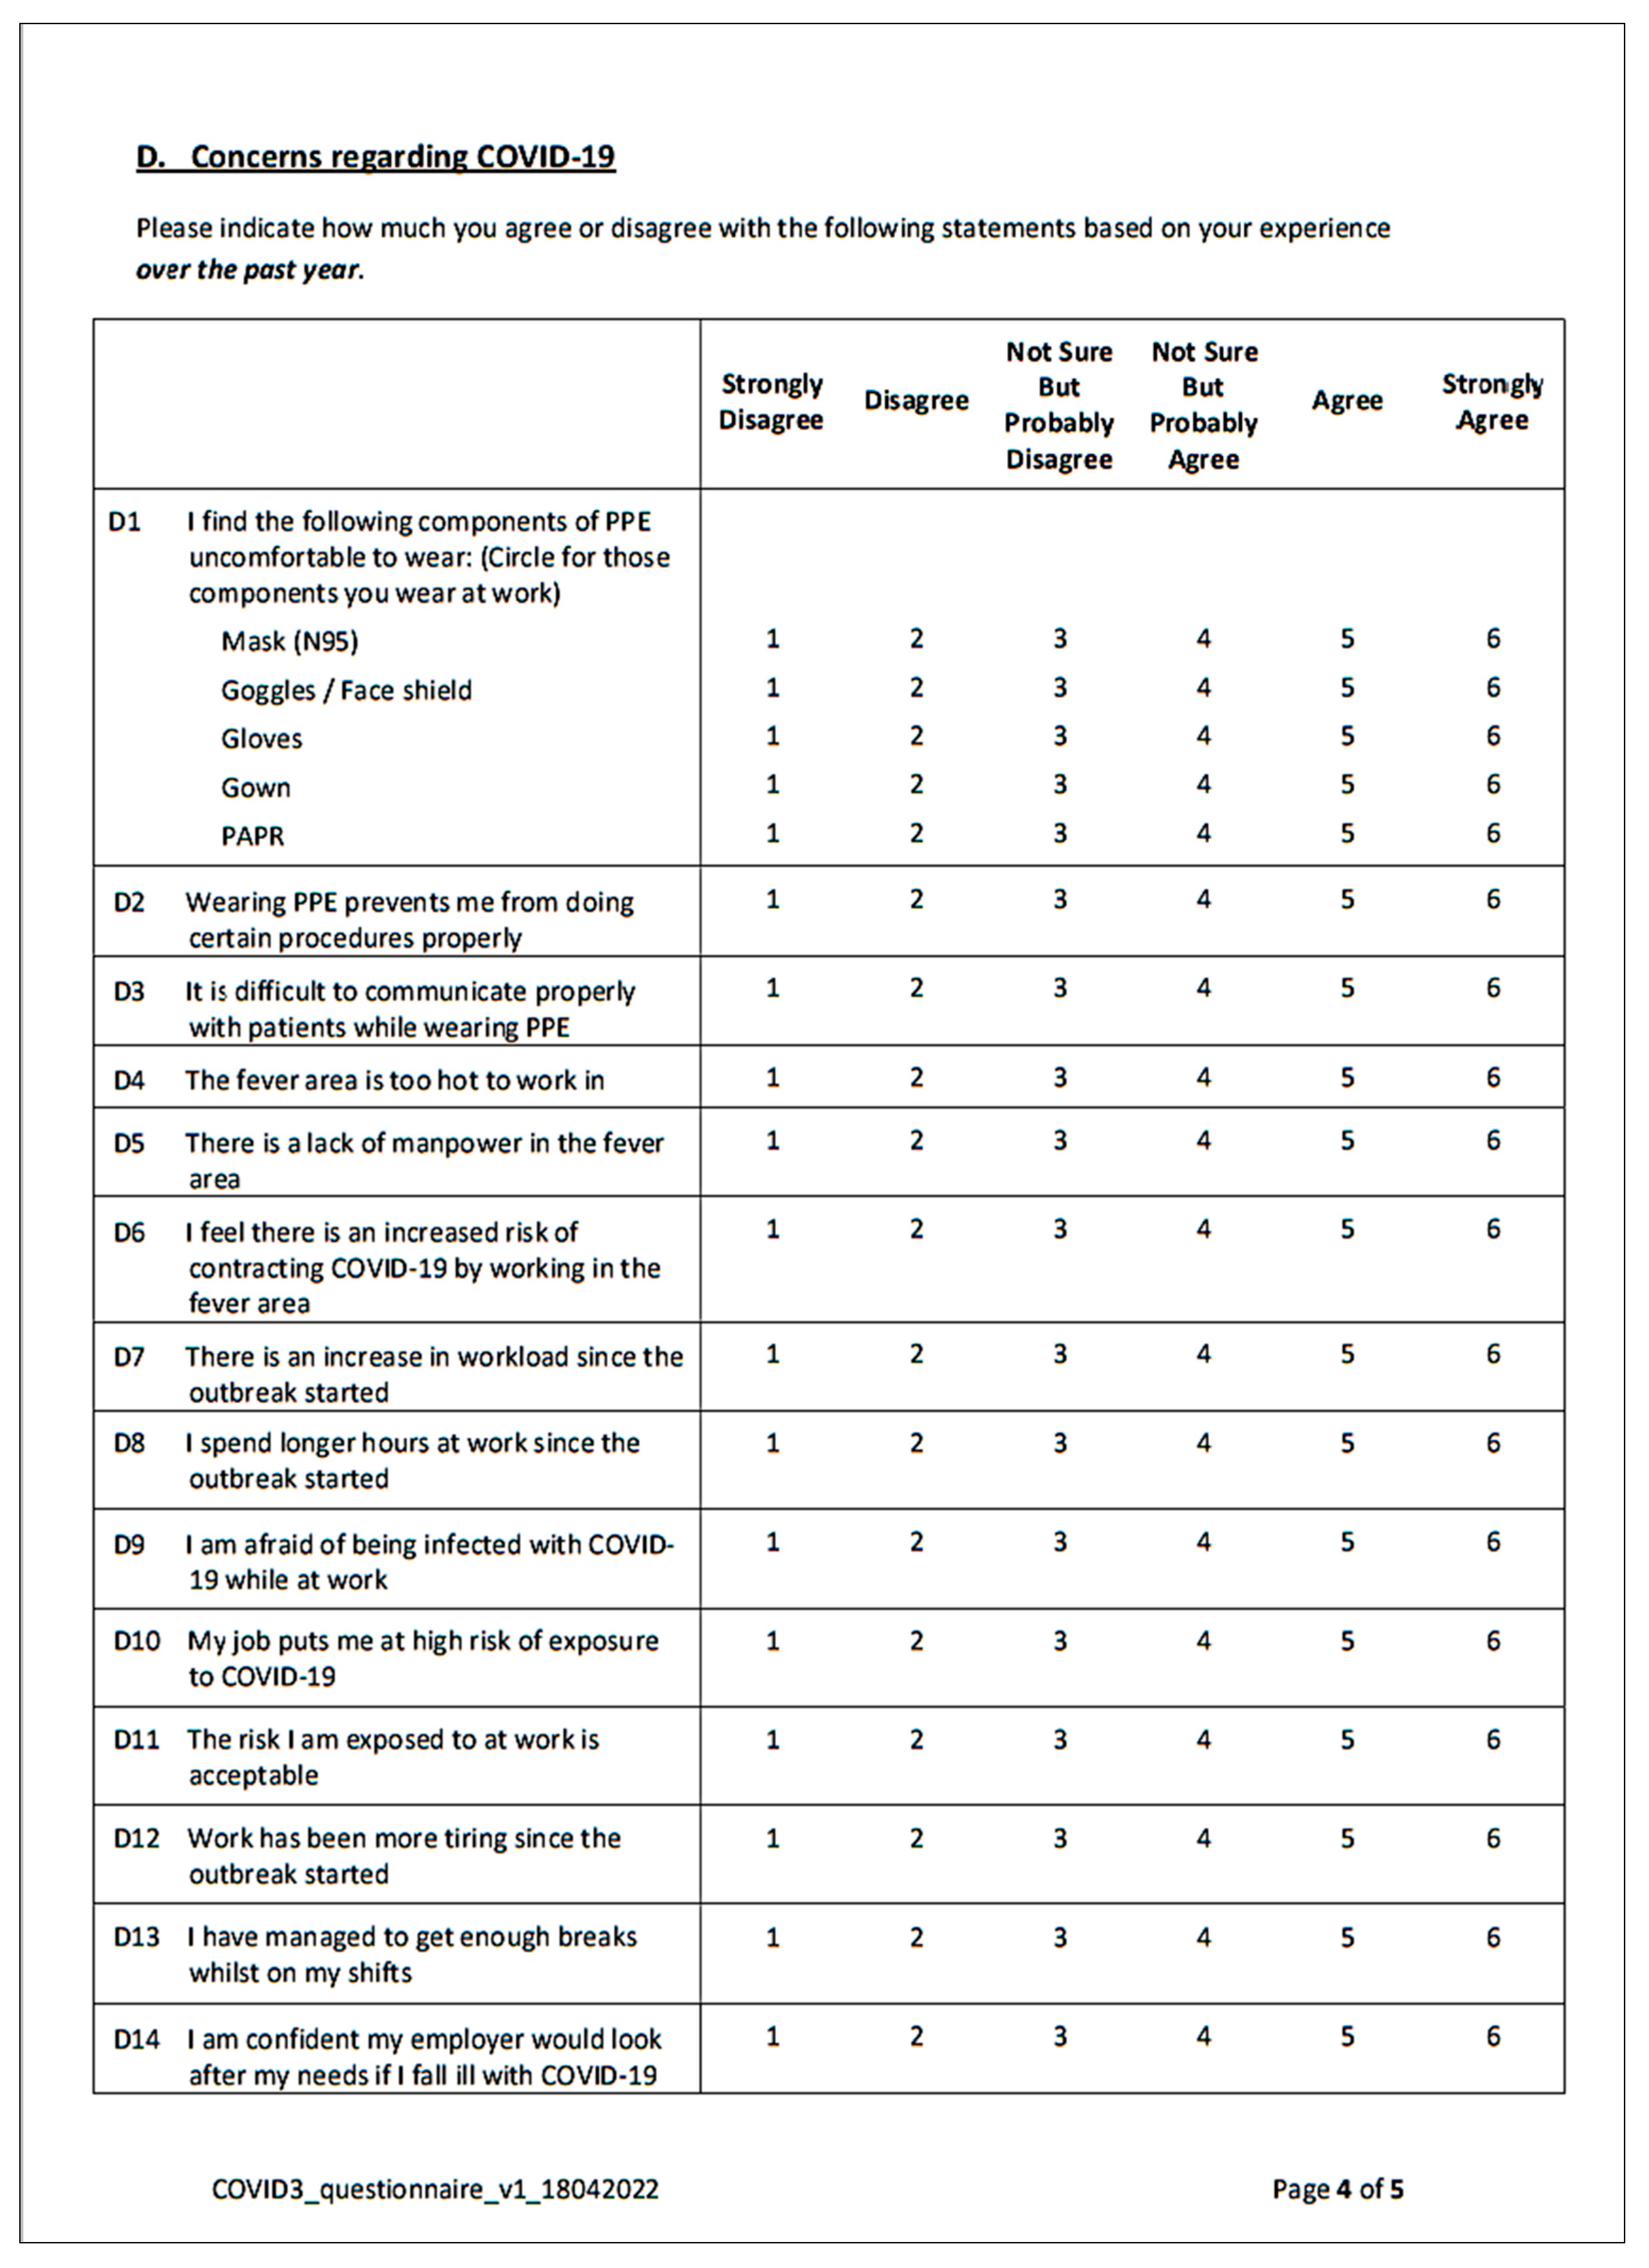
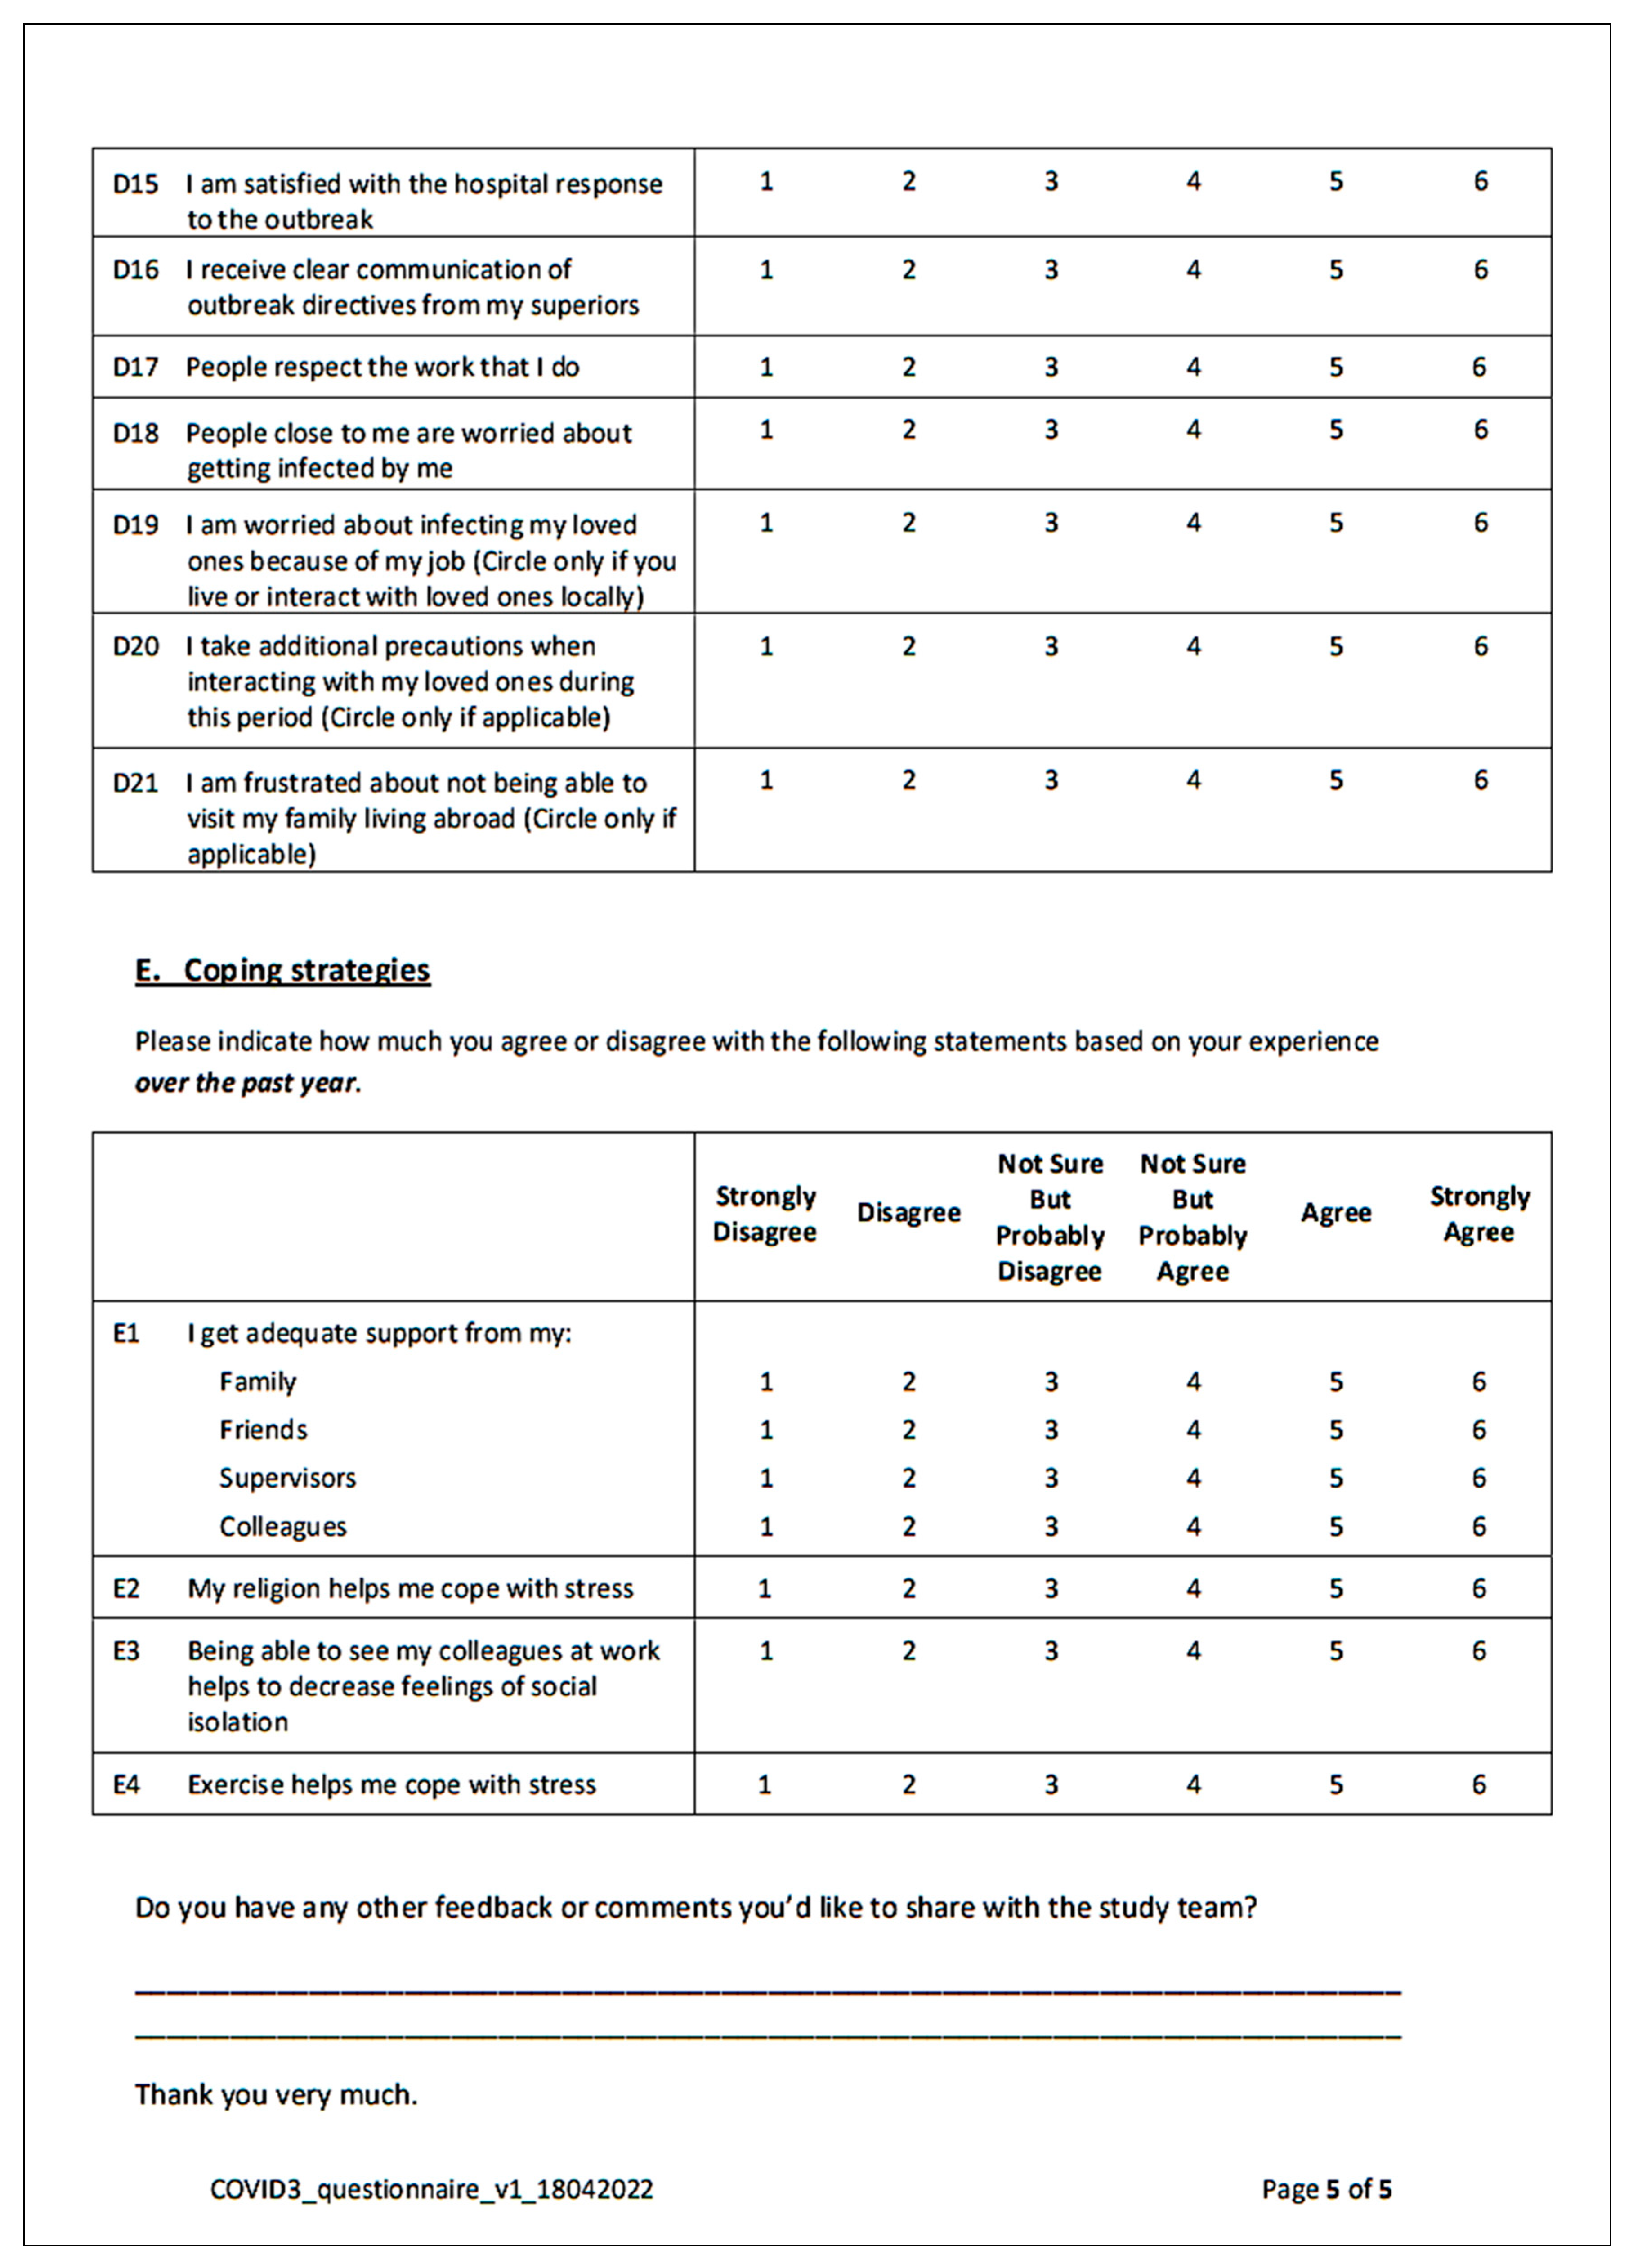
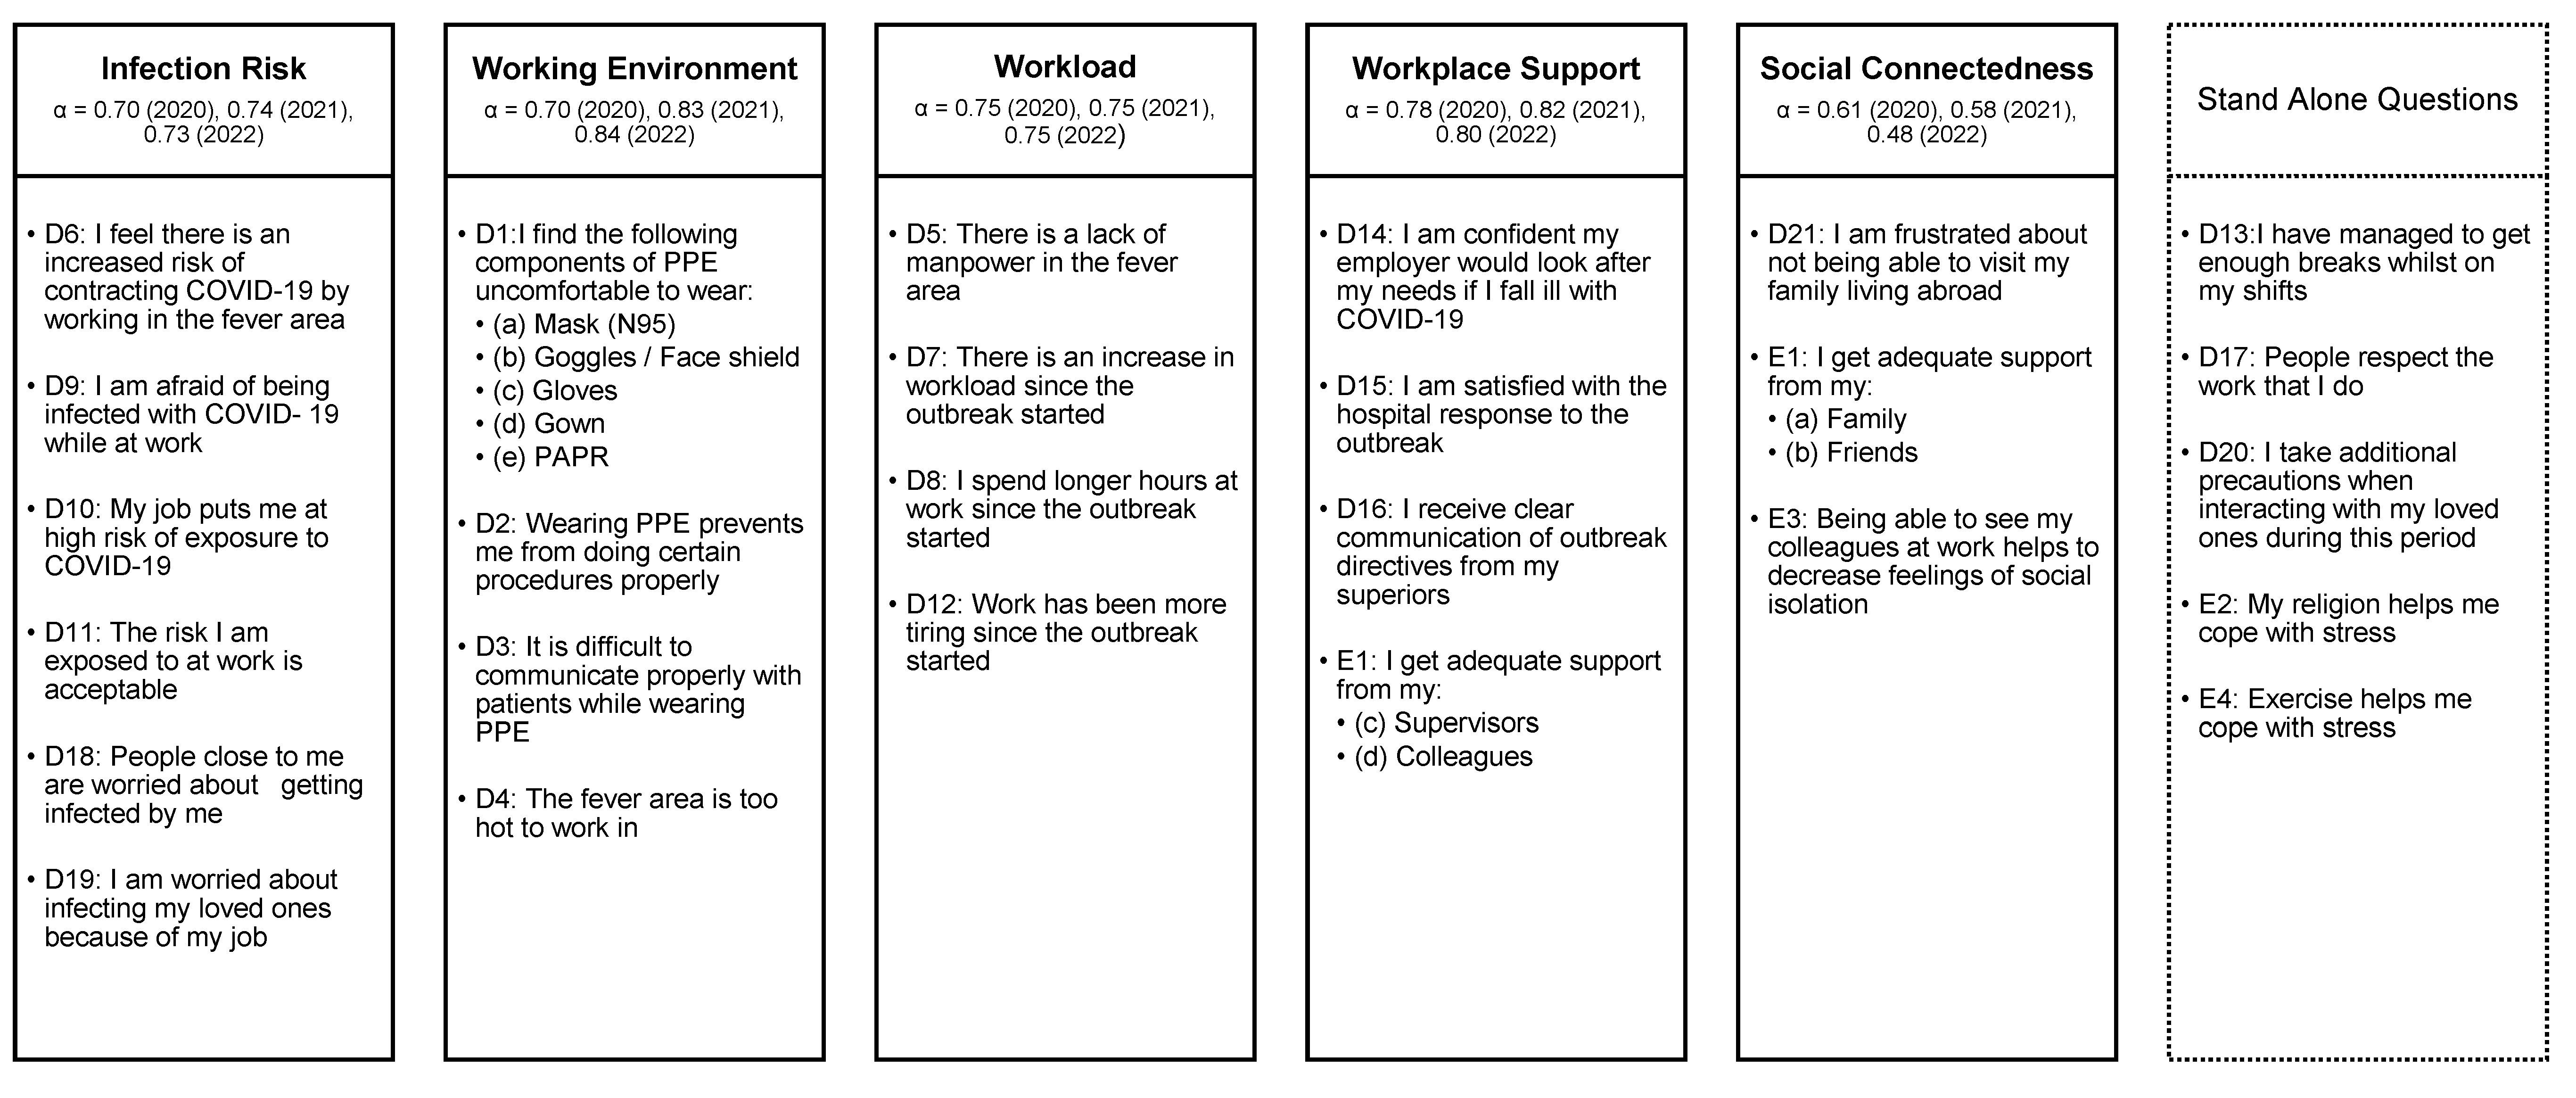
2.2. Outcome Measures
2.3. Statistical Analysis
3. Results
3.1. Demographics of the Cohorts
3.2. Concerns and Perceptions of the Cohorts
3.3. Mental Health Outcomes
3.3.1. Depression
3.3.2. Anxiety
3.3.3. Stress
3.3.4. PTSD of Clinical Concern
4. Discussion
4.1. Overall Worsening Depression and Stress
4.2. Concerns about Workload and Workplace Support
4.3. Whole Sampled Cohort vs. Matched Cohort
4.4. Strengths and Limitations
5. Conclusions
Author Contributions
Funding
Institutional Review Board Statement
Informed Consent Statement
Data Availability Statement
Acknowledgments
Conflicts of Interest
Appendix A

| 21 June 2021 | Phase 3 (heightened alert): Food and beverages (F&B) dine-in to resume (max 2 pax per group), sports/exercise activities to resume (max 5 per group) |
| 21 July 2021 | Vaccination programme open to all in Singapore aged 12–39 years |
| 5 July 2021 | Ministry of Health (MOH) announced on the small risk of myocarditis and pericarditis with after vaccination with mRNA COVID-19 vaccines |
| 12 July 2021 | Phase 3 update: F&B (dine-in max 5 pax per group all fully vaccinated/recovered from COVID-19/have negative COVID-19 test result, wedding receptions to resume, working from home remains default |
| 22 July 2021 | Reverted to Phase 2 till 10 August 2021: No dine-ins (only takeaways), social gatherings of max 2 pax, max 2 unique visitors per household per day, No indoor sports/exercise activities |
| 20 August 2021 | Vaccination-differentiated measures: If vaccinated, max 5 pax per social gathering and at F&B outlets, otherwise max 2 pax for unvaccinated |
| 30 August 2021 | Home isolation pilot started for those vaccinated with mild or no symptoms |
| 8 September 2021 | Vaccinated Travel Lanes (VTL) with Brunei and Germany |
| 15 September 2021 | COVID-19 booster vaccine offered to persons aged 60 years and above |
| 18 September 2021 | Home Recovery to be default care management model for suitable individuals |
| 27 September 2021 | Tightening community measures to stabilise situation: Social gatherings of max 2 pax per group, 1 gathering a day, dine-in with max 2 pax, sports activities max 2 pax per group |
| 4 October 2021 | COVID-19 booster vaccine offered to persons aged 50 years and above |
| 19 October 2021 | VTL for Canada, Denmark, France, Italy, Netherlands, Spain, UK and US |
| 10 November 2021 | Dine-in with max 5 pax, team sports to max 10 pax |
| 29 November 2021 | VTL with Malaysia, Finland, Sweden, India and Indonesia |
| 2 December 2021 | 2 Omicron cases first detected in Singapore |
| 3 December 2021 | No home recovery for Omicron variant cases; to be isolated at National Centre for Infectious Diseases |
| 6 December 2021 | VTL with Qatar, Saudi Arabia and United Arab Emirates |
| 16 December 2021 | COVID-19 booster vaccine offered to persons aged 18 and above |
| 22 December 2021 | COVID-19 vaccination offered to persons aged 5 to 11 years old |
| 27 December 2021 | Adjustment in approach to manage Omicron variant: Isolation in dedicated facilities not needed, able to self-isolate at home for 10 days |
| 1 January 2022 | 50% of employees who can work from home can return to office |
| 15 January 2022 | Unvaccinated individuals cannot return to work place even with negative swab tests |
| 22 January 2022 | Home isolation reduced from 10 to 7 days |
| 22 January 2022 | COVID-19 booster vaccine offered to persons aged 12 to 17 |
| 9 February 2022 | Home isolation for at least 72 h and to carry out self-administered Antigen Rapid Test (ART) after 72 h. To resume normal activities if ART is negative |
| 14 February 2022 | COVID-19 booster vaccinations required to maintain ‘fully vaccinated’ status |
| 25 February 2022 | Measures to live with Omicron variant & introduction of Safe Management Measures (SMMs) framework: group size & household visitors up to 5 pax at one time, safe distancing not required in mask on settings, up to 50% employees can return to office, capacity limits for events with >1000 pax and no safe distancing |
| 29 March 2022 | Easing of SMMs: Group size & household visitors max 10 pax for mask-off settings, up to 75% of workforce can return to office, mask wearing outdoors is optional but required in indoor settings, 1 m safe distancing required for mask-off settings |
| 1 April 2022 | Fully vaccinated travellers and children under 12 years old can enter Singapore quarantine-free |
| 22 April 2022 | Step down to Disease Outbreak Response System Condition (DORSCON) Yellow (from Orange since Feb 2020) |
| 26 April 2022 | No limit to group sizes/visitors per household, Capacity limits for events removed, Safe distancing not required, check-in using TraceTogether & SafeEntry not required except for events >500 pax & nightlife establishments with dancing, All workers can return to office, |
| 15 May 2022 | First local cases BA.4 and BA.5 variant infections |
| 3 June 2022 | Pre-departure tests not required before departure to Singapore and no quarantine/COVID-19 tests required upon arrival |
| 10 June 2022 | Second COVID-19 booster vaccine offered to those 50 years and older |
| 21 June 2022 | 23% week-on-week increased in COVID-19 community infections largely by increased spread of newer Omicron subvariants BA.4 and BA.5 |
Appendix B
| 2019 [Pre COVID-19] | 2020 [Beginning of COVID-19] | 2021 [Mid COVID-19] | 2022 [Early Post COVID-19] | |
|---|---|---|---|---|
| Average no. of patients seen in ED per month (n) | 11,124 | 9758 | 9339 | 9618 |
| Average no. of P1 */P2 ^ patients seen per month (n,%) | 4297 (38.6%) | 4451 (45.6%) | 4666 (50.0%) | 5052 (52.5%) |
| Average waiting time to be seen by a doctor (mins) | 31 | 28 | 26 | 34 |
| Average waiting time to obtain a ward bed (hours) | 1.1 | 3.4 | 5.8 | 11.2 |
Appendix C


Appendix D

Appendix E
| Characteristics | 2020 | 2021 | 2022 |
|---|---|---|---|
| Age group in years (n,%) | |||
| 21–30 | 70 (43.8) | 60 (37.5) | 47 (29.4) |
| 31–40 | 65 (40.6) | 71 (44.4) | 81 (50.6) |
| 41+ | 25 (15.6) | 29 (18.1) | 32 (20.0) |
| Gender (n,%) | |||
| Female | 115 (71.9) | 115 (71.9) | 115 (71.9) |
| Male | 45 (28.1) | 45 (28.1) | 45 (28.1) |
| Ethnicity (n,%) | |||
| Chinese | 61 (38.1) | 61 (38.1) | 61 (38.1) |
| Filipino | 54 (33.8) | 54 (33.8) | 54 (33.8) |
| Others | 45 (28.1) | 45 (28.1) | 45 (28.1) |
| Marital status (n,%) | |||
| Single/Separated/Divorced/Widowed | 88 (55.0) | 84 (52.5) | 80 (50.0) |
| Married | 72 (45.0) | 76 (47.5) | 80 (50.0) |
| Occupation (n,%) | |||
| Junior doctor | 15 (9.4) | 15 (9.4) | 16 (10.0) |
| Senior doctor | 24 (15) | 24 (15) | 23 (14.4) |
| Nurse | 114 (71.3) | 114 (71.3) | 114 (71.3) |
| Healthcare Assistant | 7 (4.4) | 7 (4.4) | 7 (4.4) |
| Past medical history (n,%) | |||
| Yes | 7 (4.4) | 9 (5.6) | 12 (7.5) |
| No | 153 (95.6) | 151 (94.4) | 148 (92.5) |
| Living with young children (<12 years) (n,%) | |||
| Yes | 22 (13.8) | 32 (20) | 37 (23.1) |
| No | 138 (86.2) | 128 (80.0) | 123 (76.9) |
| Living with elderly (>65 years) (n,%) | |||
| Yes | 22 (13.8) | 25 (15.6) | 22 (13.8) |
| No | 138 (86.2) | 135 (84.4) | 138 (86.2) |
| Lives alone (n,%) | |||
| Yes | 27 (16.9) | 29 (18.1) | 22 (13.8) |
| No | 133 (83.1) | 131 (81.9) | 138 (86.2) |
| Practices a religion (n,%) | |||
| Yes | 118 (73.8) | 121 (75.6) | 127 (79.4) |
| No | 42 (26.2) | 39 (24.4) | 33 (20.6) |
| Has family or close friend with COVID-19 (n,%) | |||
| Yes | 16 (10.0) | 26 (16.3) | 135 (84.4) |
| No | 144 (90.0) | 134 (83.7) | 25 (15.6) |
Appendix F
| Concerns and Perceptions | 2020 (Mean ± SD) | 2021 (Mean ± SD) | 2022 (Mean ± SD) | p-Value * |
|---|---|---|---|---|
| Concerns about infection risk | 4.16 ± 0.83 | 3.88 ± 0.88 | 3.82 ± 0.96 | 0.001 |
| Concerns about working environment | 4.14 ± 0.87 | 3.95 ± 0.97 | 3.93 ± 1.00 | 0.104 |
| Concerns about workload | 4.09 ± 0.91 | 4.37 ± 0.89 | 4.97 ± 0.81 | <0.001 |
| Social connectedness | 4.55 ± 0.62 | 4.34 ± 0.66 | 4.52 ± 0.64 | 0.039 |
| Workplace support | 4.87 ± 0.67 | 4.67 ± 0.71 | 4.43 ± 0.77 | 0.007 |
Appendix G

Appendix H
| All HCWs | Senior Doctors | Junior Doctors | Nurses | HCAs | |||||||||||
|---|---|---|---|---|---|---|---|---|---|---|---|---|---|---|---|
| MHOs | 2020 n = 160 | 2021 n = 160 | 2022 n = 160 | 2020 n = 15 | 2021 n = 15 | 2022 n = 15 | 2020 n = 24 | 2021 n = 24 | 2022 n = 24 | 2020 n = 114 | 2021 n = 114 | 2022 n = 114 | 2020 n = 7 | 2021 n = 7 | 2022 n = 7 |
| Depression | |||||||||||||||
| No | 118 (73.8) | 116 (72.5) | 118 (73.8) | 11 (73.3) | 11 (73.3) | 11 (73.3) | 19 (79.2) | 19 (79.2) | 16 (66.7) | 83 (72.8) | 81 (71.1) | 86 (75.4) | 5 (71.4) | 5 (71.4) | 5 (71.4) |
| Yes | 42 (26.2) | 44 (27.5) | 42 (26.2) | 4 (26.7) | 4 (26.7) | 4 (26.7) | 5 (20.8) | 5 (20.8) | 8 (33.3) | 31 (27.2) | 33 (28.9) | 28 (24.6) | 2 (28.6) | 2 (28.6) | 2 (28.6) |
| Mild | 20 (12.5) | 21 (13.1) | 21 (13.1) | 2 (13.3) | 2 (13.3) | 1 (6.7) | 0 | 3 (12.5) | 5 (20.8) | 16 (14) | 14 (12.3) | 14 (12.3) | 2 (28.6) | 2 (28.6) | 1 (14.3) |
| Moderate | 14 (8.8) | 16 (10) | 11 (6.9) | 1 (6.7) | 1 (6.7) | 2 (13.3) | 3 (12.5) | 1 (4.2) | 1 (4.2) | 10 (8.8) | 14 (12.3) | 7 (6.1) | 0 | 0 | 1 (14.3) |
| Severe | 4 (2.5) | 2 (1.3) | 6 (3.8) | 0 | 0 | 1 (6.7) | 1 (4.2) | 0 | 2 (8.3) | 3 (2.6) | 2 (1.8) | 3 (2.6) | 0 | 0 | 0 |
| Extremely severe | 4 (2.5) | 5 (3.1) | 4 (2.5) | 1 (6.7) | 1 (6.7) | 0 | 1 (4.2) | 1 (4.2) | 0 | 2 (1.8) | 3 (2.6) | 4 (3.5) | 0 | 0 | 0 |
| Anxiety | |||||||||||||||
| No | 107 (66.9) | 120 (75.0) | 122 (76.3) | 13 (86.7) | 12 (80.0) | 14 (93.3) | 16 (66.7) | 18 (75.0) | 17 (70.8) | 76 (66.7) | 87 (76.3) | 87 (76.3) | 2 (28.6) | 3 (42.9) | 4 (57.1) |
| Yes | 53 (33.1) | 40 (25.0) | 38 (23.7) | 2 (13.3) | 3 (20.0) | 1 (6.7) | 8 (33.3) | 6 (25.0) | 7 (29.2) | 38 (33.3) | 27 (23.7) | 27 (23.7) | 5 (71.4) | 4 (57.1) | 3 (42.9) |
| Mild | 21 (13.1) | 12 (7.5) | 8 (5) | 1 (6.7) | 1 (6.7) | 0 | 4 (16.7) | 2 (8.3) | 2 (8.3) | 13 (11.4) | 9 (7.9) | 6 (5.3) | 3 (42.9) | 0 | 0 |
| Moderate | 21 (13.1) | 19 (11.9) | 24 (15) | 1 (6.7) | 2 (13.3) | 1 (6.7) | 1 (4.2) | 3 (12.5) | 5 (20.8) | 17 (14.9) | 11 (9.7) | 15 (13.2) | 2 (28.6) | 3 (42.9) | 3 (42.9) |
| Severe | 7 (4.4) | 3 (1.9) | 4 (2.5) | 0 | 0 | 0 | 2 (8.3) | 1 (4.2) | 0 | 5 (4.4) | 1 (0.9) | 4 (3.5) | 0 | 1 (14.3) | 0 |
| Extremely severe | 4 (2.5) | 6 (3.8) | 2 (1.3) | 0 | 0 | 0 | 1 (4.2) | 0 | 0 | 3 (2.6) | 6 (5.3) | 2 (1.8) | 0 | 0 | 0 |
| Stress | |||||||||||||||
| No | 147 (91.9) | 139 (86.9) | 146 (91.3) | 13 (86.7) | 12 (80.0) | 14 (93.3) | 21 (87.5) | 20 (83.3) | 22 (91.7) | 106 (93.0) | 101 (88.6) | 104 (91.2) | 7 (100) | 6 (85.7) | 6 (85.7) |
| Yes | 13 (8.1) | 21 (13.1) | 14 (8.7) | 2 (13.3) | 3 (20.0) | 1 (6.7) | 3 (12.5) | 4 (16.7) | 2 (8.3) | 8 (7.0) | 13 (11.4) | 10 (8.8) | 0 | 1 (14.3) | 1 (14.3) |
| Mild | 3 (1.9) | 13 (8.1) | 3 (1.9) | 0 | 2 (13.3) | 0 | 1 (4.2) | 3 (12.5) | 0 | 2 (1.8) | 7 (6.1) | 3 (2.6) | 0 | 1 (14.3) | 0 |
| Moderate | 7 (4.4) | 6 (3.8) | 6 (3.8) | 2 (13.3) | 1 (6.7) | 0 | 1 (4.2) | 1 (4.2) | 1 (4.2) | 4 (3.5) | 4 (3.5) | 4 (3.5) | 0 | 0 | 1 (14.3) |
| Severe | 2 (1.3) | 1 (0.6) | 4 (2.5) | 0 | 0 | 1 (6.7) | 0 | 0 | 1 (4.2) | 2 (1.8) | 1 (0.9) | 2 (1.8) | 0 | 0 | 0 |
| Extremely severe | 1 (0.6) | 1 (0.6) | 1 (0.6) | 0 | 0 | 0 | 1 (4.2) | 0 | 0 | 0 | 1 (0.9) | 1 (0.9) | 0 | 0 | 0 |
| PTSD of clinical concern | |||||||||||||||
| No | 136 (85.0) | 144 (90.0) | 143 (89.4) | 12 (80.0) | 14 (93.3) | 15 (100) | 21 (87.5) | 22 (91.7) | 21 (87.5) | 97 (85.1) | 101 (88.6) | 102 (89.5) | 6 (85.7) | 7 (100) | 5 (71.4) |
| Yes | 24 (15.0) | 16 (10.0) | 17 (10.6) | 3 (20.0) | 1 (6.7) | 0 | 3 (12.5) | 2 (8.3) | 3 (12.5) | 17 (14.9) | 13 (11.4) | 12 (10.5) | 1 (14.3) | 0 | 2 (28.6) |
| MHOs | 2020 Median (Q1-Q3) | 2021 Median (Q1-Q3) | 2022 Median (Q1-Q3) | 2020 Mean (±SD) | 2021 Mean (±SD) | 2022 Mean (±SD) | |||||||||
| All HCWs | n = 160 | n = 160 | n = 160 | n = 160 | n = 160 | n = 160 | |||||||||
| Depression | 2 (0–5) | 2 (0–5) | 2 (1–5) | 3.0 ± 3.6 | 3.3 ± 3.7 | 3.2 ± 3.6 | |||||||||
| Anxiety | 2 (0–4) | 2 (0–3.5) | 2 (0–3) | 2.9 ± 3.2 | 2.3 ± 2.9 | 2.3 ± 2.8 | |||||||||
| Stress | 3 (1–5) | 3 (1–5) | 3 (1–5) | 3.5 ± 3.4 | 3.6 ± 3.4 | 3.9 ± 3.4 | |||||||||
| PTSD | 7 (1.5–16.5) | 6 (2–14) | 7 (2–17.5) | 11.6 ± 14.5 | 10.0 ± 12.3 | 11.0 ± 12.3 | |||||||||
| Senior doctors | n = 15 | n = 15 | n = 15 | n = 15 | n = 15 | n = 15 | |||||||||
| Depression | 1 (0–5) | 3 (0–5) | 2 (1–5) | 2.7 ± 3.9 | 3.5 ± 4.7 | 3.5 ± 3.9 | |||||||||
| Anxiety | 2 (0–2) | 1 (0–3) | 0 (0–2) | 1.6 ± 1.8 | 1.7 ± 1.9 | 1.1 ± 1.7 | |||||||||
| Stress | 5 (1–7) | 3 (1–7) | 4 (1–6) | 4.3 ± 3.9 | 3.9 ± 3.8 | 4.0 ± 3.5 | |||||||||
| PTSD | 7 (1–15) | 4 (1–9) | 4 (0–9) | 10.3 ± 12.2 | 6.4 ± 7.8 | 6.4 ± 7.4 | |||||||||
| Junior doctors | n = 24 | n = 24 | n = 24 | n = 24 | n = 24 | n = 24 | |||||||||
| Depression | 1 (0–3.5) | 3 (0–4) | 2 (0–5) | 3.0 ± 4.9 | 3.0 ± 3.5 | 2.9 ± 3.5 | |||||||||
| Anxiety | 1.5 (0–4) | 1 (0–3.5) | 1 (0–4) | 2.9 ± 4.4 | 2.0 ± 2.5 | 2.2 ± 2.5 | |||||||||
| Stress | 3 (1–5) | 4 (1–6.5) | 5 (1–6) | 3.8 ± 4.6 | 4.0 ± 3.2 | 4.1 ± 3.8 | |||||||||
| PTSD | 4 (1–7) | 4 (0.5–9.5) | 9 (0–16) | 10.5 ± 19.5 | 8.1 ± 12.2 | 11.4 ± 13.8 | |||||||||
| Nurses | n = 114 | n = 114 | n = 114 | n = 114 | n = 114 | n = 114 | |||||||||
| Depression | 2 (0–5) | 2 (0–5) | 2 (1–4) | 3.0 ± 3.3 | 3.3 ± 3.7 | 3.3 ± 3.6 | |||||||||
| Anxiety | 2 (1–4) | 1.5 (0–3) | 2 (0–3) | 2.9 ± 3.1 | 2.4 ± 3.1 | 2.5 ± 2.9 | |||||||||
| Stress | 2 (1–5) | 3 (1–5) | 3 (1–5) | 3.2 ± 3.1 | 3.4 ± 3.4 | 3.9 ± 3.4 | |||||||||
| PTSD | 7 (2–17) | 6 (2–18) | 7 (2–18) | 11.9 ± 13.6 | 10.7 ± 13.0 | 11.2 ± 12.5 | |||||||||
| HCAs | n = 7 | n = 7 | n = 7 | n = 7 | n = 7 | n = 7 | |||||||||
| Depression | 3 (2–5) | 2 (1–6) | 3 (0–5) | 3.4 ± 1.6 | 3.0 ± 2.2 | 2.9 ± 3.3 | |||||||||
| Anxiety | 4 (2–7) | 5 (2–5) | 3 (1–5) | 4.0 ± 2.5 | 4.1 ± 2.3 | 3.3 ± 2.5 | |||||||||
| Stress | 4 (3–7) | 5 (4–6) | 3 (1–7) | 4.7 ± 1.7 | 5.0 ± 1.9 | 4.0 ± 3.6 | |||||||||
| PTSD | 15 (2–20) | 12 (10–18) | 12 (7–28) | 13.3 ± 12.4 | 13.0 ± 5.5 | 15.3 ± 11.0 | |||||||||
Appendix I
| All ED HCWs n = 160 | Depression | Anxiety | Stress | PTSD Concern | ||||
|---|---|---|---|---|---|---|---|---|
| n (%) | OR (95% CI) | n (%) | OR (95% CI) | n (%) | OR (95% CI) | n (%) | OR (95% CI) | |
| 2020 | 42 (26.3) | 1.00 | 53 (33.1) | 1.00 | 13 (8.1) | 1.00 | 24 (15) | 1.00 |
| 2021 | 44 (27.5) | 1.07 (0.74–1.53) | 40 (25.0) | 0.67 (0.46–0.99) | 21 (13.1) | 1.71 (1.05–2.79) | 16 (10) | 0.63 (0.39–1.02) |
| 2022 | 42 (26.3) | 1.00 (0.66–1.51) | 38 (23.8) | 0.63 (0.42–0.93) | 14 (8.8) | 1.08 (0.56–2.09) | 17 (10.6) | 0.67 (0.42–1.09) |
| Doctors n = 39 | Depression | Anxiety | Stress | PTSD concern | ||||
| n (%) | OR (95% CI) | n (%) | OR (95% CI) | n (%) | OR (95% CI) | n (%) | OR (95% CI) | |
| 2020 | 9 (23.1) | 1.00 | 10 (25.6) | 1.00 | 5 (12.8) | 1.00 | 6 (15.4) | 1.00 |
| 2021 | 9 (23.1) | 1.00 (0.56–1.77) | 9 (23.1) | 0.87 (0.38–1.99) | 7 (18.0) | 1.49 (0.68–3.26) | 3 (7.7) | 0.46 (0.14–1.46) |
| 2022 | 12 (30.8) | 1.48 (0.68–3.22) | 8 (20.5) | 0.75 (0.33–1.68) | 3 (7.7) | 0.57 (0.18–1.75) | 3 (7.7) | 0.46 (0.19–1.11) |
| Nursing staff n = 121 | Depression | Anxiety | Stress | PTSD concern | ||||
| n (%) | OR (95% CI) | n (%) | OR (95% CI) | n (%) | OR (95% CI) | n (%) | OR (95% CI) | |
| 2020 | 33 (27.3) | 1.00 | 43 (35.5) | 1.00 | 8 (6.6) | 1.00 | 18 (14.9) | 1.00 |
| 2021 | 35 (28.9) | 1.09 (0.70–1.69) | 31 (25.6) | 0.62 (0.41–0.96) | 14 (11.6) | 1.85 (0.98–3.5) | 13 (10.7) | 0.69 (0.41–1.17) |
| 2022 | 30 (24.8) | 0.88 (0.54–1.43) | 30 (24.8) | 0.60 (0.38–0.94) | 11 (9.1) | 1.41 (0.62–3.2) | 14 (11.6) | 0.75 (0.42–1.32) |
References
- Ministry of Health Singapore. Endemic COVID-19. Updated 5 July 2021. Available online: https://www.moh.gov.sg/news-highlights/details/endemic-covid-190 (accessed on 15 September 2022).
- Ministry of Health Singapore. Updates on Singapore’s COVID-19 Situation. Available online: https://www.moh.gov.sg/covid-19 (accessed on 15 September 2022).
- Teo, I.; Nadarajan, G.D.; Ng, S.; Bhaskar, A.; Sung, S.C.; Cheung, Y.B.; Pan, F.T.; Haedar, A.; Gaerlan, F.J.; Ong, S.F.; et al. The Psychological Well-Being of Southeast Asian Frontline Healthcare Workers during COVID-19: A Multi-Country Study. Int. J. Environ. Res. Public Health 2022, 19, 6380. [Google Scholar] [CrossRef] [PubMed]
- Rao, K.; Th’Ng, F.; Mak, C.; Neo, H.; Ubeynarayana, C.; Kumar, R.N.; Mao, D. Factors associated with mental health outcomes in emergency department healthcare workers on the frontlines of the COVID-19 pandemic. Singap. Med. J. 2021, 1, 11. [Google Scholar] [CrossRef] [PubMed]
- Th’Ng, F.; Rao, K.A.; Ge, L.; Mao, D.; Neo, H.N.; De Molina, J.A.; Seow, E. A One-Year Longitudinal Study: Changes in Depression and Anxiety in Frontline Emergency Department Healthcare Workers in the COVID-19 Pandemic. Int. J. Environ. Res. Public Health 2021, 18, 11228. [Google Scholar] [CrossRef] [PubMed]
- Lovibond, S.H.; Lovibond, P.F. Manual for the Depression Anxiety Stress Scales, 2nd ed.; Psychology Foundation: Sydney, Australia, 1995; ISBN 7334-1423-7330. [Google Scholar]
- Asukai, N.; Kato, H.; Kawamura, N.; Kim, Y.; Yamamoto, K.; Kishimoto, J.; Miyake, Y.; Nishizono-Maher, A. Reliabiligy and validity of the Japanese-language version of the impact of event scale-revised (Ies-RJ): Four studies of different traumatic events. J. Nerv. Ment. Dis. 2002, 190, 175–182. [Google Scholar] [CrossRef] [PubMed]
- Ballinger, G.A. Using Generalized Estimating Equations for Longitudinal Data Analysis. Organ. Res. Methods 2004, 7, 127–150. [Google Scholar] [CrossRef]
- Samur, A.A.; Coskunfirat, N.; Saka, O. Comparison of predictor approaches for longitudinal binary outcomes: Application to anesthesiology data. PeerJ 2014, 2, e648. [Google Scholar] [CrossRef]
- Sun, T.-K.; Chu, L.-C.; Hui, C. The Psychological Impact and Influencing Factors during Different Waves of COVID-19 Pandemic on Healthcare Workers in Central Taiwan. Int. J. Environ. Res. Public Health 2022, 19, 10542. [Google Scholar] [CrossRef]
- Sampaio, F.; Sequeira, C.; Teixeira, L. Nurses’ mental health during the Covid-19 outbreak: A cross-sectional study. J. Occup. Environ. Med. 2020, 62, 783–787. [Google Scholar] [CrossRef] [PubMed]
- Wu, P.; Fang, Y.; Guan, Z.; Fan, B.; Kong, J.; Yao, Z.; Liu, X.; Fuller, C.J.; Susser, E.; Lu, J.; et al. The Psychological Impact of the SARS Epidemic on Hospital Employees in China: Exposure, Risk Perception, and Altruistic Acceptance of Risk. Can. J. Psychiatry 2009, 54, 302–311. [Google Scholar] [CrossRef] [PubMed]
- Poon, Y.-S.R.; Lin, Y.P.; Griffiths, P.; Yong, K.K.; Seah, B.; Liaw, S.Y. A global overview of healthcare workers’ turnover intention amid COVID-19 pandemic: A systematic review with future directions. Hum. Resour. Health 2022, 20, 70. [Google Scholar] [CrossRef] [PubMed]
- de Lima Garcia, C.; de Abreu, L.C.; Ramos, J.L.S.; de Castro, C.F.D.; Smiderle, F.R.N.; dos Santos, J.A.; Bezerra, I.M.P. Influence of Burnout on Patient Safety: Systematic Review and Meta-Analysis. Medicina 2019, 55, 553. [Google Scholar] [CrossRef] [PubMed]
- Ching, N.M.C.; Low, D.W. Singapore Sees 25% Increase in Emergency Public Hospital Visits. Bloomberg Asia Edition. Updated 22 July 2022. Available online: https://www.bloomberg.com/news/articles/2022-07-22/singapore-sees-25-increase-in-emergency-public-hospital-visits (accessed on 5 October 2022).
- Chew, M.H. Clinics in Singapore See Rise in COVID-19 Patients in New Wave of Infections. Chanel News Asia. Updated 1 July 2022. Available online: https://www.channelnewsasia.com/singapore/omicron-5th-wave-covid19-coronavirus-infection-clinics-singapore-2784941 (accessed on 5 October 2022).
- Ministry of Health Singapore. Waiting Time for Admission to Ward. Updated 30 September 2022. Available online: https://www.moh.gov.sg/resources-statistics/healthcare-institution-statistics/waiting-time-for-admission-to-ward (accessed on 5 October 2022).
- Ministry of Health Singapore. Bed Occupancy Rate (BOR). Updated 30 September 2022. Available online: https://www.moh.gov.sg/resources-statistics/healthcare-institution-statistics/beds-occupancy-rate-(bor) (accessed on 5 October 2022).
- Fekadu, G.; Bekele, F.; Tolossa, T.; Fetensa, G.; Turi, E.; Getachew, M.; Abdisa, E.; Assefa, L.; Afeta, M.; Demisew, W.; et al. Impact of COVID-19 pandemic on chronic diseases care follow-up and current perspectives in low resource settings: A narrative review. Int. J. Physiol. Pathophysiol. Pharmacol. 2021, 13, 86–93. [Google Scholar] [PubMed]
- Singh, K.; Xin, Y.; Xiao, Y.; Quan, J.; Kim, D.; Nguyen, T.-P.; Kondal, D.; Yan, X.; Li, G.; Ng, C.S.; et al. Impact of the COVID-19 Pandemic on Chronic Disease Care in India, China, Hong Kong, Korea, and Vietnam. Asia Pac. J. Public Health 2022, 34, 392–400. [Google Scholar] [CrossRef] [PubMed]
- Vindrola-Padros, C.; Andrews, L.; Dowrick, A.; Djellouli, N.; Fillmore, H.; Gonzalez, E.B.; Javadi, D.; Lewis-Jackson, S.; Manby, L.; Mitchinson, L.; et al. Perceptions and experiences of healthcare workers during the COVID-19 pandemic in the UK. BMJ Open 2020, 10, e040503. [Google Scholar] [CrossRef] [PubMed]
- Dixon, E.; Murphy, M.; Wynne, R. A multidisciplinary, cross-sectional survey of burnout and wellbeing in emergency department staff during COVID-19. Australas. Emerg. Care 2021, 25, 247–252. [Google Scholar] [CrossRef] [PubMed]
- Daly, M.; Sutin, A.R.; Robinson, E. Longitudinal changes in mental health and the COVID-19 pandemic: Evidence from the UK Household Longitudinal Study. Psychol. Med. 2020, 52, 2549–2558. [Google Scholar] [CrossRef] [PubMed]
- Voltmer, E.; Köslich-Strumann, S.; Walther, A.; Kasem, M.; Obst, K.; Kötter, T. The impact of the COVID-19 pandemic on stress, mental health and coping behavior in German University students–a longitudinal study before and after the onset of the pandemic. BMC Public Health 2021, 21, 1385. [Google Scholar] [CrossRef] [PubMed]

| Characteristics | 2020 (n = 327) | 2021 (n = 279) | 2022 (n = 397) |
|---|---|---|---|
| Age group in years (n,%) | |||
| 21–30 | 154 (47.1) | 110 (39.4) | 210 (52.9) |
| 31–40 | 121 (37.0) | 124 (44.4) | 141 (35.5) |
| 41+ | 52 (15.9) | 45 (16.1) | 46 (11.6) |
| Gender (n,%) | |||
| Female | 236 (72.2) | 204 (73.1) | 281 (70.8) |
| Male | 91 (27.8) | 75 (26.9) | 116 (29.2) |
| Ethnicity (n,%) | |||
| Chinese | 128 (39.1) | 110 (39.4) | 175 (44.1) |
| Filipino | 92 (28.1) | 88 (31.5) | 95 (23.9) |
| Others | 107 (32.7) | 81 (29.0) | 127 (32.0) |
| Marital status (n,%) | |||
| Single/Separated/Divorced/Widowed | 180 (55.1) | 142 (50.9) | 263 (66.3) |
| Married | 147 (45.0) | 137 (49.1) | 134 (33.8) |
| Occupation (n,%) | |||
| Senior doctor | 25 (7.7) | 23 (8.2) | 25 (6.3) |
| Junior doctor | 64 (19.6) | 38 (13.6) | 70 (17.6) |
| Nurse | 217 (66.4) | 206 (73.8) | 249 (62.7) |
| Healthcare Assistant | 21 (6.4) | 12 (4.3) | 53 (13.4) |
| Past medical history (n,%) | |||
| Yes | 14 (4.3) | 15 (5.4) | 22 (5.5) |
| No | 313 (95.7) | 264 (94.6) | 375 (94.5) |
| Living with young children (<12 years) (n,%) | |||
| Yes | 50 (15.3) | 60 (21.5) | 70 (17.6) |
| No | 277 (84.7) | 219 (78.5) | 327 (82.4) |
| Living with elderly (>65 years) (n,%) | |||
| Yes | 51 (15.6) | 45 (16.1) | 65 (16.4) |
| No | 276 (84.4) | 234 (83.9) | 332 (83.6) |
| Lives alone (n,%) | |||
| Yes | 44 (13.5) | 47 (16.9) | 49 (12.3) |
| No | 283 (86.5) | 232 (83.1) | 348 (87.7) |
| Practices a religion (n,%) | |||
| Yes | 251 (76.8) | 213 (76.3) | 304 (76.6) |
| No | 76 (23.3) | 66 (23.7) | 93 (23.4) |
| Has family/close friend with COVID-19 (n,%) | |||
| Yes | 25 (7.7) | 48 (17.2) | 330 (83.1) |
| No | 302 (92.3) | 231 (82.8) | 67 (16.9) |
| Concerns and Perceptions | 2020 (Mean ± SD) | 2021 (Mean ± SD) | 2022 (Mean ± SD) | |||
|---|---|---|---|---|---|---|
| Concerns about infection risk | 4.19 ± 0.82 | 3.93 ± 0.83 | 3.90 ± 0.92 | |||
| Concerns about working environment | 4.09 ± 0.85 | 3.96 ± 0.98 | 3.90 ± 1.03 | |||
| Concerns about workload | 4.04 ± 0.97 | 4.37 ± 0.89 | 4.81 ± 0.86 | |||
| Social connectedness | 4.53 ± 0.64 | 4.43 ± 0.67 | 4.57 ± 0.70 | |||
| Workplace support | 4.80 ± 0.69 | 4.66 ± 0.70 | 4.48 ± 0.76 | |||
| Concerns & perceptions | Senior doctors | Junior doctors | ||||
| 2020 (n = 25) | 2021 (n = 23) | 2022 (n = 25) | 2020 (n = 64) | 2021 (n = 38) | 2022 (n = 70) | |
| Concerns about infection | 3.83 ± 0.70 | 3.61 ± 0.74 | 3.59 ± 1.10 | 3.94 ± 0.76 | 3.85 ± 0.85 | 3.86 ± 0.85 |
| Concerns about working environment | 4.37 ± 0.60 | 4.37 ± 0.81 | 4.12 ± 1.11 | 3.91 ± 0.70 | 4.10 ± 0.81 | 4.28 ± 0.87 |
| Concerns about workload | 3.25 ± 0.79 | 3.95 ± 1.00 | 4.76 ± 0.92 | 3.45 ± 0.88 | 4.29 ± 0.82 | 4.86 ± 0.87 |
| Social connectedness | 4.79 ± 0.78 | 4.43 ± 0.79 | 4.47 ± 0.71 | 4.71 ± 0.65 | 4.52 ± 0.66 | 4.62 ± 0.87 |
| Workplace support | 4.83 ± 0.62 | 4.43 ± 0.88 | 4.40 ± 0.98 | 4.81 ± 0.60 | 4.71 ± 0.61 | 4.36 ± 0.63 |
| Concerns & perceptions | Nurses | HCAs | ||||
| 2020 (n = 217) | 2021 (n = 206) | 2022 (n = 248) | 2020 (n = 21) | 2021 (n = 12) | 2022 (n = 53) | |
| Concerns about infection | 4.33 ± 0.80 | 3.99 ± 0.83 | 3.94 ± 0.92 | 3.93 ± 1.00 | 3.72 ± 0.70 | 3.87 ± 0.89 |
| Concerns about working environment | 4.11 ± 0.89 | 3.88 ± 1.03 | 3.79 ± 1.05 | 4.15 ± 0.99 | 4.02 ± 0.90 | 3.81 ± 0.99 |
| Concerns about workload | 4.34 ± 0.86 | 4.48 ± 0.87 | 4.92 ± 0.79 | 3.69 ± 0.99 | 3.69 ± 0.78 | 4.21 ± 0.89 |
| Social connectedness | 4.48 ± 0.60 | 4.39 ± 0.67 | 4.54 ± 0.67 | 4.12 ± 0.65 | 4.69 ± 0.52 | 4.67 ± 0.59 |
| Workplace support | 4.80 ± 0.69 | 4.66 ± 0.70 | 4.46 ± 0.75 | 4.69 ± 1.05 | 5.05 ± 0.50 | 4.80 ± 0.77 |
| All HCWs | Senior Doctors | Junior Doctors | Nurses | HCAs | |||||||||||
|---|---|---|---|---|---|---|---|---|---|---|---|---|---|---|---|
| MHOs | 2020 n = 327 | 2021 n = 279 | 2022 n = 397 | 2020 n = 25 | 2021 n = 23 | 2022 n = 25 | 2020 n = 64 | 2021 n = 38 | 2022 n = 70 | 2020 n = 217 | 2021 n = 206 | 2022 n = 249 | 2020 n = 21 | 2021 n = 12 | 2022 n = 53 |
| Depression | |||||||||||||||
| No | 237 (72.5) | 196 (70.3) | 269 (67.8) | 18 (72.0) | 16 (69.6) | 16 (64.0) | 52 (81.3) | 28 (73.7) | 50 (71.4) | 157 (72.4) | 144 (69.9) | 166 (66.7) | 10 (47.6) | 8 (66.7) | 37 (69.8) |
| Yes | 90 (27.5) | 83 (29.7) | 128 (32.2) | 7 (28.0) | 7 (30.4) | 9 (36.0) | 12 (18.7) | 10 (26.3) | 20 (28.6) | 60 (27.6) | 62 (30.1) | 83 (33.3) | 11 (52.4) | 4 (33.3) | 16 (30.2) |
| Mild | 38 (11.6) | 34 (12.2) | 52 (13.1) | 2 (8.0) | 2 (8.7) | 5 (20.0) | 5 (7.8) | 4 (10.5) | 8 (11.4) | 28 (12.9) | 24 (11.7) | 34 (13.7) | 3 (14.3) | 4 (33.3) | 5 (9.4) |
| Moderate | 36 (11) | 34 (12.2) | 50 (12.6) | 2 (8.0) | 2 (8.7) | 3 (12.0) | 4 (6.3) | 4 (10.5) | 5 (7.1) | 24 (11.1) | 28 (13.6) | 34 (13.7) | 6 (28.6) | 0 (0) | 8 (15.1) |
| Severe | 10 (3.1) | 4 (1.4) | 11 (2.8) | 2 (8.0) | 1 (4.4) | 1 (4.0) | 1 (1.6) | 0 (0) | 5 (7.1) | 5 (2.3) | 3 (1.5) | 4 (1.6) | 2 (9.5) | 0 (0) | 1 (1.9) |
| Extremely severe | 6 (1.8) | 11 (3.9) | 15 (3.8) | 1 (4.0) | 2 (8.7) | 0 (0) | 2 (3.1) | 2 (5.3) | 2 (2.9) | 3 (1.4) | 7 (3.4) | 11 (4.4) | 0 (0) | 0 (0) | 2 (3.8) |
| Anxiety | |||||||||||||||
| No | 215 (65.8) | 199 (71.3) | 244 (61.5) | 22 (88.0) | 19 (82.6) | 18 (72.0) | 47 (73.4) | 31 (81.6) | 52 (74.3) | 140 (64.5) | 145 (70.4) | 147 (59.0) | 6 (28.6) | 4 (33.3) | 27 (50.9) |
| Yes | 112 (34.2) | 80 (28.7) | 153 (38.5) | 3 (12.0) | 4 (17.4) | 7 (28.0) | 17 (26.6) | 7 (18.4) | 18 (25.7) | 77 (35.5) | 61 (29.6) | 102 (41.0) | 15 (71.4) | 8 (66.7) | 26 (49.1) |
| Mild | 33 (10.1) | 17 (6.1) | 33 (8.3) | 1 (4.0) | 2 (8.7) | 1 (4.0) | 9 (14.1) | 2 (5.3) | 4 (5.7) | 20 (9.2) | 13 (6.3) | 20 (8.0) | 3 (14.3) | 0 (0) | 8 (15.1) |
| Moderate | 49 (15) | 37 (13.3) | 71 (17.9) | 2 (8.0) | 2 (8.7) | 5 (20.0) | 5 (7.8) | 3 (7.9) | 10 (14.3) | 36 (16.6) | 25 (12.1) | 43 (17.3) | 6 (28.6) | 7 (58.3) | 13 (24.5) |
| Severe | 10 (3.1) | 12 (4.3) | 26 (6.6) | 0 (0) | 0 (0) | 1 (4.0) | 2 (3.1) | 1 (2.6) | 4 (5.7) | 8 (3.7) | 10 (4.9) | 20 (8.0) | 0 (0) | 1 (8.3) | 2 (3.8) |
| Extremely severe | 20 (6.1) | 14 (5) | 23 (5.8) | 0 (0) | 0 (0) | 0 (0) | 1 (1.6) | 1 (2.6) | 0 (0) | 13 (6.0) | 13 (6.3) | 19 (7.6) | 6 (28.6) | 0 (0) | 3 (5.7) |
| Stress | |||||||||||||||
| No | 287 (87.8) | 240 (86.0) | 328 (82.6) | 22 (88.0) | 20 (87.0) | 23 (92.0) | 61 (95.3) | 33 (86.8) | 59 (84.3) | 191 (88.0) | 176 (85.4) | 200 (80.3) | 13 (61.9) | 11 (91.7) | 46 (86.8) |
| Yes | 40 (12.2) | 39 (14.0) | 69 (17.4) | 3 (12.0) | 3 (13.0) | 2 (8.0) | 3 (4.7) | 5 (13.2) | 11 (15.7) | 26 (12.0) | 30 (14.6) | 49 (19.7) | 8 (38.1) | 1 (8.3) | 7 (13.2) |
| Mild | 15 (4.6) | 18 (6.5) | 27 (6.8) | 1 (4) | 2 (8.7) | 0 (0) | 1 (1.6) | 3 (7.9) | 3 (4.3) | 9 (4.2) | 12 (5.8) | 22 (8.8) | 4 (19.1) | 1 (8.3) | 2 (3.8) |
| Moderate | 16 (4.9) | 15 (5.4) | 25 (6.3) | 2 (8) | 1 (4.4) | 1 (4.0) | 1 (1.6) | 1 (2.6) | 5 (7.1) | 11 (5.1) | 13 (6.3) | 17 (6.8) | 2 (9.5) | 0 (0) | 2 (3.8) |
| Severe | 8 (2.5) | 3 (1.1) | 12 (3) | 0 (0) | 0 (0) | 1 (4.0) | 0 (0) | 0 (0) | 3 (4.3) | 6 (2.8) | 3 (1.5) | 7 (2.8) | 2 (9.5) | 0 (0) | 1 (1.9) |
| Extremely severe | 1 (0.3) | 3 (1.1) | 5 (1.3) | 0 (0) | 0 (0) | 0 (0) | 1 (1.6) | 1 (2.6) | 0 (0) | 0 (0) | 2 (1.0) | 3 (1.2) | 0 (0) | 0 (0) | 2 (3.8) |
| PTSD of Clinical Concern | |||||||||||||||
| No | 274 (83.8) | 241 (86.4) | 333 (83.9) | 22 (88) | 21 (91.3) | 23 (92.0) | 59 (92.2) | 35 (92.1) | 63 (90.0) | 181 (83.4) | 176 (85.4) | 203 (81.5) | 12 (57.1) | 9 (75.0) | 43 (81.1) |
| Yes | 53 (16.2) | 38 (13.6) | 64 (16.1) | 3 (12) | 2 (8.7) | 2 (8.0) | 5 (7.8) | 3 (7.9) | 7 (10.0) | 36 (16.6) | 30 (14.6) | 46 (18.5) | 9 (42.9) | 3 (25.0) | 10 (18.9) |
| MHOs | 2020 Median (Q1-Q3) | 2021 Median (Q1-Q3) | 2022 Median (Q1-Q3) | 2020 Mean (±SD) | 2021 Mean (±SD) | 2022 Mean (±SD) | |||||||||
| All HCWs | n = 327 | n = 279 | n = 397 | n = 327 | n = 279 | n = 397 | |||||||||
| Depression | 2 (0–5) | 2 (0–5) | 2 (1–5) | 3.3 ± 3.6 | 3.5 ± 4 | 3.7 ± 3.9 | |||||||||
| Anxiety | 2 (1–4) | 2 (0–4) | 2 (1–5) | 3.1 ± 3.3 | 2.7 ± 3.3 | 3.4 ± 3.6 | |||||||||
| Stress | 3 (1–6) | 3 (1–6) | 4 (2–7) | 3.8 ± 3.5 | 3.8 ± 3.6 | 4.6 ± 3.8 | |||||||||
| PTSD | 7 (2–18) | 7 (2–16) | 9 (2–20) | 12.3 ± 14.5 | 11.1 ± 12.8 | 12.7 ± 12.8 | |||||||||
| Senior doctors | n = 25 | n = 23 | n = 25 | n = 25 | n = 23 | n = 25 | |||||||||
| Depression | 1 (0–5) | 2 (0–6) | 2 (1–5) | 3.0 ± 4.4 | 4.2 ± 5.5 | 3.5 ± 3.4 | |||||||||
| Anxiety | 1 (0–2) | 1 (0–3) | 1 (0–4) | 1.4 ± 1.8 | 1.4 ± 1.8 | 2.2 ± 3.0 | |||||||||
| Stress | 2 (1–5) | 3 (1–6) | 4 (1–6) | 3.7 ± 3.4 | 3.5 ± 3.4 | 4.2 ± 3.5 | |||||||||
| PTSD | 6 (1–9) | 3 (0–10) | 3 (0–11) | 8.7 ± 10.4 | 6.5 ± 8.4 | 7.5 ± 9.1 | |||||||||
| Junior doctors | n = 64 | n = 38 | n = 70 | n = 64 | n = 38 | n = 70 | |||||||||
| Depression | 1.5 (0–4) | 3 (1–5) | 2 (0–5) | 2.7 ± 4.0 | 3.6 ± 4.0 | 3.3 ± 4.1 | |||||||||
| Anxiety | 2 (1–4) | 1 (0–3) | 2 (0–4) | 2.5 ± 3.0 | 2.0 ± 2.9 | 2.4 ± 2.5 | |||||||||
| Stress | 3 (1–5.5) | 4 (1–6) | 3.5 (1–6) | 3.5 ± 3.4 | 4.2 ± 3.6 | 4.3 ± 3.8 | |||||||||
| PTSD | 5 (1–9.5) | 4 (1–10) | 4.5 (0–16) | 8.6 ± 13.7 | 9.0 ± 13.9 | 9.5 ± 11.7 | |||||||||
| Nurses | n = 217 | n = 206 | n = 249 | n = 217 | n = 206 | n = 249 | |||||||||
| Depression | 3 (1–5) | 2 (0–5) | 3 (1–6) | 3.3 ± 3.3 | 3.5 ± 3.9 | 3.8 ± 3.9 | |||||||||
| Anxiety | 2 (1–5) | 2 (0–4) | 3 (1–6) | 3.2 ± 3.2 | 2.9 ± 3.5 | 3.8 ± 3.9 | |||||||||
| Stress | 2 (1–6) | 3 (1–5) | 4 (2–7) | 3.6 ± 3.4 | 3.7 ± 3.7 | 4.7 ± 3.8 | |||||||||
| PTSD | 7 (2–19) | 8 (2–18) | 10 (3–21) | 12.5 ± 14.1 | 11.6 ± 13 | 13.6 ± 13.1 | |||||||||
| HCAs | n = 21 | n = 12 | n = 53 | n = 21 | n = 12 | n = 53 | |||||||||
| Depression | 5 (2–10) | 2 (1–5) | 2 (1–5) | 5.8 ± 4.0 | 2.9 ± 2.0 | 3.6 ± 3.7 | |||||||||
| Anxiety | 6 (3–10) | 5 (2.5–6) | 3 (1–5) | 6.0 ± 4.1 | 4.6 ± 2.3 | 3.9 ± 3.5 | |||||||||
| Stress | 7 (4–9) | 4.5 (4–6) | 3 (2–6) | 6.7 ± 4.0 | 4.8 ± 1.9 | 4.4 ± 3.9 | |||||||||
| PTSD | 22 (13–45) | 15 (11–23.5) | 14 (6–20) | 25.1 ± 17.5 | 17.3 ± 9.7 | 15.5 ± 13.1 | |||||||||
| Depression | Anxiety | Stress | PTSD of Clinical Concern | |||||
|---|---|---|---|---|---|---|---|---|
| OR (95% CI) | p-Value | OR (95% CI) | p-Value | OR (95% CI) | p-Value | OR (95% CI) | p-Value | |
| Survey Year (Ref: 2020) | ||||||||
| 2021 | 0.88 (0.62, 1.24) | 0.461 | 0.76 (0.56, 1.02) | 0.071 | 0.84 (0.55, 1.28) | 0.412 | 0.70 (0.44, 1.11) | 0.130 |
| 2022 | 0.62 (0.38, 1.01) | 0.055 | 0.78 (0.49, 1.24) | 0.289 | 0.75 (0.37, 1.52) | 0.426 | 0.70 (0.35, 1.38) | 0.301 |
| Gender (Ref: Male) | ||||||||
| Female | 1.04 (0.68, 1.59) | 0.876 | 1.86 (1.20, 2.89) | 0.005 | 1.30 (0.77, 2.20) | 0.330 | 1.56 (0.84, 2.89) | 0.162 |
| Age group (Ref: 21–30) | ||||||||
| 31–40 | 1.21 (0.79, 1.84) | 0.382 | 0.66 (0.45, 0.97) | 0.036 | 0.90 (0.54, 1.51) | 0.692 | 0.68 (0.4, 1.15) | 0.147 |
| ≥41 | 1.76 (0.84, 3.71) | 0.135 | 0.93 (0.44, 1.95) | 0.847 | 0.62 (0.25, 1.55) | 0.306 | 1.00 (0.43, 2.29) | 0.990 |
| Ethnicity (Ref: Chinese) | ||||||||
| Filipino | 0.72 (0.42, 1.21) | 0.212 | 0.69 (0.41, 1.16) | 0.165 | 0.51 (0.25, 1.02) | 0.058 | 0.97 (0.49, 1.92) | 0.925 |
| Others | 1.11 (0.72, 1.72) | 0.641 | 1.24 (0.82, 1.87) | 0.306 | 1.08 (0.64, 1.82) | 0.779 | 1.69 (0.96, 2.96) | 0.069 |
| Marital status (Ref: Single/divorced/widowed) | ||||||||
| Married | 0.70 (0.49, 1.02) | 0.060 | 0.92 (0.64, 1.32) | 0.648 | 1.16 (0.72, 1.87) | 0.538 | 1.45 (0.91, 2.30) | 0.117 |
| Occupation (Ref: Senior doctors) | ||||||||
| Junior doctors | 0.43 (0.19, 0.99) | 0.048 | 0.67 (0.31, 1.46) | 0.312 | 0.65 (0.2, 2.14) | 0.475 | 0.68 (0.22, 2.10) | 0.503 |
| Nurses | 0.63 (0.29, 1.38) | 0.246 | 1.00 (0.48, 2.10) | 0.999 | 0.86 (0.27, 2.75) | 0.804 | 0.98 (0.34, 2.87) | 0.976 |
| HCAs | 1.07 (0.42, 2.73) | 0.886 | 2.29 (0.97, 5.40) | 0.058 | 1.60 (0.43, 5.90) | 0.482 | 2.33 (0.72, 7.60) | 0.159 |
| Number of years in occupation | 0.94 (0.90, 0.98) | 0.005 | 0.97 (0.93, 1.01) | 0.100 | 0.95 (0.9, 1.01) | 0.098 | 0.96 (0.91, 1.00) | 0.06 |
| Psychiatric history | 3.75 (1.41, 9.96) | 0.008 | 1.56 (0.48, 5.08) | 0.460 | 3.20 (1.15, 8.92) | 0.027 | 0.91 (0.24, 3.48) | 0.895 |
| Living with elderly | 1.82 (1.20, 2.77) | 0.005 | 1.44 (0.95, 2.19) | 0.090 | 1.71 (1.08, 2.70) | 0.022 | 2.12 (1.32, 3.40) | 0.002 |
| Family infected by Covid | 1.28 (0.82, 1.98) | 0.275 | 1.23 (0.80, 1.89) | 0.349 | 1.01 (0.59, 1.73) | 0.978 | 0.96 (0.53, 1.74) | 0.897 |
| Workplace support | 0.74 (0.57, 0.96) | 0.021 | 1.09 (0.85, 1.40) | 0.496 | 1.13 (0.81, 1.57) | 0.479 | 1.02 (0.74, 1.40) | 0.925 |
| Social connected | 0.5 (0.38, 0.64) | <0.001 | 0.67 (0.52, 0.85) | 0.001 | 0.57 (0.44, 0.75) | <0.001 | 0.52 (0.39, 0.7) | <0.001 |
| Concerns about infection | 1.15 (0.93, 1.41) | 0.200 | 1.31 (1.06, 1.62) | 0.011 | 0.91 (0.71, 1.17) | 0.455 | 1.48 (1.15, 1.92) | 0.003 |
| Concerns about working environment | 1.21 (1.03, 1.44) | 0.024 | 1.28 (1.08, 1.51) | 0.004 | 1.14 (0.93, 1.41) | 0.204 | 1.16 (0.92, 1.47) | 0.213 |
| Concerns about workload | 1.46 (1.19, 1.79) | <0.001 | 1.22 (1.00, 1.48) | 0.050 | 1.9 (1.41, 2.55) | <0.001 | 1.64 (1.25, 2.15) | <0.001 |
| Agreed religion help cope with stress | 0.84 (0.53, 1.32) | 0.448 | 1.18 (0.76, 1.82) | 0.466 | 0.59 (0.34, 1.03) | 0.063 | 0.70 (0.37, 1.30) | 0.259 |
| Agreed exercise help cope with stress | 0.91 (0.57, 1.44) | 0.678 | 0.99 (0.64, 1.54) | 0.972 | 0.99 (0.52, 1.88) | 0.965 | 0.65 (0.38, 1.13) | 0.127 |
| Feel respected | 0.63 (0.42, 0.95) | 0.026 | 0.56 (0.38, 0.84) | 0.005 | 0.56 (0.34, 0.93) | 0.026 | 0.69 (0.41, 1.18) | 0.173 |
Publisher’s Note: MDPI stays neutral with regard to jurisdictional claims in published maps and institutional affiliations. |
© 2022 by the authors. Licensee MDPI, Basel, Switzerland. This article is an open access article distributed under the terms and conditions of the Creative Commons Attribution (CC BY) license (https://creativecommons.org/licenses/by/4.0/).
Share and Cite
Th’ng, F.; Rao, K.A.; Ge, L.; Neo, H.N.; Molina, J.A.D.; Lim, W.Y.; Mao, D. Longitudinal Study Comparing Mental Health Outcomes in Frontline Emergency Department Healthcare Workers through the Different Waves of the COVID-19 Pandemic. Int. J. Environ. Res. Public Health 2022, 19, 16878. https://doi.org/10.3390/ijerph192416878
Th’ng F, Rao KA, Ge L, Neo HN, Molina JAD, Lim WY, Mao D. Longitudinal Study Comparing Mental Health Outcomes in Frontline Emergency Department Healthcare Workers through the Different Waves of the COVID-19 Pandemic. International Journal of Environmental Research and Public Health. 2022; 19(24):16878. https://doi.org/10.3390/ijerph192416878
Chicago/Turabian StyleTh’ng, Francesca, Kailing Adriel Rao, Lixia Ge, Hwee Nah Neo, Joseph Antonio De Molina, Wei Yang Lim, and Desmond Mao. 2022. "Longitudinal Study Comparing Mental Health Outcomes in Frontline Emergency Department Healthcare Workers through the Different Waves of the COVID-19 Pandemic" International Journal of Environmental Research and Public Health 19, no. 24: 16878. https://doi.org/10.3390/ijerph192416878
APA StyleTh’ng, F., Rao, K. A., Ge, L., Neo, H. N., Molina, J. A. D., Lim, W. Y., & Mao, D. (2022). Longitudinal Study Comparing Mental Health Outcomes in Frontline Emergency Department Healthcare Workers through the Different Waves of the COVID-19 Pandemic. International Journal of Environmental Research and Public Health, 19(24), 16878. https://doi.org/10.3390/ijerph192416878