
Effects of Low/Medium-Intensity Exercise on Fat Metabolism after a 6-h Fast


Abstract
1. Introduction
2. Materials and Methods
2.1. Subjects
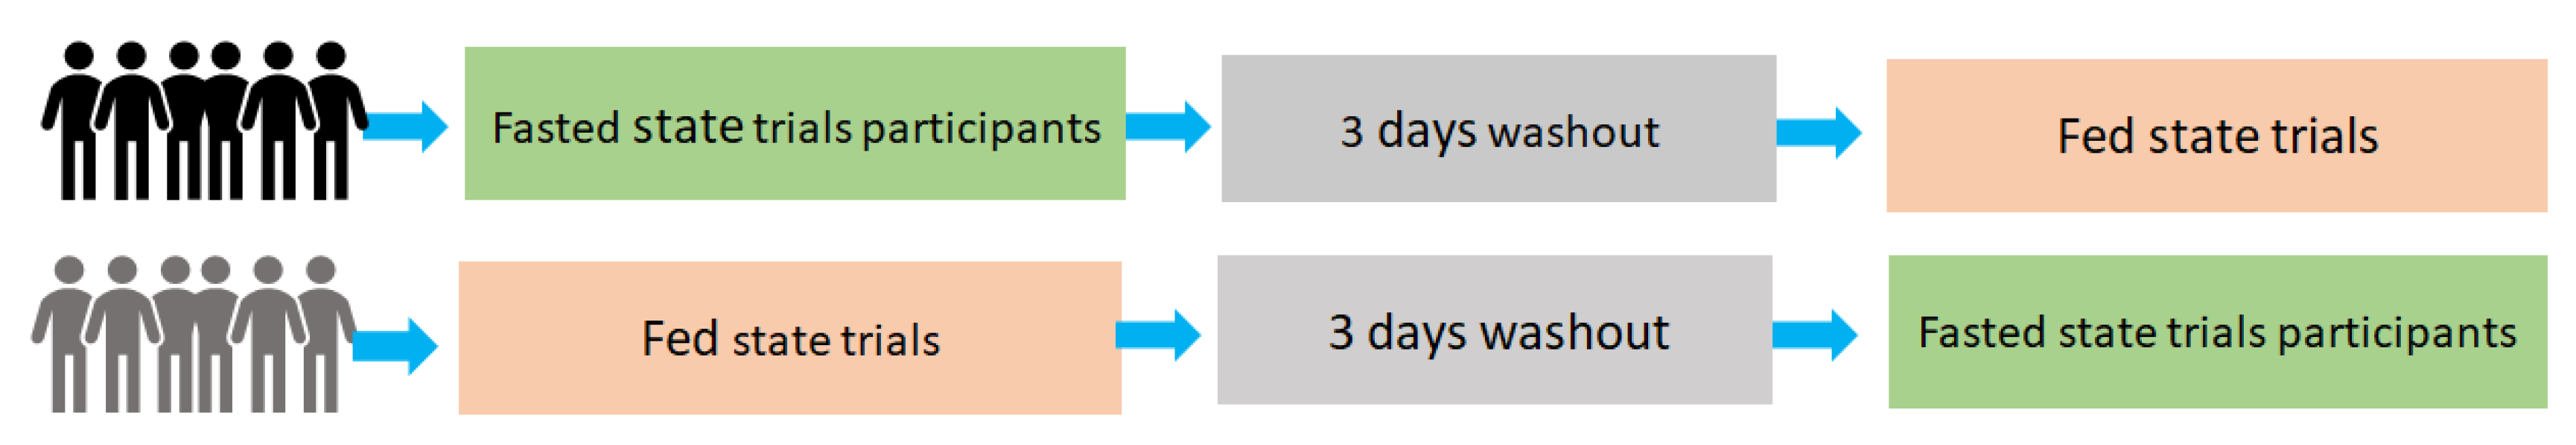
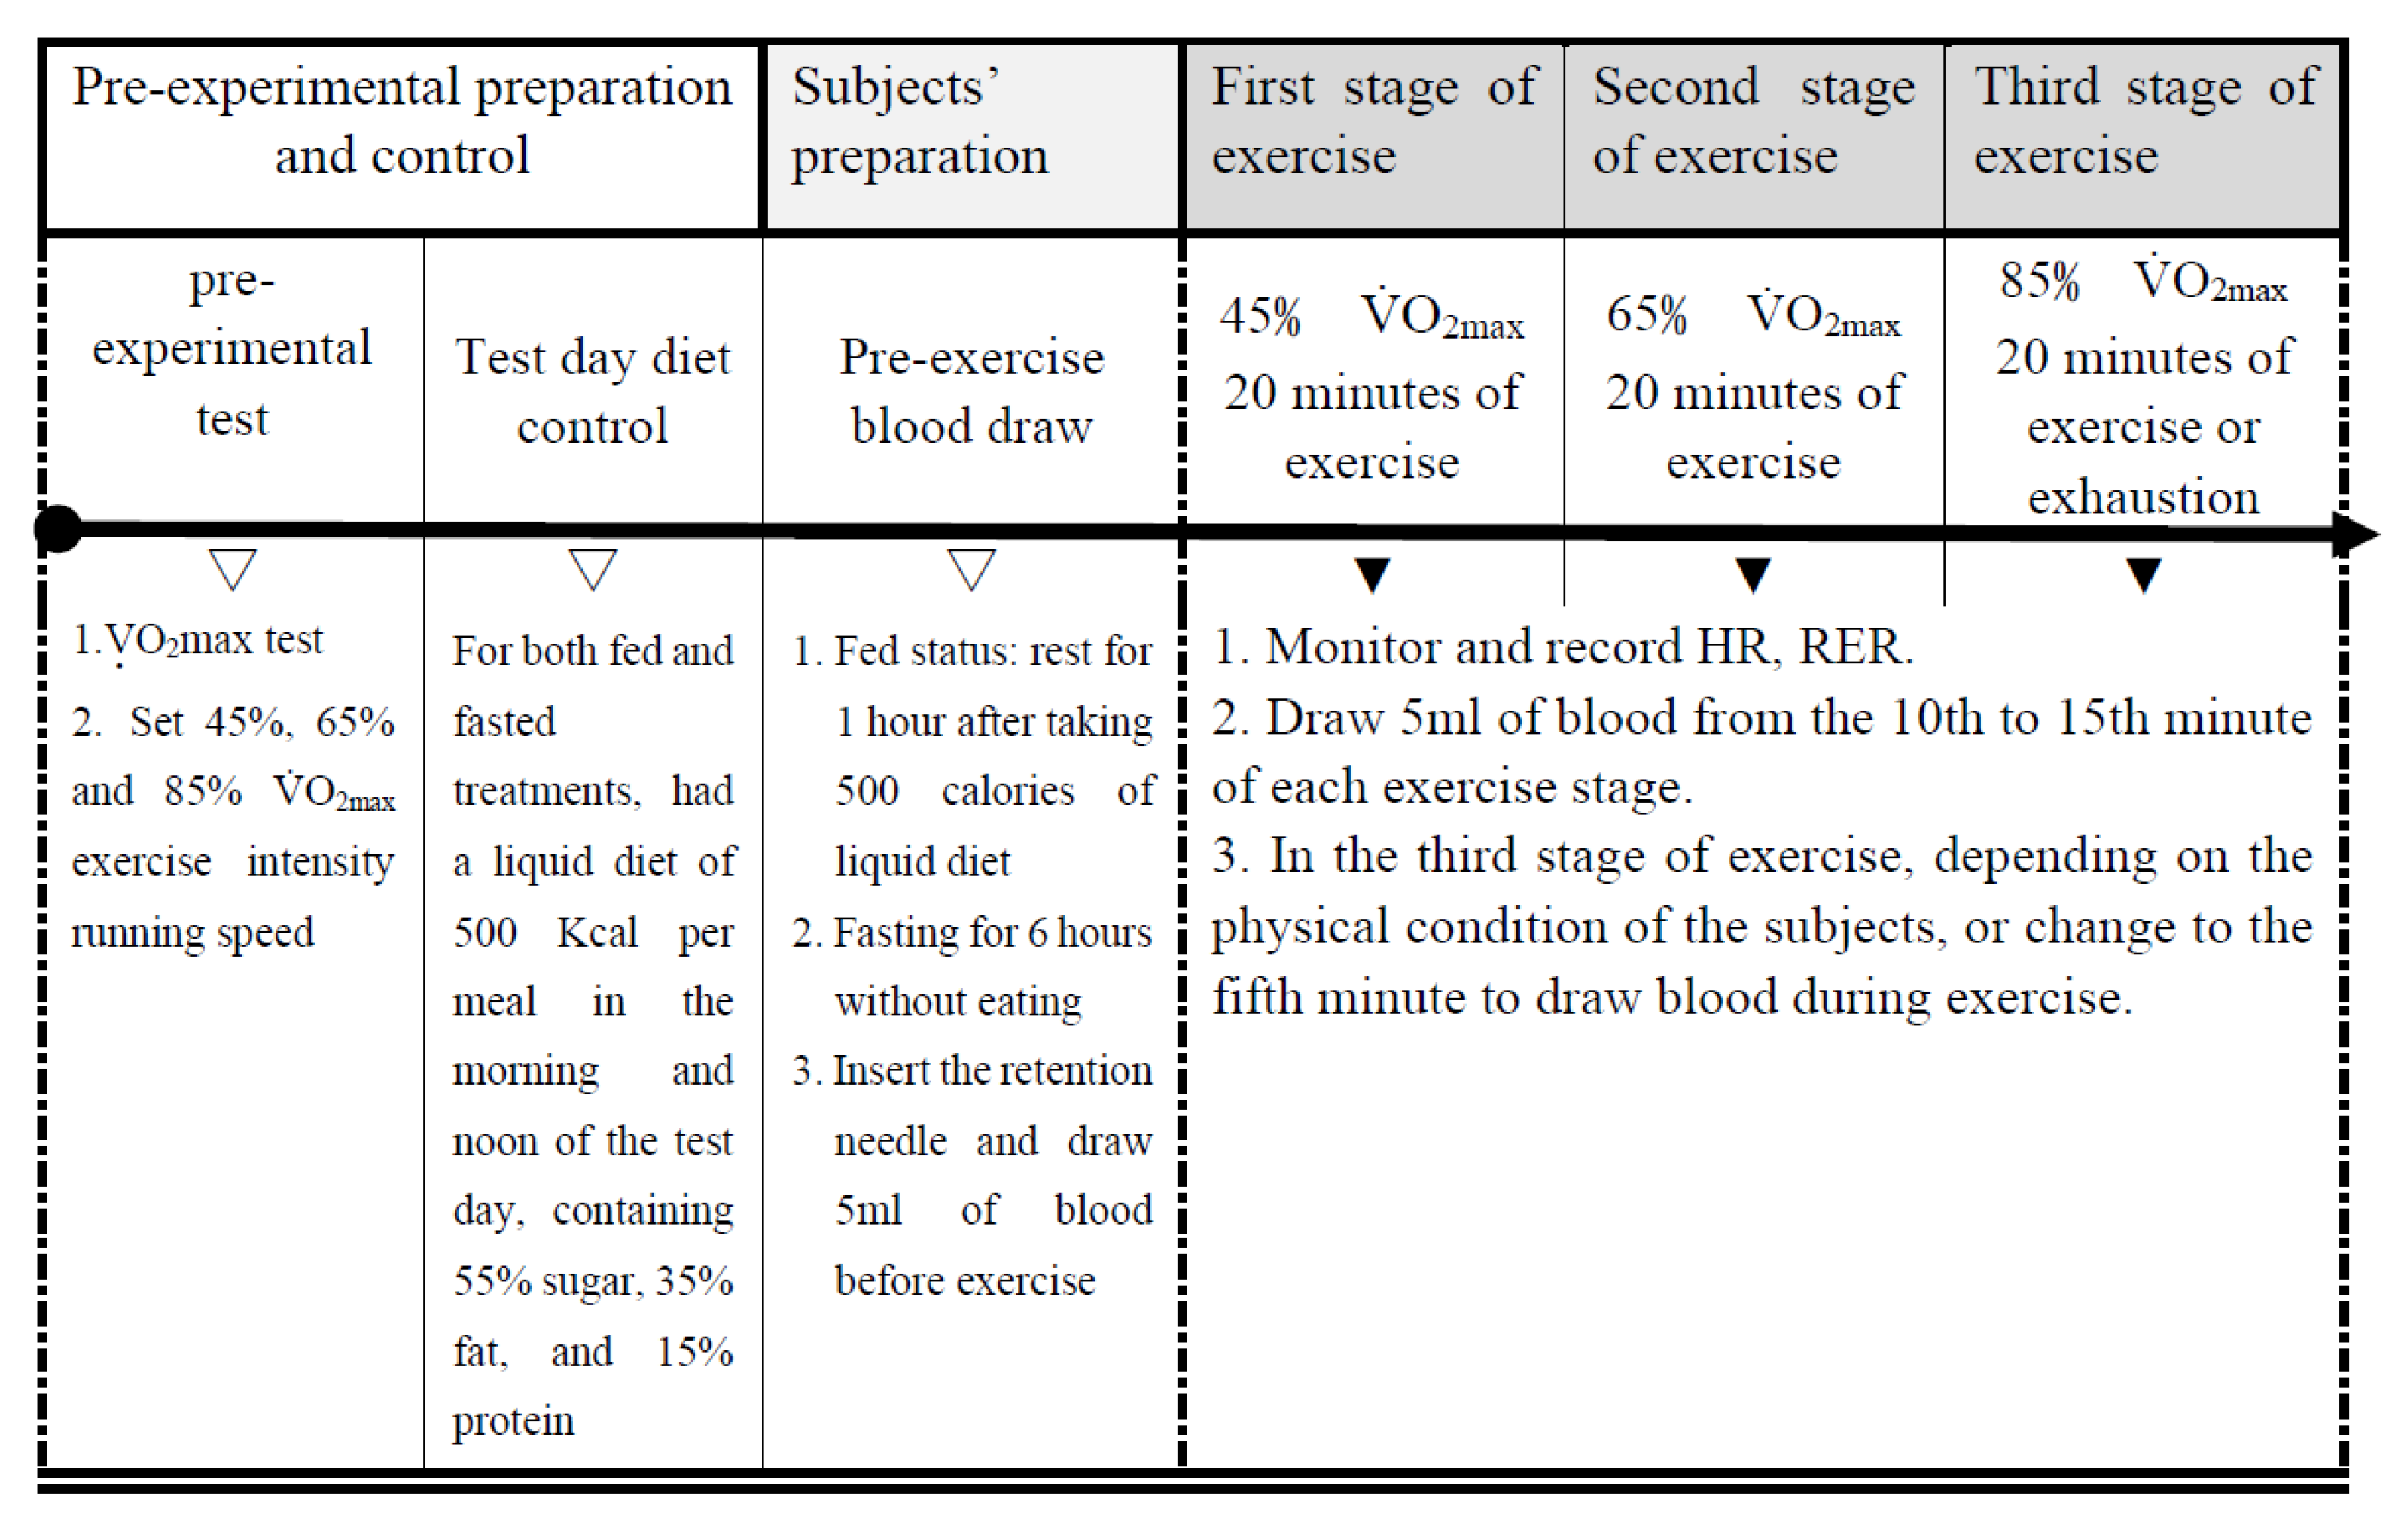
2.2. Exercise Trials
2.3. VO2max Estimation before the Experiments
2.4. Determination of VO2max
- (1)
- When the intensity of the exercise load increases, the oxygen uptake no longer increases or the increase is less than 150 mL/min;
- (2)
- The heart rate reaches ±10 beats/min of the maximum predicted value;
- (3)
- The respiratory exchange rate is greater than 1.1;
- (4)
- The ventilation volume per minute is more than 110 L.
2.5. The Treadmill Speed and the Grade
2.6. Diet Controls
2.7. Sample Collection
2.8. Statistical Analysis
3. Results
4. Discussion
5. Conclusions
Author Contributions
Funding
Institutional Review Board Statement
Informed Consent Statement
Data Availability Statement
Acknowledgments
Conflicts of Interest
References
- Kim, J.; Park, J.; Lim, K. Nutrition Supplements to Stimulate Lipolysis: A Review in Relation to Endurance Exercise Capacity. J. Nutr. Sci. Vitaminol. 2016, 62, 141–161. [Google Scholar] [CrossRef] [PubMed]
- Richter, E.A.; Hargreaves, M. Exercise, GLUT4, and skeletal muscle glucose uptake. Physiol. Rev. 2013, 93, 993–1017. [Google Scholar] [CrossRef] [PubMed]
- Jeukendrup, A.E.; Wallis, G.A. Measurement of substrate oxidation during exercise by means of gas exchange measurements. Int. J. Sport. Med. 2005, 26 (Suppl. S1), S28–S37. [Google Scholar] [CrossRef] [PubMed]
- Péronnet, F.; Massicotte, D. Table of nonprotein respiratory quotient: An update. Can. J. Sport Sci. J. Can. Des. Sci. Du Sport 1991, 16, 23–29. [Google Scholar]
- Aird, T.P.; Davies, R.W.; Carson, B.P. Effects of fasted vs fed-state exercise on performance and post-exercise metabolism: A systematic review and meta-analysis. Scand. J. Med. Sci. Sport. 2018, 28, 1476–1493. [Google Scholar] [CrossRef]
- Carter, S.; Clifton, P.M.; Keogh, J.B. The effects of intermittent compared to continuous energy restriction on glycaemic control in type 2 diabetes; a pragmatic pilot trial. Diabetes Res. Clin. Pract. 2016, 122, 106–112. [Google Scholar] [CrossRef]
- Wegman, M.P.; Guo, M.H.; Bennion, D.M.; Shankar, M.N.; Chrzanowski, S.M.; Goldberg, L.A.; Xu, J.; Williams, T.A.; Lu, X.; Hsu, S.I.; et al. Practicality of intermittent fasting in humans and its effect on oxidative stress and genes related to aging and metabolism. Rejuvenation Res. 2015, 18, 162–172. [Google Scholar] [CrossRef]
- Maughan, R.J.; Fallah, J.; Coyle, E.F. The effects of fasting on metabolism and performance. Br. J. Sport. Med. 2010, 44, 490–494. [Google Scholar] [CrossRef]
- Goldstein, I.; Hager, G.L. Transcriptional and Chromatin Regulation during Fasting—The Genomic Era. Trends Endocrinol. Metab. TEM 2015, 26, 699–710. [Google Scholar] [CrossRef]
- Pellegrini, M.; Cioffi, I.; Evangelista, A.; Ponzo, V.; Goitre, I.; Ciccone, G.; Ghigo, E.; Bo, S. Effects of time-restricted feeding on body weight and metabolism. A systematic review and meta-analysis. Rev. Endocr. Metab. Disord. 2020, 21, 17–33. [Google Scholar] [CrossRef]
- Björkman, O.; Eriksson, L.S. Splanchnic glucose metabolism during leg exercise in 60-hour-fasted human subjects. Am. J. Physiol. 1983, 245, E443–E448. [Google Scholar] [CrossRef] [PubMed]
- Avakian, E.V.; Horvath, S.M.; McCafferty, W.B. Effects of fasting on physiological responses to exercise in non-obese women. J. Sport. Med. Phys. Fit. 1987, 27, 303–309. [Google Scholar]
- Dohm, G.L.; Beeker, R.T.; Israel, R.G.; Tapscott, E.B. Metabolic responses to exercise after fasting. J. Appl. Physiol. 1986, 61, 1363–1368. [Google Scholar] [CrossRef] [PubMed]
- Elia, M.; Lammert, O.; Zed, C.; Neale, G. Energy metabolism during exercise in normal subjects undergoing total starvation. Human nutrition. Clin. Nutr. 1984, 38, 355–362. [Google Scholar]
- Galbo, H.; Christensen, N.J.; Mikines, K.J.; Sonne, B.; Hilsted, J.; Hagen, C.; Fahrenkrug, J. The effect of fasting on the hormonal response to graded exercise. J. Clin. Endocrinol. Metab. 1981, 52, 1106–1112. [Google Scholar] [CrossRef]
- Knapik, J.J.; Jones, B.H.; Meredith, C.; Evans, W.J. Influence of a 3.5 day fast on physical performance. Eur. J. Appl. Physiol. Occup. Physiol. 1987, 56, 428–432. [Google Scholar] [CrossRef]
- Loy, S.F.; Conlee, R.K.; Winder, W.W.; Nelson, A.G.; Arnall, D.A.; Fisher, A.G. Effects of 24-hour fast on cycling endurance time at two different intensities. J. Appl. Physiol. 1986, 61, 654–659. [Google Scholar] [CrossRef]
- Maughan, R.J.; Gleeson, M. Influence of a 36 h fast followed by refeeding with glucose, glycerol or placebo on metabolism and performance during prolonged exercise in man. Eur. J. Appl. Physiol. Occup. Physiol. 1988, 57, 570–576. [Google Scholar] [CrossRef]
- Nieman, D.C.; Carlson, K.A.; Brandstater, M.E.; Naegele, R.T.; Blankenship, J.W. Running endurance in 27-h-fasted humans. J. Appl. Physiol. 1987, 63, 2502–2509. [Google Scholar] [CrossRef]
- Zinker, B.A.; Britz, K.; Brooks, G.A. Effects of a 36-hour fast on human endurance and substrate utilization. J. Appl. Physiol. 1990, 69, 1849–1855. [Google Scholar] [CrossRef]
- Gutiérrez, A.; González-Gross, M.; Delgado, M.; Castillo, M.J. Three days fast in sportsmen decreases physical work capacity but not strength or perception-reaction time. Int. J. Sport Nutr. Exerc. Metab. 2001, 11, 420–429. [Google Scholar] [CrossRef] [PubMed]
- Dumke, C. Health-Related Physical Fitness and Testing Prescription. ACSM’s Guidelines for Exercise Testing and Prescription, 10th ed.; Diebe, D., Ehrman, J.K., Liguori, G., Magal, M., Eds.; ACSM: Indianapolis, IN, USA, 2018. [Google Scholar]
- Borg, G.A. Psychophysical bases of perceived exertion. Med. Sci. Sport. Exerc. 1982, 14, 377–381. [Google Scholar] [CrossRef]
- Chalhoub, E.; Xie, L.; Balasubramanian, V.; Kim, J.; Belovich, J. A distributed model of carbohydrate transport and metabolism in the liver during rest and high-intensity exercise. Ann. Biomed. Eng. 2007, 35, 474–491. [Google Scholar] [CrossRef] [PubMed][Green Version]
- Coyle, E.F.; Coggan, A.R.; Hemmert, M.K.; Lowe, R.C.; Walters, T.J. Substrate usage during prolonged exercise following a preexercise meal. J. Appl. Physiol. 1985, 59, 429–433. [Google Scholar] [CrossRef] [PubMed]
- Montain, S.J.; Hopper, M.K.; Coggan, A.R.; Coyle, E.F. Exercise metabolism at different time intervals after a meal. J. Appl. Physiol. 1991, 70, 882–888. [Google Scholar] [CrossRef]
- Bergman, B.C.; Brooks, G.A. Respiratory gas-exchange ratios during graded exercise in fed and fasted trained and untrained men. J. Appl. Physiol. 1999, 86, 479–487. [Google Scholar] [CrossRef]
- Kim, T.W.; Lee, S.H.; Choi, K.H.; Kim, D.H.; Han, T.K. Comparison of the effects of acute exercise after overnight fasting and breakfast on energy substrate and hormone levels in obese men. J. Phys. Ther. Sci. 2015, 27, 1929–1932. [Google Scholar] [CrossRef]
- Hansen, D.; De Strijcker, D.; Calders, P. Impact of Endurance Exercise Training in the Fasted State on Muscle Biochemistry and Metabolism in Healthy Subjects: Can These Effects be of Particular Clinical Benefit to Type 2 Diabetes Mellitus and Insulin-Resistant Patients? Sport. Med. 2017, 47, 415–428. [Google Scholar] [CrossRef]
- Edinburgh, R.M.; Koumanov, F.; Gonzalez, J.T. Impact of pre-exercise feeding status on metabolic adaptations to endurance-type exercise training. J. Physiol. 2022, 600, 1327–1338. [Google Scholar] [CrossRef]


| Age, Years | Hight, cm | Wight, kg | VO2max, mL·kg−1·min−1 |
|---|---|---|---|
| 19.9 ± 1.4 | 175 ± 3.1 | 70.1 ± 7.6 | 50.33 ± 4.0 |
| Dieted State Exercise Intensity, VO2max | Fasted State (n = 12) | Fed State (n = 12) | p Value | |
|---|---|---|---|---|
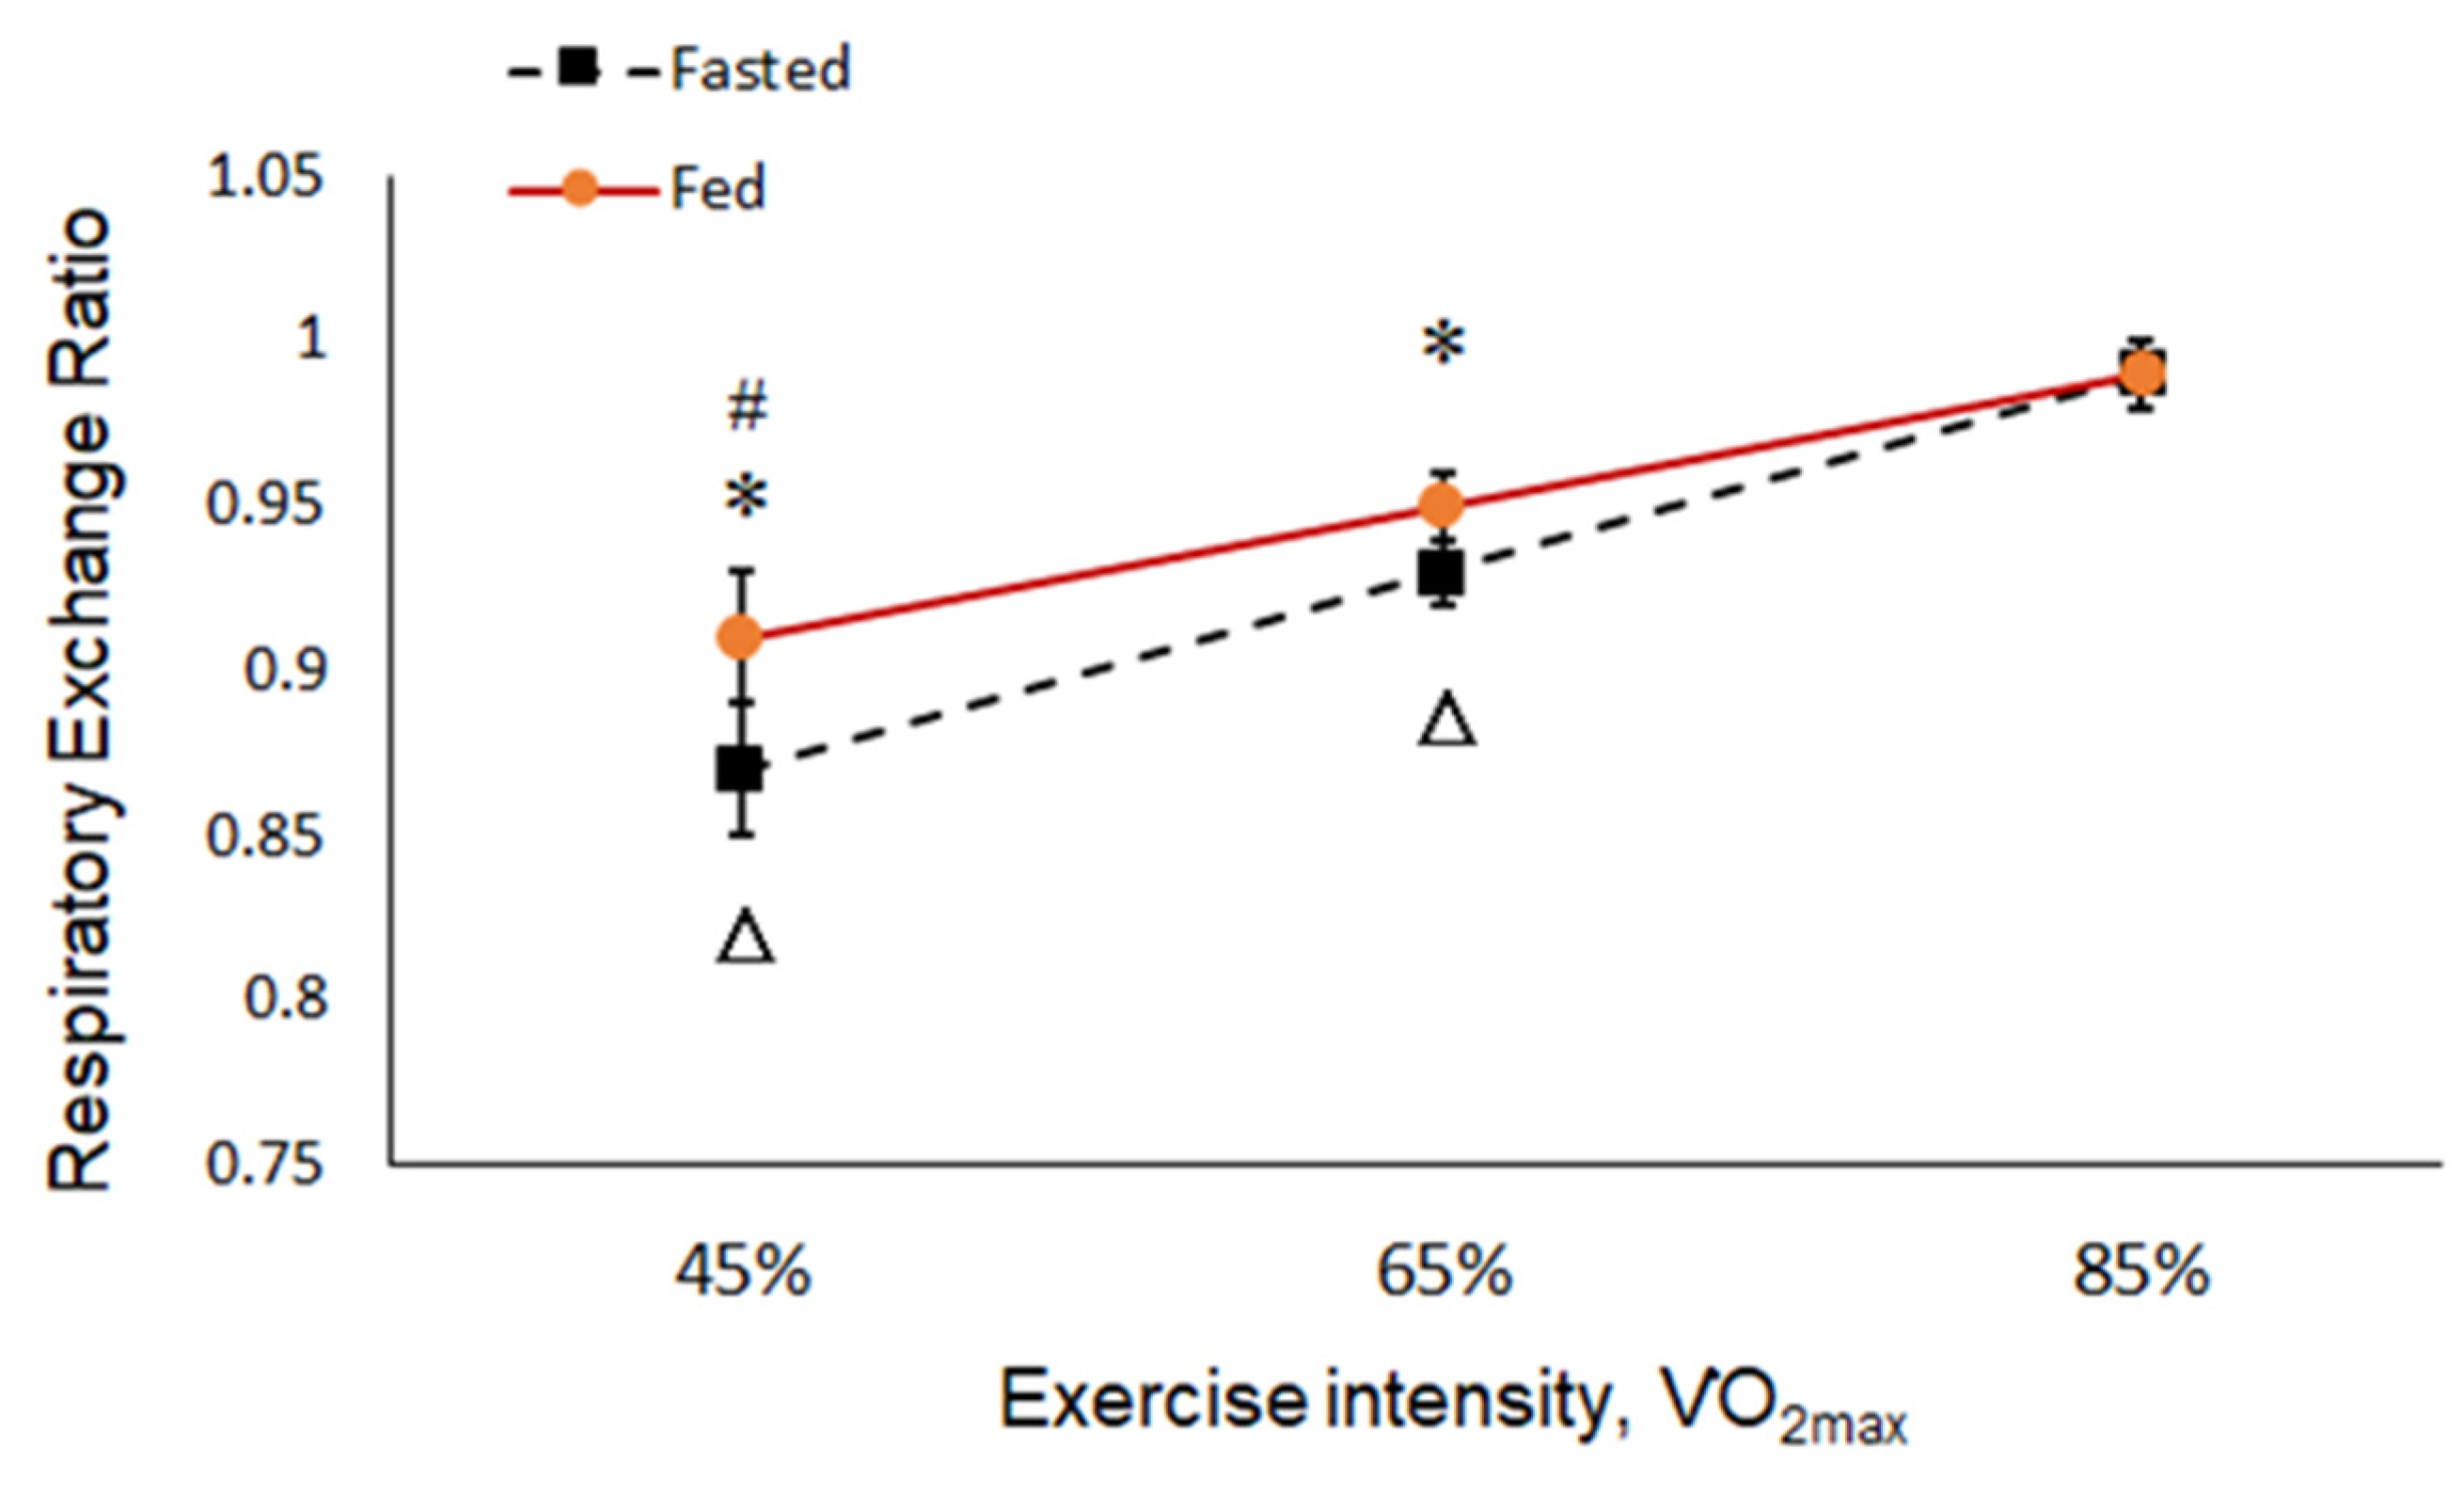
| RER | Before exercise | 0.74 ± 0.01 | 0.81 ± 0.01 | ≤0.001 |
| 45% | 0.87 ± 0.02 | 0.91 ± 0.02 | ≤0.001 | |
| 65% | 0.93 ± 0.01 | 0.95 ± 0.01 | ≤0.001 | |
| 85% | 0.99 ± 0.01 | 0.99 ± 0.01 | 0.067 | |
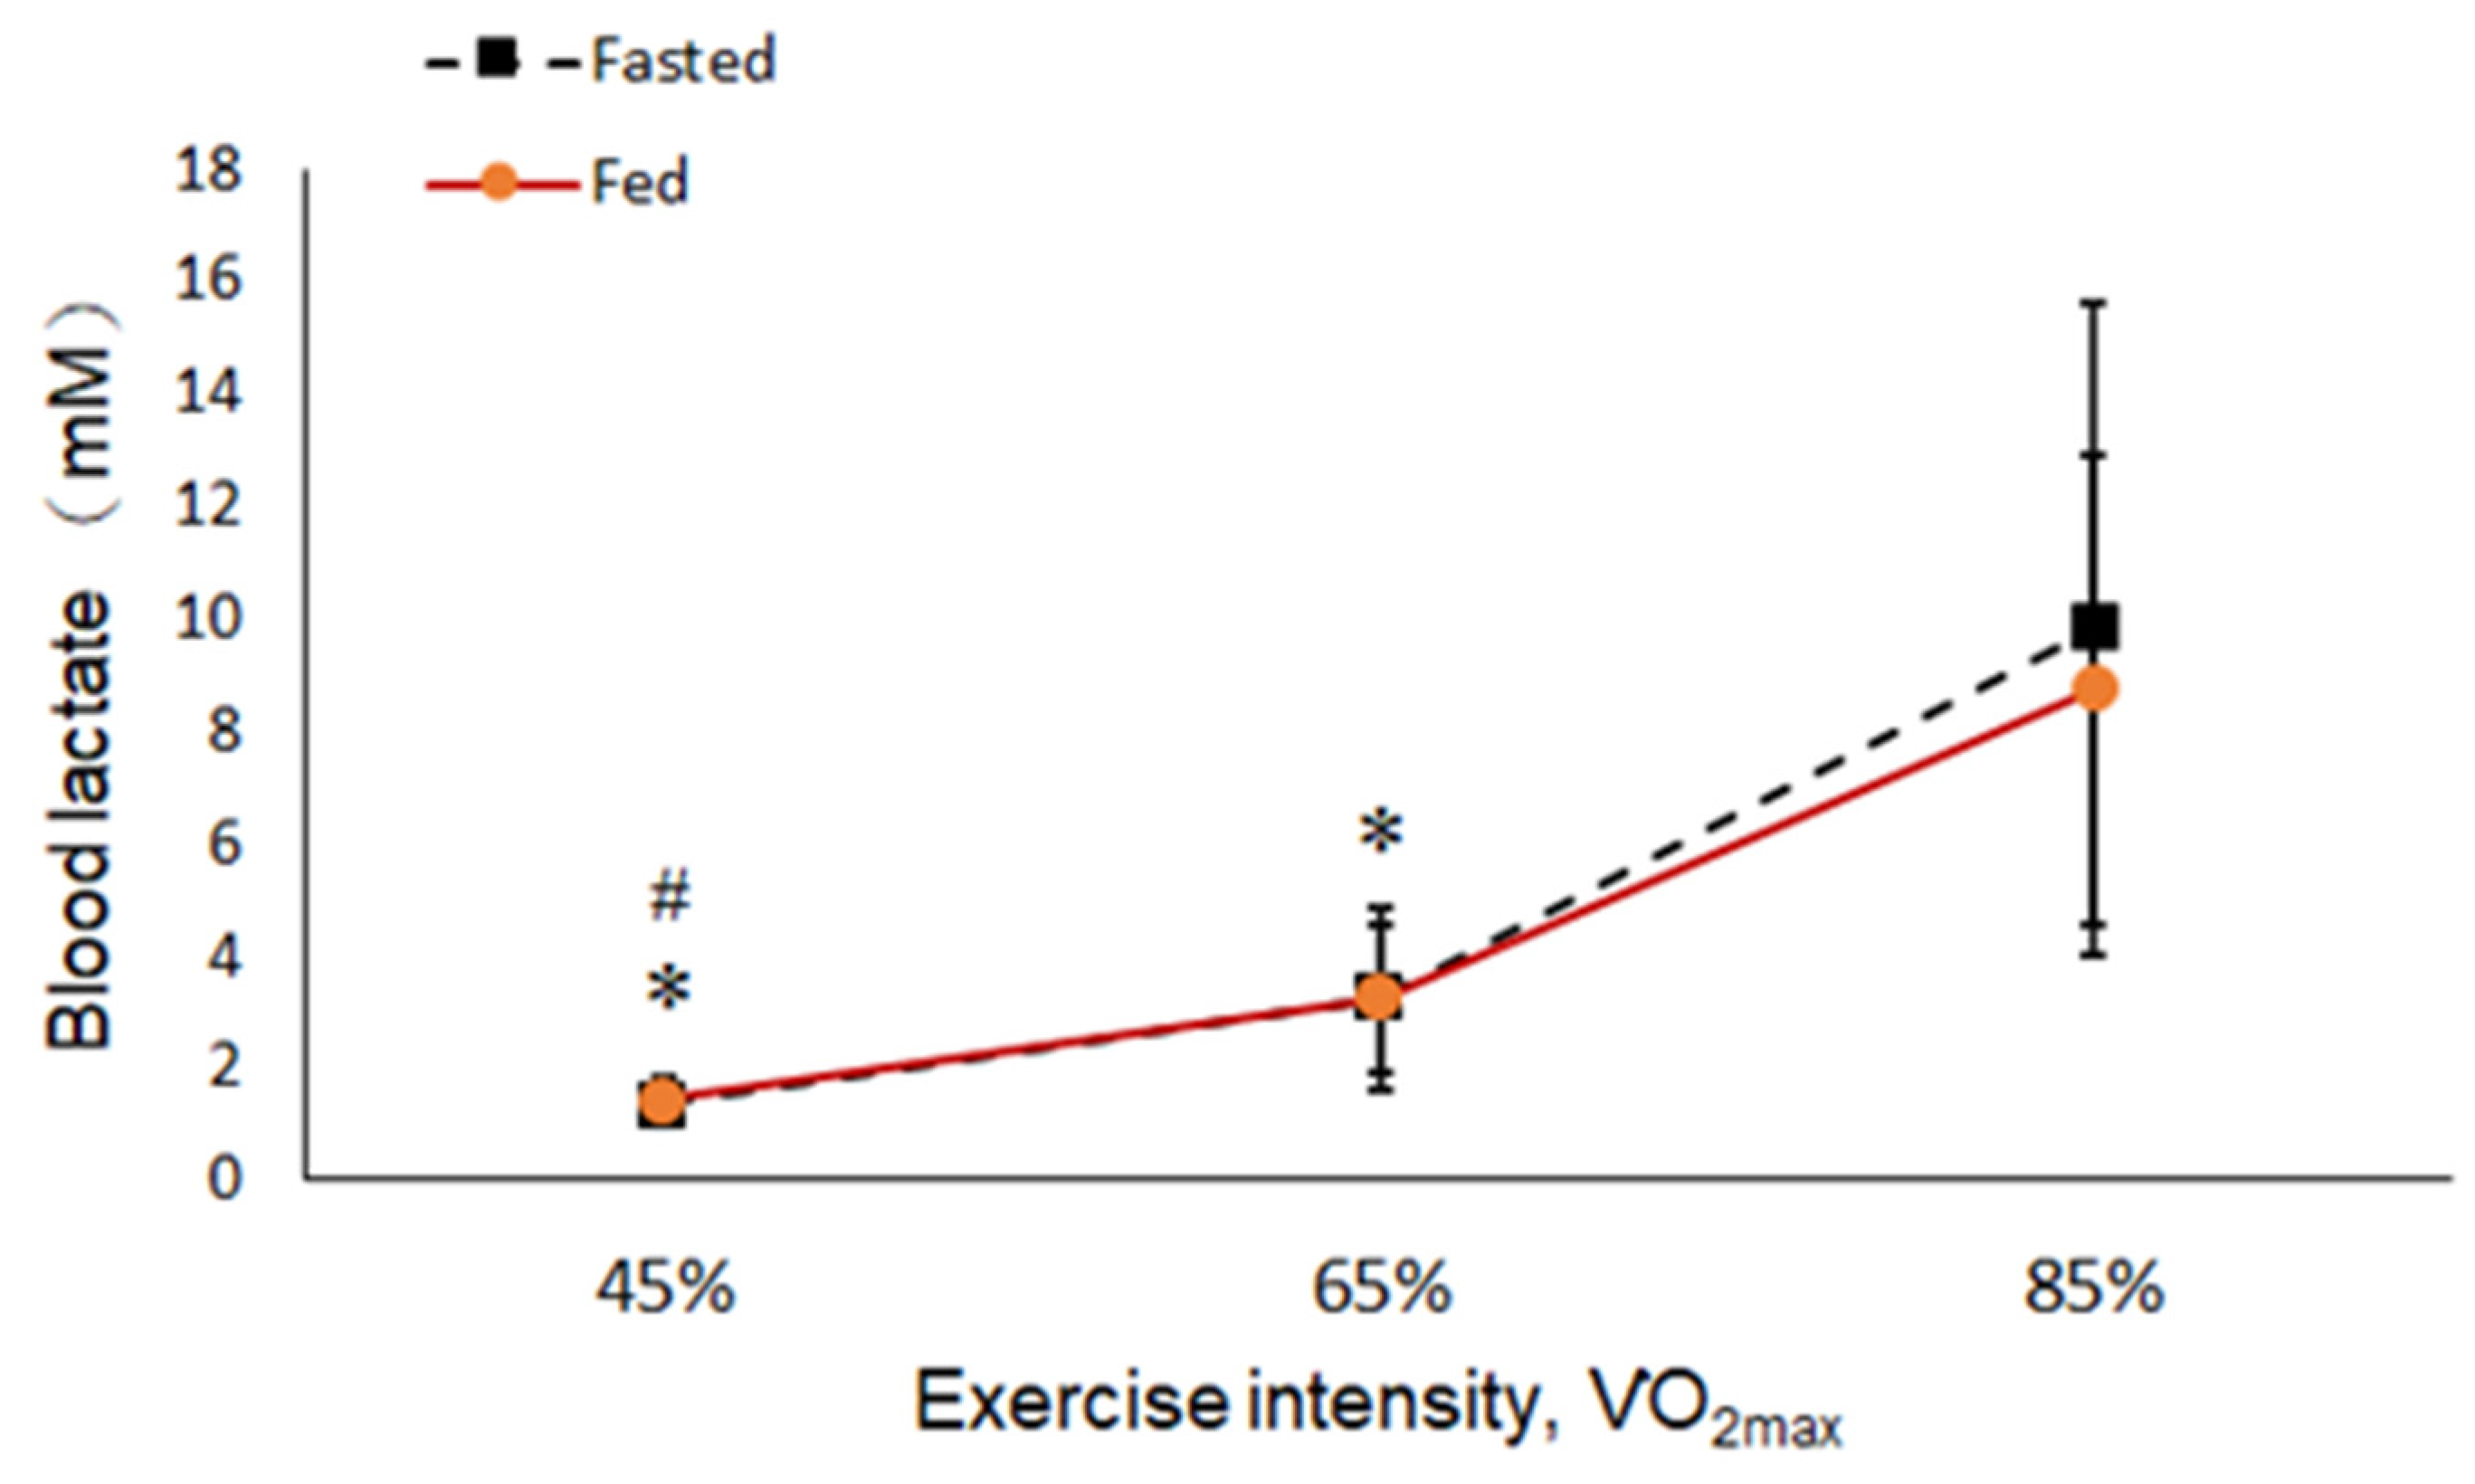
| BLA (mM) | Before exercise | 1.73 ± 0.62 | 2.18 ± 0.62 | 0.090 |
| 45% | 1.35 ± 0.35 | 1.44 ± 0.37 | 0.518 | |
| 65% | 3.25 ± 1.62 | 3.25 ± 1.32 | 0.967 | |
| 85% | 9.84 ± 5.81 | 8.75 ± 4.2 | 0.241 | |
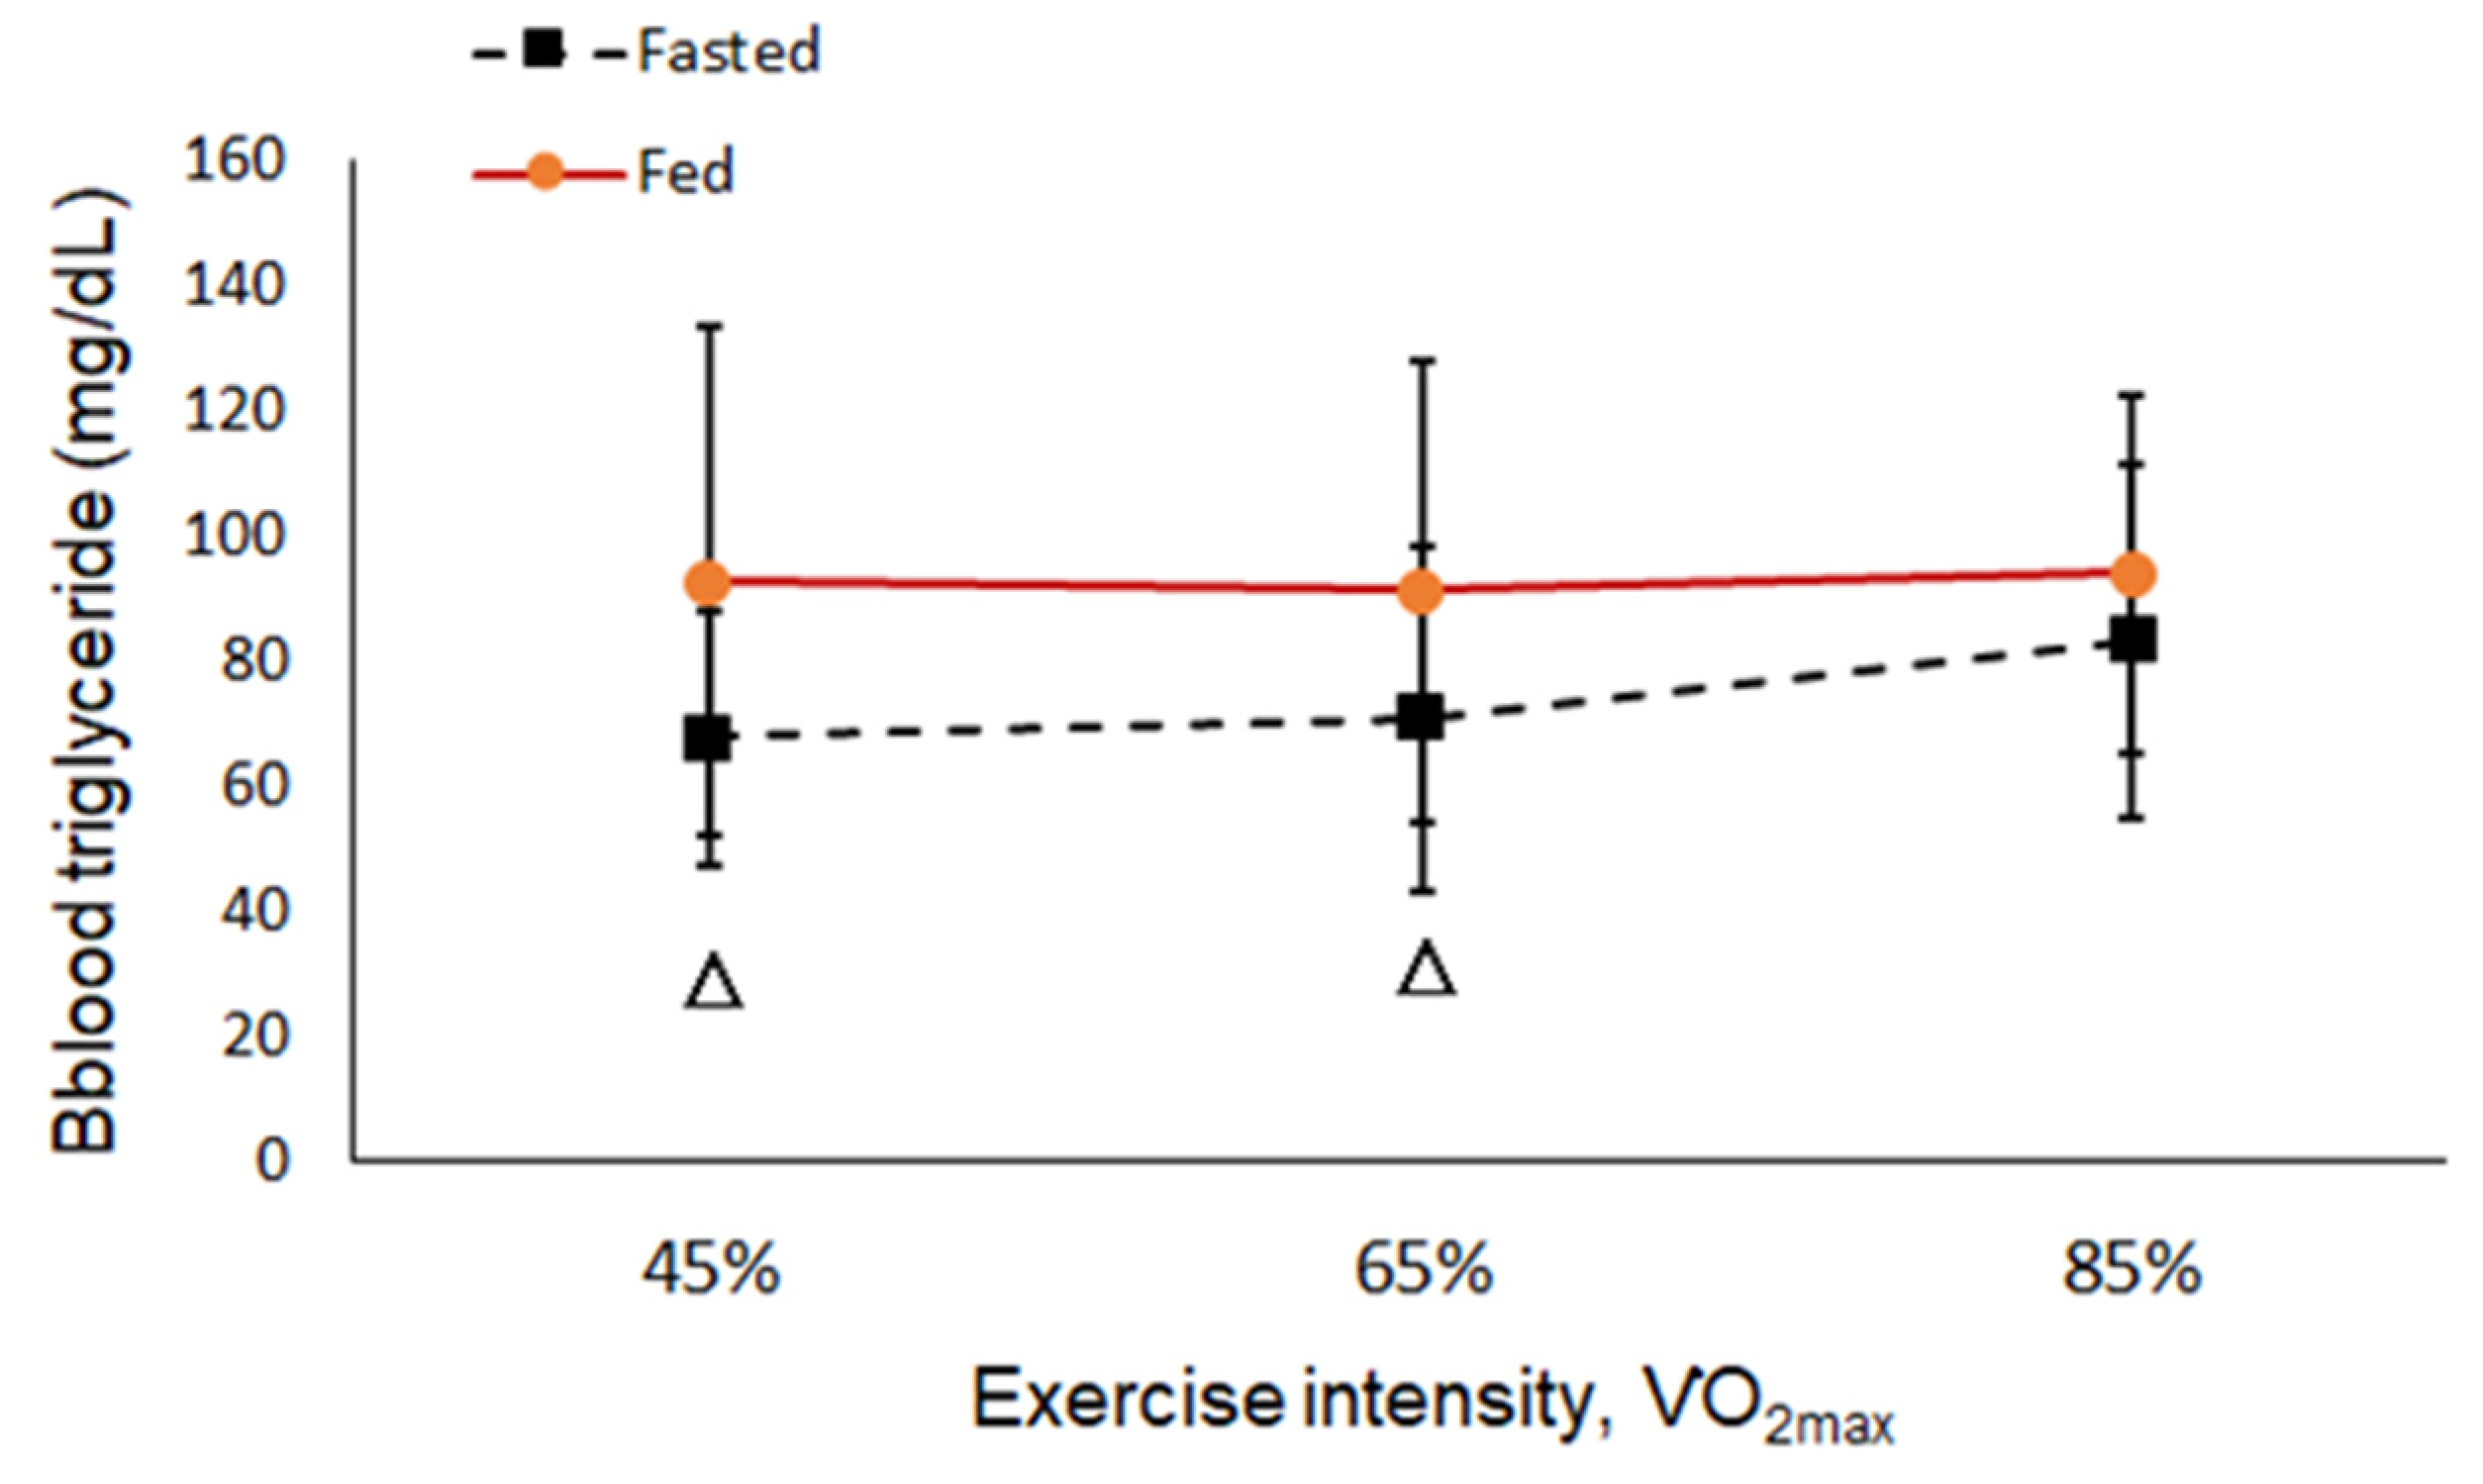
| TG (mg/dL) | Before exercise | 57.18 ± 13.4 | 67.63 ± 13.1 | 0.080 |
| 45% | 67.67 ± 20.1 | 92.67 ± 40.8 | 0.010 | |
| 65% | 70.92 ± 27.4 | 91.17 ± 36.9 | 0.019 | |
| 85%x | 83.33 ± 28.3 | 94.0 ± 28.5 | 0.250 | |
| BGLU (mg/dL) | Before exercise | 79.3 ± 10.6 | 101.5 ±17.4 | 0.002 |
| 45% | 81.9 ± 9.5 | 87.42 ± 17.6 | 0.413 | |
| 65% | 84.8 ± 19.2 | 85.8 ± 19.2 | 0.880 | |
| 85% | 122.4 ± 28.0 | 99.7 ± 22.7 | 0.019 | |
Publisher’s Note: MDPI stays neutral with regard to jurisdictional claims in published maps and institutional affiliations. |
© 2022 by the authors. Licensee MDPI, Basel, Switzerland. This article is an open access article distributed under the terms and conditions of the Creative Commons Attribution (CC BY) license (https://creativecommons.org/licenses/by/4.0/).
Share and Cite
Liu, M.-Y.; Chen, S.-Q. Effects of Low/Medium-Intensity Exercise on Fat Metabolism after a 6-h Fast. Int. J. Environ. Res. Public Health 2022, 19, 15502. https://doi.org/10.3390/ijerph192315502
Liu M-Y, Chen S-Q. Effects of Low/Medium-Intensity Exercise on Fat Metabolism after a 6-h Fast. International Journal of Environmental Research and Public Health. 2022; 19(23):15502. https://doi.org/10.3390/ijerph192315502
Chicago/Turabian StyleLiu, Ming-Yi, and Shung-Quan Chen. 2022. "Effects of Low/Medium-Intensity Exercise on Fat Metabolism after a 6-h Fast" International Journal of Environmental Research and Public Health 19, no. 23: 15502. https://doi.org/10.3390/ijerph192315502
APA StyleLiu, M.-Y., & Chen, S.-Q. (2022). Effects of Low/Medium-Intensity Exercise on Fat Metabolism after a 6-h Fast. International Journal of Environmental Research and Public Health, 19(23), 15502. https://doi.org/10.3390/ijerph192315502