
Single Leg Cycling Offsets Reduced Muscle Oxygenation in Hypoxic Environments


Abstract
1. Introduction
2. Materials and Methods
2.1. Participants
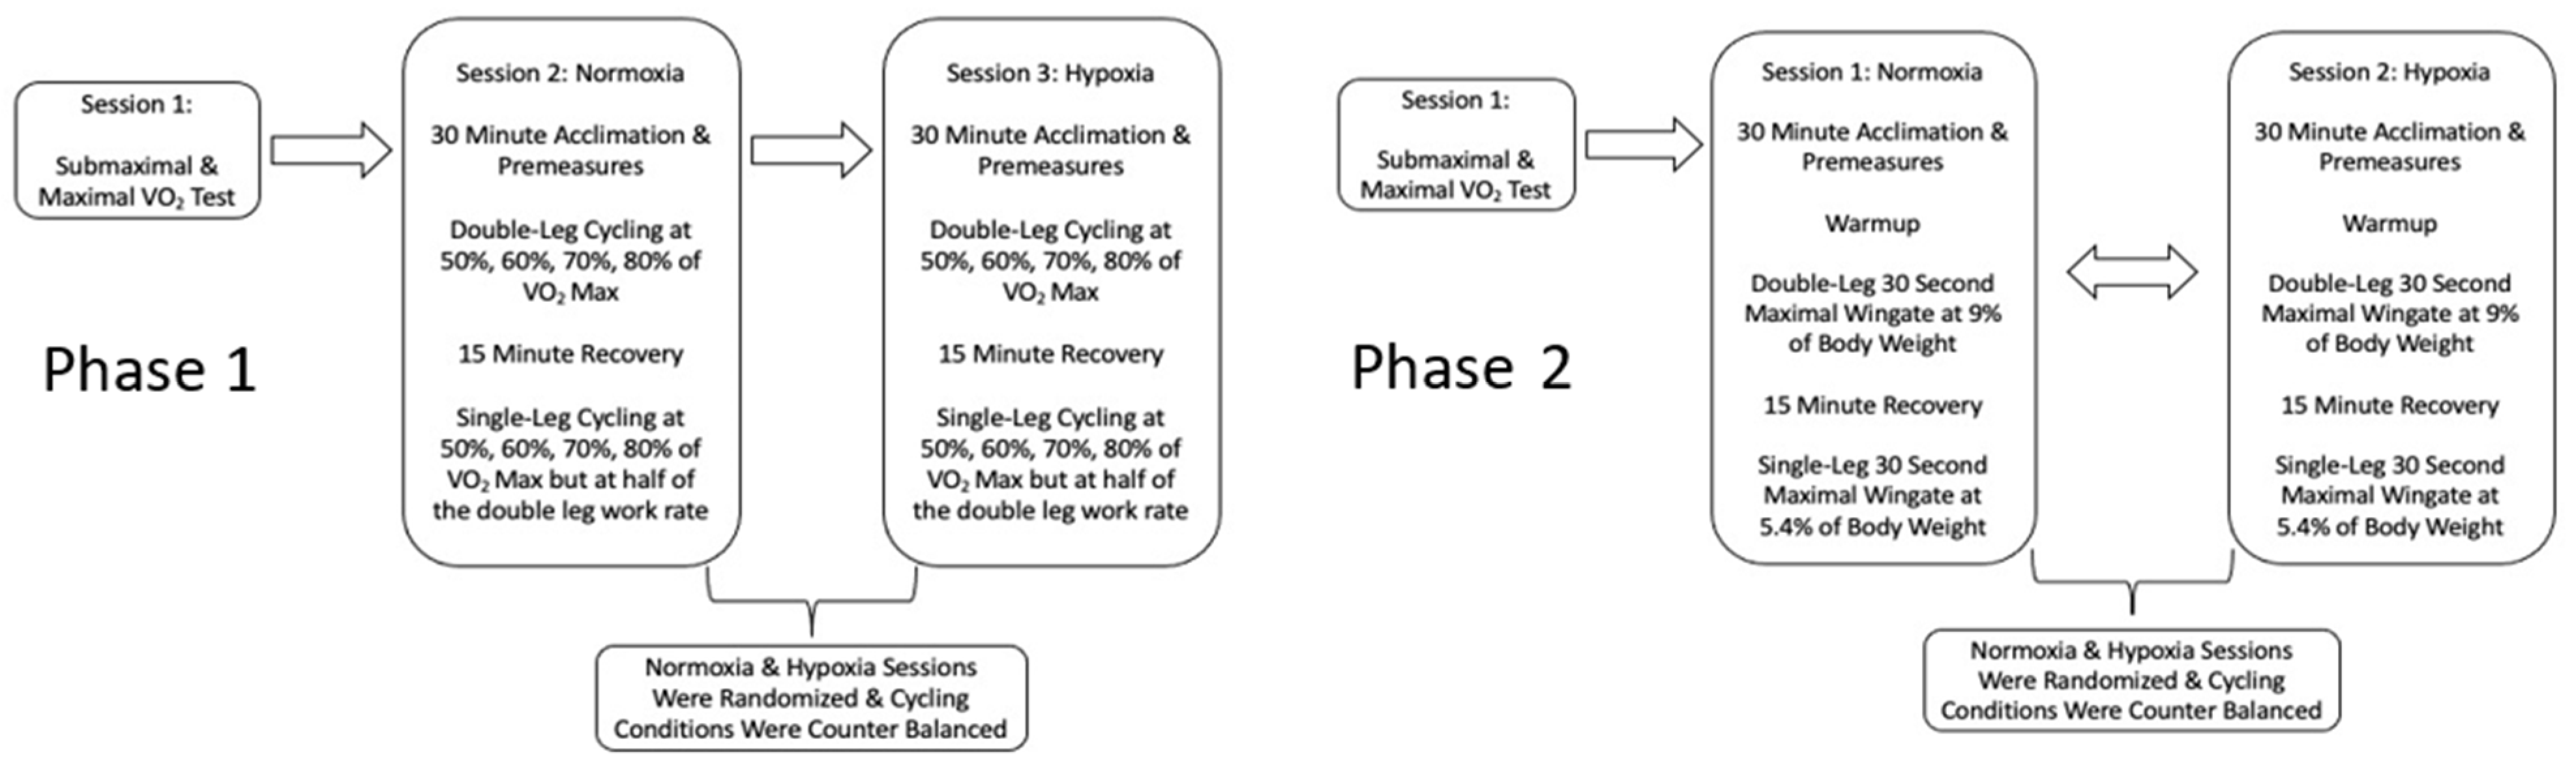
2.2. Study Design
2.3. Visit 1: Prescreening and Baseline Testing
2.4. Phase 1: Visits Two & Three
2.5. Phase 2: Visits 2 and 3
2.6. Data Analysis
3. Results
3.1. Phase 1: Submaximal Results
- Power
- Pre-exercise Values
- Exercise
- Femoral Blood Flow
- Tissue Oxygenation
- Heart Rate and Mean Arterial Pressure
- Arterial Oxygen Concentration
- Lactate
3.2. Phase 2: Wingate Results
- Power
- Muscle Oxygenation Kinetics
4. Discussion
4.1. Main Findings
4.2. Physiological Changes during Sub-Maximal Cycling
4.3. Physiological Changes during Maximal Cycling
4.4. Application and Limitations
5. Conclusions
Author Contributions
Funding
Institutional Review Board Statement
Informed Consent Statement
Data Availability Statement
Conflicts of Interest
References
- Brugniaux, J.V.; Schmitt, L.; Robach, P.; Nicolet, G.; Fouillot, J.P.; Moutereau, S.; Lasne, F.; Pialoux, V.; Saas, P.; Chorvot, M.C.; et al. Eighteen Days of “Living High, Training Low” Stimulate Erythropoiesis and Enhance Aerobic Performance in Elite Middle-Distance Runners. J. Appl. Physiol. 2006, 100, 203–211. [Google Scholar] [CrossRef]
- Hamlin, M.J.; Marshall, H.C.; Hellemans, J.; Ainslie, P.N.; Anglem, N. Effect of Intermittent Hypoxic Training on 20 Km Time Trial and 30 s Anaerobic Performance. Scand. J. Med. Sci. Sports 2010, 20, 651–661. [Google Scholar] [CrossRef]
- Levine, B.D.; Stray-Gundersen, J. “Living High-Training Low”: Effect of Moderate-Altitude Acclimatization with Low-Altitude Training on Performance. J. Appl. Physiol. 1997, 83, 102–112. [Google Scholar]
- Saunders, P.U.; Telford, R.D.; Pyne, D.B.; Cunningham, R.B.; Gore, C.J.; Hahn, A.G.; Hawley, J.A. Improved Running Economy in Elite Runners after 20 Days of Simulated Moderate-Altitude Exposure. J. Appl. Physiol. 2004, 96, 931–937. [Google Scholar] [CrossRef]
- Saunders, P.U.; Pyne, D.B.; Telford, R.D.; Hawley, J.A. Factors Affecting Running Economy in Trained Distance Runners. Sports Med. 2004, 34, 465–485. [Google Scholar]
- Schmitt, L.; Millet, G.; Robach, P.; Nicolet, G.; Brugniaux, J.V.; Fouillot, J.P.; Richalet, J.P. Influence of “Living High-Training Low” on Aerobic Performance and Economy of Work in Elite Athletes. Eur. J. Appl. Physiol. 2006, 97, 627–636. [Google Scholar] [CrossRef]
- Wehrlin, J.P.; Zuest, P.; Hallen, J.; Marti, B. Live High-Train Low for 24 Days Increases Hemoglobin Mass and Red Cell Volume in Elite Endurance Athletes. J. Appl. Physiol. 2006, 100, 1938–1945. [Google Scholar] [CrossRef]
- Wehrlin, J.P.; Marti, B. Live High-Train Low Associated with Increased Haemoglobin Mass as Preparation for the 2003 World Championships in Two Native European World Class Runners. Br. J. Sports Med. 2006, 40, e3; discussion e3. [Google Scholar] [CrossRef]
- Lundby, C.; Calbet, J.A.; Sander, M.; van Hall, G.; Mazzeo, R.S.; Stray-Gundersen, J.; Stager, J.M.; Chapman, R.F.; Saltin, B.; Levine, B.D. Exercise Economy Does Not Change after Acclimatization to Moderate to Very High Altitude. Scand. J. Med. Sci. Sports 2007, 17, 281–291. [Google Scholar] [CrossRef]
- Nordsborg, N.B.; Siebenmann, C.; Jacobs, R.A.; Rasmussen, P.; Diaz, V.; Robach, P.; Lundby, C. Four Weeks of Normobaric “Live High-Train Low” Do Not Alter Muscular or Systemic Capacity for Maintaining PH and K(+) Homeostasis during Intense Exercise. J. Appl. Physiol. 2012, 112, 2027–2036. [Google Scholar] [CrossRef]
- Saltin, B. Exercise and the Environment: Focus on Altitude. Res. Q Exerc. Sport 1996, 67, S1–S10. [Google Scholar]
- Siebenmann, C.; Robach, P.; Jacobs, R.A.; Rasmussen, P.; Nordsborg, N.; Diaz, V.; Christ, A.; Olsen, N.V.; Maggiorini, M.; Lundby, C. “Live High-Train Low” Using Normobaric Hypoxia: A Double-Blinded, Placebo-Controlled Study. J. Appl. Physiol. 2012, 112, 106–117. [Google Scholar] [CrossRef]
- Truijens, M.J.; Rodriguez, F.A.; Townsend, N.E.; Stray-Gundersen, J.; Gore, C.J.; Levine, B.D. The Effect of Intermittent Hypobaric Hypoxic Exposure and Sea Level Training on Submaximal Economy in Well-Trained Swimmers and Runners. J. Appl. Physiol. 2008, 104, 328–337. [Google Scholar] [CrossRef]
- Levine, B.D.; Stray-Gundersen, J. Point: Positive Effects of Intermittent Hypoxia (Live High:Train Low) on Exercise Performance Are Mediated Primarily by Augmented Red Cell Volume. J. Appl. Physiol. 2005, 99, 2053–2055. [Google Scholar] [CrossRef]
- Hahn, A.G.; Gore, C.J. The Effect of Altitude on Cycling Performance: A Challenge to Traditional Concepts. Sports Med. 2001, 31, 533–557. [Google Scholar]
- Wilber, R.L. Current Trends in Altitude Training. Sports Med. 2001, 31, 249–265. [Google Scholar]
- Wilber, R.L. Application of Altitude/Hypoxic Training by Elite Athletes. Med. Sci. Sports Exerc. 2007, 39, 1610–1624. [Google Scholar] [CrossRef]
- Bjorgen, S.; Helgerud, J.; Husby, V.; Steinshamn, S.; Richadson, R.R.; Hoff, J. Aerobic High Intensity One-Legged Interval Cycling Improves Peak Oxygen Uptake in Chronic Obstructive Pulmonary Disease Patients; No Additional Effect from Hyperoxia. Int. J. Sports Med. 2009, 30, 872–878. [Google Scholar] [CrossRef]
- Bjorgen, S.; Hoff, J.; Husby, V.S.; Hoydal, M.A.; Tjonna, A.E.; Steinshamn, S.; Richardson, R.S.; Helgerud, J. Aerobic High Intensity One and Two Legs Interval Cycling in Chronic Obstructive Pulmonary Disease: The Sum of the Parts Is Greater than the Whole. Eur. J. Appl. Physiol. 2009, 106, 501–507. [Google Scholar] [CrossRef]
- Dolmage, T.E.; Goldstein, R.S. Response to One-Legged Cycling in Patients with COPD. Chest 2006, 129, 325–332. [Google Scholar] [CrossRef]
- Magnusson, G.; Kaijser, L.; Sylven, C.; Karlberg, K.E.; Isberg, B.; Saltin, B. Peak Skeletal Muscle Perfusion Is Maintained in Patients with Chronic Heart Failure When Only a Small Muscle Mass Is Exercised. Cardiovasc. Res. 1997, 33, 297–306. [Google Scholar]
- Rud, B.; Foss, O.; Krustrup, P.; Secher, N.H.; Hallen, J. One-Legged Endurance Training: Leg Blood Flow and Oxygen Extraction during Cycling Exercise. Acta Physiol. 2012, 205, 177–185. [Google Scholar] [CrossRef]
- MacInnis, M.J.; Morris, N.; Sonne, M.W.; Zuniga, A.F.; Keir, P.J.; Potvin, J.R.; Gibala, M.J. Physiological Responses to Incremental, Interval, and Continuous Counterweighted Single-Leg and Double-Leg Cycling at the Same Relative Intensities. Eur. J. Appl. Physiol. 2017, 117, 1423–1435. [Google Scholar] [CrossRef]
- Burns, K.J.; Pollock, B.S.; Lascola, P.; McDaniel, J. Cardiovascular Responses to Counterweighted Single-Leg Cycling: Implications for Rehabilitation. Eur J. Appl. Physiol. 2014, 114, 961–968. [Google Scholar] [CrossRef]
- Abbiss, C.R.; Karagounis, L.G.; Laursen, P.B.; Peiffer, J.J.; Martin, D.T.; Hawley, J.A.; Fatehee, N.N.; Martin, J.C. Single-Leg Cycle Training Is Superior to Double-Leg Cycling in Improving the Oxidative Potential and Metabolic Profile of Trained Skeletal Muscle. J. Appl. Physiol. 2011, 110, 1248–1255. [Google Scholar] [CrossRef]
- Dolmage, T.E.; Goldstein, R.S. Effects of One-Legged Exercise Training of Patients with COPD. Chest 2008, 133, 370–376. [Google Scholar] [CrossRef]
- Esposito, F.; Reese, V.; Shabetai, R.; Wagner, P.D.; Richardson, R.S. Isolated Quadriceps Training Increases Maximal Exercise Capacity in Chronic Heart Failure: The Role of Skeletal Muscle Convective and Diffusive Oxygen Transport. J. Am. Coll. Cardiol. 2011, 58, 1353–1362. [Google Scholar] [CrossRef]
- Gatterer, H.; Menz, V.; Burtscher, M. Acute Moderate Hypoxia Reduces One-Legged Cycling Performance Despite Compensatory Increase in Peak Cardiac Output: A Pilot Study. Int. J. Environ. Res. Public. Health 2021, 18, 3732. [Google Scholar] [CrossRef]
- Riebe, D.; Ehrman, J.K.; Liguori, G.; Magal, M. (Eds.) ACSM’s Guidelines for Exercise Testing and Prescription; Wolters Kluwer: Philadelphia, PA, USA, 2018; p. 33. ISBN 978-1-4963-3906-5. [Google Scholar]
- Draper, S.N.; Kearney, S.G.; McDaniel, J. Greater Reliance on Carbohydrates during Single Leg Versus Double Leg Cycling. J. Exerc. Nutr. 2019, 51, 668. [Google Scholar] [CrossRef]
- LaSCOLA, P.; Heidorn, C.E.; Pollock, B.; Burns, K.; McDANIEL, J. Physiological Responses to Counterweighted Single-Leg Cycling in Older Males. Int. J. Exerc. Sci. 2020, 13, 1487–1500. [Google Scholar]
- McDaniel, J.; Subudhi, A.; Martin, J.C. Torso Stabilization Reduces the Metabolic Cost of Producing Cycling Power. Can. J. Appl. Physiol. 2005, 30, 433–441. [Google Scholar] [CrossRef]
- Seo, Y.; Burns, K.; Fennell, C.; Kim, J.-H.; Gunstad, J.; Glickman, E.; McDaniel, J. The Influence of Exercise on Cognitive Performance in Normobaric Hypoxia. High. Alt. Med. Biol. 2015, 16, 298–305. [Google Scholar] [CrossRef]
- Elmer, S.J.; McDaniel, J.; Martin, J.C. Biomechanics of Counterweighted One-Legged Cycling. J. Appl. Biomech. 2016, 32, 78–85. [Google Scholar] [CrossRef]
- Nicklin, R.C.; O’Bryant, H.S.; Zehnbauer, T.M.; Collins, M.A. A Computerized Method for Assessing Anaerobic Power and Work Capacity Using Maximal Cycle Ergometry. J. Strength Cond. Res. 1990, 4, 135–140. [Google Scholar]
- Bedu, M.; Fellmann, N.; Spielvogel, H.; Falgairette, G.; Van Praagh, E.; Coudert, J. Force-Velocity and 30-s Wingate Tests in Boys at High and Low Altitudes. J. Appl. Physiol. 1991, 70, 1031–1037. [Google Scholar]
- Bhambhani, Y.; Maikala, R.; Esmail, S. Oxygenation Trends in Vastus Lateralis Muscle during Incremental and Intense Anaerobic Cycle Exercise in Young Men and Women. Eur J. Appl. Physiol. 2001, 84, 547–556. [Google Scholar] [CrossRef]
- Calbet, J.A.; De Paz, J.A.; Garatachea, N.; Cabeza de Vaca, S.; Chavarren, J. Anaerobic Energy Provision Does Not Limit Wingate Exercise Performance in Endurance-Trained Cyclists. J. Appl. Physiol. 2003, 94, 668–676. [Google Scholar]
- Hebestreit, H.; Dunstheimer, D.; Staschen, B.; Strassburg, H. Single-Leg Wingate Test in Children: Reliability and Optimal Braking Force. Med. Sci. Sports Exerc. 1999, 31, 1218–1225. [Google Scholar]
- Kavanagh, M.F.; Jacobs, I.; Pope, J.; Symons, D.; Hermiston, A. The Effect of Hypoxia on Performance of the Wingate Anaerobic Power Test. Can. J. Appl. Sports Sci. 1986, 11, 22P. [Google Scholar]
- Elliott, P.R.; Atterbom, H.A. Comparison of Exercise Responses of Males and Females during Acute Exposure to Hypobaria. Aviat. Space Environ. Med. 1978, 49, 415–418. [Google Scholar]
- Fulco, C.S.; Rock, P.B.; Trad, L.; Forte, V.; Cymerman, A. Maximal Cardiorespiratory Responses to One-and Two-Legged Cycling during Acute and Long-Term Exposure to 4300 Meters Altitude. Eur. J. Appl. Physiol. 1988, 57, 761–766. [Google Scholar]
- Fulco, C.S.; Rock, P.B.; Cymerman, A. Maximal and Submaximal Exercise Performance at Altitude. Aviat. Space Environ. Med. 1998, 69, 793–801. [Google Scholar]
- Levitan, B.M.; Bungo, M.W. Measurement of Cardiopulmonary Performance during Acute Exposure to a 2440-m Equivalent Atmosphere. Aviat. Space Environ. Med. 1982, 53, 639–642. [Google Scholar]
- Paterson, D.J.; Pinnington, H.; Pearce, A.R.; Morton, A.R. Maximal Exercise Cardiorespiratory Responses of Men and Women during Acute Exposure to Hypoxia. Aviat. Space Environ. Med. 1987, 58, 243–247. [Google Scholar]
- Shephard, R.J.; Bouhlel, E.; Vandewalle, H.; Monod, H. Peak Oxygen Intake and Hypoxia: Influence of Physical Fitness. Int. J. Sports Med. 1988, 9, 279–283. [Google Scholar] [CrossRef]
- Squires, R.W.; Buskirk, E.R. Aerobic Capacity during Acute Exposure to Simulated Altitude, 914 to 2286 Meters. Med. Sci. Sports Exerc. 1982, 14, 36–40. [Google Scholar]
- Dempsey, J.; Hanson, P.; Henderson, K. Exercise-induced Arterial Hypoxaemia in Healthy Human Subjects at Sea Level. J. Physiol. 1984, 355, 161–175. [Google Scholar]
- Gore, C.J.; Little, S.C.; Hahn, A.G.; Scroop, G.C.; Norton, K.I.; Bourdon, P.C.; Woolford, S.M.; Buckley, J.D.; Stanef, T.; Campbell, D.P.; et al. Reduced Performance of Male and Female Athletes at 580 m Altitude. Eur. J. Appl. Physiol. 1997, 75, 136–143. [Google Scholar] [CrossRef]
- Lawler, J.; Powers, S.K.; Thompson, D. Linear Relationship between VO2max and VO2max Decrement during Exposure to Acute Hypoxia. J. Appl. Physiol. 1988, 64, 1486–1492. [Google Scholar]
- Bartlett, M.F.; Lehnhard, R.A. The Lactate Paradox: A Review. Comp. Exerc. Physiol. 2010, 7, 1–13. [Google Scholar]
- Grassi, B.; Marzorati, M.; Kayser, B.; Bordini, M.; Colombini, A.; Conti, M.; Marconi, C.; Cerretelli, P. Peak Blood Lactate and Blood Lactate vs. Workload during Acclimatization to 5,050 m and in Deacclimatization. J. Appl. Physiol. 1996, 80, 685–692. [Google Scholar]
- Kayser, B. Lactate during Exercise at High Altitude. Eur. J. Appl. Physiol. Occup. Physiol. 1996, 74, 195–205. [Google Scholar]
- Pronk, M.; Tiemessen, I.; Hupperets, M.D.; Kennedy, B.P.; Powell, F.L.; Hopkins, S.R.; Wagner, P.D. Persistence of the Lactate Paradox over 8 Weeks at 3800 m. High Alt. Med. Biol. 2003, 4, 431–443. [Google Scholar]
- Reeves, J.T.; Wolfel, E.E.; Green, H.J.; Mazzeo, R.S.; Young, A.J.; Sutton, J.R.; Brooks, G.A. Oxygen Transport during Exercise at Altitude and the Lactate Paradox: Lessons from Operation Everest II and Pikes Peak. Exerc. Sport Sci. Rev. 1992, 20, 275–296. [Google Scholar]


| Mean Difference | 95% CI | Cohen’s d | Mean Difference | 95% CI | Cohen’s d | ||
|---|---|---|---|---|---|---|---|
| FBF | SaO2 | ||||||
| 50%–60% | −637.2 | −972.6; −301.8 | 0.714 | DLH-DLN | −4.377 | −5.57; −3.18 | 3.72 |
| 60%–70% | −451.9 | −806.4; −97.4 | 0.418 | SLH-DLH | 1.535 | 0.026; 3.096 | 0.9 |
| SLH-DLH | 417.1 | 81.1; 753.2 | 0.427 | SLH-DLN | −2.842 | −4.117; −1.566 | 2.07 |
| MAP | Oxy | ||||||
| 60%–70% | −4.117 | −7.492; −0.741 | 0.399 | DLN-DLH | 6.809 | 3.177; 10.44 | 0.798 |
| 70%–80% | −3.467 | −6.628; −0.306 | 0.308 | SLH-DLH | −3.799 | −6.422; 1.176 | 0.354 |
| HR | Total | ||||||
| 50%–60% | −13.514 | 17.129; −9.899 | 0.955 | 50%–60% | −1.892 | −2.568; −1.216 | 0.276 |
| 60%–70% | −13.117 | −16.091; −10.142 | 0.859 | 60%–70% | −1.136 | −2.093; −0.178 | 0.15 |
| 70%–80% | −11.094 | −13.249; −8.940 | 0.723 | ||||
| SLH-DLH | −23.21 | −32.551; −13.870 | 1.475 | TSI | |||
| SLH-DLN | −18.737 | −8.989; −28.486 | 1.25 | DHL-DLN | −5.838 | −9.758; −1.917 | 0.632 |
| DHL-SLH | −3.156 | −4.231; −2.080 | 0.316 | ||||
| Lactate | 50%–60% | 2.517 | 0.717; 4.316 | 0.295 | |||
| 60%–70% | −1.553 | −2.426; −0.681 | 1.2 | 60%–70% | 1.668 | 0.881; 2.456 | 0.172 |
| 70%–80% | −1.867 | −2.677; −1.057 | 1.104 | 70%–80% | 1.581 | 0.895; 2.266 | 0.158 |
| DLH-DLN | 1.055 | −1.615; −0.495 | 0.839 | ||||
| DLN-SLH | −0.84 | −1.655; −0.025 | 0.719 |
Publisher’s Note: MDPI stays neutral with regard to jurisdictional claims in published maps and institutional affiliations. |
© 2022 by the authors. Licensee MDPI, Basel, Switzerland. This article is an open access article distributed under the terms and conditions of the Creative Commons Attribution (CC BY) license (https://creativecommons.org/licenses/by/4.0/).
Share and Cite
Draper, S.; Singer, T.; Dulaney, C.; McDaniel, J. Single Leg Cycling Offsets Reduced Muscle Oxygenation in Hypoxic Environments. Int. J. Environ. Res. Public Health 2022, 19, 9139. https://doi.org/10.3390/ijerph19159139
Draper S, Singer T, Dulaney C, McDaniel J. Single Leg Cycling Offsets Reduced Muscle Oxygenation in Hypoxic Environments. International Journal of Environmental Research and Public Health. 2022; 19(15):9139. https://doi.org/10.3390/ijerph19159139
Chicago/Turabian StyleDraper, Shane, Tyler Singer, Cody Dulaney, and John McDaniel. 2022. "Single Leg Cycling Offsets Reduced Muscle Oxygenation in Hypoxic Environments" International Journal of Environmental Research and Public Health 19, no. 15: 9139. https://doi.org/10.3390/ijerph19159139
APA StyleDraper, S., Singer, T., Dulaney, C., & McDaniel, J. (2022). Single Leg Cycling Offsets Reduced Muscle Oxygenation in Hypoxic Environments. International Journal of Environmental Research and Public Health, 19(15), 9139. https://doi.org/10.3390/ijerph19159139