Article

Assessment of the Driving Pollution Factors of Soil Environmental Quality Based on China’s Risk Control Standard: Multiple Bigdata-Based Approaches with Intensive Sampling

Center for Soil Protection and Landscape Design, Chinese Academy of Environmental Planning, Beijing 100012, China
*
Author to whom correspondence should be addressed.
Int. J. Environ. Res. Public Health 2022, 19(19), 12459; https://doi.org/10.3390/ijerph191912459
Submission received: 31 July 2022 / Revised: 22 September 2022 / Accepted: 26 September 2022 / Published: 30 September 2022
(This article belongs to the Special Issue Soil Contamination, Prevention and Cleanup)

Abstract

:
Identifying the driving factors of soil environmental quality is critical in raising countermeasures for managing the soil environment efficiently and precisely. In 2018, China issued risk control standards to divide soil environmental quality into three classes to meet the demands of environment management. However, there is a lack of knowledge of this new standard. An intensive field-sampling research (2598 top-soil samples were analyzed) was conducted in the agricultural land of Hubei province, central China, to find the driving factors of pollutants based on this new standard. According to the standard, the proportion of classes 1, 2, and 3 in the overall quality grade was 57.3%, 41.7%, and 1%, respectively. The standardized index showed that the pollution levels of cadmium, arsenic, lead, and chromium were higher than that of mercury. The first component of the principal component analysis explained 56.4% of the total variance, and the loading of cadmium, arsenic and lead were −53.5%, −52.1%, and −51.2%, respectively. The general linear modeling found that cadmium and arsenic showed positive and significant effects (p < 0.001) on the grading results of soil environmental quality. Based on the random forest algorithm, cadmium showed the greatest importance on soil environmental quality (increase in mean squared error = 32.5%). Overall, this study revealed that cadmium, arsenic, and lead were driving pollutants affecting soil environment quality grade. The large data size increased the reliability and robustness of the study’s conclusions, and it provided reference methods for future studies investigating China’s new standard for assessing soil environmental quality.

1. Introduction

Soil environmental quality assessment is an essential part of total environmental quality assessment because environmental quality includes air, water, and soil quality [1]. Because of the heterogeneity and chronicity of soil pollution, soil assessment quality differs from air and water assessment quality [2]. The concept of soil quality started in 1971 [3], then combined with policymaker demand [4,5], assessment of environmental risk [6], and soil remediation [7]. Developing assessment methods and grading the soil environmental quality are important topics in the field of soil research [8,9,10,11].
The method focuses on the physical, chemical, and biological parameters of soil [9,12,13,14,15]. The minimum data set includes 6–8 parameters to increase the feasibility and economic techniques [16,17,18,19,20]. The parameters will be integrated and classified into different grades to meet the demand for environmental management and land functions. The driving factors of soil quality grading may differ depending on the assessment methods used.
Heavy metals can accumulate in the surface soil through various pathways, including bedrock mineralization, atmospheric sedimentation, and human activities. The accumulation process is chronic, invisible, irreversible, and temporally lagged [21,22,23] because of the properties of the soil. Since human industrial and agricultural development activities, the accumulation of heavy metals in soils has drawn attention to serious concerns on human health [24,25,26,27,28,29,30,31] and ecosystems [32]. Several index methods, such as Muller’s geoaccumulation index [33], Nemerow’s index [34], and Hakanson’s ecological risk index [35], have been developed to assess the quality or risk of soil caused by heavy metals. In recent decades, researchers kept improving these assessment methods to meet the changing demands for soil environmental protection. Several bigdata-based approaches were used to investigate the factors of soil quality, such as minimum data set, principal component analysis (PCA), general linear model (GLM), and random forest (RF). Compared with PCA and GLM, the RF algorithm [36] is a new bigdata-based approach developed from the classification and regression tree (CART) model [37,38]. RF is less sensitive to model overfitting than CART. Thus, it contains both a single regression tree as well as multiple regression trees. RF has a rapid calculation time and does not require complex data processing [39,40]. Furthermore, RF can analyze the importance of variables, making the results of driving factors more interpretable.
China started to handle its soil environmental issues caused by rapid economic and industrial development at the end of the 20th century, thus, published a series of regulations and standards related to the soil environment. In 2016, China published a soil pollution prevention and control action plan (hereinafter referred to as the action plan, State Council of China, 2016) to control its soil pollution and improve the quality of the soil environment on a long-term scale (2016–2050). Following the implementation of the action plan, a series of new regulations, standards, and guidelines related to soil environment and pollutants were issued or updated. The Ministry of Ecology and Environment (hereinafter referred to as MEE China) issued a new assessment and grading standard for agricultural soil environmental quality in mid-2018 [41], which mainly focuses on soil pollutants, especially heavy metals.
At present, several studies have investigated or reviewed the principal heavy metals in the soil at the national level or regional level based on different guideline values [42,43,44,45,46,47]. However, there is a lack of knowledge about China’s newly issued standard, especially for intensive sampling surveys, which could improve the reliability of bigdata analysis. Therefore, we conducted an intensive field survey on cultivated land located in a mining area of Hubei province, which is characterized by mining activities and industrial activities [45]. Based on China’s newly issued risk control standard, we analyzed the driving pollutant factor of soil environmental quality using multiple bigdata-based approaches.

2. Materials and Methods

2.1. Assessment and Grading

2.1.1. Standard of Soil Pollutants Assessment

The assessment and grading methods follow the soil environmental quality risk control standard for agricultural land soil contamination (hereinafter referred to as risk control standard [41]). Table 1 and Table 2 show risk-screening and risk-intervention values for each pollutant factor according to the soil pH value and utility functions. Only five major soil pollutants, including cadmium (Cd), mercury (Hg), arsenic (As), lead (Pb), and chromium (Cr), were listed for the risk-screening and risk-intervention values. Therefore, in this study, we assessed five major soil pollutants and one soil property parameter (pH value) according to the risk control standard.

2.1.2. Grading of Soil Environmental Quality

According to the action plan and risk control standard, the grades of soil environmental quality of agricultural land were classified into three classes: conservation priority (class 1, considered as low risk), safety usage (class 2, considered as controllable risk), and strict control (class 3, considered as high risk). Class 1 indicates that the soil environmental risk is low enough to be considered safe for agricultural products and human health; class 2 indicates that soil environmental risk exists and can jeopardize the safety of agricultural products, and class 3 indicates that the soil environment risk is remarkably high and strict countermeasures should be implemented.
As shown in Table 3, in the case of grading soil quality for a single pollutant factor, if the content is lower than the risk-screening value, the grade is class 1. If the pollutant content is between the risk-screening and risk-intervention value, the grade will be class 2. If the pollutant content exceeds the risk-intervention value, the grade will be determined as class 3. The highest class (highest risk) of single pollutant factors is used to determine the overall grade of the soil sample.

2.2. Field Sampling and Chemical Analysis

2.2.1. Field Sampling

The investigated area is in a county of Hubei province in central China. The area spans 76 km from west to east and 71 km from south to north, with a total area of more than 600 km2. The climate is subtropical monsoonal, with annual precipitation and temperature of 1389 mm and 16.8 °C, respectively. Fluvo-aquic soil sand Anthrosol is the prevailing soil type formed from river and lake sediments, quaternary clay, and quartz sandstone. In this area, the land is mainly used for planting rice, vegetables, and other economic crops. According to the available information from residents and other historical materials, the investigated area has a large number of mineral reserves of copper and gold.
From September 2018 to November 2018, surface soil samples (0–20 cm) were collected using a random sampling scheme (Figure 1). The geographic coordinates of each sampling site were recorded using a handheld global positioning system. At each sampling site, five top-soil samples (500 g each, depth of 0–20 cm) were taken, and five top-soil samples were mixed as one field sample. In total, 2598 field samples (sites) were taken in cultivated land, including 1187 paddy field soil samples and 1411 other soil samples. Approximately 1 kg of fresh soils were collected, packed in plastic bags, and transported back to the laboratory. All collected soil samples were air-dried at room temperature, ground, and sieved.

2.2.2. Chemical Analysis

The chemical analysis was conducted at Chengdu Supervision and Inspection Center of Mineral Resources, Ministry of Natural Resources. The chemical analysis of soil samples was conducted according to the methods suggested by the MEE risk control standard [41]. After air-drying, soil samples were ground for subsequent chemical analysis. For determination of pH value, soil samples were sieved through nylon mesh with 2 mm size, then 10 g of sieved sample was mixed with 25 mL water and measured using pH electrode. For the determination of heavy metals, soil samples were sieved through a nylon mesh of 0.149 mm size, then microwave-assisted for aqua regia digestion. The total contents of Cd, Pb, and Cr were measured using inductively coupled plasma mass spectrometry (ICP-MS), while the total contents for Hg and As were measured using atomic fluorescence spectroscopy.

2.2.3. Quality Control

The MEE guidelines for environmental analytical methods (HJ 168-2010, MEE, 2010 [48]) were used to assess the limit of quantification (LOQ), the limit of detection (LOD), spiking recovery rate, and the degree of precision of chemical analysis methods used in this study. In this study, two blank samples were tested as negative controls, with approximately every 100 soil samples for 26 negative controls.

2.3. Data Analysis

2.3.1. Intervention Value-Based Pollutant Index of Pollutant Factors

Because of the large difference in the standard value (Table 1 and Table 2) for different pollutant factors, the index of pollutant factors was calculated by normalizing with risk-intervention values (Table 2). Equation (1) describes the equation for calculating the index.
P i = C i S i
where Pi is the index of a certain pollutant; Ci is the measured content of a certain pollutant, and Si is the risk-intervention value of a certain pollutant.

2.3.2. Statistical Analysis

To study the driving pollutant factors of soil environmental quality grades, PCA was applied to the contents of Cd, Hg, As, Pb, and Cr in our soil samples. PCA was used in R 3.6.3 [49] by function “prcomp” with parameter “scale = TRUE.”
GLM was used to analyze the relationship between overall soil environmental quality grade and soil pollutants. The pH value and log10 scaled contents of Cd, Hg, As, Pb, and Cr were set as independent variables, while the soil environmental quality grade (class 1, 2, and 3) was set as the dependent variable.
The RF algorithm has three tuning parameters: the number of input variables randomly selected as candidates at each split (mtry), the number of trees (ntrees), and minimum node size (nodesize). The package’s default ntrees value is 500. For node size, the standard for regression analysis is five for each terminal node. The lowest out-of-bag error estimate was used to determine the optimal value of mtry. The RF algorithm was performed in R using the “randomForest” package [50], with the pH value and contents of Cd, Hg, As, Pb, and Cr set as independent variables, and the soil environmental quality grade (class 1, 2, and 3) set as the dependent variable.
All the data analysis and visualization studies were performed on the platform of RStudio 2021.09.1 [51] and R 4.0.4 [49].

3. Results

3.1. Pollutant Content

In Figure 2, the content and index of each pollutant are shown in a boxplot with log10 transformation. The distribution map of heavy metals and pH are shown in Figure 3, and the descriptive statistics for each pollutant are shown in Table 4. The content and variability of As, Cd, Pb, and Cr were higher than those of Hg (Figure 2a, Table 4). The index and variability of As, Cd, Pb, and Cr were higher than those of Hg (Figure 2b, Table 4), indicating that the As, Cd, Pb, and Cr pollutant levels were high according to the MEE risk-intervention value [41] (Table 2).

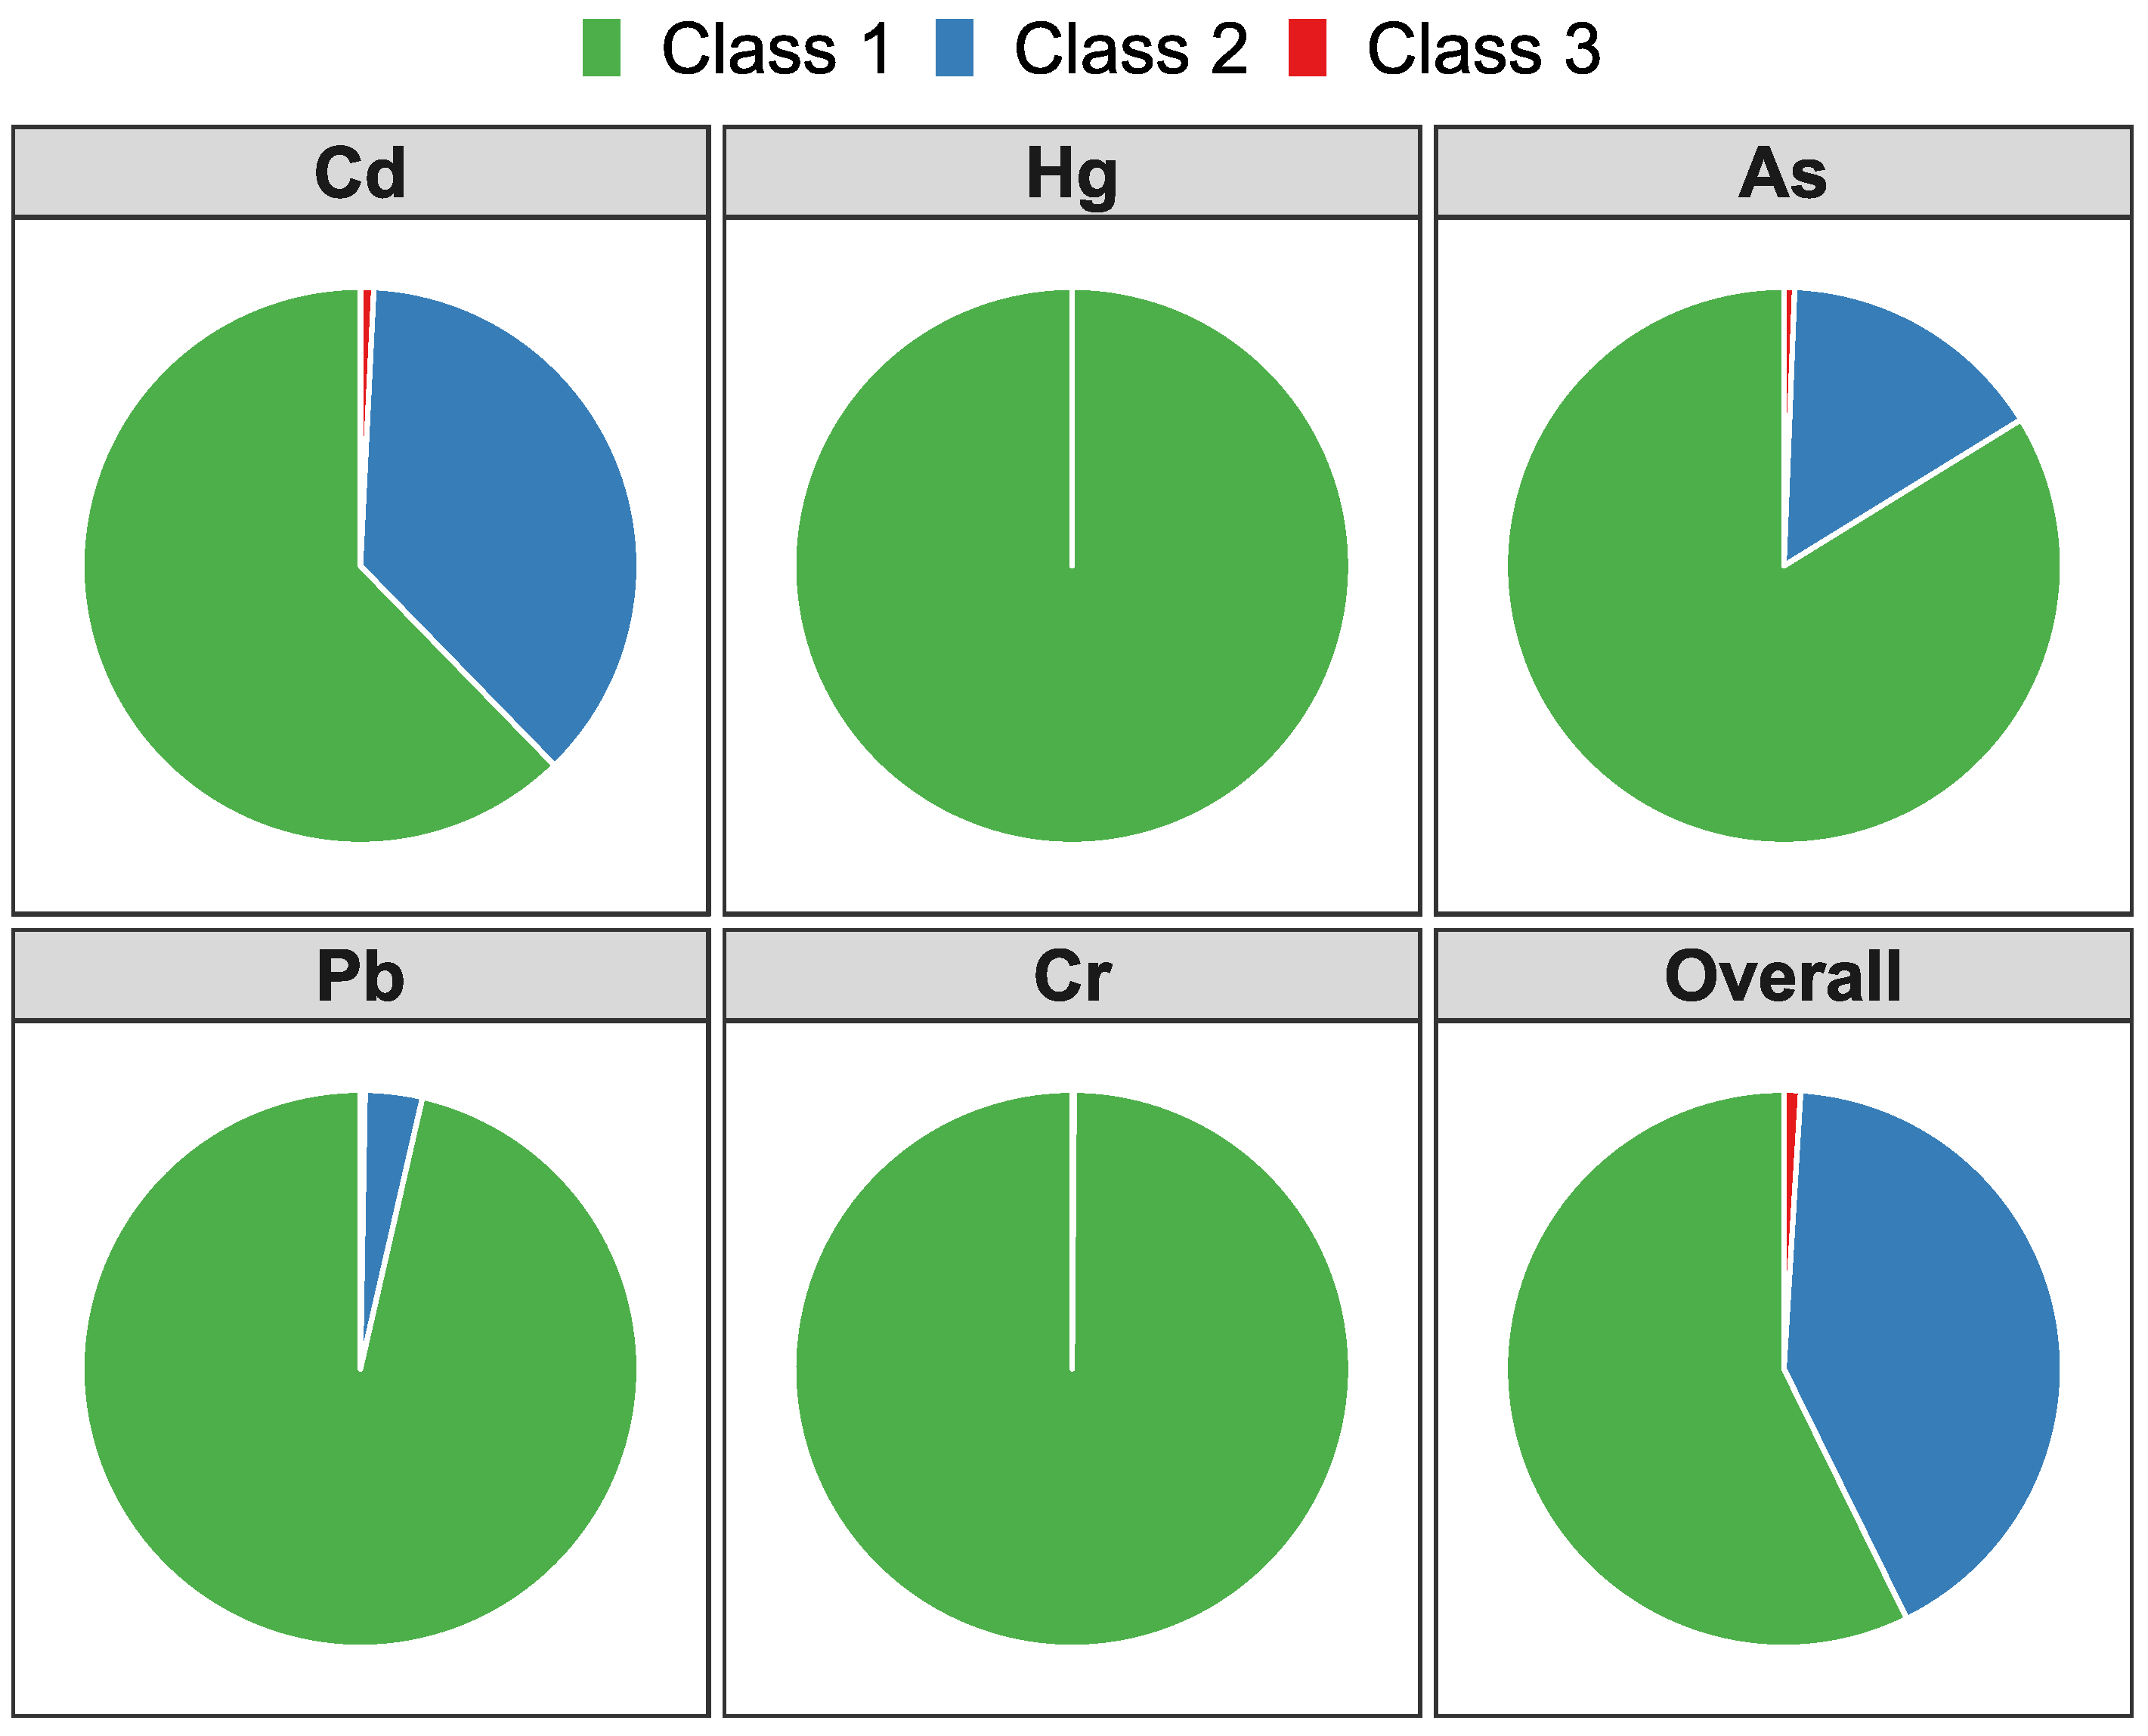
3.2. Soil Environmental Quality Grading

Figure 4 shows the proportions of each soil environmental quality grade by single pollutant factor and multiple factors (overall grade). According to the MEE risk control standard, the proportion of classes 1, 2, and 3 in the overall quality grade was 57.3%, 41.7%, and 1%, respectively. In the case of single pollutant factors, Hg and Cr graded 100% and 99.9% of soil samples as class 1, respectively. Cd and As showed a lower proportion of class 1 (62.3% and 83.8%) than Hg, Pb, and Cr. Cd, As, and Pb graded 0.8%, 0.6%, and 0.3% soil samples as class 3, respectively. Hg or Cr did not grade any soil sample as class 3.

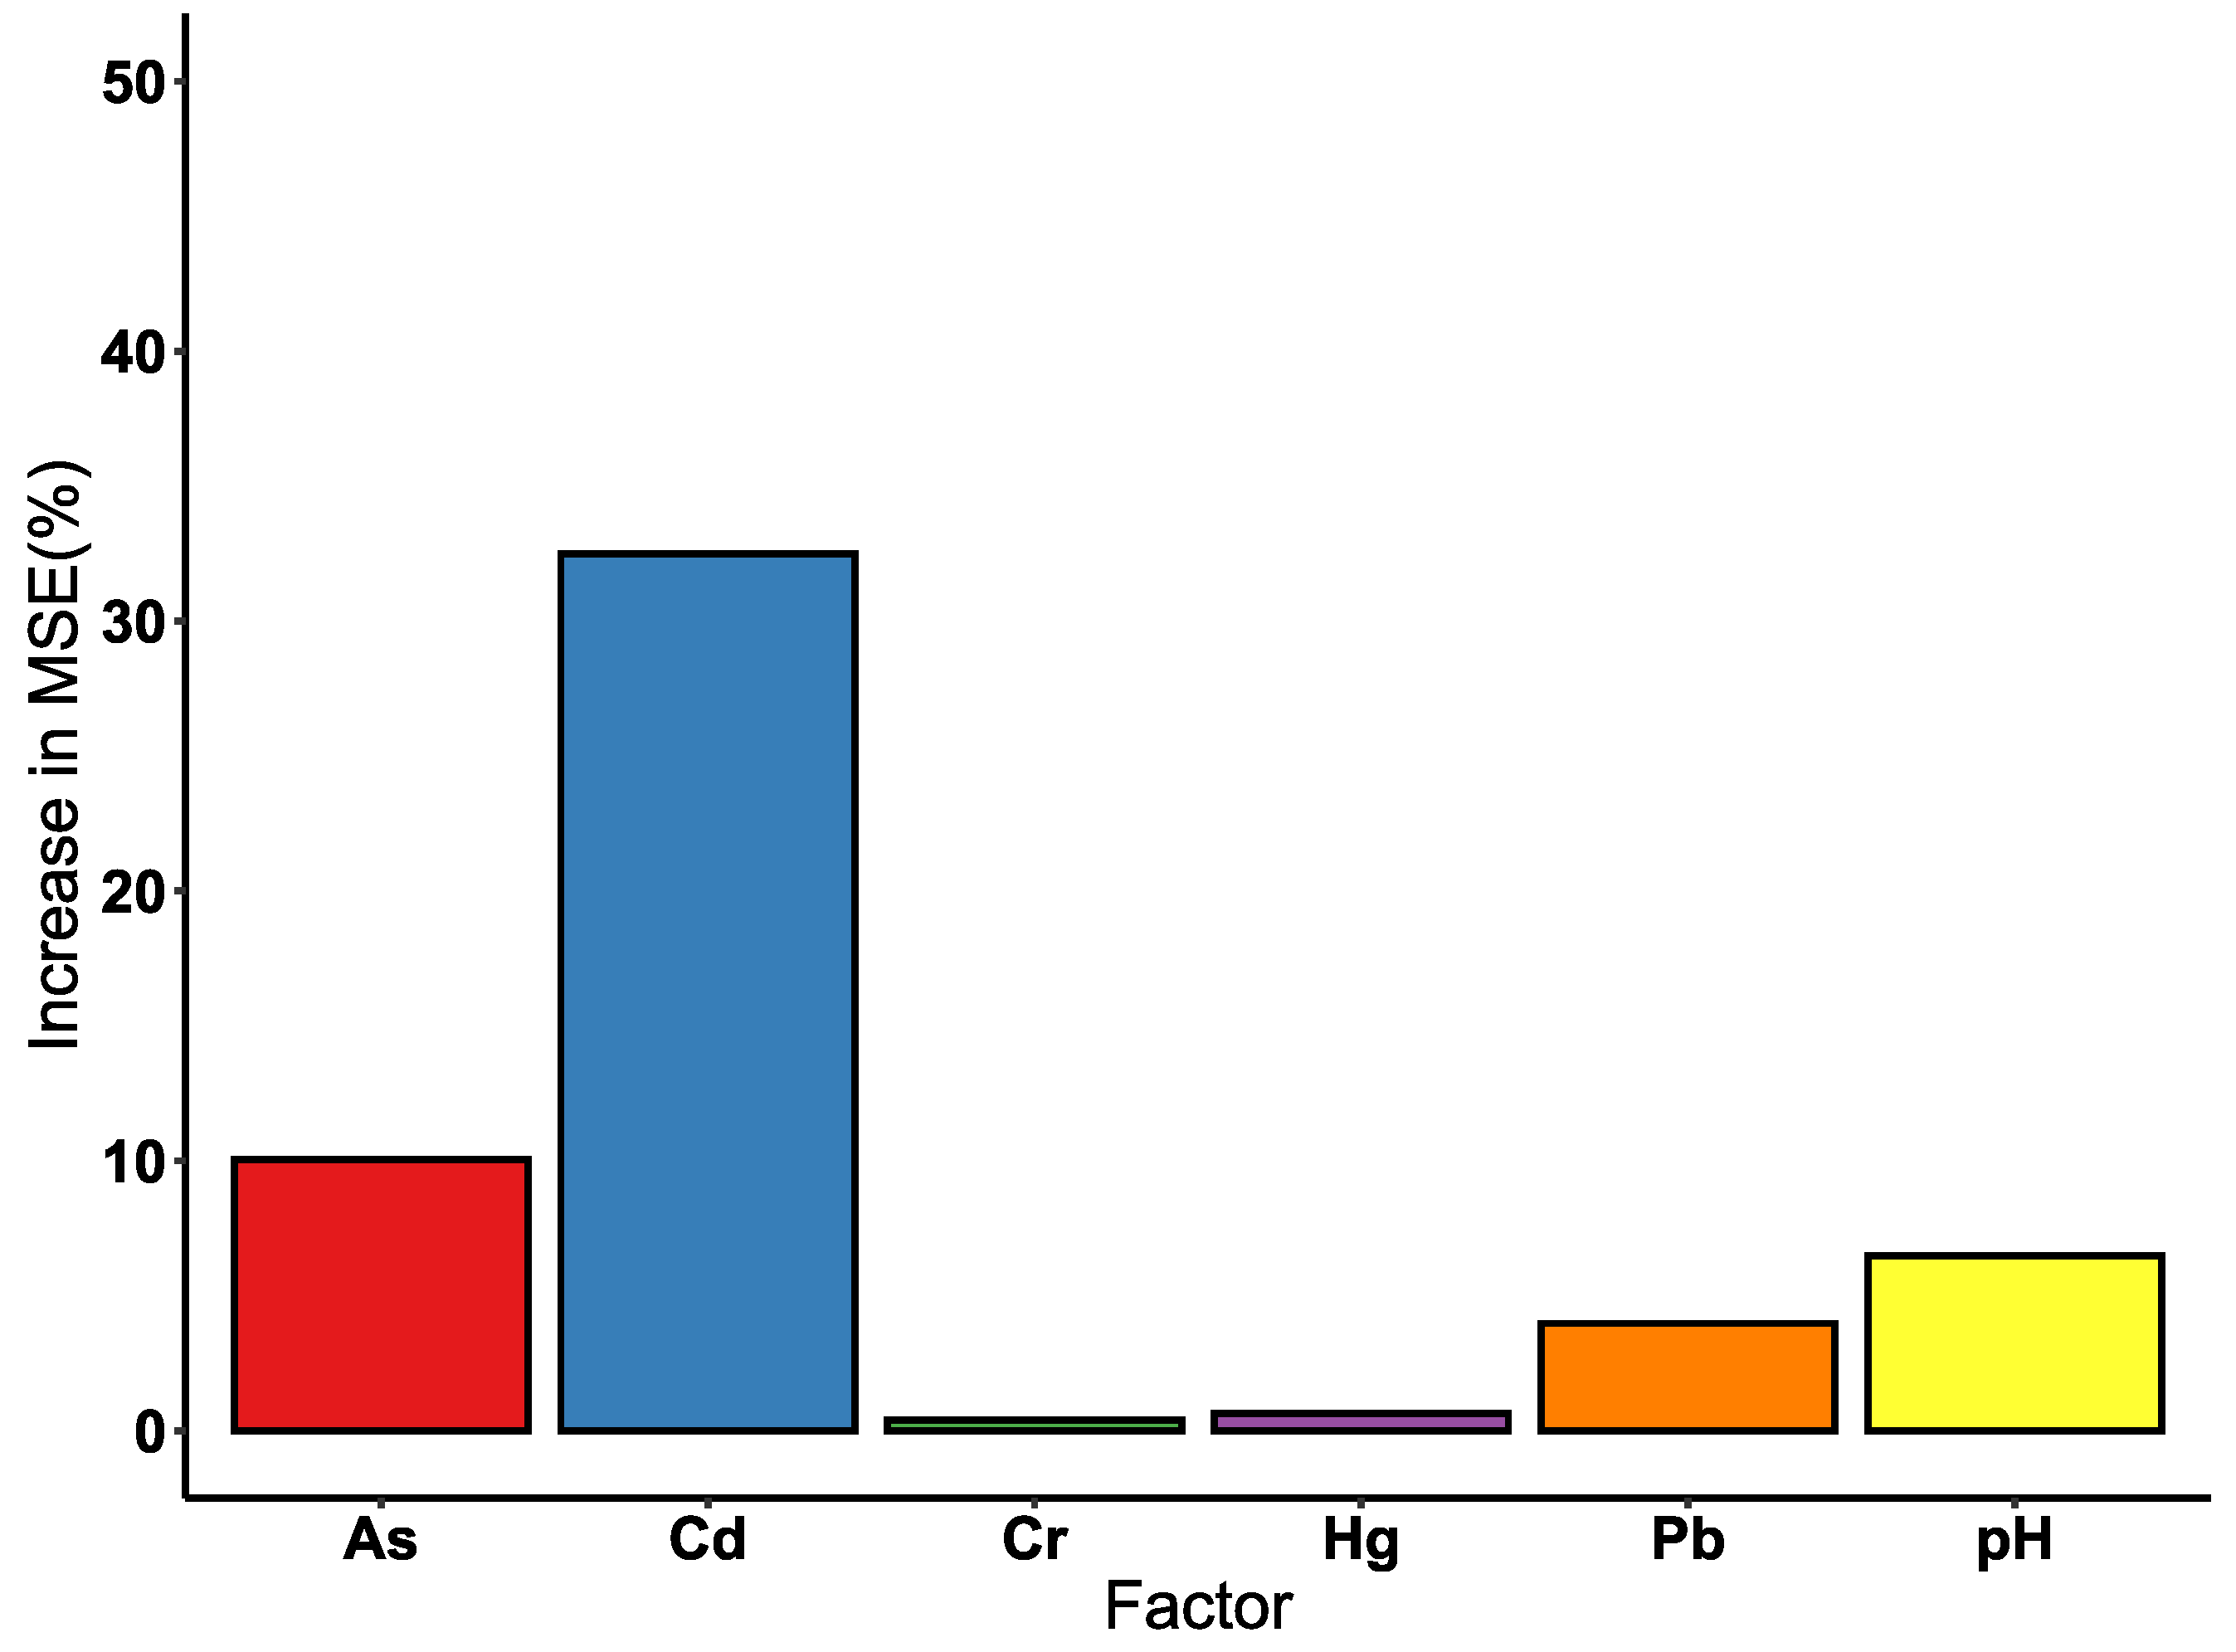
3.3. PCA, GLM, and RF Analysis

According to the PCA results, the Cd, Hg, As, Pb, and Cr contents could be projected to two components, which accounted for 78.6% of the total variance in the data (Table 5). The soil environmental quality grade was roughly separated by the axis of the 1st component (PC1) (Figure 5), which explained 56.4% of the total variance, the loadings of Cd, As, and Pb were −53.5%, −52.1%, and −51.2%, respectively. According to the PCA results, Cd, As, and Pb were associated with high loadings in PC1 and were the main factors of soil environmental quality grade.
According to the GLM regression (Table 6), the contents of Cd, Hg, As, Pb, Cr, and pH showed a significant effect (p < 0.001) on the grading results of soil environmental quality. In our field samples, the contents of Cd and As showed positive effects on soil environmental quality, indicating the contents of these two heavy metals were positively correlated to soil environment quality grade, while the content of Hg, Pb, Cr, and pH value showed negative effects, indicating these factors were negatively correlated to soil environment quality grade.
The RF algorithm showed an increase in mean squared error and node purity of Cd, Hg, As, Pb, Cr, and pH (Figure 6 and Table 7), indicating the importance of these soil factors on soil quality. Among the factors investigated in this study, Cd showed the greatest importance on soil environmental quality (increase in mean squared error = 32.5%, increase in node purity = 341.765). Compared with other factors, As showed relatively high importance on soil environmental quality (increase in mean squared error = 10.0%, increase in node purity = 146.863). Based on RF algorithm results, pH, Pb, Hg, and Cr did not show significant importance on soil environmental quality.

4. Discussion

4.1. Pollutants in the Survey Area

In our study area, the soil environmental quality of most samples was graded as conservation priority class and safety usage class (Figure 4), indicating that the pollution risk in the surveyed area was acceptable and controllable based on the MEE risk control standard [41]. The intervention value-based pollutant index (Figure 2b) implied that the pollution risk of Cd, As, Pb and Cr were higher than that of Hg, which was generally consistent with PCA results. According to the historical records of our study area, there have been rich minerals and active mining activities of copper and gold for hundreds of years. Thus, the associated minerals could be one of the major causes of high Cd, As, and Pb levels (Figure 3a,c,d). Because of the large difference in the criteria values of these pollutants, the pollutant content (Figure 2a) concealed the pollution level of Cd and exaggerated the pollution level of Cr to some extent. Therefore, compared with the pollutant content, the intervention value-based pollutant index could more accurately identify severe pollutants because the index was normalized by standard values.
Only the total heavy metal contents were analyzed in this study because of the risk control standard and our large sample size. However, the valence and forms of heavy metals (e.g., Cr-VI and Cr-III) have different environmental risks for agricultural land and products. Only the total contents of some major heavy metals were incorporated into the risk control standard as a tradeoff between cost and technique because China completed soil quality-grading work for agricultural land on a national scale at the county level in the coming years and because of a large number of soil samples (million class). With advancements in economy and technology, a more precise indicator such as various valence and forms of heavy metals should be incorporated into an updated version of this standard in the future to better protect and manage the soil environment.

4.2. The Driving Pollutant Factors

In this study, the PCA results (Table 5) revealed the possible homology of Cs, As, and Pb, implying that the pollution source of these three pollutants may also be homologous (Figure 3a,c,d). Several recent studies have used PCA to investigate the sources of heavy metals in soil. Jin et al. [52] used PCA to identify the latent constructs that controlled heavy metal variability and reflected potential sources at children’s playgrounds in Beijing, China. Yang et al. [53] used PCA to determine that four mine sources contributed 89.8% of heavy metal accumulations in Hubei, China. Because our study area is also rich in minerals, the sources of these three pollutants are mineral resources and mining activity.
Furthermore, the mapping results associated with soil environmental quality grades revealed that Cd, As, and Pb were the main driving factors of soil environmental quality. The GLM results showed that the contents of Cd and As were positively related to the grade class, implying that treating Cd and As would be beneficial for improving soil environmental quality. Meanwhile, the RF algorithm results also showed a similar interpretation of GLM results, indicating that Cd and As were the driving factors of soil environmental quality. However, the GLM and RF results did not show any obvious effect on soil environmental quality from Pb, which differs from PCA results. One possible reason was that the soil quality of Pb was much better than that of Cd and As (Figure 4), and the dependent variable (grade class, discrete variable in reality) of GLM and RF was set as a continuous variable, causing regression to be slightly distorted.
Several studies also investigated the driving factors of heavy metals in soil, both at the national level and regional levels. In the case of national-level studies, Chen et al. [44] reviewed 779 topsoil studies published from 2009 to 2020 and conducted a fuzzy eco-health risk model, identifying the risks from Pb, Cd, As, and Hg as the priority control metals at the national level in China. Moreover, Cd and Hg were the principal pollution factors in the region of Hubei province, which was partly consistent with our study since our study area was also located in Hubei province. Tóth et al. [47] analyzed soil-heavy metals from 22,000 locations in the European Union (LUCAS topsoil database) based on the Finnish legislation for contaminated soil [54]. Approximately 6.24% of the agricultural land needs local assessment and eventual remedial action. The proportion of samples that surpassed the threshold value for Cd and Cr were 5.5% and 4.4%, respectively. Due to the fact that the risk-intervention values of MEE China (Table 2) are much higher than their counterparts of MEF Finland, the proportion of Class 3 (approximately 1%) in our samples was much lower than the proportion of samples that needs assessment or remedial action (approximately 6.24%) in Toth’s samples. Barsova et al. [42] reviewed surveys compiled from 2008 to 2012 in the Russian Federation, reporting that the average contents of mobile species of heavy metals (Cu, Zn, Cd, Pb, Ni, Cr, Hg) were several times lower than the allowed maximum permissible concentrations [55], and reported a decreasing trend both in the country scale and federal districts scale. The soil environmental quality of the Russian Federation was better than that of the European Union and China. A possible reason was that the population density and human activity were relatively low in the Russian Federation. In the case of regional-level studies conducted in a mining area, Bech et al. [43] investigated a copper mine area in Northern Peru and confirmed As and Cu were the main pollution factors in this area. Mireles et al. [46] collected soil samples from a mining area in the state of Zacatecas, Mexico. They reported that when the content of As, Ba (barium), Cr, Fe (ferrum), Mn (Manganese), and Zn (zinc) were compared with the guidelines of the US EPA [56] the urban soils turned out to be heavily polluted, while the content of Ba and Cr were lower than residential Mexico Guideline values [57] since the differences in the elemental concentrations between guidelines of US EPA and guidelines of Mexico were large.

4.3. Environmental Management Suggestions Based on Soil Environmental Quality Assessment

Jennings [58] analyzed worldwide regulatory guidance values for commonly regulated heavy metals in surface soil: Pb, Cd, As, Ni, Cr, Hg, Cu, and Zn were the most frequently regulated elements. Most countries or regions in North America, the European Union, and Eastern Asia have regulatory values for the total content of Cd, Hg, As, and Pb. Except for China, valent state-based regulatory values of Cr (Cr-VI and Cr-III) were also used in these countries or regions. Moreover, China’s risk control standard only incorporated the total contents of Cd, Hg, As, Pb, and Cr into risk-intervention values; hence our study only tested the total contents of these five heavy metals. However, most global soil guidelines or standards did not classify soil into different categories based on regulatory value, as China’s risk control standard did. In this study, we propose some environmental management suggestions based on previous research and agricultural land regulations in China [41]. To protect the less-polluted soil on agricultural land where the conservation priority class soil is in the majority, nearby industries such as nonferrous metal smelting, petroleum refining, electroplating, etc., should be strictly restricted. To ensure the safety of agricultural products from potential pollution risks on agricultural land where the safety usage class soil is in the majority, measures such as substitute plantation, crop rotation, intercropping, etc., should be implemented when necessary. Any agricultural cultivation activity is not recommended for agricultural land where the strict control class soil is in the majority, and intervention measures such as the grain for the Green Project should be taken.
Our study determined that Cd, As, and Pb were driving pollutant factors and showed homology to some extent, implying that treating these three driving pollutants in our study area’s soil would effectively improve soil environmental quality. The environmental risk of Cd, As, and Pb in the soil has significant toxicity to plants [59,60,61] in aspects of ecology and physiology. Therefore, we propose environmental management techniques such as controlling emission sources (probably mining activity) and conducting soil remediation of these three driving pollutants. Remediation technologies such as agronomical measures and phytoremediation have been developed to treat agricultural soil contaminated by heavy metals. Proper agronomical measures such as adjustment of cropping pattern and fertilization could alleviate the heavy metal pollution in agricultural land; planting hyperaccumulators such as Eremochloa ciliaris, Solanum nigrum L., and Sedum alfredii could remove As, Cd, and Pb from the soil.
China’s risk control standard for soil environmental quality mainly focused on soil pollutants such as the total content of heavy metals, with no consideration given to valence states of heavy metals and soil fertility indicators such as soil organic matter and total nitrogen. To improve soil environment management, it is necessary to apply more indicators to regional standards, such as soil fertility indicators and different valence states of heavy metals, considering the regional differences in soil characteristics. To further evaluate this standard, more comparative studies between this standard and present major soil quality assessment index methods, such as the Muller geoaccumulation, Nemerow, and Hakanson’s ecological risk indices, should be conducted in the future.

5. Conclusions

This study conducted an intensive field research sampling and assessed the soil environmental quality based on China’s newly issued risk control standard [41]. The large data size increased the reliability and robustness of the study’s conclusions. The intervention value-based pollutant index showed that Cd, As, Pb, and Cr pollution levels were higher than that of Hg. Meanwhile, PCA revealed that the driving pollutants on soil environmental quality grade were Cd, As, and Pb. GLM and RF agree that Cd and As had significant effects on soil environmental quality. Therefore, treating Cd, As, and Pb pollutants were critical to improving the soil environmental quality in this study area. This study used several bigdata-based analytical methods to find driving pollutants based on China’s newly issued risk control standards, which should provide some context for researchers to further study this new standard for soil environmental quality.

Author Contributions

X.W.: Conceptualization, Supervision, Writing—Review & Editing, Funding acquisition. N.W.: Writing Original Draft, Formal analysis, Methodology, Software, Funding acquisition. G.J.: Investigation, Data curation. R.L.: Investigation, Writing—Review & Editing. G.H.: Investigation. H.Z.: Investigation. All authors have read and agreed to the published version of the manuscript.

Funding

This study was supported by the National Key Research and Development Program of China (Grant No. 2019YFC1803900), the National Natural Science Foundation of China (Grant No. 41907391), and The Youth Innovation Fund of CAEP.

Institutional Review Board Statement

Not applicable.

Informed Consent Statement

Not applicable.

Data Availability Statement

The datasets used and analyzed during the current study are available from the corresponding author upon reasonable request.

Conflicts of Interest

The authors declare no conflict of interest.

References

  1. Andrews, S.S.; Karlen, D.L.; Mitchell, J.P. A comparison of soil quality indexing methods for vegetable production systems in Northern California. Agric. Ecosyst. Environ. 2002, 90, 25–45. [Google Scholar] [CrossRef]
  2. Nortcliff, S. Standardisation of soil quality attributes. Agric. Ecosyst. Environ. 2002, 88, 161–168. [Google Scholar] [CrossRef]
  3. Alexander, M. Environmental Improvement: Agriculture’s Challenge in the Seventies; National Academy of Sciences: Washington, DC, USA, 1971. [Google Scholar]
  4. Bone, J.; Head, M.; Barraclough, D.; Archer, M.; Scheib, C.; Flight, D.; Voulvoulis, N. Soil quality assessment under emerging regulatory requirements. Environ. Int. 2010, 36, 609–622. [Google Scholar] [CrossRef]
  5. Hurni, H.; Giger, M.; Liniger, H.; Mekdaschi Studer, R.; Messerli, P.; Portner, B.; Schwilch, G.; Wolfgramm, B.; Breu, T. Soils, agriculture and food security: The interplay between ecosystem functioning and human well-being. Curr. Opin. Environ. Sustain. 2015, 15, 25–34. [Google Scholar] [CrossRef]
  6. Sonneveld, M.P.W.; Hack-ten Broeke, M.J.D.; van Diepen, C.A.; Boogaard, H.L. Thirty years of systematic land evaluation in the Netherlands. Geoderma 2010, 156, 84–92. [Google Scholar] [CrossRef]
  7. Schwilch, G.; Hessel, R. Desire for Greener Land: Options for Sustainable Land Management in Drylands; University of Bern: Bern, Switzerland, 2012. [Google Scholar]
  8. Andrews, S.S.; Karlen, D.L.; Cambardella, C.A. The Soil Management Assessment Framework. Soil Sci. Soc. Am. J. 2004, 68, 1945–1962. [Google Scholar] [CrossRef]
  9. Bünemann, E.K.; Bongiorno, G.; Bai, Z.; Creamer, R.E.; De Deyn, G.; de Goede, R.; Fleskens, L.; Geissen, V.; Kuyper, T.W.; Mäder, P.; et al. Soil quality—A critical review. Soil Biol. Biochem. 2018, 120, 105–125. [Google Scholar] [CrossRef]
  10. de Paul Obade, V.; Lal, R. Towards a standard technique for soil quality assessment. Geoderma 2016, 265, 96–102. [Google Scholar] [CrossRef]
  11. Lilburne, L.; Sparling, G.; Schipper, L. Soil quality monitoring in New Zealand: Development of an interpretative framework. Agric. Ecosyst. Environ. 2004, 104, 535–544. [Google Scholar] [CrossRef]
  12. Idowu, O.J.; van Es, H.M.; Abawi, G.S.; Wolfe, D.W.; Schindelbeck, R.R.; Moebius-Clune, B.N.; Gugino, B.K. Use of an integrative soil health test for evaluation of soil management impacts. Renew. Agric. Food Syst. 2009, 24, 214–224. [Google Scholar] [CrossRef] [Green Version]
  13. Lima, A.C.R.; Brussaard, L.; Totola, M.R.; Hoogmoed, W.B.; de Goede, R.G.M. A functional evaluation of three indicator sets for assessing soil quality. Appl. Soil Ecol. 2013, 64, 194–200. [Google Scholar] [CrossRef]
  14. Morrow, J.G.; Huggins, D.R.; Carpenter-Boggs, L.A.; Reganold, J.P. Evaluating Measures to Assess Soil Health in Long-Term Agroecosystem Trials. Soil Sci. Soc. Am. J. 2016, 80, 450–462. [Google Scholar] [CrossRef]
  15. Rinot, O.; Levy, G.J.; Steinberger, Y.; Svoray, T.; Eshel, G. Soil health assessment: A critical review of current methodologies and a proposed new approach. Sci. Total Environ. 2019, 648, 1484–1491. [Google Scholar] [CrossRef] [PubMed]
  16. Andrea, F.; Bini, C.; Amaducci, S. Soil and ecosystem services: Current knowledge and evidences from Italian case studies. Appl. Soil Ecol. 2018, 123, 693–698. [Google Scholar] [CrossRef]
  17. D’Hose, T.; Cougnon, M.; De Vliegher, A.; Vandecasteele, B.; Viaene, N.; Cornelis, W.; Van Bockstaele, E.; Reheul, D. The positive relationship between soil quality and crop production: A case study on the effect of farm compost application. Appl. Soil Ecol. 2014, 75, 189–198. [Google Scholar] [CrossRef]
  18. Fine, A.K.; van Es, H.M.; Schindelbeck, R.R. Statistics, Scoring Functions, and Regional Analysis of a Comprehensive Soil Health Database. Soil Sci. Soc. Am. J. 2017, 81, 589–601. [Google Scholar] [CrossRef]
  19. Raiesi, F. A minimum data set and soil quality index to quantify the effect of land use conversion on soil quality and degradation in native rangelands of upland arid and semiarid regions. Ecol. Indic. 2017, 75, 307–320. [Google Scholar] [CrossRef]
  20. Wu, C.; Liu, G.; Huang, C.; Liu, Q. Soil quality assessment in Yellow River Delta: Establishing a minimum data set and fuzzy logic model. Geoderma 2019, 334, 82–89. [Google Scholar] [CrossRef]
  21. Dedeke, G.A.; Owagboriaye, F.O.; Adebambo, A.O.; Ademolu, K.O. Earthworm metallothionein production as biomarker of heavy metal pollution in abattoir soil. Appl. Soil Ecol. 2016, 104, 42–47. [Google Scholar] [CrossRef]
  22. Guan, Y.; Shao, C.; Ju, M. Heavy Metal Contamination Assessment and Partition for Industrial and Mining Gathering Areas. Int. J. Environ. Res. Public Health 2014, 11, 7286. [Google Scholar] [CrossRef] [Green Version]
  23. Zhang, P.; Qin, C.; Hong, X.; Kang, G.; Qin, M.; Yang, D.; Pang, B.; Li, Y.; He, J.; Dick, R.P. Risk assessment and source analysis of soil heavy metal pollution from lower reaches of Yellow River irrigation in China. Sci. Total Environ. 2018, 633, 1136–1147. [Google Scholar] [CrossRef] [PubMed]
  24. Bai, J.; Cui, B.; Chen, B.; Zhang, K.; Deng, W.; Gao, H.; Xiao, R. Spatial distribution and ecological risk assessment of heavy metals in surface sediments from a typical plateau lake wetland, China. Ecol. Model. 2011, 222, 301–306. [Google Scholar] [CrossRef]
  25. Micó, C.; Recatalá, L.; Peris, M.; Sánchez, J. Assessing heavy metal sources in agricultural soils of an European Mediterranean area by multivariate analysis. Chemosphere 2006, 65, 863–872. [Google Scholar] [CrossRef]
  26. Norra, S.; Lanka-Panditha, M.; Kramar, U.; Stüben, D. Mineralogical and geochemical patterns of urban surface soils, the example of Pforzheim, Germany. Appl. Geochem. 2006, 21, 2064–2081. [Google Scholar] [CrossRef]
  27. van der Ent, A.; Baker, A.J.M.; Reeves, R.D.; Pollard, A.J.; Schat, H. Hyperaccumulators of metal and metalloid trace elements: Facts and fiction. Plant Soil 2013, 362, 319–334. [Google Scholar] [CrossRef]
  28. Wei, S.; Zhou, Q.; Saha, U.K.; Xiao, H.; Hu, Y.; Ren, L.; Ping, G. Identification of a Cd accumulator Conyza canadensis. J. Hazard. Mater. 2009, 163, 32–35. [Google Scholar] [CrossRef]
  29. Xiao, R.; Wang, S.; Li, R.; Wang, J.J.; Zhang, Z. Soil heavy metal contamination and health risks associated with artisanal gold mining in Tongguan, Shaanxi, China. Ecotoxicol. Environ. Saf. 2017, 141, 17–24. [Google Scholar] [CrossRef]
  30. Xiang, M.; Li, Y.; Yang, J.; Lei, K.; Li, Y.; Li, F.; Zheng, D.; Fang, X.; Cao, Y. Heavy metal contamination risk assessment and correlation analysis of heavy metal contents in soil and crops. Environ. Pollut. 2021, 278, 116911. [Google Scholar] [CrossRef]
  31. Zheng, N.; Wang, Q.; Liang, Z.; Zheng, D. Characterization of heavy metal concentrations in the sediments of three freshwater rivers in Huludao City, Northeast China. Environ. Pollut. 2008, 154, 135–142. [Google Scholar] [CrossRef]
  32. Manta, D.S.; Angelone, M.; Bellanca, A.; Neri, R.; Sprovieri, M. Heavy metals in urban soils: A case study from the city of Palermo (Sicily), Italy. Sci. Total Environ. 2002, 300, 229–243. [Google Scholar] [CrossRef]
  33. Muller, G. Index of geoaccumulation in sediments of the Rhine River. Geojournal 1969, 2, 108–118. [Google Scholar]
  34. Nemerow, N. Scientific Stream Pollution Analysis; Scripta Book, Co.: Washington, DC, USA, 1974. [Google Scholar]
  35. Hakanson, L. An ecological risk index for aquatic pollution control.a sedimentological approach. Water Res. 1980, 14, 975–1001. [Google Scholar] [CrossRef]
  36. Breiman, L. Random Forests. Mach. Learn. 2001, 45, 5–32. [Google Scholar] [CrossRef]
  37. Guo, P.-T.; Li, M.-F.; Luo, W.; Tang, Q.-F.; Liu, Z.-W.; Lin, Z.-M. Digital mapping of soil organic matter for rubber plantation at regional scale: An application of random forest plus residuals kriging approach. Geoderma 2015, 237–238, 49–59. [Google Scholar] [CrossRef]
  38. Wang, B.; Waters, C.; Orgill, S.; Cowie, A.; Clark, A.; Li Liu, D.; Simpson, M.; McGowen, I.; Sides, T. Estimating soil organic carbon stocks using different modelling techniques in the semi-arid rangelands of eastern Australia. Ecol. Indic. 2018, 88, 425–438. [Google Scholar] [CrossRef]
  39. Gholizadeh, A.; Saberioon, M.; Ben-Dor, E.; Borůvka, L. Monitoring of selected soil contaminants using proximal and remote sensing techniques: Background, state-of-the-art and future perspectives. Crit. Rev. Environ. Sci. Technol. 2018, 48, 243–278. [Google Scholar] [CrossRef]
  40. Gholizadeh, A.; Saberioon, M.; Carmon, N.; Boruvka, L.; Ben-Dor, E. Examining the Performance of PARACUDA-II Data-Mining Engine versus Selected Techniques to Model Soil Carbon from Reflectance Spectra. Remote Sens. 2018, 10, 1172. [Google Scholar] [CrossRef]
  41. Ministry of Ecology and Environment China. Soil Environmental Quality Risk Control Standard for Soil Contamination of Agricultural Land. 2018. Available online: https://www.mee.gov.cn/ywgz/fgbz/bz/bzwb/trhj/201807/W020190626595212456114.pdf (accessed on 1 August 2018). (In Chinese)
  42. Barsova, N.; Yakimenko, O.; Tolpeshta, I.; Motuzova, G. Current state and dynamics of heavy metal soil pollution in Russian Federation—A review. Environ. Pollut. 2019, 249, 200–207. [Google Scholar] [CrossRef]
  43. Bech, J.; Poschenrieder, C.; Llugany, M.; Barceló, J.; Tume, P.; Tobias, F.J.; Barranzuela, J.L.; Vásquez, E.R. Arsenic and heavy metal contamination of soil and vegetation around a copper mine in Northern Peru. Sci. Total Environ. 1997, 203, 83–91. [Google Scholar] [CrossRef]
  44. Chen, X.; Li, F.; Zhang, J.; Liu, S.; Ou, C.; Yan, J.; Sun, T. Status, fuzzy integrated risk assessment, and hierarchical risk management of soil heavy metals across China: A systematic review. Sci. Total Environ. 2021, 785, 147180. [Google Scholar] [CrossRef]
  45. Hu, B.; Shao, S.; Ni, H.; Fu, Z.; Hu, L.; Zhou, Y.; Min, X.; She, S.; Chen, S.; Huang, M.; et al. Current status, spatial features, health risks, and potential driving factors of soil heavy metal pollution in China at province level. Environ. Pollut. 2020, 266, 114961. [Google Scholar] [CrossRef] [PubMed]
  46. Mireles, F.; Davila, J.I.; Pinedo, J.L.; Reyes, E.; Speakman, R.J.; Glascock, M.D. Assessing urban soil pollution in the cities of Zacatecas and Guadalupe, Mexico by instrumental neutron activation analysis. Microchem. J. 2012, 103, 158–164. [Google Scholar] [CrossRef]
  47. Tóth, G.; Hermann, T.; Da Silva, M.R.; Montanarella, L. Heavy metals in agricultural soils of the European Union with implications for food safety. Environ. Int. 2016, 88, 299–309. [Google Scholar] [CrossRef] [PubMed]
  48. Ministry of Ecology and Environment China. Technical Guideline for the Development of Environmental Monitoringanalytical Method Standards. 2020. Available online: https://www.mee.gov.cn/ywgz/fgbz/bz/bzwb/other/qt/202012/W020201230767258917724.pdf (accessed on 1 April 2021). (In Chinese)
  49. R Core Team. R: A Language and Environment for Statistical Computing, Version 4.0.4; R Foundation for Statistical Computing: Vienna, Austria, 2021. Available online: https://www.R-project.org/(accessed on 1 June 2020).
  50. Liaw, A.; Wiener, M. Classification and Regression by RandomForest. Forest 2001, 2, 18–22. [Google Scholar]
  51. R Core Team. RStudio: Integrated Development for R, Version 2021.09.1; RStudio, Inc.: Boston, MA, USA, 2015. Available online: http://www.rstudio.com/(accessed on 1 September 2021).
  52. Jin, Y.; O’Connor, D.; Ok, Y.S.; Tsang, D.C.W.; Liu, A.; Hou, D. Assessment of sources of heavy metals in soil and dust at children’s playgrounds in Beijing using GIS and multivariate statistical analysis. Environ. Int. 2019, 124, 320–328. [Google Scholar] [CrossRef]
  53. Yang, Y.; Yang, X.; He, M.; Christakos, G. Beyond mere pollution source identification: Determination of land covers emitting soil heavy metals by combining PCA/APCS, GeoDetector and GIS analysis. Catena 2020, 185, 104297. [Google Scholar] [CrossRef]
  54. Ministry of the Environment, Finland. Government Decree on the Assessment of Soil Contamination and Remediation Needs. 2007. Available online: https://www.finlex.fi/en/laki/kaannokset/2007/en20070214.pdf (accessed on 1 March 2007).
  55. Rosstandart, M.I.R. Hygienic Standards GN 2.1.7.2041-06. Maximum Allowable Concentrations (MAC) of Chemical Substances in Soil. 2006. Available online: https://files.stroyinf.ru/Data2/1/4293850/4293850511.pdf (accessed on 1 April 2006).
  56. USEPA. Selecting Remediation Techniques for Contaminated Sediment; USEPA: Washington, DC, USA, 1993.
  57. Procuraduria Federal de Proteccion al Ambiente. Norma Oficial Mexicana NOM-147-SEMARNAT/SSA1-2004. 2016. Available online: https://www.gob.mx/profepa/documentos/norma-oficial-mexicana-nom-147-semarnat-ssa1-2004 (accessed on 13 September 2016).
  58. Jennings, A.A. Analysis of worldwide regulatory guidance values for the most commonly regulated elemental surface soil contamination. J. Environ. Manag. 2013, 118, 72–95. [Google Scholar] [CrossRef]
  59. Das, P.; Samantaray, S.; Rout, G.R. Studies on cadmium toxicity in plants: A review. Environ. Pollut. 1997, 98, 29–36. [Google Scholar] [CrossRef]
  60. Walsh, L.M.; Sumner, M.E.; Keeney, D.R. Occurrence and Distribution of Arsenic in Soils and Plants. Environ. Health Perspect. 1977, 19, 67–71. [Google Scholar] [CrossRef]
  61. Liu, J.; Li, K.; Xu, J.; Zhang, Z.; Ma, T.; Lu, X.; Yang, J.; Zhu, Q. Lead toxicity, uptake, and translocation in different rice cultivars. Plant Sci. 2003, 165, 793–802. [Google Scholar] [CrossRef]
Figure 1. Study area and location of the sampling sites.
Ijerph 19 12459 g001
Figure 2. The boxplot of each pollutant content (a) and index (b) in soil samples. Each dot represents one soil sample. The data was shown in log10 scale.
Ijerph 19 12459 g002
Figure 3. The distribution map of heavy metals and pH in the study area.
Ijerph 19 12459 g003
Figure 4. The proportion of each soil environment quality class by single pollutant factor and multiple factors (overall grade).
Ijerph 19 12459 g004
Figure 5. The projection of pollutant contents on the 1st component (PC1, 56.4% variance) and the 2nd component (PC2, 22.2% variance). The arrow stands for the vector of each pollutant factor. Each dot represents one soil sample.
Ijerph 19 12459 g005
Figure 6. The increase in mean squared error for soil environment quality of each factor in soil samples.
Ijerph 19 12459 g006
Table 1. Risk-screening value of soil pollutant factors for agricultural land (MEE China, 2018).
Pollutant FactorUtility FunctionRisk-Screening Value (Total Content, mg·kg−1)
pH Range
Lower than 5.55.5 to 6.56.5 to 7.5Higher than 7.5
CdPaddy0.30.40.60.8
Others0.30.30.30.6
HgPaddy0.50.50.61.0
Others1.31.82.43.4
AsPaddy30302520
Others40403025
PbPaddy80100140240
Others7090120170
CrPaddy250250300350
Others150150200250
Table 2. Risk-intervention value of soil pollutant factors for agricultural land (MEE China, 2018).
Pollutant FactorRisk-Intervention Value (Total Content, mg·kg−1)
pH Range
Lower than 5.55.5 to 6.56.5 to 7.5Higher than 7.5
Cd1.5234
Hg22.546
As200150120100
Pb4005007001000
Cr80085010003000
Table 3. Grading of soil environment quality.
Pollutant ContentClass of Single FactorOverall Class
CdHgAsPbCr
Lower than risk-screening value11111Determined by the highest class of single pollutant factor
Between risk-screening value and risk-intervention value22222
Higher than risk-intervention value33333
Table 4. Descriptive statistics of pollutants and pH in soil samples.
PollutantMeanMedianMinimumMaximumSDCVSkewnessKurtosis
mg·kg−1
ContentCd0.480.320.027.710.58121.06%5.6850.59
Hg0.100.090.011.030.0555.87%4.5853.78
As19.8915.811.10407.6520.28101.96%8.24122.62
Pb49.1933.618.111416.3377.73158.02%9.13114.67
Cr75.1077.718.31236.8021.4328.54%−0.285.72
IndexCd0.190.150.013.590.1892.62%7.3595.79
Hg0.030.030.000.520.0269.70%6.2793.87
As0.150.100.012.330.18115.97%5.2748.06
Pb0.080.070.011.850.10119.27%10.56155.77
Cr0.080.080.010.280.0332.95%0.254.54
pH6.205.894.058.401.1218.01%0.401.83
Table 5. Factor loadings, extraction sums of squared loadings, and the proportion of variance.
PC1PC2
Cd−0.5350.210
Hg−0.368−0.464
As−0.5210.058
Pb−0.5120.367
Cr−0.206−0.775
Standard Deviation1.6791.055
Proportion of Variance56.4%22.2%
Cumulative Proportion56.4%78.6%
Table 6. Results of GLM analysis showing the effects of contents of Cd, Hg, As, Pb, Cr, and pH on the grading results of soil environment quality (class 1, 2, 3). The data of heavy metal contents were standardized by log10 transformation.
CoefficientStandard Errort-Valuep-Value
Intercept2.8530.16317.483<0.001
Cd1.3780.04034.261<0.001
Hg−0.2090.042−4.909<0.001
As0.6890.04216.498<0.001
Pb−0.4620.048−9.527<0.001
Cr−0.2150.056−3.808<0.001
pH−0.1140.007−15.495<0.001
Table 7. Results of RF algorithm showing the importance of contents of Cd, Hg, As, Pb, Cr, and pH on the grading results of soil environment quality (class 1, 2, 3).
FactorsIncrease in Mean Squared Error (%)Increase in Node Purity
Cd32.5341.765
Hg0.628.035
As10.0146.863
Pb4.062.480
Cr0.418.004
pH6.579.173
Publisher’s Note: MDPI stays neutral with regard to jurisdictional claims in published maps and institutional affiliations.

