
The Impact of “Home Office” Work on Physical Activity and Sedentary Behavior during the COVID-19 Pandemic: A Systematic Review


Abstract
:1. Introduction
2. Materials and Methods
2.1. Search Strategy and Inclusion Criteria
2.2. Risk of Bias
2.3. Stringency Level
2.4. Content Data Analysis

| Criterion (Additional 1) Study No. | 1. Question Stated? | 2. Population Specified? | 3. Participation ≥ 50%? | 4. Inclusion and Exclusion Criteria Uniformly? | 5. Sample Size Tested? | 6. Exposure Measured Prior to the Outcome? | 7. Timeframe Sufficient? | 8. Did the Study Examine Different Levels of Exposure? | 9. Exposure Measures Clearly Defined? | 10. Exposure Assessed More Than Once over Time? | 11. Outcome Measures Clearly Defined? | 12. Outcome Assessors Blinded? | 13. Drop Out ≤ 20%? | 14. Confounding Variables Measured and Adjusted Statistically? | Sum Score |
|---|---|---|---|---|---|---|---|---|---|---|---|---|---|---|---|
| Aegerter et al. (2021) [12] | Y | Y | N | Y | N | Y | Y | Y | Y | Y | Y | O | O | N | 9 |
| Aladro-Gonzalvo et al. (2021) [13] | Y | Y | N | Y | N | Y | Y | N | Y | N | Y | O | O | N | 7 |
| Argus et al. (2021) [14] | Y | Y | Y | Y | N | Y | Y | N | Y | N | Y | O | O | N | 8 |
| Barkley et al. (2020) [15] | Y | N | Y | Y | N | Y | Y | Y | Y | N | Y | O | Y | Y | 9 |
| Brusaca et al. (2021) [10] | Y | Y | N | Y | N | N | Y | N | Y | Y | Y | O | N | N | 7 |
| Fukushima et al. (2021) [16] | Y | N | Y | Y | N | N | Y | N | Y | Y | Y | O | O | N | 7 |
| Füzéki et al. (2021) [17] | Y | Y | Y | Y | N | Y | Y | Y | Y | Y | Y | O | O | Y | 11 |
| Füzéki et al. (2021) [18] | Y | Y | Y | Y | N | Y | Y | Y | Y | Y | Y | O | Y | Y | 12 |
| Füzéki et al. (2021) [19] | Y | Y | Y | Y | N | Y | Y | Y | Y | Y | Y | O | Y | Y | 12 |
| Howe et al. (2021) [20] | Y | Y | Y | Y | N | Y | Y | N | Y | N | Y | O | O | N | 8 |
| Huner et al. (2021) [21] | Y | Y | Y | Y | N | Y | Y | Y | Y | N | Y | O | O | N | 9 |
| Katewongsa et al. (2021) [22] | Y | Y | Y | Y | N | Y | Y | Y | Y | N | Y | O | O | N | 9 |
| Koohsari et al. (2021) [11] | Y | Y | Y | Y | N | Y | Y | Y | Y | N | Y | O | Y | Y | 11 |
| Limbers et al. (2020) [23] | Y | Y | Y | Y | N | Y | Y | Y | Y | N | Y | O | O | Y | 10 |
| Lipert et al. (2021) [24] | Y | N | Y | Y | N | Y | Y | Y | Y | N | Y | O | O | N | 8 |
| Rapisarda et al. (2021) [25] | Y | Y | Y | Y | N | Y | Y | Y | Y | Y | Y | Y | O | Y | 12 |
| Rees-Punia et al. (2021) [26] | Y | Y | N | Y | N | Y | Y | Y | Y | N | Y | O | Y | Y | 10 |
| Schoofs et al. (2022) [27] | Y | Y | Y | Y | Y | Y | Y | Y | Y | N | Y | O | O | Y | 11 |
| Schuch et al. (2021) [28] | Y | Y | Y | Y | N | N | Y | Y | Y | N | Y | O | O | Y | 9 |
| Xiao et al. (2021) [29] | Y | Y | Y | Y | N | Y | Y | Y | Y | N | Y | O | O | Y | 10 |
| Yoshimoto et al. (2021) [30] | Y | Y | N | Y | Y | Y | Y | Y | Y | N | Y | O | O | N | 9 |
3. Results
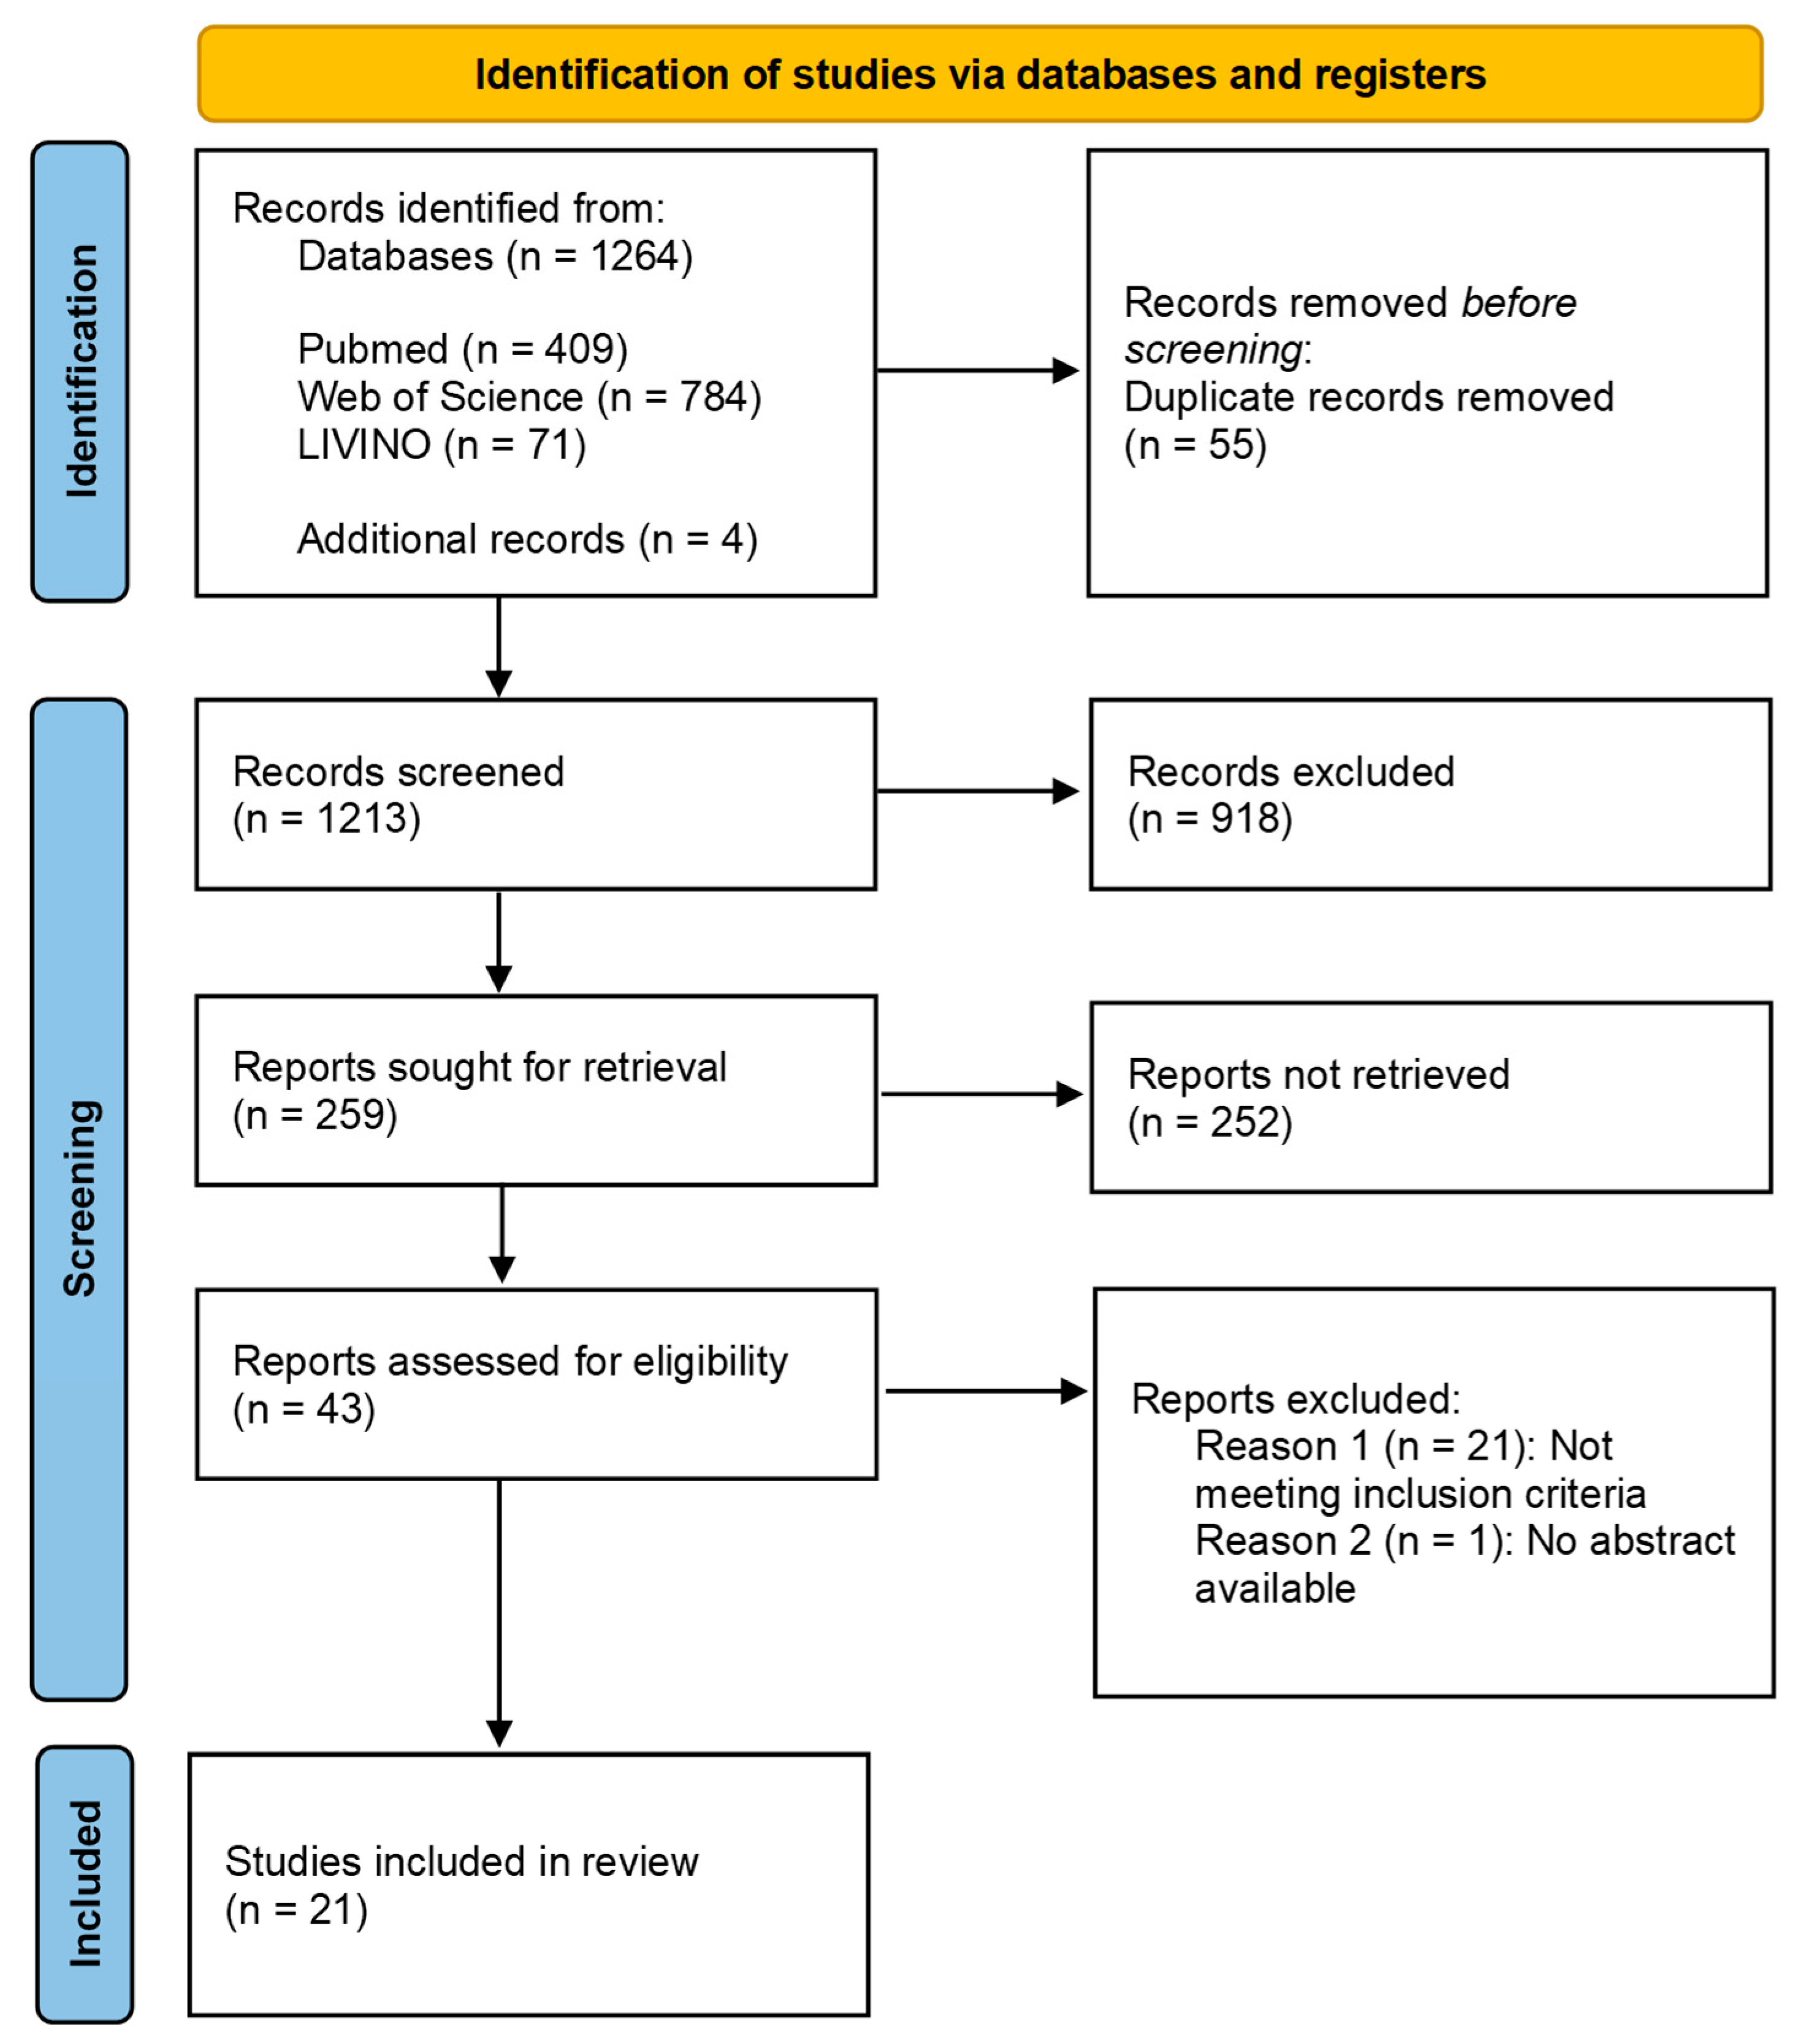
3.1. Search Strategy and Identified Sources
- Statement on physical activity;
- Statement on the change in physical activity due to the COVID-19 pandemic (e.g., due to home office, higher workload, changed working conditions);
- Statement on body measurements (e.g., body weight/BMI).
3.2. Methodological Study Quality (Risk of Bias)
3.3. Content Analysis
3.4. Change in Behavior
3.4.1. Change in Sedentary Behavior
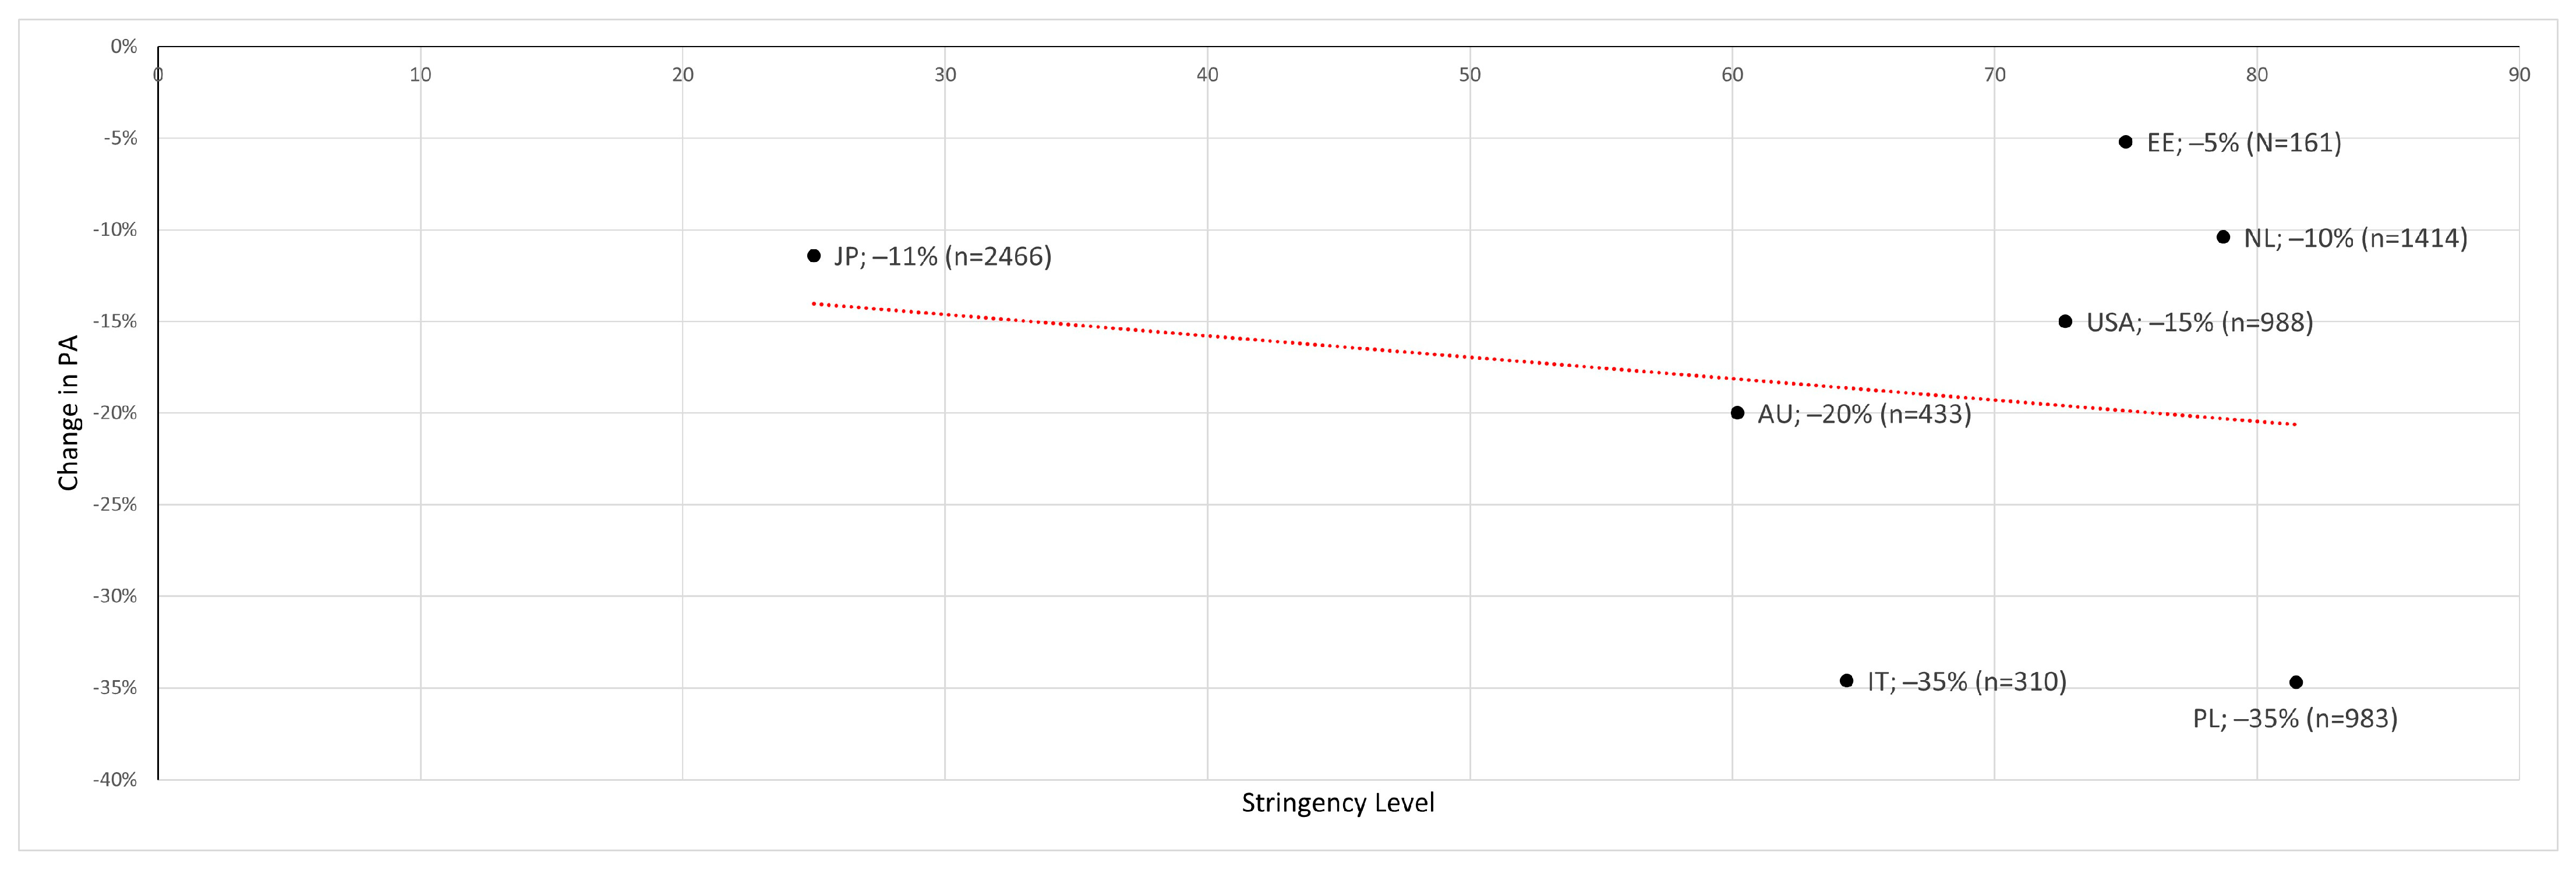
3.4.2. Change in Physical Activity
3.4.3. Change in Light Physical Activity
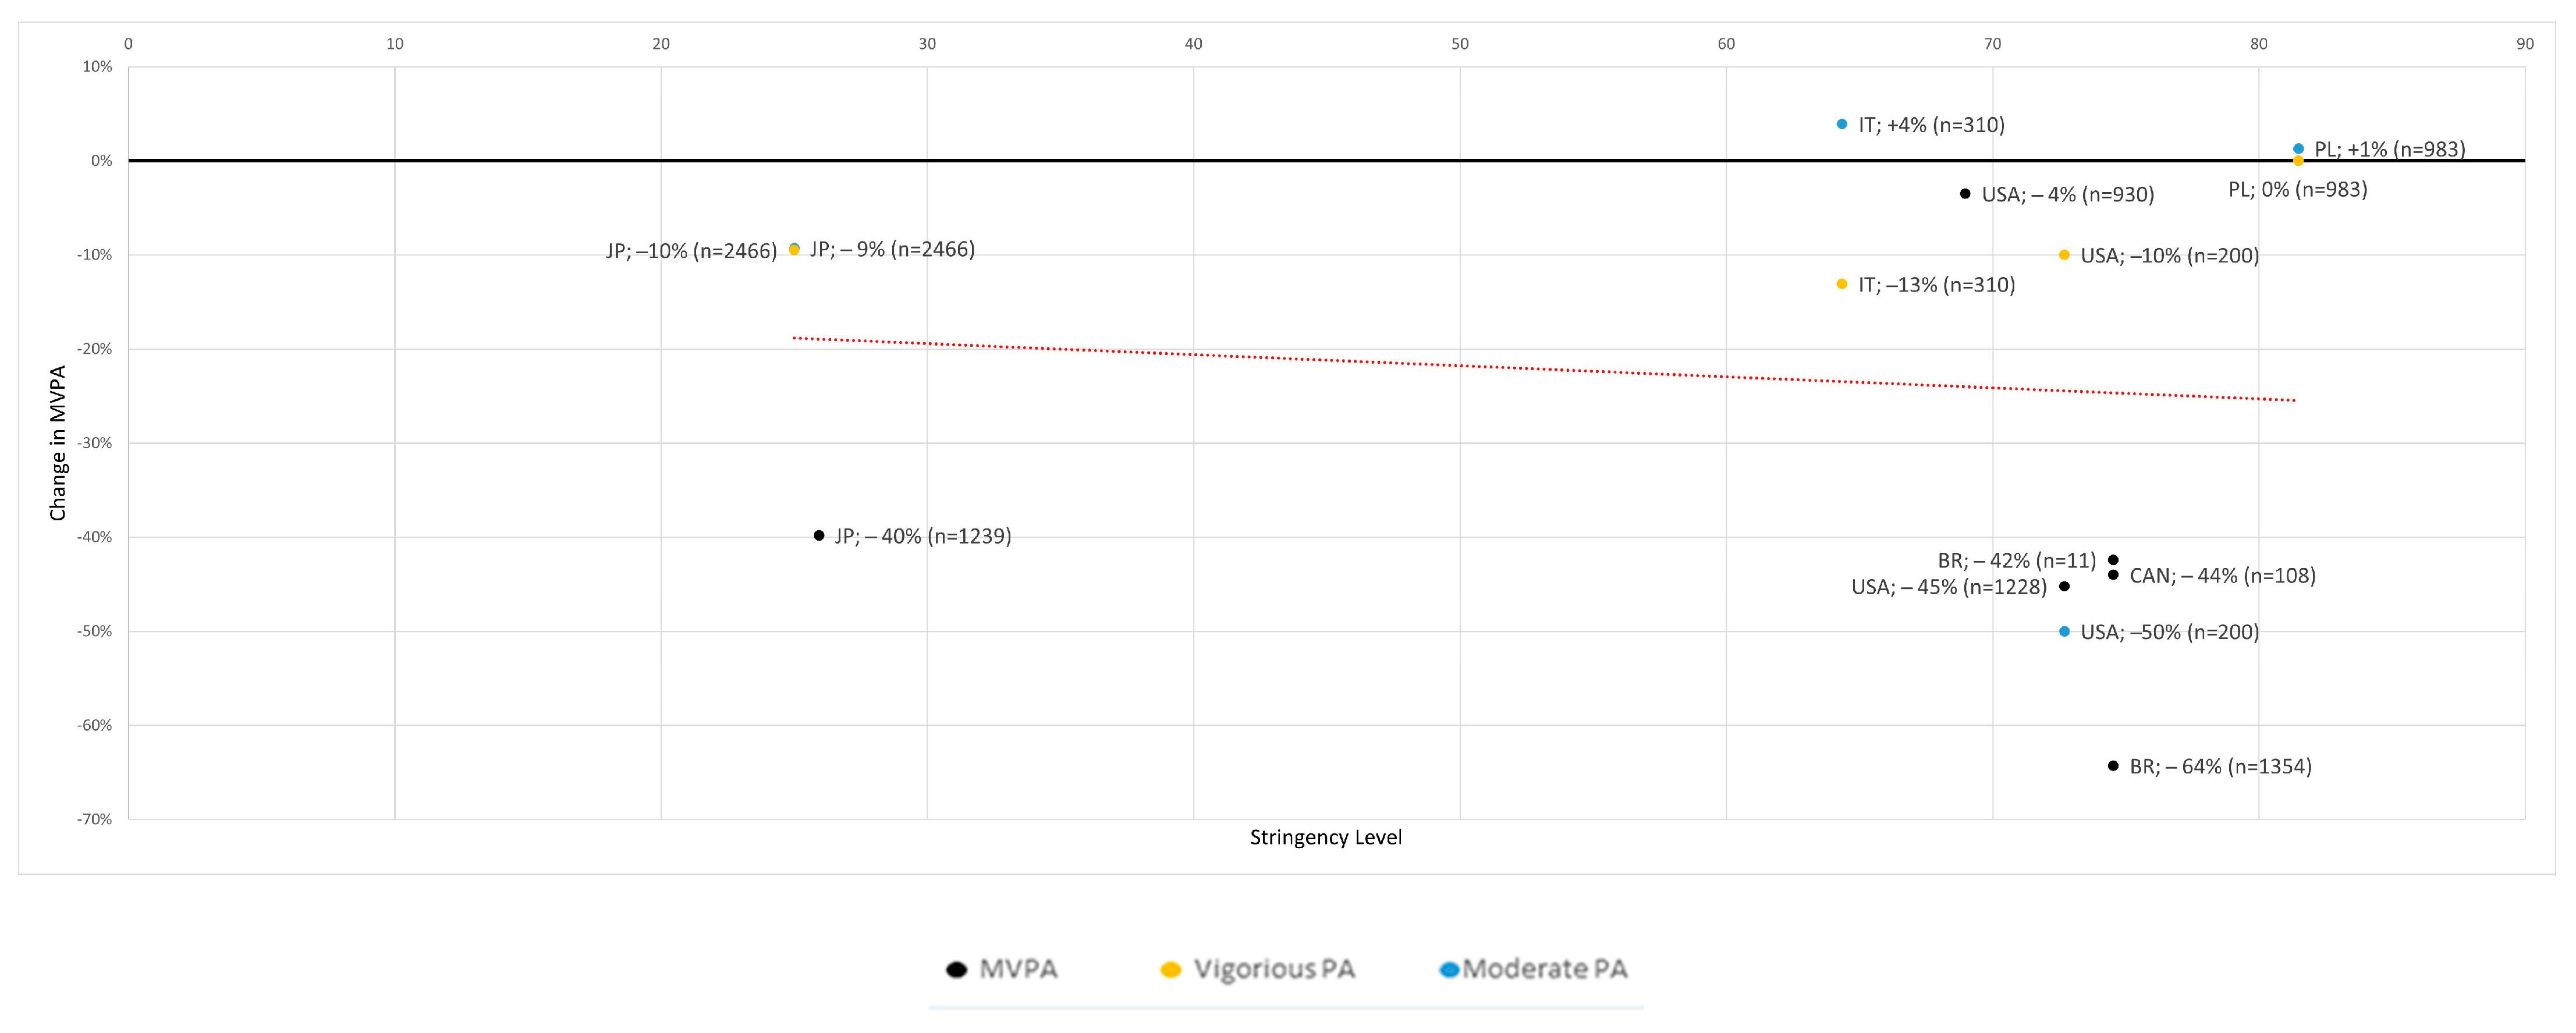
3.4.4. Change in Moderate to Vigorous Physical Activity
3.5. Secondary Outcomes
4. Discussion
5. Conclusions
Author Contributions
Funding
Institutional Review Board Statement
Informed Consent Statement
Data Availability Statement
Acknowledgments
Conflicts of Interest
Appendix A
| Study | Study Characteristics, Stringency Level & Workplace Conditions
| Population & Participants
| Primary Outcome (PA-Changes) | Control Group | Secondary Outcomes (Physical: e.g., BMI or Mental: e.g., Mood, Quality of Life) | Specialties/ Conclusions |
|---|---|---|---|---|---|---|
| Aegerter et al. (2021) [12] | Longitudinal study based on data from an ongoing randomized controlled trial (International Physical Activity Questionnaire—Short-Form: IPAQ-SF); January 2020 to April 2020 Stringency: no measures Workplace: no measures | Canton of Zurich and Aargau, Switzerland sex: 76 (28.95%/71.05%) age (y): 42.7 (21.8–62.7) | No changes in PA | No controls | BMI: No change Better work-life balance reported by 43.4%, worsened by 22.4% | This study could not show any influence of changes in the workplace on physical activity. However, an improvement in work-life balance and a reduction in working hours were found. One-off effects such as relatively good weather, reduced working hours and a generally higher perception of one’s own health due to the pandemic represent a risk-of-bias |
| Alardo-Gonzalvo et al. (2021) [13] | Cross-sectional online survey (IPAQ); 22 March 2020 to 27 March 2020 Stringency: 5.56 Workplace: no closing | Ecuador sex: 67 (21.3/78.7) age: 40.6 ± 10.8 | Sedentary total: +20% Sedentary female: +25.2% Sedentary male: +6.9% | Captured in study: Students n = 390: Sedentary total: +26.4% Sedentary female: +28.4% Sedentary male: +22.7% | No change in measurements reported | Decrease in Sedentary. Female with higher decrease in Sedentary. |
| Argus et al. (2021) [14] | Cross-sectional internet-based survey (Baecke Physical Activity Questionnaire: BPAI & NORDIC Questionnaire); May 2020 to June 2020 Stringency: 75 Workplace: Require closing all but essential | Tartu, Estonia sex: 161 (35.4%/64.6%) age (y): 38.2 ± 9.5 (20–59) | PA total decrease: −0.41 ±1.37, −5.2% BPAI (ES = 0.26) PA work increase: +0.18 ±0.54, +7.9% BPAI (ES = 0.5) | No controls | Negative correlation between the change in self-reported sports PA and MSP (ES = −0.21), a change in workplace comfort (ES = −0.26) and a change in workplace ergonomics score (ES = −0.23) | Decrease in overall physical activity, but increase in work-associated physical activity |
| Barkley et al. (2020) [15] | Cross-sectional online survey (Godin Physical Activity Questionnaire & IPAQ; 18 May 2020 to 18 June 2020 Stringency: 72.69 Workplace: Require closing all but essential | Kent State University Ohio, USA 214 (176 Faculty, 28 Staff, 10 Administrators) age (y): Faculty (52.1 ± 10.7), Staff (48.1 ± 12.5), Administrators (48.2 ± 8.6) | Faculty, Staff and Administrators: No changes in PA Sedentary increases: Faculty: +15.2% Staff: +6.3% Administrators: 9.9% | Captured in study: Undergrade students (n = 100) with change in mild physical activity (−33.7%) Sedentary: Undergrade (n = 100): +19.2% Grad (n = 84): +18.1% | BMI: No change in all groups | Additional it could be shown that the group that had the highest physical activity before the pandemic had the highest decrease in physical activity during the pandemic. However, this analysis did not distinguish between students and employees. |
| Brusaca et al. (2021) [10] | Case-series with accelerometer data collection; September 2019 to July 2020 Stringency: 74.54 Workplace: Require closing all but essential | Brazil; São Carlos sex: 11 (54.5%/45.5%) age (y): 39.3 ± 9.6 (26–57) | Sedentary decrease: −3.3% Standing decrease: −1.8% Light-PA decrease: −10.6% MVPA decrease: −42.4% Time in Bed increase: +11.6% | No controls | No change in measurements reported | Workers spent more Time in Bed relative to time awake during home-office and decrease there MVPA |
| Fukushima et al. (2021) [16] | Cross-sectional online survey (Work-related Physical Activity Questionnaire: WPAQ); 28 July 2020 to 2 August 2020 Stringency: 25.93 Workplace: Recommend closing | Japan; Tokyo (41.73%), Others (58.27%) sex: 1239 (59.24%/ 40.76%) age (y): 20–79 | Sedentary crude (adjusted): +111 ± 76.3 min/day, +49% Light-PA: −53.3 ± 49.2 min/day, −47.2% MVPA: −36.6 ±27.3 min/day, −39.8% | No controls | No measurements collected | Workers who worked from home spent less PA time and linger uninterrupted Sedentary time during work time than those who never worked at home Use of active workstations is a powerful intervention |
| Füzéki et al. (2021) [17] | Cross-sectional online survey (European Health Interview Survey—Physical Activity Questionnaire: EHIS-PAQ) asking prior to and during lockdown condition; 15 April 2020 to 23 June 2020 Stringency: 85.19 Workplace: Require closing all but essential | Italian Population sex: 1500 (24.5%/ 75.1%) age (y): 43.1 ± 1.3 | Walking: −11.4% (ES = 0.46) Cycling: −62.8% (ES = 0.3) TRPA: −51.9% (ES = 0.51) LTPA: −30% (ES = 0.31) DMSA: −1.1% (ES = 0.3) WRPA: no change | No controls | BMI: no change | No differentiation for walking, cycling, Leisure time PA between WFH and NWFH; WRPA does not distinguish between WFH and NWFH Decrease in TRPA (because of closure of all non-essential businesses and WFH) and Leisure time PA, no change in WRPA |
| Füzéki et al. (2021) [18] | Cross-sectional online survey (EHIS-PAQ) asking prior to and during lockdown condition; 23 April 2020 to 12 September 2020 Stringency: 76.85 Workplace: Require closing all but essential | Germany sex: 979 (28.2%/71.8%) age: 44 ± 14.7 | Walking: −10.5% (ES = 0.16) Cycling: −18.3% (ES = 0.13) LTPA: −15.9% (ES = 0.22) TRPA: −13.6% (ES = 0.13) DMSA: −6.3% (ES = 0.07) | No controls | No measurements collected | Light-PA has declined more in the WFH group than in the NWFH group. No further interactions. |
| Füzéki et al. (2021) [19] | Cross-sectional online survey (EHIS-PAQ) asking prior to and during lockdown condition; 8 April 2021 to 2 July 2021 Stringency: 76.85 Workplace: Require closing some sectors | Germany sex: 993 (28.7%/71.3%) age: 44 ± 14.7 | Walking: −17.4% (ES = 0.21) Cycling: −5.2% (ES = 0.18) LTPA: −22.1% (ES = 0.33) TRPA: −20% (ES = 0.25) DMSA: −11.8% (ES = 0.13) | No controls | Well-Being: −24% | TRPA has declined more in the WFH group than in the NWFH group. WFH did not affect light-PA and depressive Mode. |
| Howe et al. (2021) [20] | Cross-sectional Qualtrics online survey (Global Physical Activity Questionnaire: GPAQ) asking prior to and during lockdown; 21 April 2020 to 9 May 2020 USA Stringency: 72.69 Workplace: Require closing all but essential CAN Stringency: 74.54 Workplace: Require closing all but essential | USA (91.9%), CAN (8.1%); Caucasian (88.8%), Black (3.4%), Asian (3%), others (4.8%) sex: 1336 (25.1%/74 −2%/0.7%) age (y): 18->70 | Work-related MVPA: Overall decrease: −45.2% CAN −44% USA MVPA decrease: −58.2% with a change in work environment by 687 (51.4%) participants TRPA decreases: USA: −188.1 ± 51.9 min/week CAN: −152.6 ± 14.1 min/week Sedentary time increase: +94.9 ± 4.1 min/week | Captured in study: MVPA with no change in work environment by 467 (35%) participants: −8.7% | No measurements collected | Bias Risk factors: Younger adults, female, Caucasian Significant decrease of MVPA and TRPA with a change in work environment; no additional significant increase in SB with a change in work environment |
| Hunter et al. (2021) [21] | Cross-sectional online survey (IPAQ); 9 June 2020 to 9 August 2020 Stringency: 60.19 Workplace: Recommend closing | Australia and New Zealand and Oceania (51.3%), Caucasian (38.3%), Asian (5.8%), Other (4.6%) sex: 433 (23.3%/75.1%) age: 38.8 | Total PA: −20% | No controls | Work ability: −20% Mental work ability: −20% | Met the MVPA guideline result in better work ability and mental work ability |
| Katewongsa et al. (2021) [22] | Cross-sectional online survey (GPAQ); March 2020 to May 2020 Stringency: 0 Workplace: No closing | Thailand sex: 6531 (50.9%/49.1%) age: 18–39 (69.1%), 40–64 (30.9%) | Sedentary: +6.2% Population with sufficient MVPA: −17.6% | Captured in study: From 2019 n = 5379 sex: 5379 (48.5%/51.5%) age: 18–39 (43.9%), 40–64 (56.1%) | No change in measurements reported | Bias Risk factors: Female, students, unemployed The study does not differentiate between students, unemployed and employees A relationship is observed between the WFH obligation and the increase in sedentary behavior |
| Koohsari et al. (2021) [11] | Prospective online survey (GPAQ & Fatigue Questionnaire/ Checklist Individual Strength: CIS20-R); 22 February 2019 to 8 July 2020 Stringency: 25 Workplace: No closing | Japan sex: 2466 (50.9%/49.1%) age: 39.6 ± 10.7 | Sedentary behavior (n = 1086) Work-related: +9.8% Total: +6.4% PA work-related (n = 1315): Vigorous: −9.5% Moderate: −9.3% TRPA: −8.3% Total PA-Change: −11.4% | No controls | Associations of the changes in workers’ sedentary behaviors and physical activity with changes in their fatigue | Sedentary work has increased disproportionately in relation to work, overall decrease in PA |
| Limbers et al. (2020) [23] | Cross-sectional online survey (IPAQ-SF & Quality of Life: WHOQOL-BREF & Perceived Stress Scale: PSS); 6 April 2020 to 13 April 2020 Stringency: 72.69 Workplace: Require closing all but essential | USA Caucasian (70%), Black (6%), Latino (11%), others (13%) sex: 200 (0%/100%) age: 33.5 ± 6.25 | Parenting Stress by WFH decrease: Moderate PA: −50% (ES = 0.5) Vigorous PA: −10% (ES = 0.09) | No controls | High parenting stress caused lower quality of life and lower PA Parenting Stress decrease Physical Health Quality of Life: −58% Psychological Quality of Life: −72% Higher levels of MVPA were associated with decreased physical health quality of life in working mothers in contrast to study hypotheses | Moderate PA may be one mechanism that attenuates the association between parenting stress and a decrease in quality of life. Risk of bias: Only mothers WFH were included in this study |
| Lipert et al. (2021) [24] | Cross-sectional online survey (IPAQ-SF & Pittsburgh Sleep Quality Index: PSQI); 1 April 2020 to 14 April 2020 Stringency: 81.48 Workplace: Require closing some sectors | Poland sex: 983 (18.3%/81.7%) age: over 18 | Difference WFH to NWFH: Total PA: −34.7% Walking: −30.1% Moderate PA: +1.3% Vigorous PA: ±0 | Captured in study: Difference Not working to NWFH: Total PA: −32.6% Walking: −18.8% Moderate PA: +10.7% Vigorous PA: +3.2% | No difference in the quality of sleep between WFH, NWFH and not working. WFH reported more stress, work-life-balance disorder and a decrease in work satisfaction | The decrease in physical activity due to WFH is similar to unemployment, but unemployed persons show a higher value for moderate and vigorous PA |
| Rapisarda et al. (2021) [25] | Longitudinal Cohort Study (IPAQ-SF); March 2020 to March 2021 Stringency: 64.35 Workplace: Require closing all but essential (longitudinal study with different restrictions) | Italy sex: 310 (47%/53%) age: 44.1 | PA differences 14 March 2020 to 14 March 2021: Total PA: −31.6% Vigorous PA: −13.1% Moderate PA: +3.9% Walking: −30.9% Sedentary: +66.7% | No controls | BMI: +7% | There is a decrease in physical activity due to WFH, at the same time an increase in BMI. |
| Rees-Punia et al. (2021) [26] | Cross-sectional online survey (Cancer Prevention Study-3) compared to data from 2018; July 2020 to August 2020 Stringency: 68.89 Workplace: Require closing some sectors | USA Caucasian (75.9%), Black (3.5%), Latino (12.7%), others (7.9%) sex: 1992 (34.5%/65.5%) age: 57 ± 9.8 | NWFH (n = 897): Time in Bed: −0.1% Sedentary: +5.9% Light-PA: −3% MVPA: −2.7% WFH (n = 930): Time in Bed: −0.2% Sedentary: +8.4% Light-PA: −4.4% MVPA: −3.5% WFH + Laid off (n = 73): Time in Bed: +0.4% Sedentary: +7.9% Light-PA: −5.2% MVPA: −3.2% | Captured in study: Laid off (n = 110): Time in Bed: +4.7% Sedentary: +8.1% Light-PA: −9.2% MVPA: −3.4% | No change in measurements reported | Bias Risk factors: Higher BMI, unemployed, occupational change, lower income. |
| Schoofs et al. (2022) [27] | Cross-sectional online survey; 16 April 2020 to 12 May 2020 Stringency: 78.7 Workplace: Require closing some sectors | The Netherlands sex: 1414 (66%/34%) age: 59 ± 13 | WFH to NWFH: Total PA: −910 MET-min/week TRPA: −335 MET-min/week Occupational: −563 MET-min/week Complete study population: Total Change in PA: −10.4% Leisure Time-PA: −5.3% TRPA: −40% Occupation PA: −69.3% Household PA: +4.1% | Captured in study: Unemployed: Total PA: −886 MET-min/week TRPA: −290 MET-min/week Occupational: −543 MET-min/week | No change in measurements reported | Bias Risk factors: Female, Higher BMI, unemployed, occupational change. Due to COVID-19 Lockdown there is a decrease in PA. Women, unemployed and WFH show an increased decline in PA. |
| Schuch et al. (2021) [28] | Cross-sectional online survey asking prior to and during lockdown; 11 April 2020 to 5 2020 Stringency: 74.54 Workplace: Require closing all but essential | Brazilian Population Rio Grande do Sul state (80%), Rio de Janeiro (11%), Ceará (6%), other states (3%); Caucasians (76.3%), Mixed (18.6%), Black (2.7%), others (2.4%) sex: 1354 (27.3%/72.7%) age (y): 18–65 | MVPA decrease: −78.7 min/ day (−64.28%) Sedentary increase: 179.9 min/day (+42%) | Captured in study; Unemployed/retired: MVPA: −49.9 min/day Sedentary: 133.8 min/day | No measurements collected | No differentiation between students, soldiers, and employees Bias Risk factors: Younger adults, not married, mental disorder Employed might have reduced their commuting-related PA and have likely increased their Sedentary time due to online meetings and activities |
| Xiao et al. (2021) [29] | Cross-sectional online survey asking prior to and during lockdown; 24 April 2020 to 11 June 2020 Stringency: 72.69 Workplace: Require closing all but essential | USA 83.1% (origin): California (47.3%), other states (35.8%), outside USA (6.4%), without remaining (10.5%) Caucasian (60.9%), Asian (24.6%), Hispanic (9.3%), others (5.2%) sex: 988 (32.1%/56.5%/11.4%) age (y): 40.9 ± 13.1 | PA change overall: −15% | No controls | Decrease in physical activity produces an increase in detrimental mental health issues (2 or more) (ES = 0.52) | Protective factors male gender, high income (>150 k/year), independent work and good workstation set-up people who show a decrease in physical activity due to working from home show negative physical and mental changes |
| Yoshimoto et al. (2021) [30] | Cross-sectional online survey; 29 July 2020 to 19 August 2020 Stringency: 25.93 Workplace: No measures | Japan sex: 1941 (70.5%/29.5%) age: 43 | WFH increased psychological stress and decreased PA WFH and PA decreased (n = 326): Pain augmented by 28.5% NWFH and PA decreased (n = 590): Pain augmented by 19.5% WFH without PA decreased (n = 195): Pain augmented by 13.8% NWFH without PA decreased (n = 830): Pain augmented by 5.7% | No controls | In WFH group 23% report an increase in pain, While in NFWH group only 11.4% report an increase in pain In the group that reduced their PA, 22.7% reported additional pain, in the group with no change only 7.2%. | WFH and decreased PA results in highest augmented pain. |
| Abbreviations: BMI = body mass index, WHO = World Health Organization, QOL = quality of life, DMSA = days of muscle strengthening activities, PA = physical activity, MVPA = moderate to vigorous PA, LTPA = leisure time PA, TRPA = transport-related PA, WRPA = work-related PA, WFH = working from home, NWFH = not WFH. | ||||||
Appendix B
References
- Wilke, J.; Mohr, L.; Tenforde, A.; Edouard, P.; Fossati, C.; González-Gross, M.; Ramírez, C.S.; Laiño, F.; Tan, B.; Pillay, J.; et al. COVID-19 PA level decreases many countries. Int. J. Environ. Res. Public Health 2021, 18, 2235. [Google Scholar] [CrossRef] [PubMed]
- Hale, T.; Webster, S.; Petherick, A.; Phillips, T.; Kira, B. Oxford COVID-19 Government Response Tracker, Blavatnik School of Government. 2020. Available online: https://covidtracker.bsg.ox.ac.uk/stringency-scatter (accessed on 12 April 2022).
- Statista Research Department. Homeoffice und Mobiles Arbeitenein Überblick. 2022. Available online: https://de.statista.com/themen/6093/homeoffice/#topicHeader__wrapper (accessed on 19 May 2022).
- Olsen, H.M.; Brown, W.J.; Kolbe-Alexander, T.; Burton, N.W. Physical activity and sedentary behaviour in a flexible office-based workplace: Employee perceptions and priorities for change. Health Promot. J. Aust. 2018, 29, 344–352. [Google Scholar] [CrossRef] [PubMed]
- Ammar, A.; Brach, M.; Trabelsi, K.; Chtourou, H.; Boukhris, O.; Masmoudi, L.; Bouaziz, B.; Bentlage, E.; How, D.; Ahmed, M.; et al. Effects of COVID-19 Home Confinement on Eating Behaviour and Physical Activity: Results of the ECLB-COVID19 International Online Survey. Nutrients 2020, 12, 1583. [Google Scholar] [CrossRef] [PubMed]
- Montreuil, S.; Lippel, K. Telework and occupational health: A Quebec empirical study and regulatory implications. Saf. Sci. 2003, 41, 339–358. [Google Scholar] [CrossRef]
- Page, M.J.; McKenzie, J.E.; Bossuyt, P.M.; Boutron, I.; Hoffmann, T.C.; Mulrow, C.D.; Shamseer, L.; Tetzlaff, J.M.; Akl, E.A.; Brennan, S.E.; et al. The PRISMA 2020 statement: An updated guideline for reporting systematic reviews. PLoS Med. 2021, 6, e1000097. [Google Scholar] [CrossRef]
- Higgins, J.P.T.; Green, S. Defining the review question and developing criteria for including studies. In Cochrane Handbook for Systematic Reviews of Interventions—Version 5.1.0; The Cochrane Collaboration: London, UK, 2011; Available online: https://handbook-5-1.cochrane.org/ (accessed on 20 April 2022).
- National Heart, Lung, and Blood Institute (NHLBI) Quality Assessment Tool for Observational Cohort and Cross-Sectional Studies. Available online: https://www.nhlbi.nih.gov/health-topics/study-quality-assessment-tools (accessed on 5 April 2022).
- Brusaca, L.A.; Barbieri, D.F.; Mathiassen, S.E.; Holtermann, A.; Oliveira, A.B. Physical Behaviours in Brazilian Office Workers Working from Home during the COVID-19 Pandemic, Compared to before the Pandemic: A Compositional Data Analysis. Int. J. Environ. Res. Public Health 2021, 18, 6278. [Google Scholar] [CrossRef] [PubMed]
- Koohsari, M.J.; Nakaya, T.; McCormack, G.R.; Shibata, A.; Ishii, K.; Oka, K. Changes in Workers’ Sedentary and Physical Activity Behaviors in Response to the COVID-19 Pandemic and Their Relationships with Fatigue: Longitudinal Online Study. JMIR Public Health Surveill. 2021, 7, e26293. [Google Scholar] [CrossRef]
- Aegerter, A.M.; Deforth, M.; Sjøgaard, G.; Johnston, V.; Volken, T.; Luomajoki, H.; Dratva, J.; Dressel, H.; Distler, O.; Melloh, M.; et al. No Evidence for a Decrease in Physical Activity Among Swiss Office Workers During COVID-19: A Longitudinal Study. Front. Psychol. 2021, 12, 620307. [Google Scholar] [CrossRef]
- Aladro-Gonzalvo, A.R. Short-term changes in time spent sitting during the COVID-19 pandemic. Gazzetta Med. Ital. Arch. per le Sci. Med. 2021, 180, 280–288. [Google Scholar] [CrossRef]
- Argus, M.; Pääsuke, M. Effects of the COVID-19 lockdown on musculoskeletal pain, physical activity, and work environment in Estonian office workers transitioning to working from home. Work 2021, 69, 741–749. [Google Scholar] [CrossRef]
- Barkley, J.E.; Lepp, A.; Glickman, E.; Farnell, G.; Beiting, J.; Wiet, R.; Dowdell, B. The Acute Effects of the COVID-19 Pandemic on Physical Activity and Sedentary Behavior in University Students and Employees. Int. J. Exerc. Sci. 2020, 13, 1326–1339. [Google Scholar] [PubMed]
- Fukushima, N.; Machida, M.; Kikuchi, H.; Amagasa, S.; Hayashi, T.; Odagiri, Y.; Takamiya, T.; Inoue, S. Associations of working from home with occupational physical activity and sedentary behavior under the COVID-19 pandemic. J. Occup. Health 2021, 63, e12212. [Google Scholar] [CrossRef] [PubMed]
- Füzéki, E.; Schröder, J.; Carraro, N.; Merlo, L.; Reer, R.; Groneberg, D.; Banzer, W. Physical Activity during the First COVID-19-Related Lockdown in Italy. Int. J. Environ. Res. Public Health 2021, 18, 2511. [Google Scholar] [CrossRef] [PubMed]
- Füzéki, E.; Schröder, J.; Groneberg, D.; Banzer, W. Physical Activity and Its Related Factors during the First COVID-19 Lockdown in Germany. Sustainability 2021, 13, 5711. [Google Scholar] [CrossRef]
- Füzéki, E.; Schröder, J.; Reer, R.; Groneberg, D.A.; Banzer, W. Physical Activity and Well-Being during the Second COVID19-Related Lockdown in Germany in 2021. Sustainability 2021, 13, 12172. [Google Scholar] [CrossRef]
- Howe, C.A.; Corrigan, R.J.; Rocha de Faria, F.; Johanni, Z.; Chase, P.; Hillman, A.R. Impact of COVID-19 Stay-at-Home Restrictions on Employment Status, Physical Activity, and Sedentary Behavior. Int. J. Environ. Res. Public Health 2021, 18, 11935. [Google Scholar] [CrossRef]
- Hunter, J.R.; Meiring, R.M.; Cripps, A.; Suppiah, H.T.; Vicendese, D.; Kingsley, M.I.; Gordon, B.A. Relationships between Physical Activity, Work Ability, Absenteeism and Presenteeism in Australian and New Zealand Adults during COVID-19. Int. J. Environ. Res. Public Health 2021, 18, 12563. [Google Scholar] [CrossRef]
- Katewongsa, P.; Potharin, D.; Rasri, N.; Palakai, R.; Widyastari, D. The Effect of Containment Measures during the COVID-19 Pandemic to Sedentary Behavior of Thai Adults: Evidence from Thailand’s Surveillance on Physical Activity 2019–2020. Int. J. Environ. Res. Public Health 2021, 18, 4467. [Google Scholar] [CrossRef]
- Limbers, C.A.; McCollum, C.; Greenwood, E. Physical activity moderates the association between parenting stress and quality of life in working mothers during the COVID-19 pandemic. Ment. Health Phys. Act. 2020, 19, 100358. [Google Scholar] [CrossRef]
- Lipert, A.; Musiał, K.; Rasmus, P. Working Mode and Physical Activity as Factors Determining Stress and Sleep Quality during COVID-19 Pandemic Lockdown in Poland. Life 2021, 12, 28. [Google Scholar] [CrossRef]
- Rapisarda, V.; Loreto, C.; De Angelis, L.; Simoncelli, G.; Lombardo, C.; Resina, R.; Mucci, N.; Matarazzo, A.; Vimercati, L.; Ledda, C. Home Working and Physical Activity during SARS-CoV-2 Pandemic: A Longitudinal Cohort Study. Int. J. Environ. Res. Public Health 2021, 18, 13021. [Google Scholar] [CrossRef]
- Rees-Punia, E.; Newton, C.C.; Rittase, M.H.; Hodge, R.A.; Nielsen, J.; Cunningham, S.; Teras, L.R.; Patel, A. Prospective changes in physical activity, sedentary time and sleep during the COVID-19 pandemic in a US-based cohort study. BMJ Open 2021, 11, e053817. [Google Scholar] [CrossRef]
- Schoofs, M.C.A.; Bakker, E.A.; de Vries, F.; Hartman, Y.A.W.; Spoelder, M.; Thijssen, D.H.J.; Eijsvogels, T.M.H.; Buffart, L.M.; Hopman, M.T.E. Impact of Dutch COVID-19 restrictive policy measures on physical activity behavior and identification of correlates of physical activity changes: A cohort study. BMC Public Health 2022, 22, 147. [Google Scholar] [CrossRef]
- Schuch, F.B.; Bulzing, R.A.; Meyer, J.; López-Sánchez, G.F.; Grabovac, I.; Willeit, P.; Vancampfort, D.; Caperchione, C.M.; Sadarangani, K.P.; Werneck, A.O.; et al. Moderate to vigorous physical activity and sedentary behavior changes in self-isolating adults during the COVID-19 pandemic in Brazil: A cross-sectional survey exploring correlates. Sport Sci. Health 2021, 18, 155–163. [Google Scholar] [CrossRef]
- Xiao, Y.; Becerik-Gerber, B.; Lucas, G.; Roll, S.C. Impacts of Working From Home During COVID-19 Pandemic on Physical and Mental Well-Being of Office Workstation Users. J. Occup. Environ. Med. 2021, 63, 181–190. [Google Scholar] [CrossRef]
- Yoshimoto, T.; Fujii, T.; Oka, H.; Kasahara, S.; Kawamata, K.; Matsudaira, K. Pain Status and Its Association with Physical Activity, Psychological Stress, and Telework among Japanese Workers with Pain during the COVID-19 Pandemic. Int. J. Environ. Res. Public Health 2021, 18, 5595. [Google Scholar] [CrossRef]
- Diaz, K.; Howard, V.J.; Hutto, B.; Colabianchi, N.; Vena, J.E.; Safford, M.M.; Blair, S.N.; Hooker, S.P. Patterns of Sedentary Behavior and Mortality in U.S. Middle-Aged and Older Adults: A National Cohort Study. Ann. Intern. Med. 2017, 167, 465–475. [Google Scholar] [CrossRef]
- Guo, H.R.; Tanaka, S.; Halperin, W.E.; Cameron, L.L. Back pain prevalence in US industry and estimates of lost workdays. Am. J. Public Health 1999, 89, 1029–1035. [Google Scholar] [CrossRef]
- World Health Organization. WHO Guidelines on Physical Activity and Sedentary Behaviour; World Health Organization: Geneva, Switzerland, 2020.
- McCarthy, H.; Potts, H.W.W.; Fisher, A. Physical Activity Behavior Before, During, and After COVID-19 Restrictions: Longitudinal Smartphone-Tracking Study of Adults in the United Kingdom. J. Med. Internet Res. 2021, 23, e23701. [Google Scholar] [CrossRef]
- Martínez-De-Quel, Ó.; Suárez-Iglesias, D.; López-Flores, M.; Pérez, C.A. Physical activity, dietary habits and sleep quality before and during COVID-19 lockdown: A longitudinal study. Appetite 2020, 158, 105019. [Google Scholar] [CrossRef]
- Bourdas, D.I.; Zacharakis, E.D. Evolution of changes in physical activity over lockdown time: Physical activity datasets of four independent adult sample groups corresponding to each of the last four of the six COVID-19 lockdown weeks in Greece. Data Brief. 2020, 32, 106301. [Google Scholar] [CrossRef] [PubMed]
- Robert Koch-Institut GBE Kompakt 1/2012: Arbeitslosigkeit, Prekäre Beschäftigung und Gesundheit. Available online: https://www.rki.de/DE/Content/Gesundheitsmonitoring/Gesundheitsberichterstattung/GBEDownloadsK/2012_1_Arbeitslosigkeit_Gesundheit.pdf?__blob=publicationFile (accessed on 25 April 2022).
- Office for National Statistics. Parenting in Lockdown: Coronavirus and the Effects on Work-Life Balance. 2020. Available online: https://www.ons.gov.uk/peoplepopulationandcommunity/healthandsocialcare/conditionsanddiseases/articles/parentinginlockdowncoronavirusandtheeffectsonworklifebalance (accessed on 22 July 2020).
- Füzéki, E.; Schröder, J.; Reer, R.; Groneberg, D.A.; Banzer, W. Going Online?—Can Online Exercise Classes during COVID-19-Related Lockdowns Replace in-Person Offers? Int. J. Environ. Res. Public Health 2022, 19, 1942. [Google Scholar] [CrossRef]
- Joshi, D.; Missiuna, C.; Hanna, S.; Hay, J.; Faught, B.E.; Cairney, J. Reprint of “Relationship between BMI, waist circumference, physical activity and probable developmental coordination disorder over time”. Hum. Mov. Sci. 2015, 42, 307–317. [Google Scholar] [CrossRef]
- Faulkner, J.; O’Brien, W.J.; McGrane, B.; Wadsworth, D.; Batten, J.; Askew, C.D.; Badenhorst, C.; Byrd, E.; Coulter, M.; Draper, N.; et al. Physical activity, mental health and well-being of adults during initial COVID-19 containment strategies: A multi-country cross-sectional analysis. J. Sci. Med. Sport 2020, 24, 320–326. [Google Scholar] [CrossRef]
- Chen, K.Y.; Bassett, D.R., Jr. The Technology of Accelerometry-Based Activity Monitors: Current and Future. Med. Sci. Sports Exerc. 2005, 37, S490–S500. [Google Scholar] [CrossRef] [Green Version]


| Data Base | Key Words | Results |
|---|---|---|
| PubMed | (((physical activity[Title]) OR physical behaviours[Title]) AND COVID-19[Title]) AND ((Working from home) OR (home office) OR (Home Working) OR (Remote Working)) | 409 |
| Web of Science | (((((TI = (physical activity)) AND TI = (physical behaviours)) AND TI = (COVID-19)) AND ALL = (Working from home)) OR ALL = (home office)) OR ALL = (Home Working) OR (Remote Working) | 784 |
| LIVIVO | Title and free text-filters: 1. Abstracts; 2. Articles of the last 2 years; 3. Language: German and English ((TI = (physical activity) AND Working from home) AND TI = (COVID-19)) AND PY = 2020:2022 | 71 |
| Additional | “hand search in identified articles’ references” | 4 |
| Identification summed up (8 February 2022) | 1268 | |
| SB | Participants | Change |
|---|---|---|
| Barkley et al. (2020) [15] | 10 | 10% |
| Brusaca et al. (2021) [10] | 11 | −3% |
| Barkley et al. (2020) [15] | 28 | 6% |
| Alardo-Gonzalvo et al. (2021) [13] | 67 | 20% |
| Barkley et al. (2020) [15] | 176 | 15% |
| Rapisarda et al. (2021) [25] | 310 | 67% |
| Rees-Punia et al. (2021) [26] | 930 | 8% |
| Fukushima et al. (2021) [16] | 1239 | 49% |
| Schuch et al. (2021) [28] | 1354 | 42% |
| Koohsari et al. (2021) [11] | 2466 | 10% |
| Katewongsa et al. (2021) [22] | 6531 | 6% |
| PA | Participants | Change |
|---|---|---|
| Aegerter et al. (2021) [12] | 76 | 0% |
| Argus et al. (2021) [14] | 161 | −5% |
| Rapisarda et al. (2021) [25] | 310 | −35% |
| Hunter et al. (2021) [21] | 433 | −20% |
| Lipert et al. (2021) [24] | 983 | −35% |
| Xiao et al. (2021) [29] | 988 | −15% |
| Schoofs et al. (2022) [27] | 1414 | −10% |
| Koohsari et al. (2021) [11] | 2466 | −11% |
| Light-PA | Participants | Change |
|---|---|---|
| Brusaca et al. (2021) [10] | 11 | −11% |
| Rapisarda et al. (2021) [25] | 310 | −31% |
| Rees-Punia et al. (2021) [26] | 930 | −4% |
| Füzeki et al. (2021) [18] | 979 | −16% |
| Lipert et al. (2021) [24] | 983 | −30% |
| Füzeki et al. (2021) [19] | 993 | −22% |
| Fukushima et al. (2021) [16] | 1239 | −47% |
| TRAP/Walking | Participants | Change TRPA/Walking |
|---|---|---|
| Rapisarda et al. (2021) [25] | 310 | n.a./−31% |
| Füzeki et al. (2021) [18] | 979 | −13.6%/−11% |
| Füzeki et al. (2021) [19] | 993 | −20%/−17% |
| Füzeki et al. (2021) [17] | 1500 | −51.9%/−11% |
| Koohsari et al. (2021) [11] | 2466 | −9.4/n.a. |
| MVPA | Participants | Change |
|---|---|---|
| Brusaca et al. (2021) [10] | 11 | −42% |
| Fukushima et al. (2021) [16] | 1239 | −40% |
| Howe et al. (CAN) (2021) [20] | 108 | −44% |
| Howe et al. (USA) (2021) [20] | 1228 | −45% |
| Koohsari et al. (moderate PA) (2021) [11] | 2466 | −9% |
| Koohsari et al. (vigorous PA) (2021) [11] | 2466 | −10% |
| Limbers et al. (moderate PA) (2020) [23] | 200 | −50% |
| Limbers et al. (vigorous PA) (2020) [23] | 200 | −10% |
| Lipert et al. (moderate PA) (2021) [24] | 983 | 1% |
| Lipert et al. (vigorous PA) (2021) [24] | 983 | 0% |
| Rapisarda et al. (moderate PA) (2021) [25] | 310 | 4% |
| Rapisarda et al. (vigorous PA) (2021) [25] | 310 | −13% |
| Rees-Punia et al. (2021) [26] | 930 | −4% |
| Schuch et al. (2021) [28] | 1354 | −64% |
Publisher’s Note: MDPI stays neutral with regard to jurisdictional claims in published maps and institutional affiliations. |
© 2022 by the authors. Licensee MDPI, Basel, Switzerland. This article is an open access article distributed under the terms and conditions of the Creative Commons Attribution (CC BY) license (https://creativecommons.org/licenses/by/4.0/).
Share and Cite
Wilms, P.; Schröder, J.; Reer, R.; Scheit, L. The Impact of “Home Office” Work on Physical Activity and Sedentary Behavior during the COVID-19 Pandemic: A Systematic Review. Int. J. Environ. Res. Public Health 2022, 19, 12344. https://doi.org/10.3390/ijerph191912344
Wilms P, Schröder J, Reer R, Scheit L. The Impact of “Home Office” Work on Physical Activity and Sedentary Behavior during the COVID-19 Pandemic: A Systematic Review. International Journal of Environmental Research and Public Health. 2022; 19(19):12344. https://doi.org/10.3390/ijerph191912344
Chicago/Turabian StyleWilms, Patrick, Jan Schröder, Rüdiger Reer, and Lorenz Scheit. 2022. "The Impact of “Home Office” Work on Physical Activity and Sedentary Behavior during the COVID-19 Pandemic: A Systematic Review" International Journal of Environmental Research and Public Health 19, no. 19: 12344. https://doi.org/10.3390/ijerph191912344
APA StyleWilms, P., Schröder, J., Reer, R., & Scheit, L. (2022). The Impact of “Home Office” Work on Physical Activity and Sedentary Behavior during the COVID-19 Pandemic: A Systematic Review. International Journal of Environmental Research and Public Health, 19(19), 12344. https://doi.org/10.3390/ijerph191912344