
A More Intense Examination of the Intensity of Physical Activity in People Living with Chronic Obstructive Pulmonary Disease: Insights from Threshold-Free Markers of Activity Intensity

 , , ,
, , ,  ,
,
Abstract
1. Introduction
2. Materials and Methods
2.1. Dataset
2.2. Measurements
2.2.1. Descriptive Measures
2.2.2. Physical Activity
2.2.3. Threshold-Free Metrics: Average Acceleration and Intensity Gradient
2.2.4. Exercise Capacity
2.2.5. Exercise Capacity and Physical Activity
2.3. Statistical Analyses
3. Results
3.1. Participant Characteristics
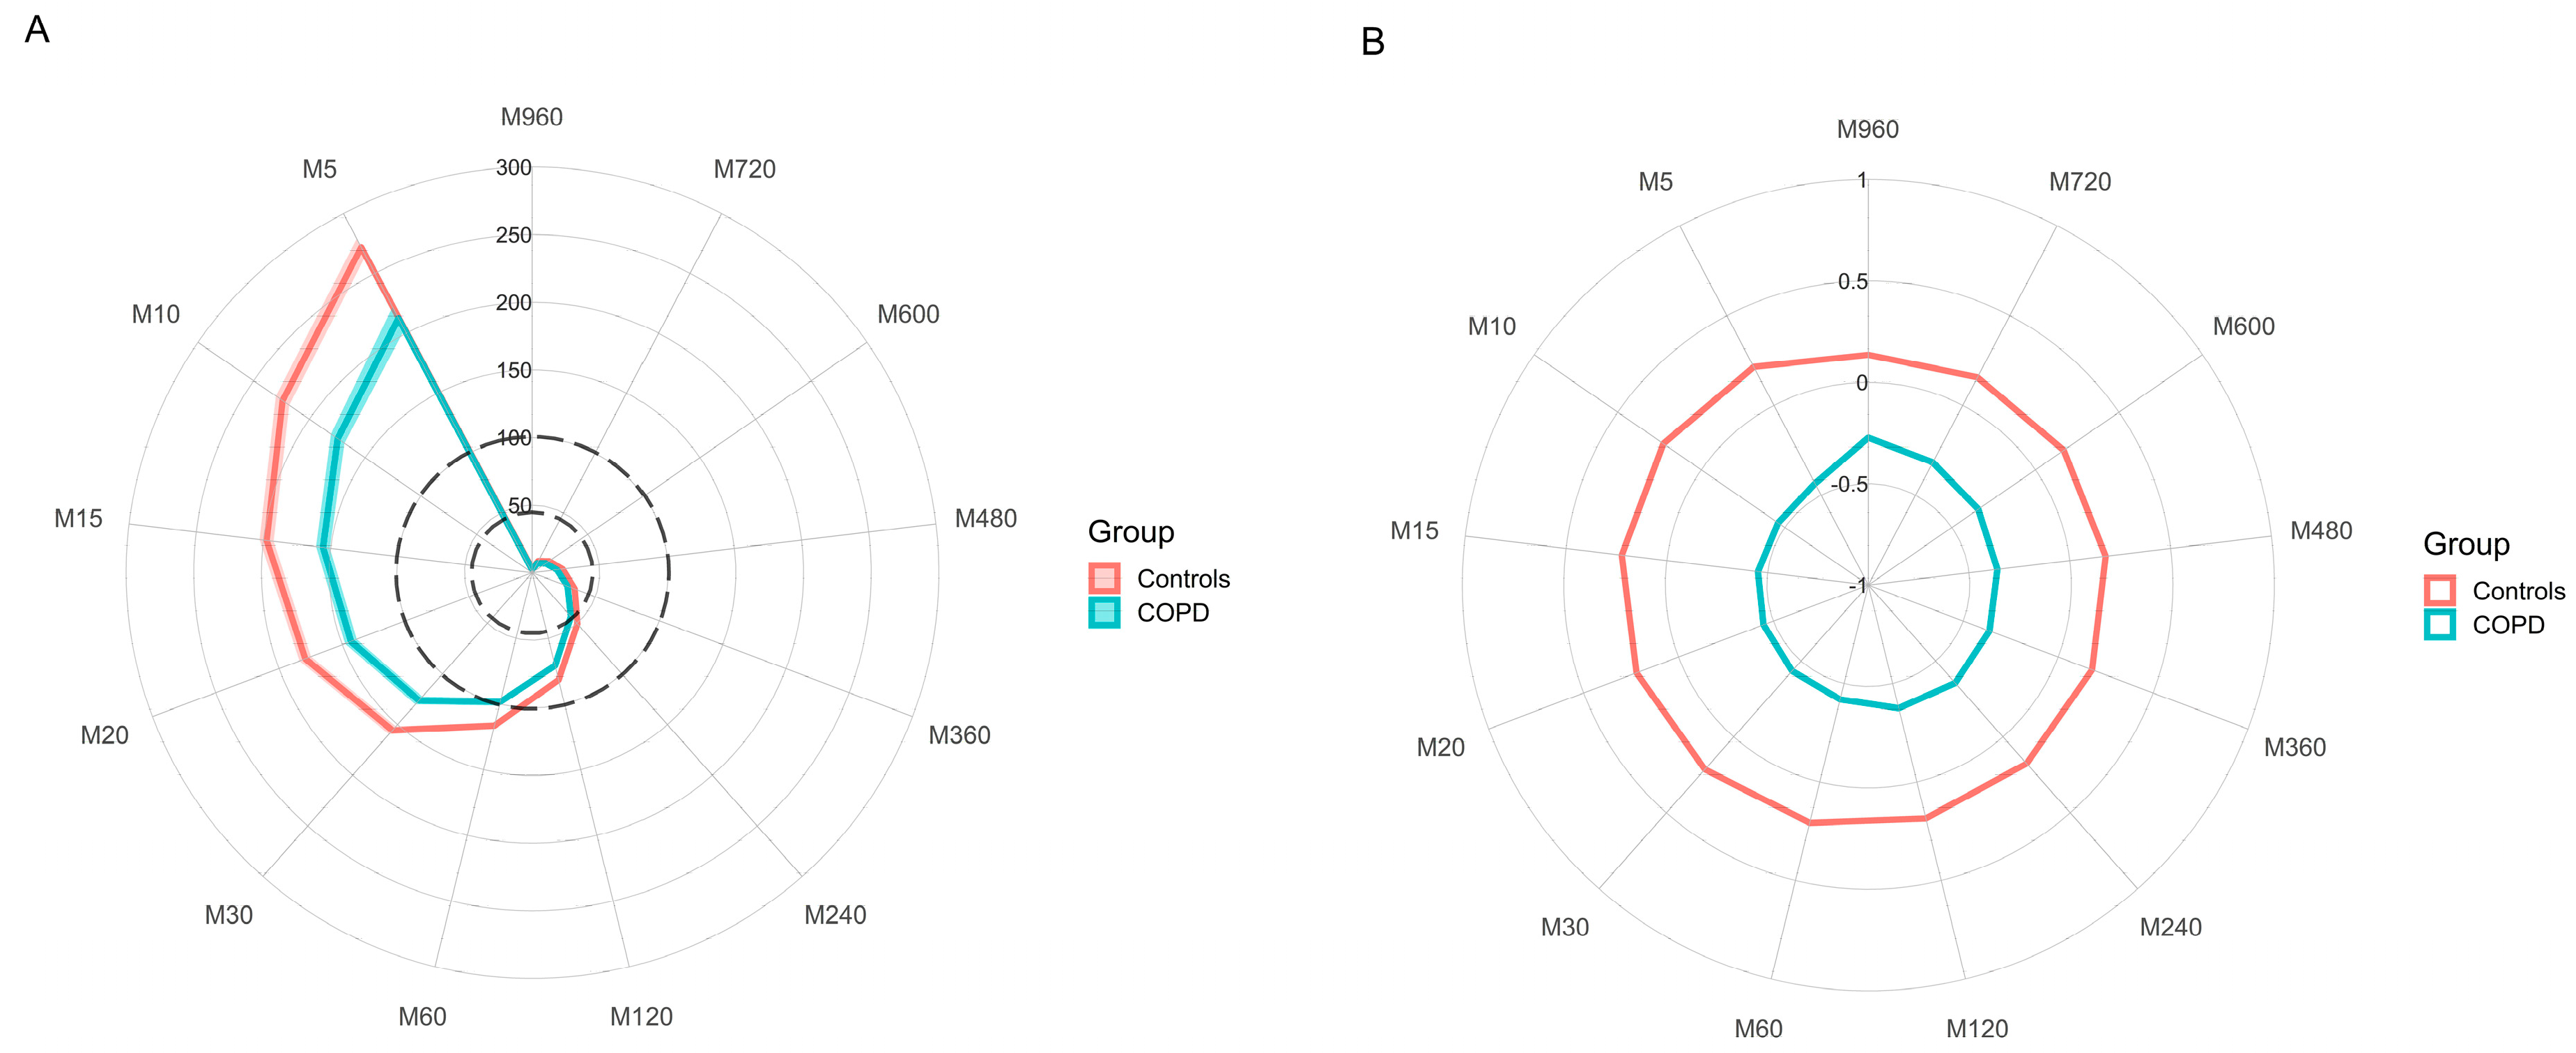
3.2. Differences in Physical Activity between COPD and Controls
3.3. Physical Activity and Exercise Capacity
4. Discussion
4.1. Summary of Main Findings
4.2. Strengths and Limitations
5. Conclusions
Author Contributions
Funding
Institutional Review Board Statement
Informed Consent Statement
Data Availability Statement
Acknowledgments
Conflicts of Interest
Appendix A

| Argument | Value | Context |
|---|---|---|
| R_version | R version 4.1.0 (2021-05-18) | not applicable |
| backup.cal.coef | retrieve | Calibration, Feature extraction, Epoch size, Time zone |
| chunksize | 1 | Calibration, Feature extraction, Epoch size, Time zone |
| configtz | c() | Calibration, Feature extraction, Epoch size, Time zone |
| dayborder | 0 | Calibration, Feature extraction, Epoch size, Time zone |
| do.anglex | FALSE | Calibration, Feature extraction, Epoch size, Time zone |
| do.angley | FALSE | Calibration, Feature extraction, Epoch size, Time zone |
| do.anglez | TRUE | Calibration, Feature extraction, Epoch size, Time zone |
| do.bfen | FALSE | Calibration, Feature extraction, Epoch size, Time zone |
| do.cal | TRUE | Calibration, Feature extraction, Epoch size, Time zone |
| do.dev_roll_med_acc_x | FALSE | Calibration, Feature extraction, Epoch size, Time zone |
| do.dev_roll_med_acc_y | FALSE | Calibration, Feature extraction, Epoch size, Time zone |
| do.dev_roll_med_acc_z | FALSE | Calibration, Feature extraction, Epoch size, Time zone |
| do.en | FALSE | Calibration, Feature extraction, Epoch size, Time zone |
| do.enmo | TRUE | Calibration, Feature extraction, Epoch size, Time zone |
| do.enmoa | FALSE | Calibration, Feature extraction, Epoch size, Time zone |
| do.hfen | FALSE | Calibration, Feature extraction, Epoch size, Time zone |
| do.hfenplus | FALSE | Calibration, Feature extraction, Epoch size, Time zone |
| do.lfen | FALSE | Calibration, Feature extraction, Epoch size, Time zone |
| do.lfenmo | FALSE | Calibration, Feature extraction, Epoch size, Time zone |
| do.mad | FALSE | Calibration, Feature extraction, Epoch size, Time zone |
| do.roll_med_acc_x | FALSE | Calibration, Feature extraction, Epoch size, Time zone |
| do.roll_med_acc_y | FALSE | Calibration, Feature extraction, Epoch size, Time zone |
| do.roll_med_acc_z | FALSE | Calibration, Feature extraction, Epoch size, Time zone |
| dynrange | c() | Calibration, Feature extraction, Epoch size, Time zone |
| hb | 15 | Calibration, Feature extraction, Epoch size, Time zone |
| lb | 0.5 | Calibration, Feature extraction, Epoch size, Time zone |
| minloadcrit | 72 | Calibration, Feature extraction, Epoch size, Time zone |
| myfun | c() | Calibration, Feature extraction, Epoch size, Time zone |
| n | 4 | Calibration, Feature extraction, Epoch size, Time zone |
| print.filename | FALSE | Calibration, Feature extraction, Epoch size, Time zone |
| printsummary | FALSE | Calibration, Feature extraction, Epoch size, Time zone |
| windowsizes | c(5, 900, 3600) | Calibration, Feature extraction, Epoch size, Time zone |
| acc.metric | ENMO | General parameters |
| bout.metric | 4 | General parameters |
| config_file_in_outputdir | C:/Users/……… | General parameters |
| data_cleaning_file | c() | General parameters |
| datadir | D:/……….. | General parameters |
| desiredtz | General parameters | |
| do.bfx | FALSE | General parameters |
| do.bfy | FALSE | General parameters |
| do.bfz | FALSE | General parameters |
| do.hfx | FALSE | General parameters |
| do.hfy | FALSE | General parameters |
| do.hfz | FALSE | General parameters |
| do.lfx | FALSE | General parameters |
| do.lfy | FALSE | General parameters |
| do.lfz | FALSE | General parameters |
| do.parallel | TRUE | General parameters |
| do.report | c(2,4,5) | General parameters |
| do.sibreport | FALSE | General parameters |
| do.zcx | FALSE | General parameters |
| do.zcy | FALSE | General parameters |
| do.zcz | FALSE | General parameters |
| excludefirst.part4 | FALSE | General parameters |
| excludelast.part4 | FALSE | General parameters |
| f0 | 1 | General parameters |
| f1 | 260 | General parameters |
| frag.metrics | c() | General parameters |
| GGIRversion | 2.4-2 | General parameters |
| HASIB.algo | vanHees2015 | General parameters |
| HASPT.algo | HDCZA | General parameters |
| HASPT.ignore.invalid | FALSE | General parameters |
| i | 30 | General parameters |
| idloc | 1 | General parameters |
| includedaycrit.part5 | 0.666667 | General parameters |
| interpolationType | 1 | General parameters |
| longitudinal_axis | c() | General parameters |
| LUX_cal_constant | c() | General parameters |
| LUX_cal_exponent | c() | General parameters |
| LUX_day_segments | c() | General parameters |
| LUXthresholds | c(0, 100, 500, 1000, 3000, 5000, 10,000) | General parameters |
| maxNcores | c() | General parameters |
| minimum_MM_length.part5 | 23 | General parameters |
| minimumFileSizeMB | 2 | General parameters |
| mode | c(1, 2, 3, 4, 5) | General parameters |
| MX.ig.min.dur | 10 | General parameters |
| outputdir | C:/Users/……. | General parameters |
| overwrite | FALSE | General parameters |
| part5_agg2_60seconds | FALSE | General parameters |
| qwindow_dateformat | %d-%m-%Y | General parameters |
| relyonguider | FALSE | General parameters |
| rmc.bitrate | c() | General parameters |
| rmc.check4timegaps | FALSE | General parameters |
| rmc.col.acc | c(1, 2, 3) | General parameters |
| rmc.col.temp | c() | General parameters |
| rmc.col.time | c() | General parameters |
| rmc.col.wear | c() | General parameters |
| rmc.dec | . | General parameters |
| rmc.desiredtz | General parameters | |
| rmc.doresample | FALSE | General parameters |
| rmc.dynamic_range | c() | General parameters |
| rmc.firstrow.acc | c() | General parameters |
| rmc.firstrow.header | c() | General parameters |
| rmc.format.time | %Y-%m-%d %H:%M:%OS | General parameters |
| rmc.header.length | c() | General parameters |
| rmc.header.structure | c() | General parameters |
| rmc.headername.recordingid | c() | General parameters |
| rmc.headername.sf | c() | General parameters |
| rmc.headername.sn | c() | General parameters |
| rmc.noise | FALSE | General parameters |
| rmc.origin | ######## | General parameters |
| rmc.sf | c() | General parameters |
| rmc.unit.acc | g | General parameters |
| rmc.unit.temp | C | General parameters |
| rmc.unit.time | POSIX | General parameters |
| rmc.unsignedbit | TRUE | General parameters |
| Sadeh_axis | General parameters | |
| save_ms5raw_format | csv | General parameters |
| save_ms5raw_without_invalid | TRUE | General parameters |
| selectdaysfile | c() | General parameters |
| sensor.location | wrist | General parameters |
| sleeplogsep | , | General parameters |
| sleepwindowType | SPT | General parameters |
| storefolderstructure | FALSE | General parameters |
| studyname | c() | General parameters |
| week_weekend_aggregate.part5 | FALSE | General parameters |
| anglethreshold | 5 | Parameters sleep detection |
| constrain2range | TRUE | Parameters sleep detection |
| ignorenonwear | TRUE | Parameters sleep detection |
| timethreshold | 5 | Parameters sleep detection |
| colid | 1 | Parameters sleep period time detection with or wihout sleeplog |
| coln1 | 1 | Parameters sleep period time detection with or wihout sleeplog |
| criterror | 4 | Parameters sleep period time detection with or wihout sleeplog |
| def.noc.sleep | 1 | Parameters sleep period time detection with or wihout sleeplog |
| do.visual | TRUE | Parameters sleep period time detection with or wihout sleeplog |
| excludefirstlast | FALSE | Parameters sleep period time detection with or wihout sleeplog |
| includenightcrit | 16 | Parameters sleep period time detection with or wihout sleeplog |
| loglocation | c() | Parameters sleep period time detection with or wihout sleeplog |
| nnights | c() | Parameters sleep period time detection with or wihout sleeplog |
| outliers.only | TRUE | Parameters sleep period time detection with or wihout sleeplog |
| relyonsleeplog | c() | Parameters sleep period time detection with or wihout sleeplog |
| sleeplogidnum | TRUE | Parameters sleep period time detection with or wihout sleeplog |
| boutcriter.in | 0.9 | Parameters time-use variables |
| boutcriter.lig | 0.8 | Parameters time-use variables |
| boutcriter.mvpa | 0.8 | Parameters time-use variables |
| boutdur.in | c(1, 10, 30) | Parameters time-use variables |
| boutdur.lig | c(1, 5, 10) | Parameters time-use variables |
| boutdur.mvpa | c(1, 5, 10) | Parameters time-use variables |
| excludefirstlast.part5 | FALSE | Parameters time-use variables |
| save_ms5rawlevels | FALSE | Parameters time-use variables |
| threshold.lig | 44.8 | Parameters time-use variables |
| threshold.mod | 100.6 | Parameters time-use variables |
| threshold.vig | 428.8 | Parameters time-use variables |
| timewindow | WW | Parameters time-use variables |
| boutcriter | 0.8 | Study design, Parameters descriptive analysis |
| closedbout | FALSE | Study design, Parameters descriptive analysis |
| do.imp | TRUE | Study design, Parameters descriptive analysis |
| do.part3.pdf | TRUE | Study design, Parameters descriptive analysis |
| epochvalues2csv | FALSE | Study design, Parameters descriptive analysis |
| hrs.del.end | 0 | Study design, Parameters descriptive analysis |
| hrs.del.start | 0 | Study design, Parameters descriptive analysis |
| iglevels | c(0, 25, 50, 75, 100, 125, 150, 175, 200, 225, 250, 275, 300, 325, 350, 375, 400, 425, 450, 475, 500, 525, 550, 575, 600, 625, 650, 675, 700, 725, 750, 775, 800, 825, 850, 875, 900, 925, 950, 975, 1000, 1025, 1050, 1075, 1100, 1125, 1150, 1175, 1200, 1225, 1250, 1275, 1300, 1325, 1350, 1375, 1400, 1425, 1450, 1475, 1500, 1525, 1550, 1575, 1600, 1625, 1650, 1675, 1700, 1725, 1750, 1775, 1800, 1825, 1850, 1875, 1900, 1925, 1950, 1975, 2000, 2025, 2050, 2075, 2100, 2125, 2150, 2175, 2200, 2225, 2250, 2275, 2300, 2325, 2350, 2375, 2400, 2425, 2450, 2475, 2500, 2525, 2550, 2575, 2600, 2625, 2650, 2675, 2700, 2725, 2750, 2775, 2800, 2825, 2850, 2875, 2900, 2925, 2950, 2975, 3000, 3025, 3050, 3075, 3100, 3125, 3150, 3175, 3200, 3225, 3250, 3275, 3300, 3325, 3350, 3375, 3400, 3425, 3450, 3475, 3500, 3525, 3550, 3575, 3600, 3625, 3650, 3675, 3700, 3725, 3750, 3775, 3800, 3825, 3850, 3875, 3900, 3925, 3950, 3975, 4000, 8000) | Study design, Parameters descriptive analysis |
| ilevels | c() | Study design, Parameters descriptive analysis |
| includedaycrit | 16 | Study design, Parameters descriptive analysis |
| IVIS.activity.metric | 2 | Study design, Parameters descriptive analysis |
| IVIS_epochsize_seconds | NA | Study design, Parameters descriptive analysis |
| IVIS_windowsize_minutes | 60 | Study design, Parameters descriptive analysis |
| M5L5res | 10 | Study design, Parameters descriptive analysis |
| maxdur | 9 | Study design, Parameters descriptive analysis |
| mvpadur | c(1, 5, 10) | Study design, Parameters descriptive analysis |
| mvpathreshold | 100.6 | Study design, Parameters descriptive analysis |
| ndayswindow | 7 | Study design, Parameters descriptive analysis |
| qlevels | c(0.333333333333333, 0.5, 0.583333333333333, 0.666666666666667, 0.75, 0.833333333333333, 0.916666666666667, 0.958333333333333, 0.979166666666667, 0.986111111111111, 0.989583333333333, 0.993055555555556, 0.996527777777778, 0.998611111111111, 0.999305555555556) | Study design, Parameters descriptive analysis |
| qM5L5 | c() | Study design, Parameters descriptive analysis |
| qwindow | c(0, 24) | Study design, Parameters descriptive analysis |
| strategy | 1 | Study design, Parameters descriptive analysis |
| TimeSegments2ZeroFile | c() | Study design, Parameters descriptive analysis |
| window.summary.size | 10 | Study design, Parameters descriptive analysis |
| winhr | 5 | Study design, Parameters descriptive analysis |
| dofirstpage | TRUE | Visual report |
| viewingwindow | 1 | Visual report |
| visualreport | FALSE | Visual report |
References
- Pitta, F.; Troosters, T.; Spruit, M.A.; Probst, V.S.; Decramer, M.; Gosselink, R. Characteristics of Physical Activities in Daily Life in Chronic Obstructive Pulmonary Disease. Am. J. Respir. Crit. Care Med. 2005, 171, 972–977. [Google Scholar] [CrossRef] [PubMed]
- Watz, H.; Waschki, B.; Meyer, T.; Magnussen, H. Physical Activity in Patients with COPD. Eur. Respir. J. 2008, 33, 262–272. [Google Scholar] [CrossRef] [PubMed]
- Orme, M.W.; Steiner, M.C.; Morgan, M.D.; Kingsnorth, A.P.; Esliger, D.W.; Singh, S.J.; Sherar, L.B. 24-Hour Accelerometry in COPD: Exploring Physical Activity, Sedentary Behavior, Sleep and Clinical Characteristics. Int. J. Chronic Obstr. Pulm. Dis. 2019, 14, 419–430. [Google Scholar] [CrossRef] [PubMed]
- Garcia-Aymerich, J.; Lange, P.; Benet, M.; Schnohr, P.; Anto, J.M. Regular Physical Activity Reduces Hospital Admission and Mortality in Chronic Obstructive Pulmonary Disease: A Population Based Cohort Study. Thorax 2006, 61, 772–778. [Google Scholar] [CrossRef]
- Demeyer, H.; Mohan, D.; Burtin, C.; Vaes, A.; Heasley, M.; Bowler, R.P.; Casaburi, R.; Cooper, C.B.; Corriol-Rohou, S.; Frei, A.; et al. Objectively Measured Physical Activity in Patients with COPD: Recommendations from an International Task Force on Physical Activity. Chronic Obstr. Pulm. Dis. J. COPD Found. 2021, 8, 528–550. [Google Scholar] [CrossRef]
- Cindy Ng, L.W.; Mackney, J.; Jenkins, S.; Hill, K. Does Exercise Training Change Physical Activity in People with COPD? A Systematic Review and Meta-Analysis. Chronic Respir. Dis. 2012, 9, 17–26. [Google Scholar] [CrossRef]
- Lahham, A.; McDonald, C.F.; Holland, A.E. Exercise Training Alone or with the Addition of Activity Counseling Improves Physical Activity Levels in COPD: A Systematic Review and Meta-Analysis of Randomized Controlled Trials. Int. J. Chronic Obstr. Pulm. Dis. 2016, 11, 3121–3136. [Google Scholar] [CrossRef]
- Mesquita, R.; Meijer, K.; Pitta, F.; Azcuna, H.; Goërtz, Y.M.J.; Essers, J.M.N.; Wouters, E.F.M.; Spruit, M.A. Changes in Physical Activity and Sedentary Behaviour Following Pulmonary Rehabilitation in Patients with COPD. Respir. Med. 2017, 126, 122–129. [Google Scholar] [CrossRef]
- Freedson, P.S.; Melanson, E.; Sirard, J. Calibration of the Computer Science and Applications, Inc. Accelerometer. Med. Sci. Sports Exerc. 1998, 30, 777–781. [Google Scholar] [CrossRef]
- Troiano, R.P.; Berrigan, D.; Dodd, K.W.; Mâsse, L.C.; Tilert, T.; McDowell, M. Physical Activity in the United States Measured by Accelerometer. Med. Sci. Sports Exerc. 2008, 40, 181–188. [Google Scholar] [CrossRef]
- Byrom, B.; Rowe, D.A. Measuring Free-Living Physical Activity in COPD Patients: Deriving Methodology Standards for Clinical Trials through a Review of Research Studies. Contemp. Clin. Trials 2016, 47, 172–184. [Google Scholar] [CrossRef] [PubMed]
- Backes, A.; Gupta, T.; Schmitz, S.; Fagherazzi, G.; Hees, V.; Malisoux, L. Advanced Analytical Methods to Assess Physical Activity Behavior Using Accelerometer Time Series: A Scoping Review. Scand. J. Med. Sci. Sports 2022, 32, 18–44. [Google Scholar] [CrossRef] [PubMed]
- Rowlands, A.V.; Dawkins, N.P.; Maylor, B.; Edwardson, C.L.; Fairclough, S.J.; Davies, M.J.; Harrington, D.M.; Khunti, K.; Yates, T. Enhancing the Value of Accelerometer-Assessed Physical Activity: Meaningful Visual Comparisons of Data-Driven Translational Accelerometer Metrics. Sports Med.-Open 2019, 5, 47. [Google Scholar] [CrossRef] [PubMed]
- Orme, M.W.; Esliger, D.W.; Kingsnorth, A.P.; Steiner, M.C.; Singh, S.J.; Malcolm, D.; Morgan, M.D.; Sherar, L.B. Physical Activity and Respiratory Health (PhARaoH): Data from a Cross-Sectional Study. Open Health Data 2016, 4, 4. [Google Scholar] [CrossRef][Green Version]
- World Health Organization. Who Stepwise Approach to Surveillance (Steps): Guide to Physical Measurements; World Health Organization: Geneva, Switzerland, 2008.
- Miller, M.R. Standardisation of Spirometry. Eur. Respir. J. 2005, 26, 319–338. [Google Scholar] [CrossRef] [PubMed]
- van Hees, V.; Fang, Z.; Mirkes, E.; Heywood, J.; Zhao, J.H.; Joan, C.P.; Sabia, S.; Migueles, J.H.; Patterson, M.; Jackson, D.; et al. GGIR: Raw Accelerometer Data Analysis 2022. Available online: https://github.com/wadpac/GGIR/blob/master/inst/CITATION (accessed on 1 September 2022).
- Dawkins, N.P.; Yates, T.; Razieh, C.; Edwardson, C.L.; Maylor, B.; Zaccardi, F.; Khunti, K.; Rowlands, A.V. Differences in Accelerometer-Measured Patterns of Physical Activity and Sleep/Rest Between Ethnic Groups and Age: An Analysis of UK Biobank. J. Phys. Act. Health 2022, 19, 37–46. [Google Scholar] [CrossRef]
- van Hees, V.T.; Sabia, S.; Jones, S.E.; Wood, A.R.; Anderson, K.N.; Kivimäki, M.; Frayling, T.M.; Pack, A.I.; Bucan, M.; Trenell, M.I.; et al. Estimating Sleep Parameters Using an Accelerometer without Sleep Diary. Sci. Rep. 2018, 8, 12975. [Google Scholar] [CrossRef]
- Hildebrand, M.; VAN Hees, V.T.; Hansen, B.H.; Ekelund, U. Age Group Comparability of Raw Accelerometer Output from Wrist- and Hip-Worn Monitors. Med. Sci. Sports Exerc. 2014, 46, 1816–1824. [Google Scholar] [CrossRef]
- Hildebrand, M.; Hansen, B.H.; van Hees, V.T.; Ekelund, U. Evaluation of Raw Acceleration Sedentary Thresholds in Children and Adults. Scand. J. Med. Sci. Sports 2017, 27, 1814–1823. [Google Scholar] [CrossRef]
- Rowlands, A.V.; Edwardson, C.L.; Davies, M.J.; Khunti, K.; Harrington, D.M.; Yates, T. Beyond Cut Points: Accelerometer Metrics That Capture the Physical Activity Profile. Med. Sci. Sports Exerc. 2018, 50, 1323–1332. [Google Scholar] [CrossRef]
- Maylor, B. Radar Plot Generator 2022. Available online: https://github.com/Maylor8/RadarPlotGenerato (accessed on 1 September 2022).
- Singh, S. The Use of Field Walking Tests for Assessment of Functional Capacity in Patients with Chronic Airways Obstruction. Physiotherapy 1992, 78, 102–104. [Google Scholar] [CrossRef]
- Houchen-Wolloff, L.; Boyce, S.; Singh, S. The Minimum Clinically Important Improvement in the Incremental Shuttle Walk Test Following Cardiac Rehabilitation. Eur. J. Prev. Cardiol. 2015, 22, 972–978. [Google Scholar] [CrossRef] [PubMed]
- Dourado, V.Z.; Guerra, R.L.F.; Tanni, S.E.; Antunes, L.C.d.O.; Godoy, I. Reference Values for the Incremental Shuttle Walk Test in Healthy Subjects: From the Walk Distance to Physiological Responses. J. Bras. Pneumol. 2013, 39, 190–197. [Google Scholar] [CrossRef] [PubMed]
- Dawkins, N.P.; Yates, T.; Soczawa-Stronczyk, A.A.; Bocian, M.; Edwardson, C.L.; Maylor, B.; Davies, M.J.; Khunti, K.; Rowlands, A.V. Normative Wrist-Worn Accelerometer Values for Self-Paced Walking and Running: A Walk in the Park. J. Sports Sci. 2022, 40, 81–88. [Google Scholar] [CrossRef] [PubMed]
- Dawkins, N.P.; Yates, T.; Edwardson, C.L.; Maylor, B.; Davies, M.J.; Dunstan, D.; Highton, P.J.; Herring, L.Y.; Khunti, K.; Rowlands, A.V. Comparing 24 h Physical Activity Profiles: Office Workers, Women with a History of Gestational Diabetes and People with Chronic Disease Condition(S). J. Sports Sci. 2021, 39, 219–226. [Google Scholar] [CrossRef]
- Rowlands, A.; Davies, M.; Dempsey, P.; Edwardson, C.; Razieh, C.; Yates, T. Wrist-Worn Accelerometers: Recommending ~1.0 m g as the Minimum Clinically Important Difference (MCID) in Daily Average Acceleration for Inactive Adults. Br. J. Sports Med. 2021, 55, 814–815. [Google Scholar] [CrossRef]
- Bernard, P.; Hains-Monfette, G.; Atoui, S.; Moullec, G. Daily Objective Physical Activity and Sedentary Time in Adults with COPD Using Spirometry Data from Canadian Measures Health Survey. Can. Respir. J. 2018, 2018, 9107435. [Google Scholar] [CrossRef]
- Geidl, W.; Carl, J.; Cassar, S.; Lehbert, N.; Mino, E.; Wittmann, M.; Wagner, R.; Schultz, K.; Pfeifer, K. Physical Activity and Sedentary Behaviour Patterns in 326 Persons with COPD before Starting a Pulmonary Rehabilitation: A Cluster Analysis. J. Clin. Med. 2019, 8, 1346. [Google Scholar] [CrossRef]
- Spruit, M.A.; Singh, S.J.; Garvey, C.; ZuWallack, R.; Nici, L.; Rochester, C.; Hill, K.; Holland, A.E.; Lareau, S.C.; Man, W.D.-C.; et al. An Official American Thoracic Society/European Respiratory Society Statement: Key Concepts and Advances in Pulmonary Rehabilitation. Am. J. Respir. Crit. Care Med. 2013, 188, e13–e64. [Google Scholar] [CrossRef]
- Weedon, A.E.; Saukko, P.M.; Downey, J.W.; Orme, M.W.; Esliger, D.W.; Singh, S.J.; Sherar, L.B. Meanings of Sitting in the Context of Chronic Disease: A Critical Reflection on Sedentary Behaviour, Health, Choice and Enjoyment. Qual. Res. Sport. Exerc. Health 2020, 12, 363–376. [Google Scholar] [CrossRef]
- Orme, M.W. Energy Expenditure as a Marker of Physical Activity Intensity in Chronic Obstructive Pulmonary Disease. Chronic Respir. Dis. 2021, 18, 147997312110599. [Google Scholar] [CrossRef] [PubMed]


| COPD (N = 76) | Controls (N = 154) | p | |||
|---|---|---|---|---|---|
| Demographics | |||||
| Age (years) | 65.9 | (6.8) | 56.6 | (8.9) | *** |
| Sex (female/male) | 28/48% | 37/63% | 91/63 | 59/41% | |
| Body composition | |||||
| Body mass index (kg/m2) | 28.2 | (5.1) | 26.8 | (5.1) | |
| Percentage body fat (%) a | 28.8 | (9.0) | 29.6 | (7.6) | |
| Waist circumference (cm) | 99.4 | (14.0) | 90.2 | (13.8) | * |
| Exercise capacity | |||||
| ISWT distance (m) | 395.7 | (160.3) | 523.8 | (174.2) | *** |
| Estimated VO2peak (mL/kg/min) | 18.4 | (6.2) | 23.6 | (6.6) | *** |
| Respiratory healthb | |||||
| FEV1 (L) | 2.0 | (0.8) | 2.5 | (0.7) | *** |
| FEV1 % predicted | 72.2 | (21.5) | 94.0 | (19.9) | *** |
| FVC (L) | 3.6 | (1.0) | 3.4 | (0.9) | |
| FEV1/FVC | 55.1 | (12.8) | 73.3 | (7.4) | *** |
| COPD | Controls | |||
|---|---|---|---|---|
| Inactive (min/day) | 777.4 | (108.8) | 711.9 | (102.9) |
| Light activity (min/day) | 163.4 | (52.6) | 182.2 | (50.7) |
| Moderate activity (min/day) | 58.7 | (34.2) | 80.6 | (39.4) |
| Vigorous activity (min/day) | 0.6 | (1.1) | 1.8 | (3.1) |
| MVPA (min/day) | 59.3 | (34.9) | 82.5 | (40.0) |
| MVPA bouts 1–5 (min/day) | 10.2 | (9.9) | 13.5 | (10.4) |
| MVPA bouts 5–10 (min/day) | 3.9 | (4.9) | 6.1 | (6.5) |
| MVPA bouts 10+ (min/day) | 6.6 | (12.1) | 13.4 | (17.4) |
| Average acceleration (mg) | 29.1 | (8.7) | 36.4 | (9.1) |
| Intensity gradient | −2.73 | (0.21) | −2.57 | (0.19) |
| Model 1 | ||||
| B | SE | R2 | p | |
| Inactive (min/day) | −45.22 | 16.28 | 0.12 | ** |
| Light activity (min/day) | 12.17 | 8.01 | 0.07 | |
| Moderate activity (min/day) | 16.10 | 5.95 | 0.09 | ** |
| Vigorous activity (min/day) | 1.10 | 0.41 | 0.06 | ** |
| MVPA (min/day) | 17.20 | 6.03 | 0.10 | ** |
| MVPA bouts 1–5 (min/day) | 1.80 | 1.61 | 0.05 | |
| MVPA bouts 5–10 (min/day) | 2.40 | 0.95 | 0.03 | * |
| MVPA bouts 10+ (min/day) | 10.16 | 2.48 | 0.08 | *** |
| Average acceleration (mg) | 5.73 | 1.42 | 0.14 | *** |
| Intensity gradient | 0.12 | 0.03 | 0.15 | *** |
| Model 2 | ||||
| B | SE | R2 | p | |
| Inactive (min/day) | −34.32 | 16.77 | 0.14 | * |
| Light activity (min/day) | 9.45 | 8.32 | 0.26 | |
| Moderate activity (min/day) | 9.84 | 6.01 | 0.14 | |
| Vigorous activity (min/day) | 0.46 | 0.40 | 0.18 | |
| MVPA (min/day) | 10.30 | 6.06 | 0.16 | |
| MVPA bouts 1–5 (min/day) | 0.26 | 1.63 | 0.09 | |
| MVPA bouts 5–10 (min/day) | 1.64 | 0.97 | 0.06 | |
| MVPA bouts 10+ (min/day) | 7.33 | 2.49 | 0.14 | ** |
| Average acceleration (mg) | 3.85 | 1.40 | 0.22 | ** |
| Intensity gradient | 0.07 | 0.03 | 0.27 | * |
Publisher’s Note: MDPI stays neutral with regard to jurisdictional claims in published maps and institutional affiliations. |
© 2022 by the authors. Licensee MDPI, Basel, Switzerland. This article is an open access article distributed under the terms and conditions of the Creative Commons Attribution (CC BY) license (https://creativecommons.org/licenses/by/4.0/).
Share and Cite
Kingsnorth, A.P.; Rowlands, A.V.; Maylor, B.D.; Sherar, L.B.; Steiner, M.C.; Morgan, M.D.; Singh, S.J.; Esliger, D.W.; Orme, M.W. A More Intense Examination of the Intensity of Physical Activity in People Living with Chronic Obstructive Pulmonary Disease: Insights from Threshold-Free Markers of Activity Intensity. Int. J. Environ. Res. Public Health 2022, 19, 12355. https://doi.org/10.3390/ijerph191912355
Kingsnorth AP, Rowlands AV, Maylor BD, Sherar LB, Steiner MC, Morgan MD, Singh SJ, Esliger DW, Orme MW. A More Intense Examination of the Intensity of Physical Activity in People Living with Chronic Obstructive Pulmonary Disease: Insights from Threshold-Free Markers of Activity Intensity. International Journal of Environmental Research and Public Health. 2022; 19(19):12355. https://doi.org/10.3390/ijerph191912355
Chicago/Turabian StyleKingsnorth, Andrew P., Alex V. Rowlands, Benjamin D. Maylor, Lauren B. Sherar, Michael C. Steiner, Mike D. Morgan, Sally J. Singh, Dale W. Esliger, and Mark W. Orme. 2022. "A More Intense Examination of the Intensity of Physical Activity in People Living with Chronic Obstructive Pulmonary Disease: Insights from Threshold-Free Markers of Activity Intensity" International Journal of Environmental Research and Public Health 19, no. 19: 12355. https://doi.org/10.3390/ijerph191912355
APA StyleKingsnorth, A. P., Rowlands, A. V., Maylor, B. D., Sherar, L. B., Steiner, M. C., Morgan, M. D., Singh, S. J., Esliger, D. W., & Orme, M. W. (2022). A More Intense Examination of the Intensity of Physical Activity in People Living with Chronic Obstructive Pulmonary Disease: Insights from Threshold-Free Markers of Activity Intensity. International Journal of Environmental Research and Public Health, 19(19), 12355. https://doi.org/10.3390/ijerph191912355