Article

Benzene and NO2 Exposure during Pregnancy and Preterm Birth in Two Philadelphia Hospitals, 2013–2017

1
Department of Epidemiology and Biostatistics, Dornsife School of Public Health, Drexel University, Philadelphia, PA 19104, USA
2
School of Medicine, Tufts University, Boston, MA 02111, USA
3
Division of Neonatology, Children’s Hospital of Philadelphia, Philadelphia, PA 19104, USA
4
Center for Public Health Initiatives, Perelman School of Medicine, University of Pennsylvania, Philadelphia, PA 19104, USA
5
Department of Environmental and Occupational Health, Dornsife School of Public Health, Drexel University, Philadelphia, PA 19104, USA
6
Department of Environmental Health, Harvard TH Chan School of Public Health, Cambridge, MA 02115, USA
7
Department of Pediatrics, Perelman School of Medicine, University of Pennsylvania, Philadelphia, PA 19104, USA
8
Leonard Davis Institute, University of Pennsylvania, Philadelphia, PA 19104, USA
*
Author to whom correspondence should be addressed.
Int. J. Environ. Res. Public Health 2022, 19(16), 10365; https://doi.org/10.3390/ijerph191610365
Submission received: 15 July 2022 / Revised: 14 August 2022 / Accepted: 15 August 2022 / Published: 19 August 2022

Abstract

:
Infants born preterm are at risk of neonatal morbidity and mortality. Preterm birth (PTB) can be categorized as either spontaneous (sPTB) or medically indicated (mPTB), resulting from distinct pathophysiologic processes such as preterm labor or preeclampsia, respectively. A growing body of literature has demonstrated the impacts of nitrogen dioxide (NO2) and benzene exposure on PTB, though few studies have investigated how these associations may differ by PTB subtype. We investigated the associations of NO2 and benzene exposure with sPTB and mPTB among 18,616 singleton live births at two Philadelphia hospitals between 2013 and 2017. Residential NO2 exposure was estimated using a land use regression model and averaged over the patient’s full pregnancy. Benzene exposure was estimated at the census tract level using National Air Toxics Assessment (NATA) exposure data from 2014. We used logistic mixed-effects models to calculate odds ratios for overall PTB, sPTB, and mPTB separately, adjusting for patient- and tract-level confounders. Given the known racial segregation and PTB disparities in Philadelphia, we also examined race-stratified models. Counter to the hypothesis, neither NO2 nor benzene exposure differed by race, and neither were significantly associated with PTB or PTB subtypes. As such, these pollutants do not appear to explain the racial disparities in PTB in this setting.

1. Introduction

Preterm birth (PTB) occurs in one in ten live births in the United States [1]. A major risk factor for infant mortality and future adverse health outcomes [2,3], PTB also occurs 1.5 times more often among Black individuals compared to White individuals [4], likely due to social, environmental and structural factors that continue to systemically differ by race [5]. There are two substantively different subtypes of PTB. Spontaneous PTB (sPTB) occurs after preterm labor or the premature rupture of membranes prior to 37 weeks of gestation. Medically indicated PTB (mPTB) is provider-initiated due to concern for maternal or fetal wellbeing from conditions such as preeclampsia or poor fetal growth prior to 37 weeks of gestation. Though certain risk factors for each subtype are shown to differ (young maternal age is more strongly associated with sPTB, whereas obesity and hypertension are more strongly associated with mPTB) [6,7,8,9,10], few studies have considered how environmental exposure to factors such as air pollution may contribute differently to each PTB phenotype.
There is a growing body of literature demonstrating the impacts of NO2 and benzene exposure during pregnancy on adverse birth outcomes [11,12,13]. NO2 is primarily emitted from motor vehicles and power plants and is a ubiquitous, though varying, form of exposure in urban environments. Benzene, a volatile organic compound (VOC), is a carcinogen emitted from industrial sources such as oil refineries. Benzene was of particular interest in this setting due to a large oil refinery operating in South Philadelphia during this period, and several large oil refineries operating in the region. NO2 exposure during pregnancy has been associated with adverse birth outcomes, including PTB [12,13], though some studies remain inconclusive [14,15]. While less studied, benzene exposure has also been associated with PTB [11,12]. The biological mechanism through which NO2, benzene and other air pollutants may lead to adverse birth outcomes is not fully understood, but may involve oxidative stress and impaired oxygen transport to the fetus [16,17,18].
This study aimed to examine the associations of NO2 and benzene exposure during pregnancy with PTB phenotypes in a cohort of singleton births at two Philadelphia hospitals between 2013 and 2017, after controlling for other characteristics. Due to ongoing residential segregation, which may co-vary with both pollutant exposure and PTB rates, we also explored race-stratified analyses.

2. Materials and Methods

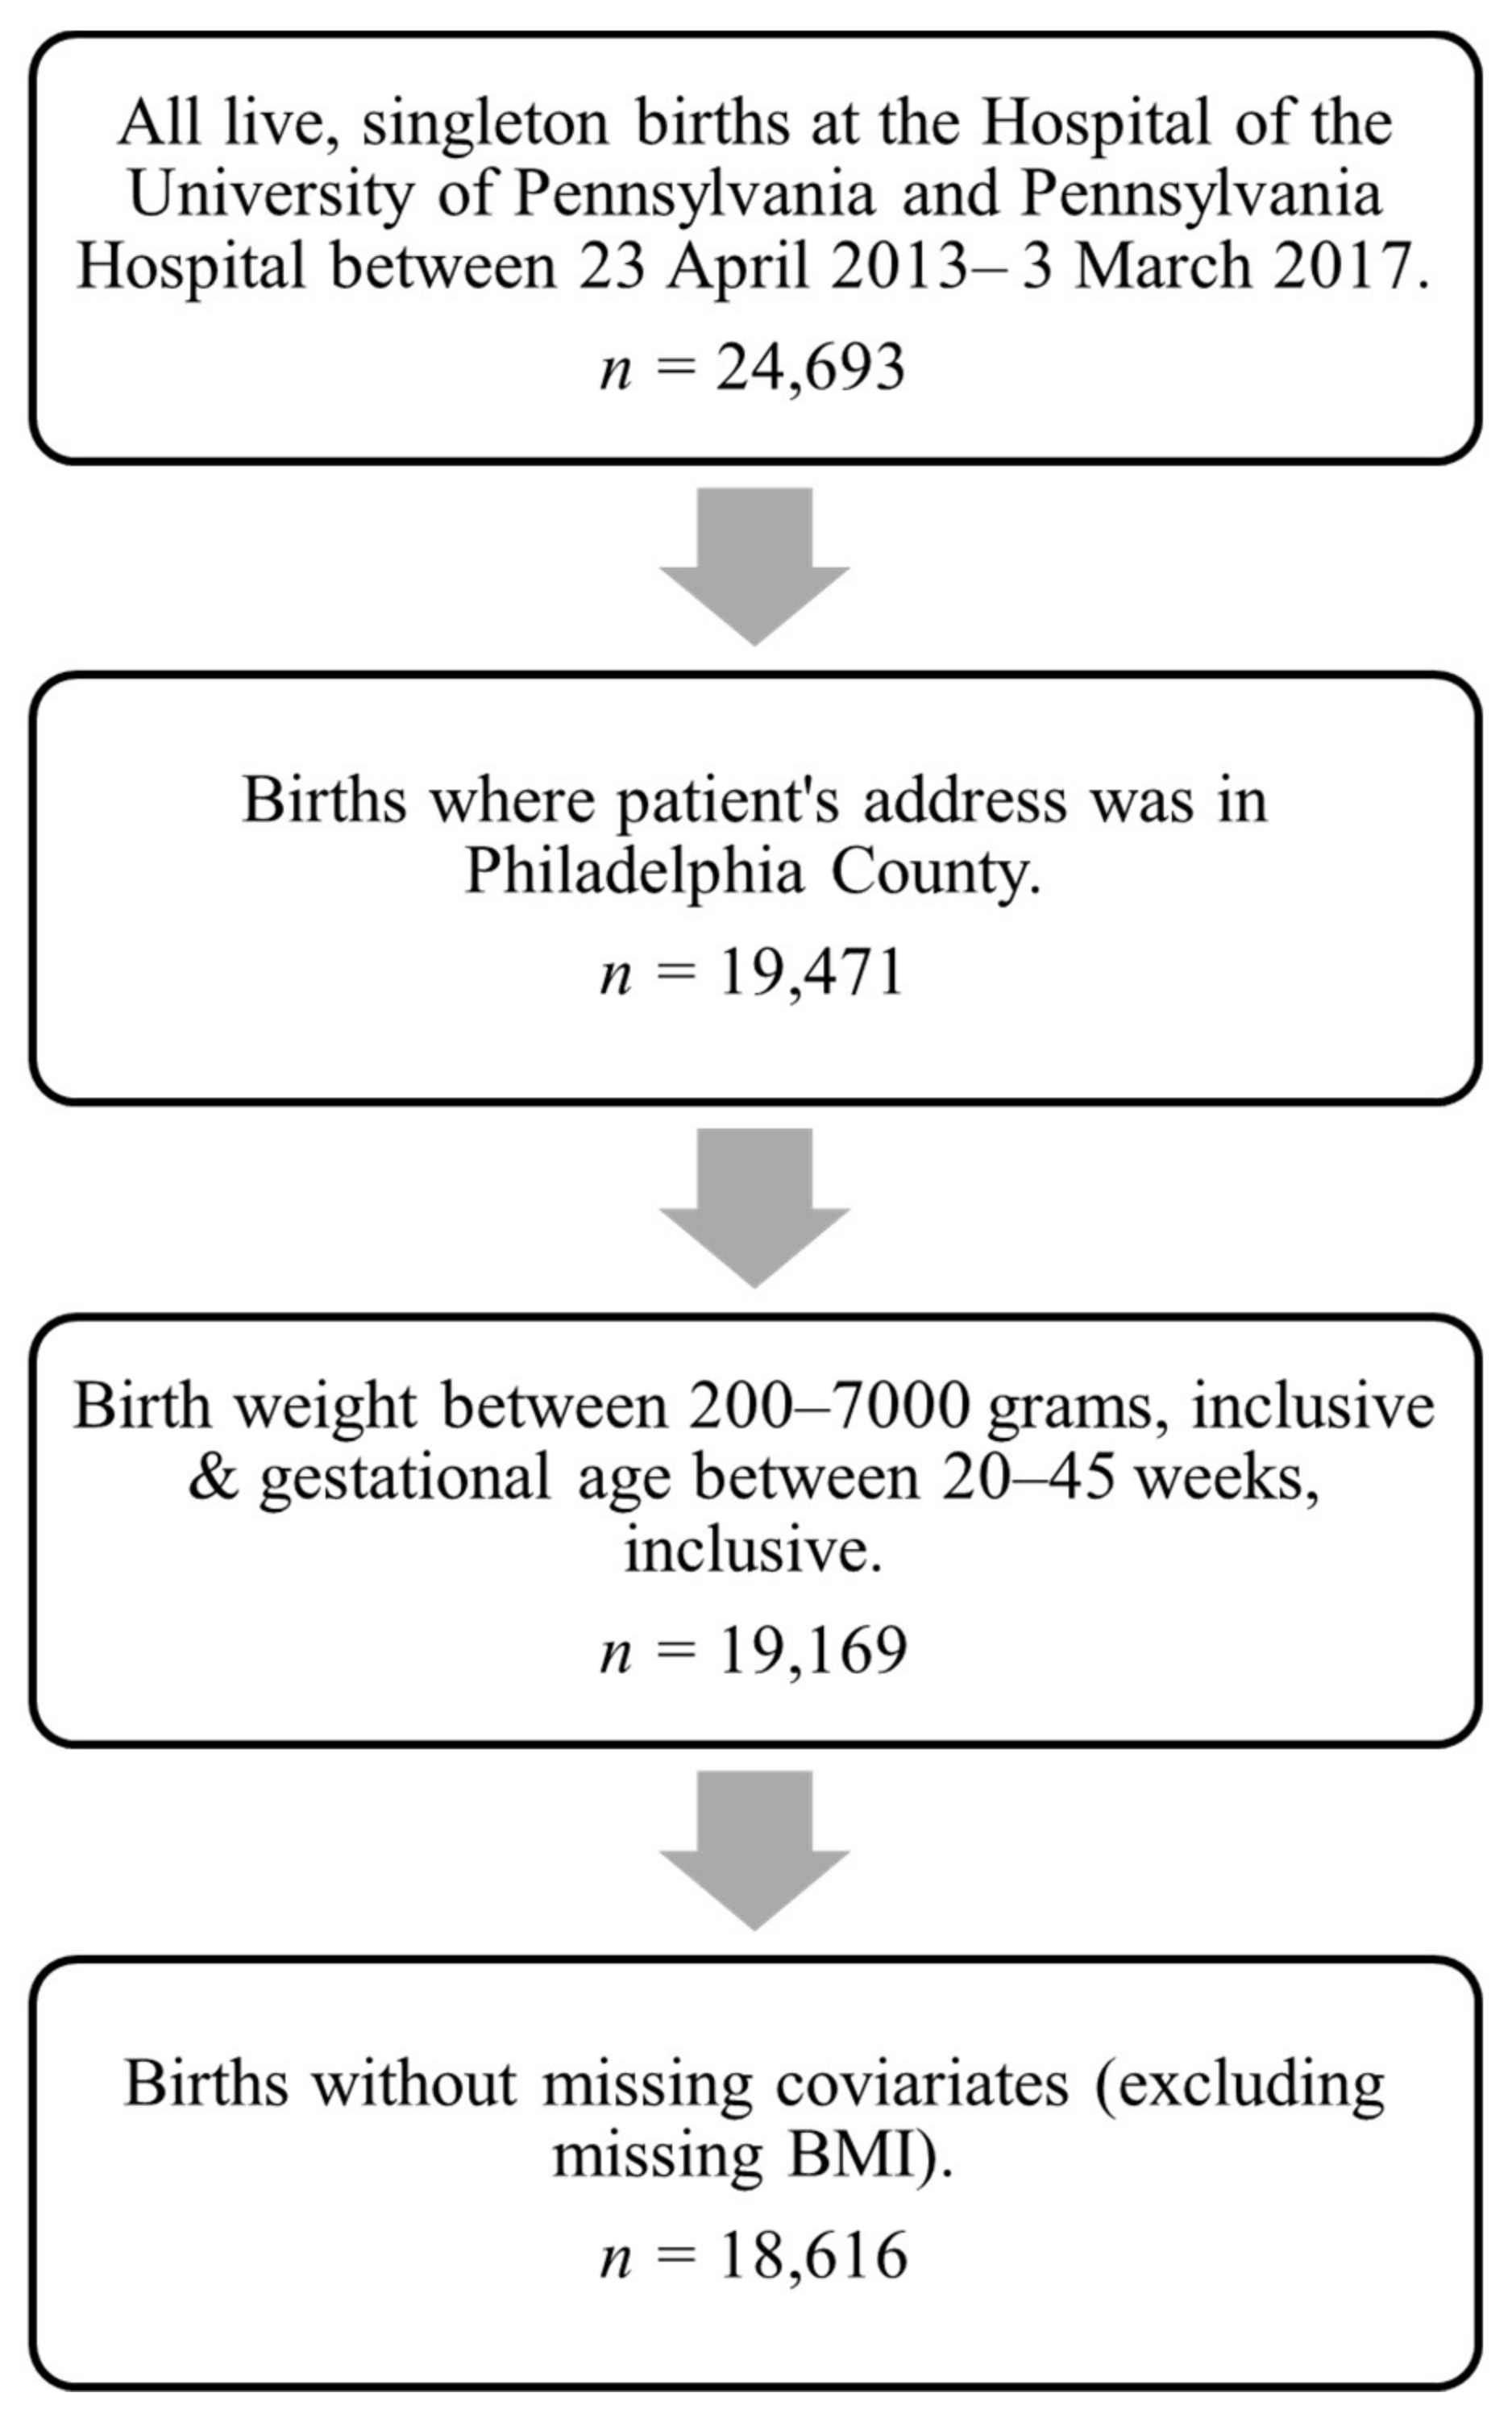
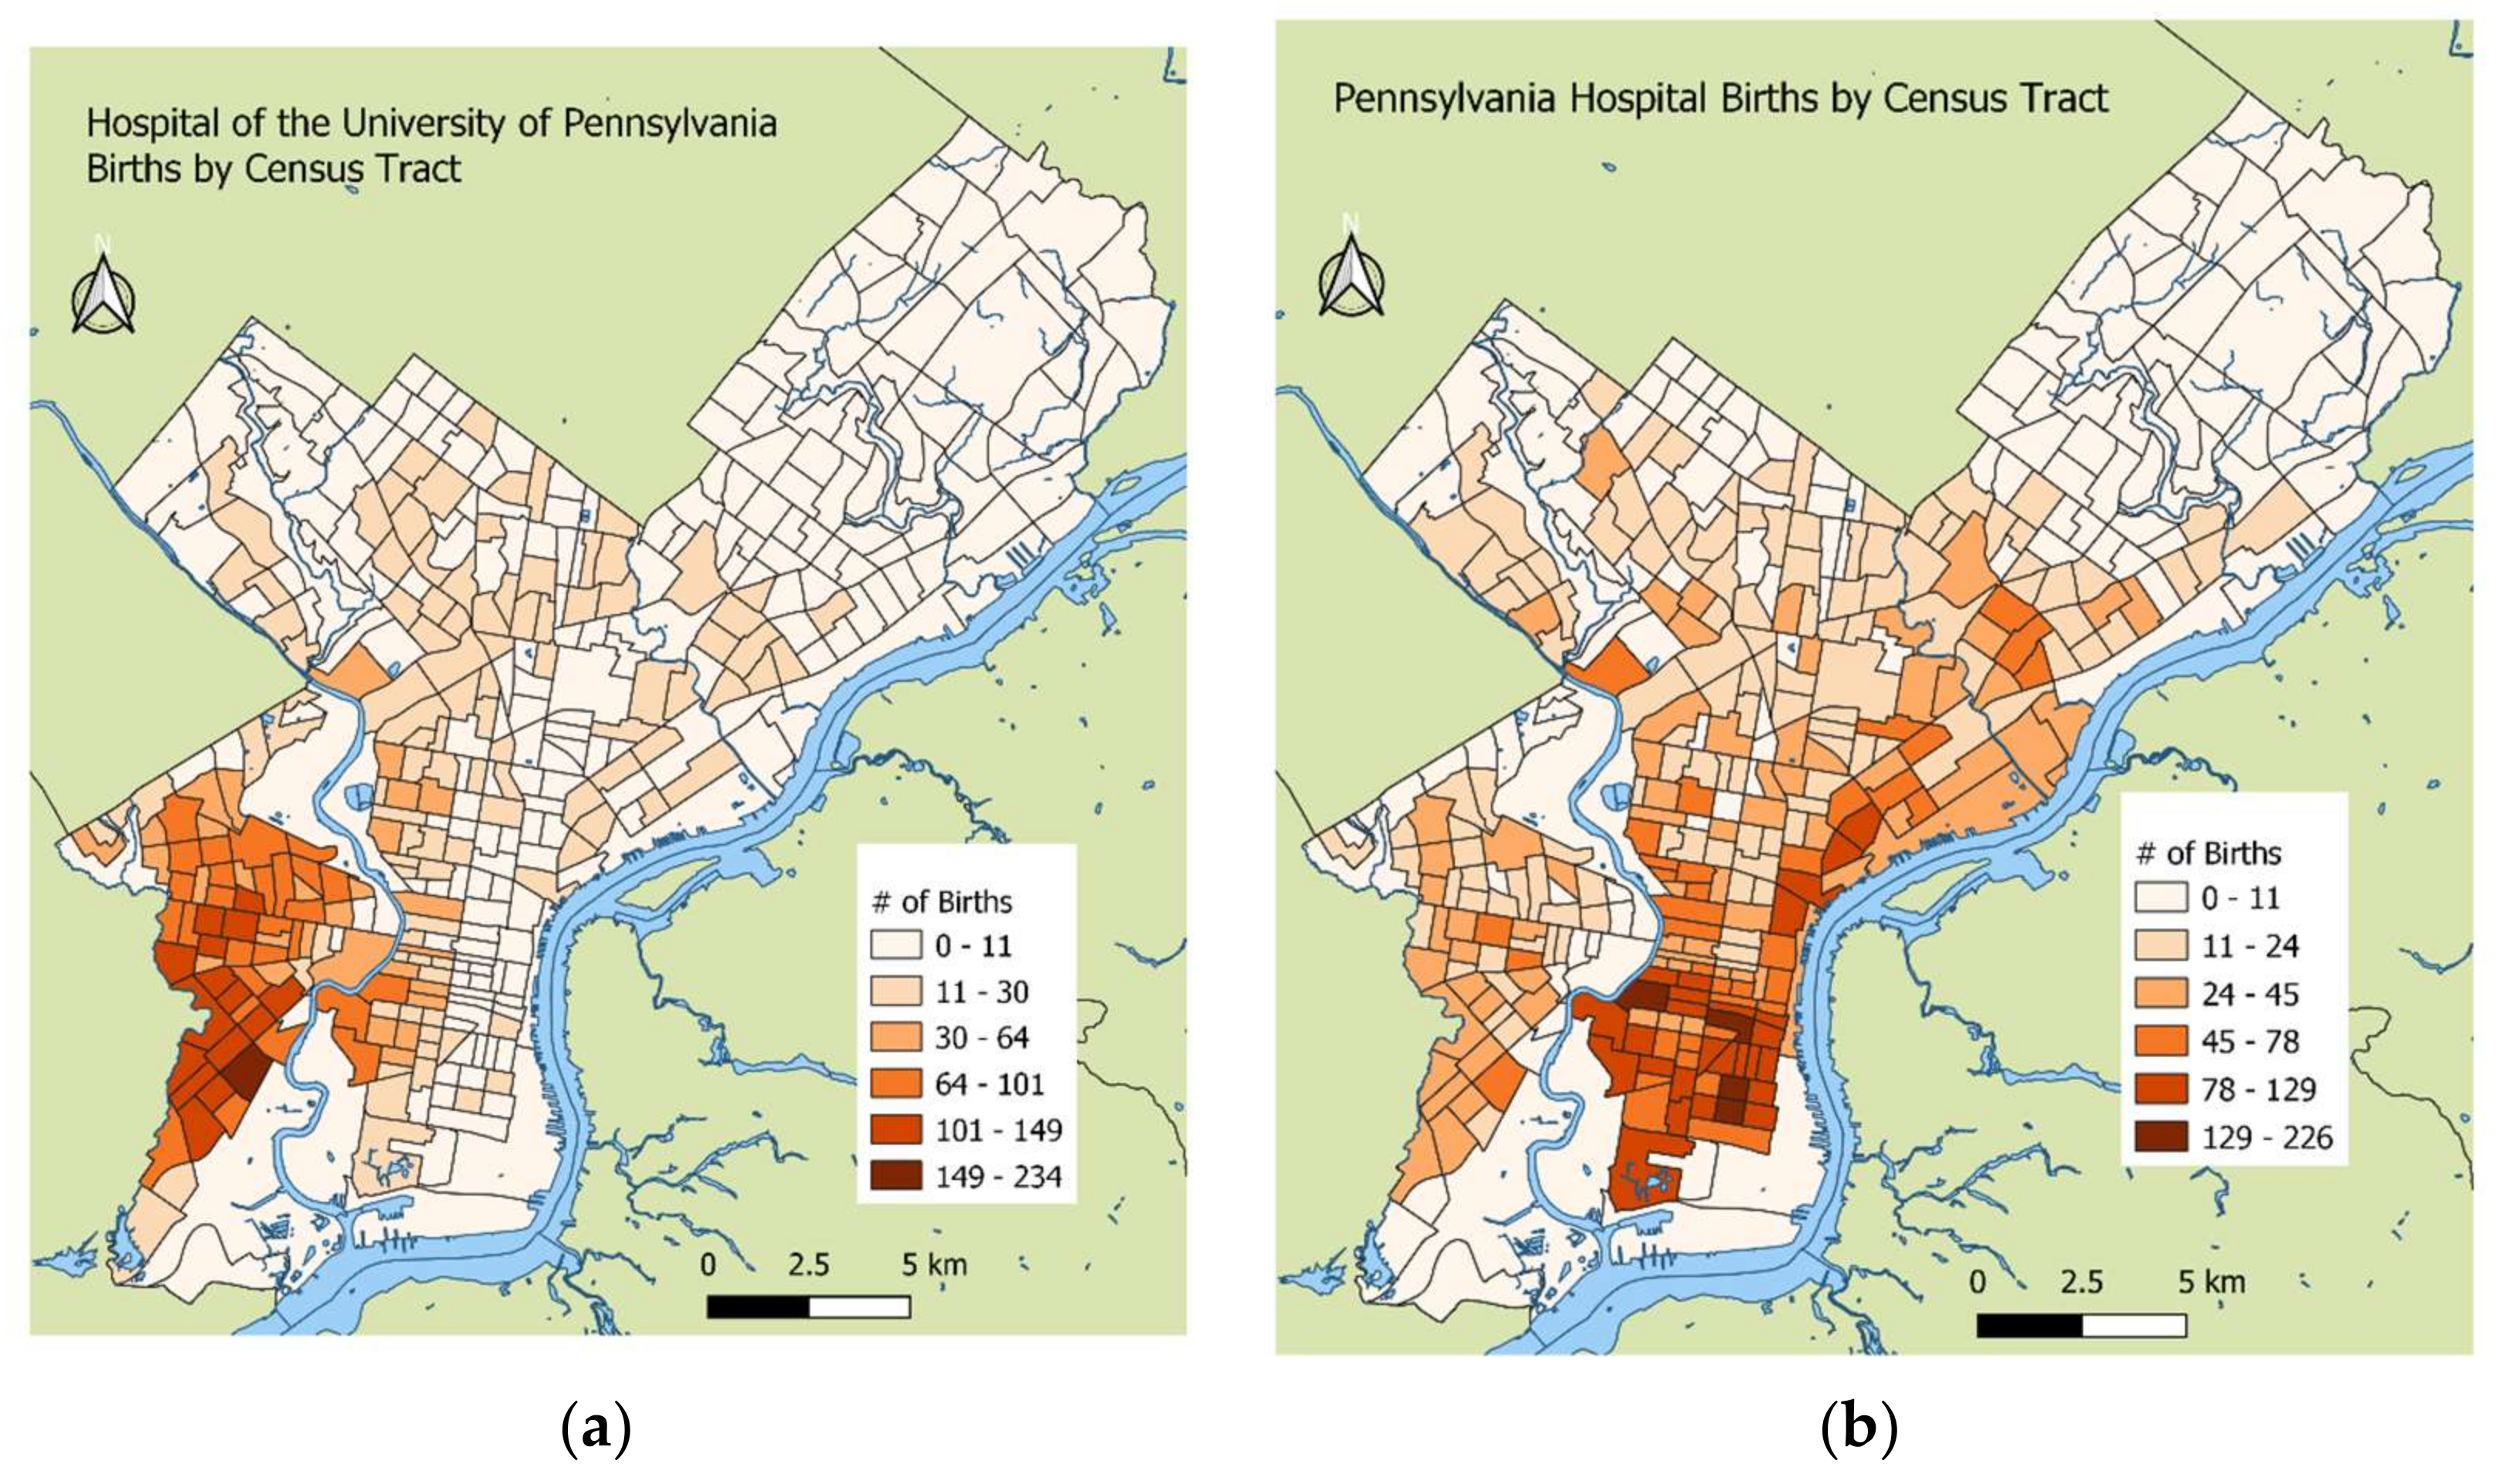
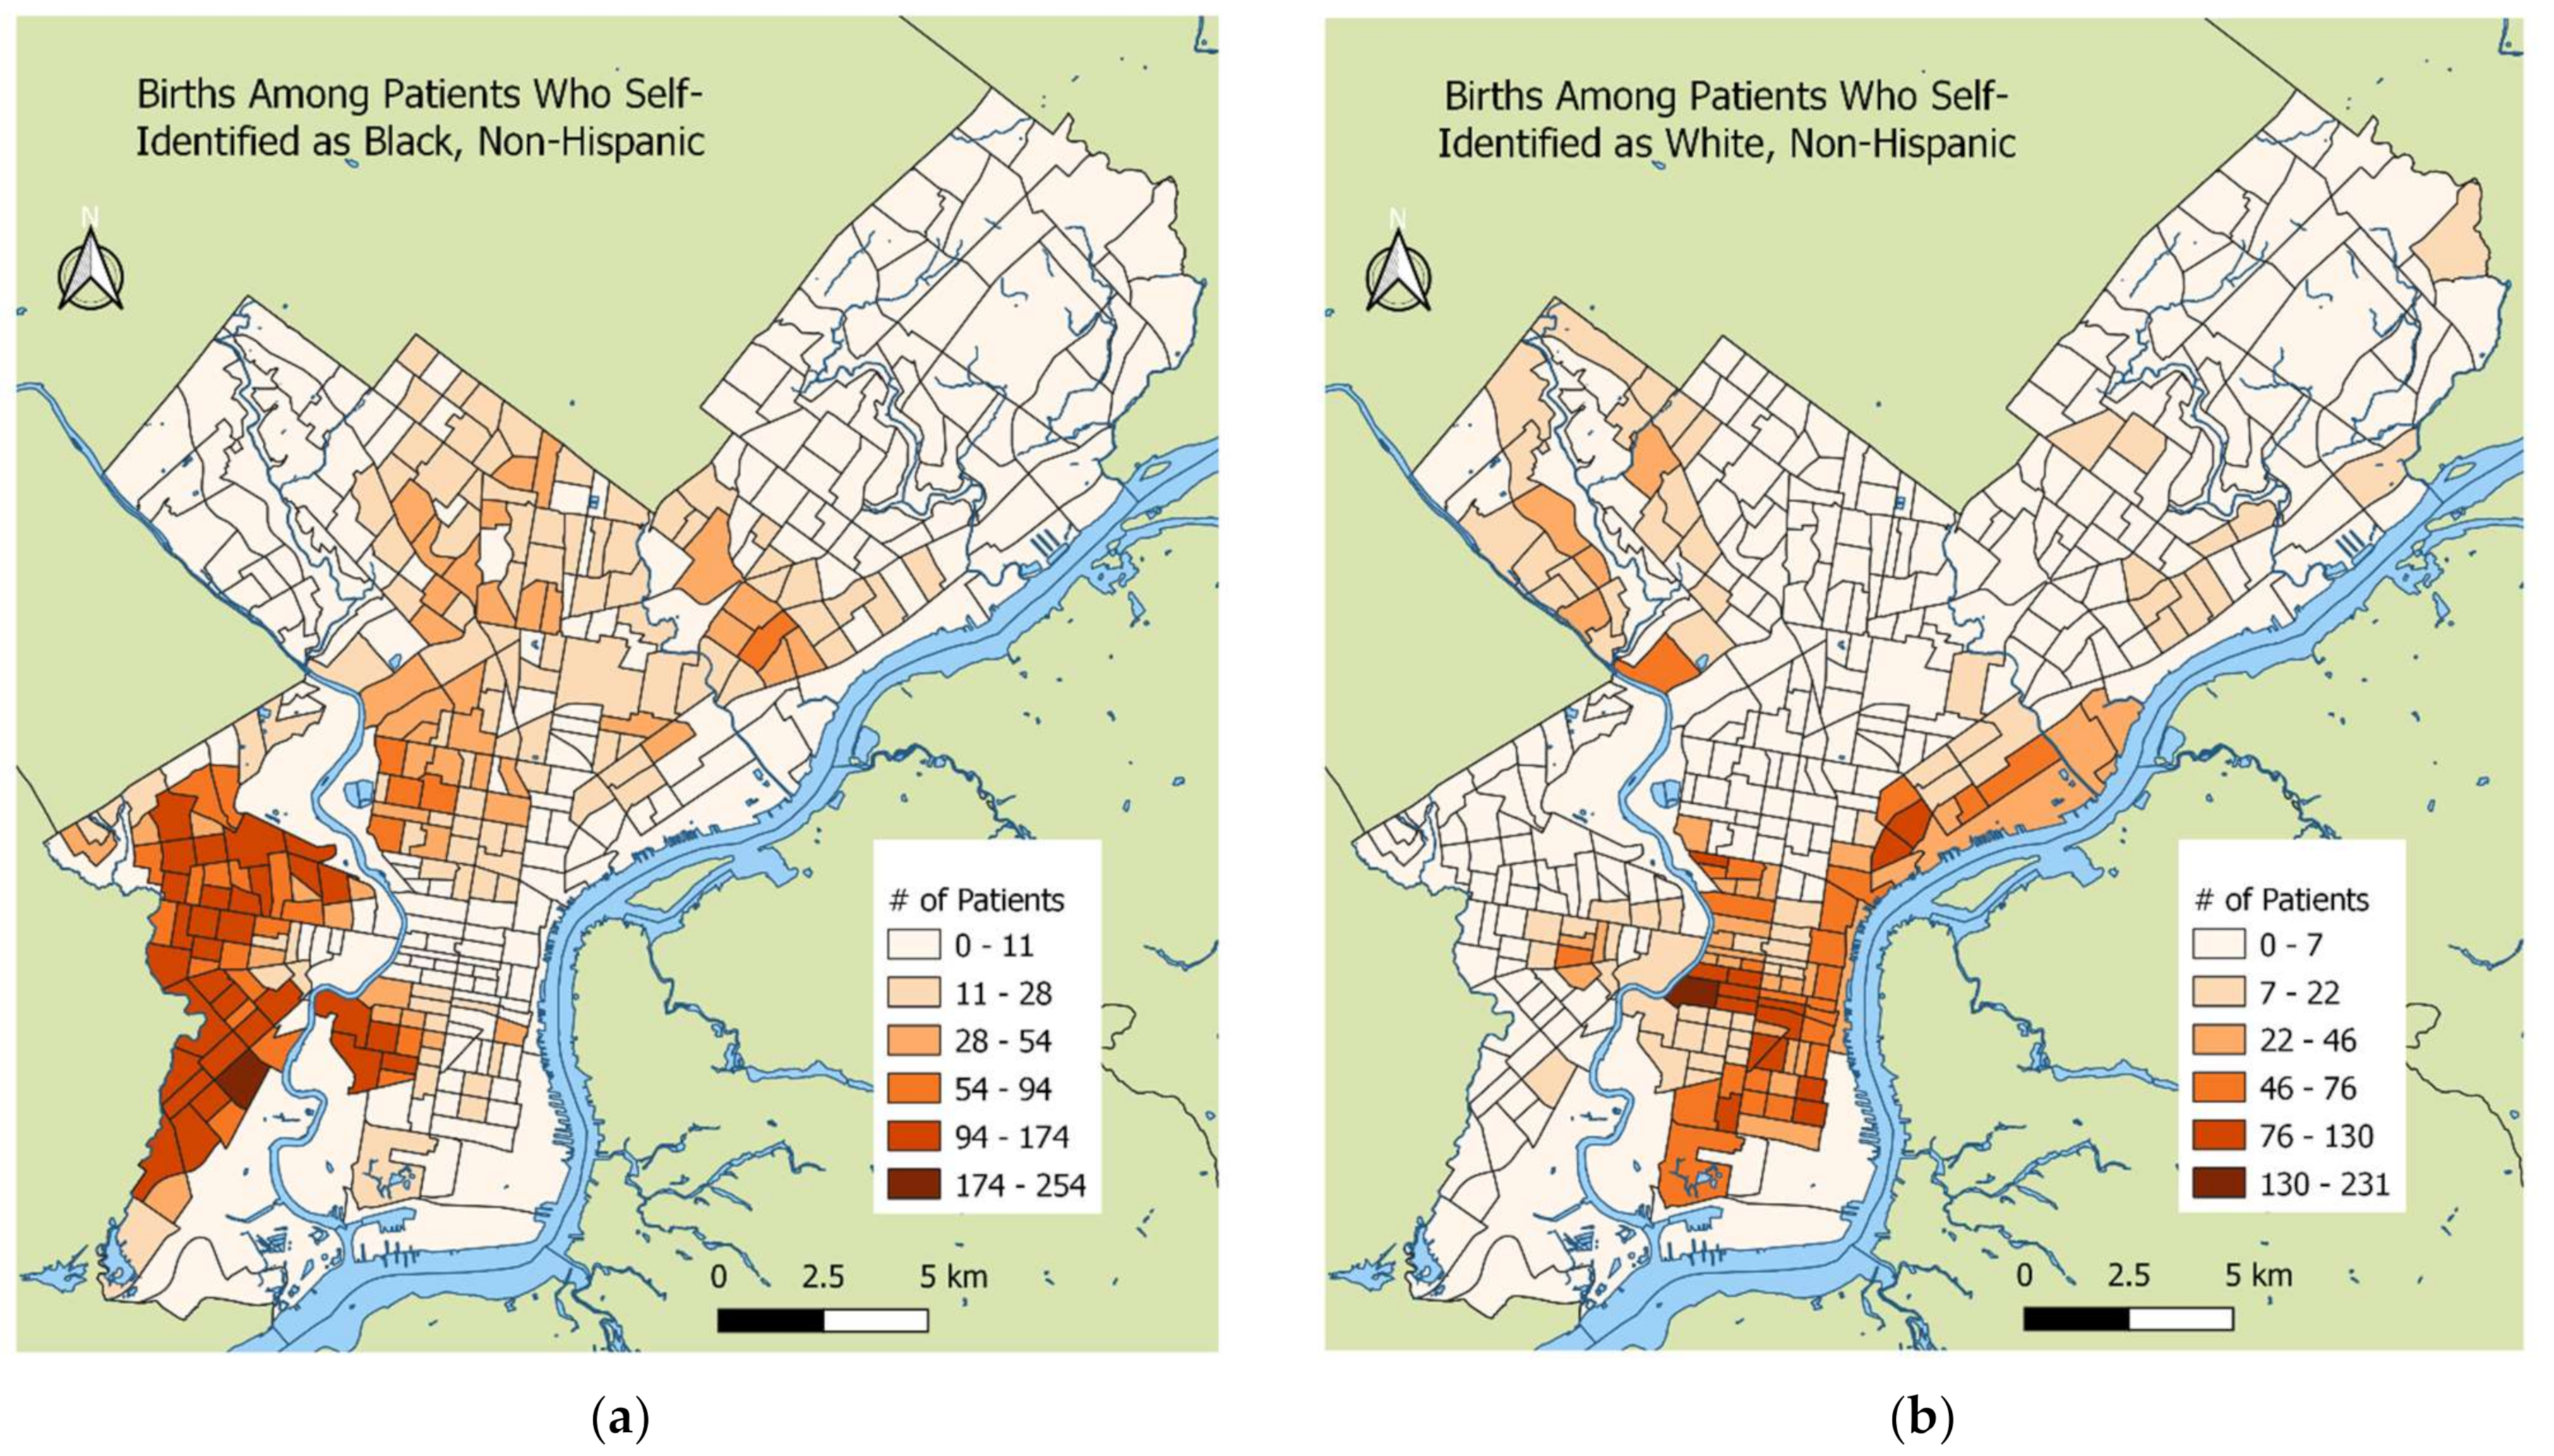
2.1. Study Population

We used a subset of the GeoBirth cohort, which includes all live singleton births at the Hospital of the University of Pennsylvania and Pennsylvania Hospital in Philadelphia, PA from 23 April 2013 to 4 March 2017 (n = 24,683 total) [19,20], for which we had curated electronic health records and air pollution data. We retained the 19,471 patients living in Philadelphia County for whom pollution exposure assignments were available. Infant records with unrealistic birth weights (<200 g or >7000 g) or who were at <20 weeks’ or >45 weeks’ gestation at birth were excluded from the analysis (n = 302). Additionally, patients (n = 513) missing covariate information were excluded, except for body mass index (BMI) (18%); given the high prevalence of missing BMI data, we created a categorical variable with a ‘missing’ category to retain these births in the analysis (Figure 1).

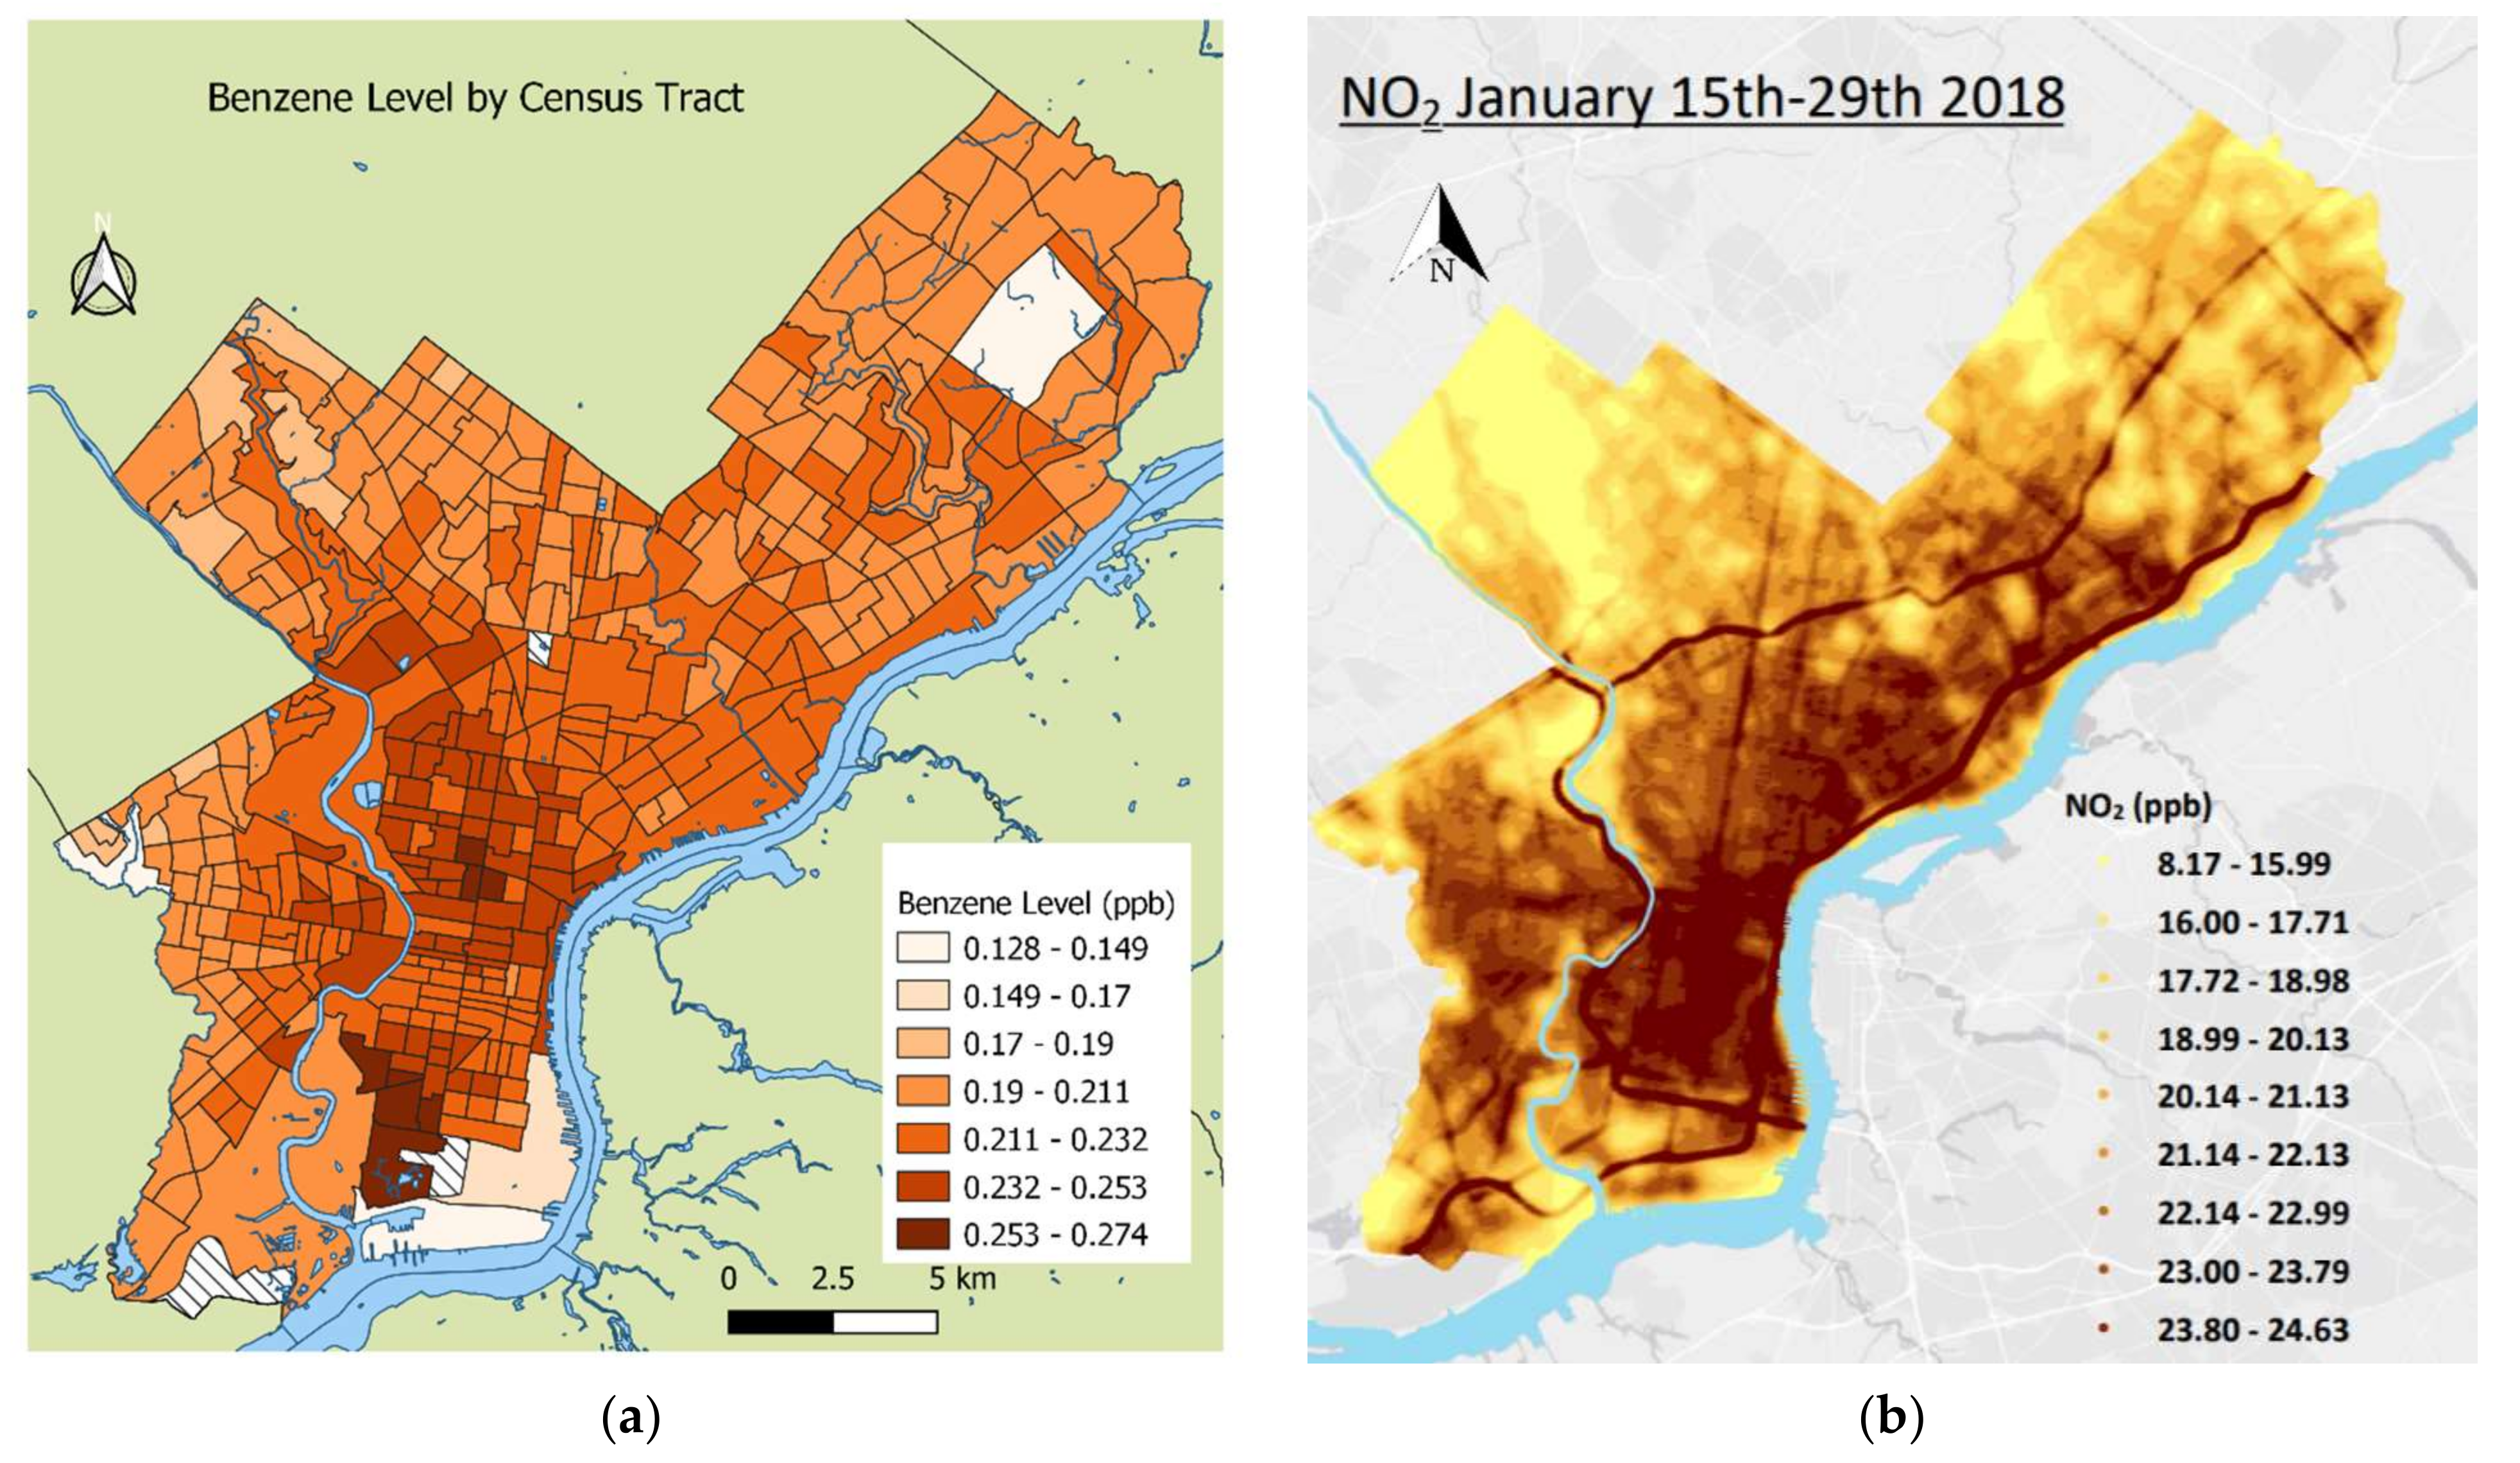
2.2. Exposure Estimates

NO2 exposure was estimated using the average predicted NO2 concentration within a 300 m buffer around each patient’s home on the date of delivery, averaged over each patient’s entire pregnancy. We used a NO2 surface developed using land use regression (LUR) modeling, based on spatial source covariates derived in ArcGIS and monitoring data collected in January 2018 at 48 sites distributed across Philadelphia County, plus 13 spatially representative sites monitored throughout 2018. After testing a large suite of GIS-based source covariates—including traffic density indicators, roadway descriptors, land use/built environment metrics, industrial emissions and transportation facilities—the final LUR covariates included impervious surface within 300 m of the sampling site, distance to the nearest bus stop, distance to a navigable river and kernel traffic density within 300 m (R2 = 0.77). The final LUR surface was produced by predicting the NO2 concentration at each centroid of a 30 m × 30 m grid.
The NO2 estimates were temporally adjusted to the time period matching each patient’s pregnancy using Equation (1), below, and daily NO2 data from a Camden, New Jersey EPA Air Quality System (AQS) monitor, directly downwind of the Philadelphia area, and by providing more consistent data availability than did the Philadelphia AQS monitors for the period 2010–2018.
NO2 [loc xt = 2] = loc xt = 1 − AQSt = 1 + AQSt = 2
The predicted NO2 exposure around a patient’s home during pregnancy (NO2 (loc xt = 2)) was calculated by averaging the LUR surface grid cell centroids within 300 m of each home, and was temporally adjusted by subtracting the mean NO2 at the Camden monitor during the two-week air monitoring period (which provided the spatial data for the LUR model) in January 2018 (AQSt = 1 = 19.46 ppb) from the LUR-predicted NO2 at the 300 m buffer around a patient’s home in January 2018 (loc xt = 1), replacing it with the mean NO2 at the Camden monitor during a specific patient’s pregnancy (AQSt = 2). Each patient’s period of pregnancy was estimated as the date of the last menstrual period (back-calculated using the best obstetric estimate of gestational age) until the date of birth. Trimester-specific NO2 exposure was calculated using the mean NO2 exposure in the first 12 weeks for the first trimester, the mean NO2 exposure between weeks 13 and 26 for the second trimester and the mean NO2 exposure between week 27 and the date of birth for the third trimester. Only patients that delivered between 30 and <37 weeks were included in the third trimester cohort.
Benzene exposure was calculated using census tract-level National Air Toxics Assessment (NATA) exposure data from 2014, the latest NATA estimates available, and the only NATA year during our follow-up [21]. The NATA exposure estimates were tract-level benzene concentrations, combined with census data, climate data and human activity patterns, to estimate the average exposure for a person living in that tract [22]. We assigned NATA estimates based on the patient’s census tract of residence. As Philadelphia is relatively dense, the patient census tracts were generally very small (mean area = 0.86 km2 (SD = 0.93 km2)), suggesting better accuracy than in less dense regions of larger census tracts.

2.3. Birth Outcomes and Covariate Ascertainment

The main outcome of interest was PTB, defined as birth before 37 weeks of gestation, with further distinction between spontaneous versus medically indicated PTB. sPTB was defined as birth following preterm labor or the spontaneous rupture of membranes. mPTB was defined as birth after labor induction or cesarian birth performed due to concern for maternal or fetal wellbeing. Each PTB was independently adjudicated by two blinded reviewers. Where there was disagreement, the chart went to a third senior reviewer for final assignment of the PTB phenotype. The covariates used in the models that may be associated with PTB included maternal race/ethnicity (Asian, Black non-Hispanic, Hispanic, other/unknown, White non-Hispanic), maternal age (<25, 25–34, ≥35 years), BMI (<25, 25–<30, ≥30 kg/m2, missing), insurance status (private, public/Medicaid/other), nulliparity (yes, no) and census tract-level percentage of poverty.

2.4. Analysis

To estimate the associations of benzene and NO2 exposure during pregnancy with PTB outcomes, we used logistic mixed-effects models with the birth hospital and the patient’s census tract as random intercepts to account for clustering. NO2 and benzene exposure were represented in parts per billion (ppb) and the models used standard deviation increments as the independent variables. Both pollutants were included in the models. We compared the unadjusted and adjusted associations of NO2 and benzene with overall PTB, and with sPTB and mPTB separately. We also re-ran all the models stratified by race. Statistical analyses were run using R (Version 3.6.1, R Core Team: Vienna, Austria) [23] on RStudio (Version 1.2.5001, RStudio, PBC: Boston, MA, USA) [24]. Demographic and exposure data were mapped at the census tract level using qGIS3 (Version 3.18.3, QGIS Development Team) [25].

3. Results

The demographic characteristics and air pollution estimates for the cohort are shown in Table 1. Of the 19,169 births, 1708 (8.9%) were PTB (n = 1035 (5.4%) sPTB and n = 657 (3.4%) mPTB). There were 16 PTBs that were not able to be classified as either sPTB or mPTB. Patients with PTB were more likely to self-identify as Black and be publicly insured. With respect to characteristics and PTB phenotypes, patients with mPTB (but not sPTB) were older and had higher BMIs. The mean NO2 and benzene exposure levels were similar among patients with term birth and PTB. The mean NO2 and benzene exposure levels were similar among patients with sPTB and mPTB.
Benzene exposure estimates by census tract are mapped in Figure 2a. The benzene exposure map shows the highest exposure concentrations in west South Philadelphia and parts of North Philadelphia. The exposure decreases as the distance from these areas increases. The spatial component of the NO2 LUR model shown in Figure 2b demonstrates higher exposure in Center City and South Philadelphia, as well as near highways and major roads.
Figure 3 shows the spatial distribution of the study cohort patients from the two hospitals. The majority of the patients at the Hospital of the University of Pennsylvania lived in West and Southwest Philadelphia (Figure 3a). The majority of the patients at Pennsylvania Hospital lived in Center City and South Philadelphia (Figure 3b). Figure 4 shows the racial distribution of the patients in the birth cohort. Black patients primarily lived in West and Southwest Philadelphia, in addition to west South Philadelphia, close to the oil refinery, while White patients lived in Center City and other parts of South Philadelphia.
In the unadjusted models, we did not detect associations of benzene or NO2 with overall PTB (Table 2). In the adjusted models, we also did not detect associations of benzene or NO2 with overall PTB. When stratified by race, we also did not observe significant associations of benzene or NO2 and with overall PTB. With respect to associations with sPTB, in the unadjusted models, we observed no significant associations with benzene or NO2. In the adjusted models, we also did not detect significant associations of benzene or NO2 with sPTB (Table 2). Race-stratified sPTB models also showed no association with benzene or NO2. With respect to mPTB, the unadjusted analyses showed negative associations of benzene and NO2 with mPTB, but adjustment nullified the association. Models stratified by race also showed no association of benzene or NO2 with mPTB.
The trimester-specific NO2 exposure models with benzene showed a negative association with mPTB in the unadjusted NO2 model that was nullified by adjustment, and all other trimester-specific adjusted models showed no association with overall PTB, sPTB or mPTB (Supplementary Table S1). The unadjusted and adjusted models stratified by hospital also showed no association with overall PTB, sPTB or mPTB (Appendix A Table A1).

4. Discussion

Our study did not find evidence that exposure to benzene and NO2 during pregnancy was associated with PTB in a cohort of patients from two hospitals in Philadelphia. Adjusting for patient and census tract-level characteristics and including hospital and census tract as random intercepts nullified the negative unadjusted associations of benzene and NO2 with mPTB. When stratified by race, we also found no association of benzene and NO2 with PTB or PTB phenotypes. This suggests that other types of environmental exposure may be more likely candidates in explaining the racial disparities in PTB in Philadelphia, in addition to other health and socioeconomic factors.
The lack of association may have also been driven by other factors that we could not account for in the models. While we hypothesized that NO2 and benzene may be toxic to pregnancies, it is likely that other factors have stronger effects. Certain individual- and health-level factors are more predictive of preterm birth outcomes. For example, high BMI and smoking are associated with preterm birth outcomes [26,27], in addition to health factors such as diabetes mellitus and high blood pressure [28,29]. However, we consciously chose not to adjust for variables that may be on the causal pathway between pollution and PTB, such as hypertension (Supplementary Figure S1).
These results are consistent with other studies, such as an NYC multi-center birth study from 2008 to 2010 that explored the relationship between LUR-predicted exposure to PM2.5 and NO2 and sPTB but found negative associations due to confounding by hospital characteristics [14]. A meta-analysis of several pollutant and birth outcome studies found a pooled OR for the association between NO2 and PTB that was not statistically significant [30]. Our study differs from other studies’ findings, including those from a cohort of patients in Valencia, Spain from 2003 to 2005 that used LUR models to predict benzene and NO2 exposure and found a positive association between exposure to these pollutants and the risk of PTB [12]. In addition, a large study from Shanghai that examined the effects of LUR-predicted NO2 and PTB found a positive association between third-trimester NO2 exposure and PTB [31].
Multicenter studies such as this one are important for understanding the effect of environmental exposure on adverse birth outcomes because they provide a more representative sample of patients that give birth in an area. As shown in Figure 3, the spatial distribution of patients’ addresses between the two hospitals in the birth cohort differ substantially. While the cohort had data from only two of the five birth hospitals in Philadelphia, the births at these hospitals together made up 47% of all Philadelphia births from 2013 to 2017 [32]. Although stratifying the results by hospital did not reveal associations between the pollutants and PTB outcomes (Figure 4), including the hospital as a random intercept in the final models reduced the between-hospital variability.
There were several factors that may have contributed to the lack of association seen in the study. Reliable smoking data were unavailable, though smoking affects health overall and impacts benzene and NO2 exposure during pregnancy, as both are present in cigarette smoke [33]. However, only 7.2% of pregnant people in 2016 reported smoking during pregnancy [34]. Alcohol consumption and drug use data were also unavailable. In addition, many White patients lived in the areas of Philadelphia, such as Center City, with the highest traffic emissions (Figure 4), but also had higher average socioeconomic status and better access to healthcare. While we had access to insurance data, we did not have other individual-level socioeconomic variables. It is also possible that buffering factors such as air conditioning in wealthier areas with high pollution could have reduced exposure to NO2 and benzene in these areas. The spatial distribution of wealthier White patients in areas with higher pollution may mask the possible effects of benzene and NO2 on PTB. Finally, benzene air monitoring data from 2014 was at the census tract level and relied on the average exposure in 2014. Thus, in contrast to the NO2 estimates, the benzene estimates were not specific to each patient’s pregnancy period, which could have diluted associations that might have otherwise been detected during exposure peaks. Finally, we did not have information on the patients’ work addresses, and it is possible that patients moved residences during pregnancy, which may have led to exposure misclassification.

5. Conclusions

In conclusion, an analysis of 18,616 births in Philadelphia did not reveal associations of ambient NO2 or benzene exposure with PTB or its phenotypes, nor did it support the hypothesis that these exposures might partially explain the racial disparities in these outcomes. Our findings suggest that other types of exposure are likely responsible for the ongoing racial disparities in PTB in Philadelphia, while controlling for other socioeconomic factors. Ultimately, more thorough and consistent air monitoring of benzene, NO2 and other air pollutants may improve our understanding of the relationships between air pollution and PTB and may provide more insight into the environmental factors that affect PTB disparities.

Supplementary Materials

The following supporting information can be downloaded at: www.mdpi.com/article/10.3390/ijerph191610365/s1, Figure S1. Directed acyclic graph demonstrating the assumed relationships between different socioeconomic and health factors that may have an effect when studying the relationship between NO2 and benzene exposure to preterm births. Certain medical comorbidities may be on the causal pathway between air pollution exposure and preterm birth; Table S1. Unadjusted and adjusted odds ratio (OR) of a standard deviation increment increase in benzene and trimester-level NO2 exposure, with preterm birth (PTB) outcomes including spontaneous (sPTB) and medically indicated (mPTB).

Author Contributions

Conceptualization, K.M.E., E.R., H.H.B. and J.E.C.; methodology, K.M.E., S.T., H.H.B. and J.E.C.; software, K.M.E., A.M.M., R.L., N.Y. and S.T.; validation, K.M.E., A.M.M. and S.T.; formal analysis, K.M.E., A.M.M. and S.T.; investigation, A.M.M., R.L., S.T., H.H.B. and J.E.C.; resources, H.H.B. and J.E.C.; data curation, K.M.E., A.M.M., R.L. and N.Y.; writing—original draft preparation, K.M.E.; writing—review and editing, K.M.E., S.T., H.H.B. and J.E.C.; visualization, K.M.E., H.H.B. and J.E.C.; supervision, H.H.B. and J.E.C.; project administration, H.H.B. and J.E.C.; funding acquisition, H.H.B. All authors have read and agreed to the published version of the manuscript.

Funding

The Penn March of Dimes Prematurity Research Center (PI Driscoll) supported this study. The Department of Pediatrics at the Children’s Hospital of Philadelphia also provided financial support for this study.

Institutional Review Board Statement

The study was conducted in accordance with the Declaration of Helsinki, and approved by the Institutional Review Board (or Ethics Committee) of the University of Pennsylvania (protocol code 829674, 23 April 2018).

Informed Consent Statement

Patient consent was waived due to the use of existing data collected for clinical purposes and the minimal risk to the study subjects.

Data Availability Statement

Data may be requested from Burris, and, upon approval from the University of Pennsylvania, deidentified data may be made available to external investigators. The data are not publicly available due to their containing protected health information.

Acknowledgments

We thank Jerry Fagliano from Drexel University’s Dornsife School of Public Health for his mentorship and feedback in the early stages of the research project.

Conflicts of Interest

The funders had no role in the design of the study; in the collection, analyses, or interpretation of data; in the writing of the manuscript; or in the decision to publish the results.

Appendix A

Table A1. Unadjusted and adjusted a odds ratios (OR) of a standard deviation increment increase in NO2 and benzene with preterm birth (PTB), spontaneous PTB (sPTB) and medically indicated PTB (mPTB), stratified by hospital of birth.
Birth Outcome: PTB
OR (95% CI)
Birth Outcome: sPTB
OR (95% CI)
Birth Outcome: mPTB
OR (95% CI)
HUP
Unadjusted Benzene1.01 (0.944, 1.09)1.07 (0.982, 1.17)0.920 (0.817, 1.03)
Adjusted Benzene1.02 (0.933, 1.11)1.06 (0.953, 1.19)0.931 (0.819, 1.06)
Unadjusted NO21.04 (0.964, 1.12)1.06 (0.970, 1.17)1.02 (0.891, 1.18)
Adjusted NO21.03 (0.942, 1.12)1.03 (0.921, 1.14)1.02 (0.900, 1.16)
PAH
Unadjusted Benzene0.971 (0.902, 1.05)1.01 (0.915, 1.10)0.920 (0.817, 1.03)
Adjusted Benzene1.02 (0.945, 1.11)1.03 (0.935, 1.15)1.01 (0.888, 1.14)
Unadjusted NO20.909 (0.850, 0.973)0.949 (0.870, 1.04)0.974 (0.828, 1.15)
Adjusted NO20.939 (0.868, 1.02)0.941 (0.851, 1.04)0.935 (0.826, 1.06)
a Adjusted models were logistic mixed models adjusting for age, race, BMI, nulliparity, insurance status and census tract-level percentage below poverty. Hospital and census tracts were included as random intercepts. Adjusted models mutually adjusted for the other pollutant. NH, non-Hispanic. HUP, Hospital of the University of Pennsylvania. PAH, Pennsylvania Hospital.

References

  1. Centers for Disease Control and Prevention. Preterm Birth. Reproductive Health 2020. Available online: https://www.cdc.gov/reproductivehealth/maternalinfanthealth/pretermbirth.htm (accessed on 8 October 2021).
  2. Hack, M.; Flannery, D.J.; Schluchter, M.; Cartar, L.; Borawski, E.; Klein, N. Outcomes in Young Adulthood for Very-Low-Birth-Weight Infants. N. Engl. J. Med. 2002, 346, 149–157. [Google Scholar] [CrossRef] [PubMed]
  3. Zwicker, J.G.; Harris, S.R. Quality of Life of Formerly Preterm and Very Low Birth Weight Infants from Preschool Age to Adulthood: A Systematic Review. Pediatrics 2008, 121, e366–e376. [Google Scholar] [CrossRef] [PubMed]
  4. Osterman, M.J.; Hamilton, B.E.; Martin, J.A.; Driscoll, A.K.; Valenzuela, C.P. Births: Final data for 2020. In National Vital Statistics Report; Centers for Disease Control and Prevention: Atlanta, GA, USA, 2021; pp. 1–50. [Google Scholar]
  5. Burris, H.H.; Lorch, S.A.; Kirpalani, H.; Pursley, D.M.; Elovitz, M.; Clougherty, J.E. Racial disparities in preterm birth in USA: A biosensor of physical and social environmental exposures. Arch. Dis. Child. 2019, 104, 931–935. [Google Scholar] [CrossRef] [PubMed]
  6. Jelliffe-Pawlowski, L.; Baer, R.; Blumenfeld, Y.; Ryckman, K.; O’Brodovich, H.; Gould, J.; Druzin, M.; El-Sayed, Y.; Lyell, D.; Stevenson, D.; et al. Maternal characteristics and mid-pregnancy serum biomarkers as risk factors for subtypes of preterm birth. BJOG Int. J. Obstet. Gynaecol. 2015, 122, 1484–1493. [Google Scholar] [CrossRef] [PubMed]
  7. Berkowitz, G.S.; Blackmore-Prince, C.; Lapinski, R.H.; Savitz, D.A. Risk Factors for Preterm Birth Subtypes. Epidemiology 1998, 9, 279–285. [Google Scholar] [CrossRef] [PubMed]
  8. Henderson, J.J.; McWilliam, O.A.; Newnham, J.; Pennell, C. Preterm birth aetiology 2004–2008. Maternal factors associated with three phenotypes: Spontaneous preterm labour, preterm pre-labour rupture of membranes and medically indicated preterm birth. J. Matern. Neonatal Med. 2012, 25, 642–647. [Google Scholar] [CrossRef]
  9. Ananth, C.V.; Vintzileos, A.M. Epidemiology of preterm birth and its clinical subtypes. J. Matern. Neonatal Med. 2006, 19, 773–782. [Google Scholar] [CrossRef]
  10. Fuchs, F.; Monet, B.; Ducruet, T.; Chaillet, N.; Audibert, F. Effect of maternal age on the risk of preterm birth: A large cohort study. PLoS ONE 2018, 13, e0191002. [Google Scholar] [CrossRef]
  11. Cassidy-Bushrow, A.E.; Burmeister, C.; Lamerato, L.; Lemke, L.D.; Mathieu, M.; O’Leary, B.F.; Sperone, F.G.; Straughen, J.K.; Reiners, J.J. Prenatal airshed pollutants and preterm birth in an observational birth cohort study in Detroit, Michigan, USA. Environ. Res. 2020, 189, 109845. [Google Scholar] [CrossRef]
  12. Llop, S.; Ballester, F.; Estarlich, M.; Esplugues, A.; Rebagliato, M.; Iñiguez, C. Preterm birth and exposure to air pollutants during pregnancy. Environ. Res. 2010, 110, 778–785. [Google Scholar] [CrossRef]
  13. Brauer, M.; Lencar, C.; Tamburic, L.; Koehoorn, M.; Demers, P.; Karr, C. A Cohort Study of Traffic-Related Air Pollution Impacts on Birth Outcomes. Environ. Health Perspect. 2008, 116, 680–686. [Google Scholar] [CrossRef] [PubMed]
  14. Johnson, S.; Bobb, J.F.; Ito, K.; Savitz, D.A.; Elston, B.; Shmool, J.L.; Dominici, F.; Ross, Z.; Clougherty, J.E.; Matte, T. Ambient Fine Particulate Matter, Nitrogen Dioxide, and Preterm Birth in New York City. Environ. Health Perspect. 2016, 124, 1283–1290. [Google Scholar] [CrossRef] [PubMed]
  15. Shah, P.S.; Balkhair, T. Air pollution and birth outcomes: A systematic review. Environ. Int. 2011, 37, 498–516. [Google Scholar] [CrossRef] [PubMed]
  16. Badham, H.J.; Renaud, S.J.; Wan, J.; Winn, L.M. Benzene-initiated oxidative stress: Effects on embryonic signaling pathways. Chem. Biol. Interact. 2010, 184, 218–221. [Google Scholar] [CrossRef] [PubMed]
  17. Erickson, A.C.; Arbour, L. The Shared Pathoetiological Effects of Particulate Air Pollution and the Social Environment on Fetal-Placental Development. J. Environ. Public Health 2014, 2014, 901017. [Google Scholar] [CrossRef]
  18. Kannan, S.; Misra, D.P.; Dvonch, J.T.; Krishnakumar, A. Exposures to Airborne Particulate Matter and Adverse Perinatal Outcomes: A Biologically Plausible Mechanistic Framework for Exploring Potential Effect Modification by Nutrition. Environ. Health Perspect. 2006, 114, 1636–1642. [Google Scholar] [CrossRef]
  19. Handley, S.C.; Mullin, A.M.; Elovitz, M.A.; Gerson, K.D.; Montoya-Williams, D.; Lorch, S.A.; Burris, H.H. Changes in Preterm Birth Phenotypes and Stillbirth at 2 Philadelphia Hospitals During the SARS-CoV-2 Pandemic, March–June 2020. JAMA 2021, 325, 87–89. [Google Scholar] [CrossRef]
  20. Montoya-Williams, D.; Mullin, A.M.; Handley, S.C.; Flannery, D.D.; Lorch, S.A.; Elovitz, M.A.; Burris, H.H. Disparities in SARS-CoV-2 positivity among pregnant patients with limited English proficiency. J. Perinatol. 2021, 41, 2564–2565. [Google Scholar] [CrossRef]
  21. Environmental Protection Agency. National Air Toxics Assessment: 2014 NATA: Assessment Results. 2018. Available online: https://www.epa.gov/national-air-toxics-assessment/2014-nata-assessment-results#pollutant (accessed on 15 January 2020).
  22. Environmental Protection Agency. National Air Toxics Assessment: 2014 NATA: Assessment Methods. 2018. Available online: https://www.epa.gov/national-air-toxics-assessment/2014-nata-assessment-methods (accessed on 15 January 2020).
  23. R Core Team. R: A Language and Environment for Statistical Computing. 2019. Available online: https://www.R-project.org (accessed on 11 August 2021).
  24. RStudio Team. RStudio: Integrated Development Environment for R. 2019. Available online: http://www.rstudio.com (accessed on 11 August 2021).
  25. QGIS.org. QGIS Geographic Information System. 2021. Available online: http://www.qgis.org (accessed on 7 June 2021).
  26. McDonald, S.D.; Han, Z.; Mulla, S.; Beyene, J.; Knowledge Synthesis Group. Overweight and obesity in mothers and risk of preterm birth and low birth weight infants: Systematic review and meta-analyses. BMJ 2010, 341, c3428. [Google Scholar] [CrossRef]
  27. Ion, R.; Bernal, A.L. Smoking and Preterm Birth. Reprod. Sci. 2015, 22, 918–926. [Google Scholar] [CrossRef]
  28. Köck, K.; Köck, F.; Klein, K.; Bancher-Todesca, D.; Helmer, H. Diabetes mellitus and the risk of preterm birth with regard to the risk of spontaneous preterm birth. J. Matern. Fetal Neonatal Med. 2010, 23, 1004–1008. [Google Scholar] [CrossRef] [PubMed]
  29. Zhang, J.; Villar, J.; Sun, W.; Merialdi, M.; Abdel-Aleem, H.; Mathai, M.; Ali, M.; Yu, K.F.; Zavaleta, N.; Purwar, M.; et al. Blood pressure dynamics during pregnancy and spontaneous preterm birth. Am. J. Obstet. Gynecol. 2007, 197, 162.e1–162.e6. [Google Scholar] [CrossRef]
  30. Stieb, D.M.; Chen, L.; Eshoul, M.; Judek, S. Ambient air pollution, birth weight and preterm birth: A systematic review and meta-analysis. Environ. Res. 2012, 117, 100–111. [Google Scholar] [CrossRef] [PubMed]
  31. Ji, X.; Meng, X.; Liu, C.; Chen, R.; Ge, Y.; Kan, L.; Fu, Q.; Li, W.; Tse, L.A.; Kan, H. Nitrogen dioxide air pollution and preterm birth in Shanghai, China. Environ. Res. 2019, 169, 79–85. [Google Scholar] [CrossRef] [PubMed]
  32. Pennsylvania Department of Health. Birth Statistics. Occurrent Live Births by Hospital and Method of Delivery. Available online: https://www.health.pa.gov/topics/HealthStatistics/VitalStatistics/BirthStatistics/Pages/birth-statistics.aspx (accessed on 20 May 2022).
  33. Darrall, K.G.; Figgins, J.A.; Brown, R.D. Determination of benzene and associated volatile compounds in mainstream cigarette smoke. Analyst 1998, 123, 1095–1101. [Google Scholar] [CrossRef]
  34. Drake, P.; Driscoll, A.K.; Mathews, T.J. Cigarette Smoking During Pregnancy: United States, 2016. NCHS Data Brief 2018, 305, 1–8. [Google Scholar]
Figure 1. Analytic cohort development.
Ijerph 19 10365 g001
Figure 2. (a) Benzene level by census tract in Philadelphia County; (b) spatial component of LUR model showing NO2. This map does not account for temporal component, which is individualized to the patient.
Ijerph 19 10365 g002
Figure 3. Number of births per census tract by hospital: (a) Hospital of the University of Pennsylvania; (b) Pennsylvania Hospital.
Ijerph 19 10365 g003
Figure 4. Maternal race by census tract. (a) Patients who self-identified as Black, Non-Hispanic; (b) Patients who self-identified as White Non-Hispanic.
Ijerph 19 10365 g004
Table 1. Maternal demographics, environmental characteristics and birth outcomes of the study cohort, stratified by term birth, preterm birth (PTB), spontaneous PTB (sPTB) and medically indicated PTB (mPTB).
OverallTermPTBsPTBmPTB
Characteristicsn = 19,169n = 17,461n = 1708n = 1035n = 657
Maternal Age
 <2526.9%26.7%29.1%33.2%22.7%
 25–3455.3%55.5%53.0%51.5%55.4%
 ≥3517.8%17.8%17.9%15.5%21.9%
Maternal Race
 White Non-Hispanic28.2%29.0%19.4%21.0%17.0%
 Black Non-Hispanic52.6%51.4%64.4%61.2%69.7%
 Asian6.3%6.4%4.7%6.3%2.1%
 Hispanic8.4%8.5%7.6%7.3%7.6%
 Mixed/Other/Unknown4.2%4.6%3.9%4.3%3.5%
BMI 1
 <2549.5%50.2%42.3%49.2%32.4%
 25–<3023.5%23.5%23.3%23.2%23.8%
 ≥3027.0%26.3%34.4%27.7%43.8%
Private Insurance 245.1%46.1%35.8%36.3%35.4%
Nulliparity 344.5%44.8%41.3%41.1%42.0%
Census Tract: Percentage of Poverty28.0 (14.7)27.7 (14.8)30.35 (14.1)29.9 (14.2)30.9 (13.8)
Hospital of Birth
 Pennsylvania Hospital54.8%55.6%47.2%46.4%47.5%
 Hospital of the University of Pennsylvania45.2%44.4%52.8%53.6%52.5%
Air Pollutants
 NO2 (ppb)17.2 (2.3)17.2 (2.3)17.1 (2.6)17.2 (2.6)17.0 (2.6)
 Benzene (ppb)0.22 (0.02)0.22 (0.02)0.22 (0.02)0.22 (0.02)0.22 (0.02)
1 Missing values for BMI overall: 3484, term: 3152, PTB: 332, sPTB: 236, mPTB: 86. 2 Missing values for private insurance overall: 314, term: 271, PTB: 443, sPTB: 33, mPTB: 10. 3 Missing values for nulliparity overall: 238, term: 237, PTB: 1, sPTB: 0, mPTB: 0.
Table 2. Unadjusted and adjusted a odds ratios (ORs) of a standard deviation increment increase in NO2 and benzene with preterm birth (PTB) outcomes, including spontaneous (sPTB) and medically indicated (mPTB).
Birth Outcome: PTB
OR (95% CI)
Birth Outcome: sPTB
OR (95% CI)
Birth Outcome: mPTB
OR (95% CI)
Overall
Unadjusted Benzene0.96 (0.91, 1.01)1.00 (0.94, 1.06)0.89 (0.82, 0.97) *
Adjusted Benzene1.02 (0.96, 1.08)1.05 (0.97, 1.13)0.97 (0.89, 1.06)
Unadjusted NO20.95 (0.90, 0.99) *0.98 (0.92, 1.04)0.90 (0.84, 0.97) *
Adjusted NO20.975 (0.92, 1.03)0.972 (0.90, 1.05)0.97 (0.89, 1.06)
Maternal race/ethnicity: Asian NH
Unadjusted Benzene1.06 (0.844, 1.33)1.01 (0.78, 1.30)1.26 (0.745, 2.04)
Adjusted Benzene1.05 (0.817, 1.34)0.974 (0.735, 1.29)1.36 (0.80, 2.30)
Unadjusted NO21.11 (0.878, 1.42)1.16 (0.891, 1.52)0.925 (0.564, 1.63)
Adjusted NO21.12 (0.857, 1.46)1.20 (0.892, 1.62)0.833 (0.47, 1.47)
Maternal race/ethnicity: Black NH
Unadjusted Benzene1.04 (0.98, 1.10)1.05 (0.97, 1.14)1.01 (0.92, 1.11)
Adjusted Benzene1.01 (0.94, 1.09)1.04 (0.94, 1.15)0.97 (0.88, 1.08)
Unadjusted NO21.01 (0.95, 1.09)1.03 (0.94, 1.13)1.00 (0.90, 1.11)
Adjusted NO20.99 (0.92, 1.07)0.99 (0.90, 1.10)1.00 (0.893, 1.12)
Maternal race/ethnicity: Hispanic
Unadjusted Benzene0.986 (0.782, 1.23)1.09 (0.82, 1.43)0.856 (0.58, 1.22)
Adjusted Benzene1.05 (0.816, 1.35)1.19 (0.861, 1.64)0.929 (0.623, 1.39)
Unadjusted NO20.953 (0.78, 1.17)0.980 (0.759, 1.29)0.930 (0.684, 1.30)
Adjusted NO20.905 (0.715, 1.15)0.855 (0.625, 1.17)0.966 (0.677, 1.38)
Maternal race/ethnicity: White NH
Unadjusted Benzene0.96 (0.85, 1.08)1.03 (0.89, 1.19)0.82 (0.66, 1.00)
Adjusted Benzene0.99 (0.87, 1.13)1.02 (0.88, 1.19)0.94 (0.75, 1.18)
Unadjusted NO20.95 (0.86, 1.05)0.99 (0.88, 1.13)0.87 (0.75, 1.02)
Adjusted NO20.95 (0.85, 1.05)0.983 (0.858, 1.13)0.88 (0.74, 1.05)
Maternal race/ethnicity: other
Unadjusted Benzene1.05 (0.815, 1.34)1.02 (0.753, 1.38)1.10 (0.719, 1.65)
Adjusted Benzene1.12 (0.852, 1.48)1.22 (0.875, 1.70)0.962 (0.594, 1.56)
Unadjusted NO21.15 (0.911, 1.46)1.03 (0.785, 1.37)1.47 (0.971, 2.31)
Adjusted NO21.11 (0.850, 1.45)0.964 (0.698, 1.33)1.58 (0.962, 2.58)
a Adjusted models were logistic mixed models adjusting for age, race, BMI, nulliparity, insurance status and census tract-level percentage below poverty. Hospital and census tracts were included as random intercepts. Adjusted models mutually adjusted for the other pollutant. NH, non-Hispanic. * Results were statistically significant.
Publisher’s Note: MDPI stays neutral with regard to jurisdictional claims in published maps and institutional affiliations.

