
Estimating the Decoupling between Net Carbon Emissions and Construction Land and Its Driving Factors: Evidence from Shandong Province, China


 ,
, 
Abstract
:1. Introduction
2. Literature Review
3. Materials and Methods
3.1. Study Area
3.2. Data Sources
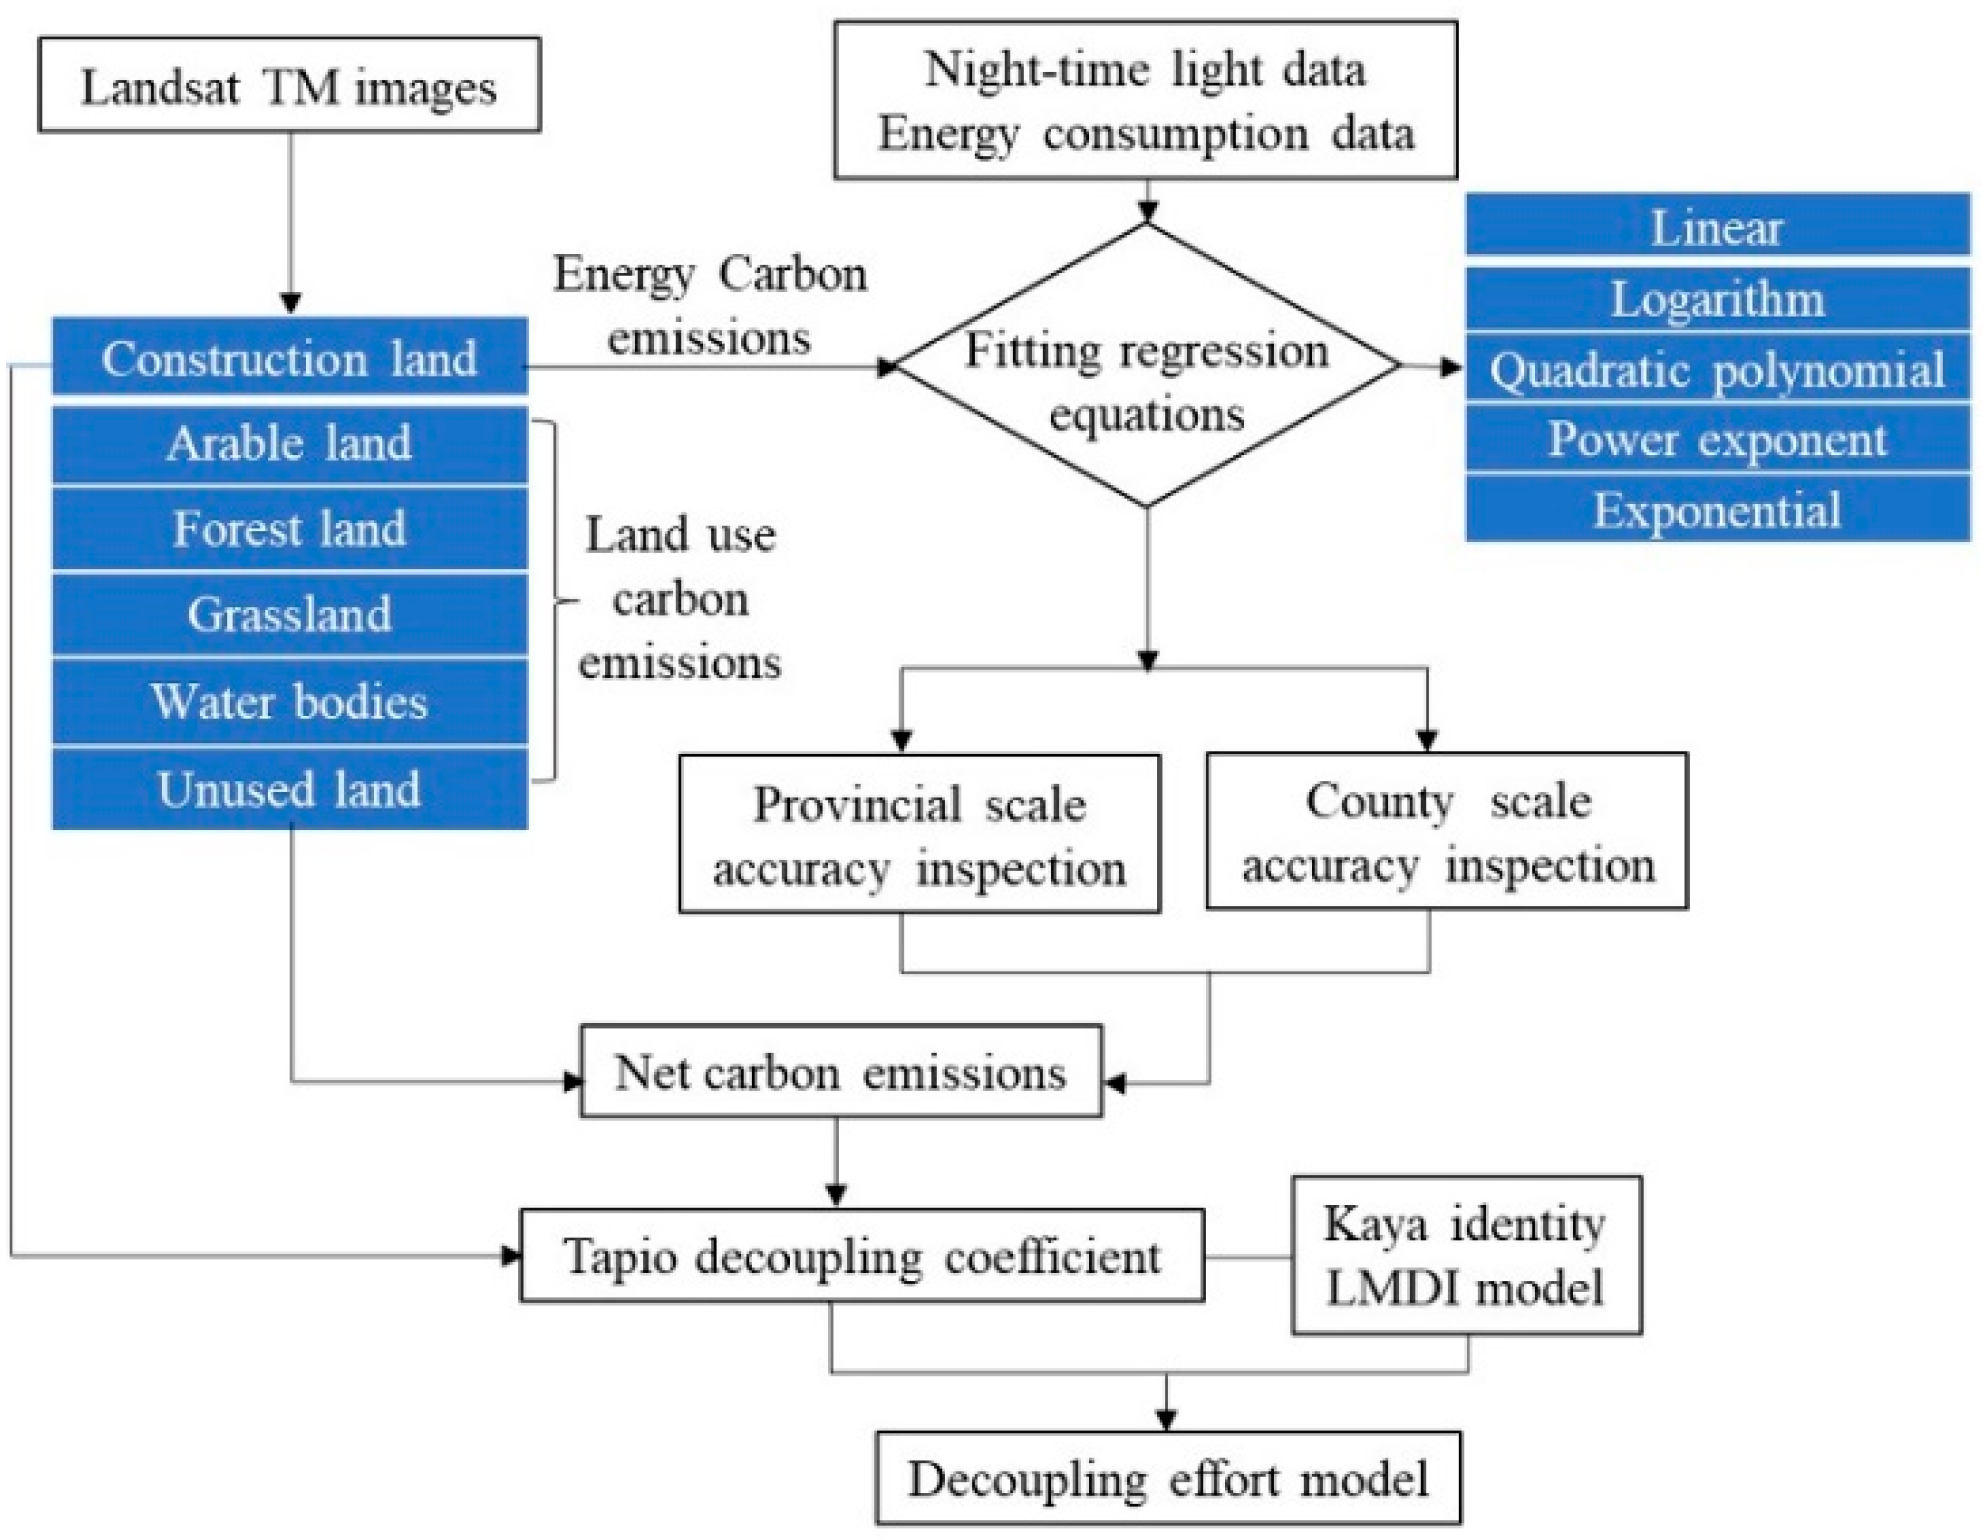
3.3. Methodology
3.3.1. Estimation of Net Carbon Emissions
- (1)
- Estimation of carbon emissions from land use
- (2)
- Estimation of carbon emissions from energy consumption
3.3.2. Tapio Decoupling Coefficient
3.3.3. Decoupling Effort Model
4. Results
4.1. Spatiotemporal Evolution of Land Types
4.2. Spatiotemporal Evolution of Net Carbon Emissions
4.3. Decoupling between Net Carbon Emissions and Construction Land
4.3.1. Temporal Evolution of the Decoupling Relationship
4.3.2. Spatial Evolution of the Decoupling Relationship
4.4. Driving Factors of Decoupling between Net Carbon Emissions and Construction Land
4.4.1. Factors Influencing Net Carbon Emissions
4.4.2. Decoupling Efforts of the Driving Factors
5. Discussion
5.1. Accuracy of the Estimation of Net Carbon Emissions
5.2. Mechanism of Action of Driving Factors on Decoupling
5.3. Contributions of Research Findings
6. Conclusions
6.1. Conclusions
- (1)
- From 2000 to 2020, the net carbon emissions in Shandong Province continued to increase. The carbon emissions for energy consumption carried on construction land were the main carbon sources, the total carbon sources far exceeded the carbon sinks. Spatially, areas with high carbon emissions tended to from clusters centering on municipal districts, and in the case of Jinan and Qingdao, two distinct carbon emission cluster centers were formed.
- (2)
- The first three periods featured an expansive negative decoupling between net carbon emissions and construction land in Shandong Province, and this evolved into a strong negative decoupling from 2015 to 2020. Spatially, the areas with expansive negative decoupling dominated the province. The number of areas with strong and weak decoupling increased from 2005 to 2010, and the number of areas with strong negative decoupling increased from 2015 to 2020. In general, the current decoupling between net carbon emissions and construction land in Shandong Province is not conducive to carbon reduction.
- (3)
- From 2000 to 2020, the promoting effect of the economic scale on net carbon emissions was strengthened, while that for the intensity of technological innovation weakened. The inhibitory effect on net carbon emissions due to the efficiency of technological innovation was strengthened, whereas that for the rate of intensive land use weakened. The role of the intensity of carbon emissions and the size of the population evolved from an inhibitory one to a promoting one, and the industrial structure and the degree of land use evolved from a promoting role to an inhibitory role. In general, carbon emissions were promoted, and carbon emissions were inhibited by various factors which can basically offset each other.
- (4)
- From 2000 to 2020, the rate of intensive land use and the efficiency of technological innovation made strong efforts with respect to achieving decoupling. Spatially, the rate of intensive land use in various regions of the province strived to achieve the ideal decoupling, and the regions where technological innovation efficiency contributed to decoupling were distributed in clusters centering on the municipal districts. The intensity of carbon emissions evolved from strong decoupling efforts to no decoupling efforts; the areas that strived to achieve decoupling were mainly municipal districts and were distributed in a “dotted” shape. The size of the population evolved from strong decoupling efforts to no decoupling efforts, the areas with strong decoupling efforts were mostly located in county-level cities and counties, while the areas with weak decoupling efforts were mostly distributed in municipal districts. The degree of land use changed from no decoupling efforts to strong decoupling efforts, and, in recent years, the reduction of construction land contributed to ideal decoupling. In general, more efforts are needed, through the involvement of the above factors, to realize an ideal decoupling condition.
6.2. Implications
6.3. Limitations and Proposals for Future Research
Author Contributions
Funding
Institutional Review Board Statement
Informed Consent Statement
Data Availability Statement
Conflicts of Interest
References
- IPCC. Climate Change 2021: The Physical Science Basis; Intergovernmental Panel on Climate Change: Geneva, Switzerland, 2021. [Google Scholar]
- IPCC. Special Report on Climate Change and Land; Intergovernmental Panel on Climate Change: Geneva, Switzerland, 2019. [Google Scholar]
- Jim, C.Y. Green-space preservation and allocation for sustainable greening of compact cities. Cities 2004, 21, 311–320. [Google Scholar] [CrossRef]
- Kaffashi, S.; Yavari, M. Land-use planning of Minoo Island, Iran, towards sustainable land-use management. Int. J. Sustain. Dev. World Ecol. 2011, 18, 304–315. [Google Scholar] [CrossRef]
- Cheng, Y.; Liu, H.; Wang, S.; Cui, X.; Li, Q. Global Action on SDGs: Policy Review and Outlook in a Post-Pandemic Era. Sustainability 2021, 13, 6461. [Google Scholar] [CrossRef]
- BP. Statistical Review of World Energy. In East Sussex; Pureprint Group Limited: Uckfield, UK, 2021. [Google Scholar]
- Chen, B.; Zhang, H.; Li, W.; Du, H.; Huang, H.; Wu, Y.; Liu, S. Research on provincial carbon quota allocation under the background of carbon neutralization. Energy Rep. 2022, 8, 903–915. [Google Scholar] [CrossRef]
- Li, J.-F.; Gu, A.L.; Ma, Z.-Y.; Zhang, C.-L.; Sun, Z.-Q. Economic development, energy demand, and carbon emission prospects of China’s provinces during the 14th Five-Year Plan period: Application of CMRCGE model. Adv. Clim. Change Res. 2019, 10, 165–173. [Google Scholar] [CrossRef]
- Xie, H.; Zhu, Z.; Wang, B.; Liu, G.; Zhai, Q. Does the Expansion of Urban Construction Land Promote Regional Economic Growth in China? Evidence from 108 Cities in the Yangtze River Economic Belt. Sustainability 2018, 10, 4073. [Google Scholar] [CrossRef] [Green Version]
- Li, Y.; Kong, X.; Zhu, Z. Multiscale analysis of the correlation patterns between the urban population and construction land in China. Sustain. Cities Soc. 2020, 61, 102326. [Google Scholar] [CrossRef]
- Wang, J.; Feng, L.; Palmer, P.I.; Liu, Y.; Fang, S.; Bosch, H.; O’Dell, C.W.; Tang, X.; Yang, D.; Liu, L.; et al. Large Chinese land carbon sink estimated from atmospheric carbon dioxide data. Nature 2020, 586, 720–723. [Google Scholar] [CrossRef]
- Sun, X.; Yu, C.; Wang, J.; Wang, M. The Intensity Analysis of Production Living Ecological Land in Shandong Province, China. Sustainability 2020, 12, 8326. [Google Scholar] [CrossRef]
- Chao, Z.; Zhang, P.; Wang, X. Impacts of Urbanization on the Net Primary Productivity and Cultivated Land Change in Shandong Province, China. J. Indian Soc. Remote Sens. 2018, 46, 809–819. [Google Scholar] [CrossRef]
- Lin, Q.; Zhang, L.; Qiu, B.; Zhao, Y.; Wei, C. Spatiotemporal Analysis of Land Use Patterns on Carbon Emissions in China. Land 2021, 10, 141. [Google Scholar] [CrossRef]
- Ghosh, S.; Dinda, S.; Chatterjee, N.D.; Dutta, S.; Bera, D. Spatial-explicit carbon emission-sequestration balance estimation and evaluation of emission susceptible zones in an Eastern Himalayan city using Pressure-Sensitivity-Resilience framework: An approach towards achieving low carbon cities. J. Clean. Prod. 2022, 336, 130417. [Google Scholar] [CrossRef]
- Simmonds, M.B.; Di Vittorio, A.V.; Jahns, C.; Johnston, E.; Jones, A.; Nico, P.S. Impacts of California’s climate-relevant land use policy scenarios on terrestrial carbon emissions (CO2 and CH4) and wildfire risk. Environ. Res. Lett. 2021, 16, 014044. [Google Scholar] [CrossRef]
- Janssens-Maenhout, G.; Crippa, M.; Guizzardi, D.; Muntean, M.; Schaaf, E.; Dentener, F.; Bergamaschi, P.; Pagliari, V.; Olivier, J.G.J.; Peters, J.A.H.W.; et al. EDGAR v4.3.2 Global Atlas of the three major greenhouse gas emissions for the period 1970–2012. Earth Syst. Sci. Data 2019, 11, 959–1002. [Google Scholar] [CrossRef] [Green Version]
- Huisingh, D.; Zhang, Z.; Moore, J.C.; Qiao, Q.; Li, Q. Recent advances in carbon emissions reduction: Policies, technologies, monitoring, assessment and modeling. J. Clean. Prod. 2015, 103, 1–12. [Google Scholar] [CrossRef]
- Guo, D.; Chen, H.; Long, R.; Ni, Y. An integrated measurement of household carbon emissions from a trading-oriented perspective: A case study of urban families in Xuzhou, China. J. Clean. Prod. 2018, 188, 613–624. [Google Scholar] [CrossRef]
- Rueda-Cantuche, J.M.; Amores, A.F. Consistent and unbiased carbon dioxide emission multipliers: Performance of Danish emission reductions via external trade. Ecol. Econ. 2010, 69, 988–998. [Google Scholar] [CrossRef]
- Nagpure, A.S.; Sharma, K.; Gurjar, B.R. Traffic induced emission estimates and trends (2000–2005) in megacity Delhi. Urban Clim. 2013, 4, 61–73. [Google Scholar] [CrossRef]
- Geng, Y.; Tian, M.; Zhu, Q.; Zhang, J.; Peng, C. Quantification of provincial-level carbon emissions from energy consumption in China. Renew. Sustain. Energy Rev. 2011, 15, 3658–3668. [Google Scholar] [CrossRef]
- Doll, C.H.; Muller, J.-P.; Elvidge, C.D. Night-time Imagery as a Tool for Global Mapping of Socioeconomic Parameters and Greenhouse Gas Emissions. AMBIO J. Hum. Environ. 2000, 29, 157–162. [Google Scholar] [CrossRef]
- Elvidge, C.D.; Imhoff, M.L.; Baugh, K.E.; Hobson, V.R.; Nelson, I.; Safran, J.; Dietz, J.B.; Tuttle, B.T. Night time lights of the world:1994–1995. J. Photogramm. Remote Sens. 2001, 56, 81–99. [Google Scholar] [CrossRef]
- Matloob, A.; Sarif, M.O.; Um, J.-S. Exploring correlation between OCO-2 XCO2 and DMSP/OLS nightlight imagery signature in four selected locations in India. Spat. Inf. Res. 2021, 29, 123–135. [Google Scholar] [CrossRef]
- Su, Y.X.; Chen, X.Z.; Ye, Y.Y.; Wu, Q.T.; Zhang, H.O.; Huang, N.S.; Kuang, Y.Q. The characteristics and mechanisms of carbon emissions from energy consumption in China using DMSP/OLS night light imageries. Acta Geogr. Sin. 2013, 68, 1513–1526. [Google Scholar]
- Xiao, H.; Ma, Z.; Mi, Z.; Kelsey, J.; Zheng, J.; Yin, W.; Yan, M. Spatio-temporal simulation of energy consumption in China’s provinces based on satellite night-time light data. Appl. Energy 2018, 231, 1070–1078. [Google Scholar] [CrossRef]
- Du, X.; Shen, L.; Wong, S.W.; Meng, C.; Yang, Z. Night-time light data based decoupling relationship analysis between economic growth and carbon emission in 289 Chinese cities. Sustain. Cities Soc. 2021, 73, 103119. [Google Scholar] [CrossRef]
- Xu, Q.; Dong, Y.-x.; Yang, R. Urbanization impact on carbon emissions in the Pearl River Delta region: Kuznets curve relationships. J. Clean. Prod. 2018, 180, 514–523. [Google Scholar] [CrossRef]
- Baccini, A.; Goetz, S.J.; Walker, W.S.; Laporte, N.T.; Sun, M.; Sulla-Menashe, D.; Hackler, J.; Beck, P.S.A.; Dubayah, R.; Friedl, M.A.; et al. Estimated carbon dioxide emissions from tropical deforestation improved by carbon-density maps. Nat. Clim. Change 2012, 2, 182–185. [Google Scholar] [CrossRef]
- Carlton, R.; Berry, P.; Smith, P. Impact of crop yield reduction on greenhouse gas emissions from compensatory cultivation of pasture and forested land. Int. J. Agric. Sustain. 2011, 8, 164–175. [Google Scholar] [CrossRef]
- Zhou, Y.; Chen, M.; Tang, Z.; Mei, Z. Urbanization, land use change, and carbon emissions: Quantitative assessments for city-level carbon emissions in Beijing-Tianjin-Hebei region. Sustain. Cities Soc. 2021, 66, 102701. [Google Scholar] [CrossRef]
- Grafius, D.R.; Hall, S.; McHugh, N.; Edmondson, J.L. How much heat can we grow in our cities? Modelling UK urban biofuel production potential. GCB Bioenergy 2019, 12, 118–132. [Google Scholar] [CrossRef]
- Güneralp, B.; Seto, K.C. Can gains in efficiency offset the resource demands and CO2 emissions from constructing and operating the built environment? Appl. Geogr. 2012, 32, 40–50. [Google Scholar] [CrossRef]
- Feng, Y.; Chen, S.; Tong, X.; Lei, Z.; Gao, C.; Wang, J. Modeling changes in China’s 2000–2030 carbon stock caused by land use change. J. Clean. Prod. 2020, 252, 119659. [Google Scholar] [CrossRef]
- Guo, X.; Chuai, X.; Huang, X. A Land Use/Land Cover Based Green Development Study for Different Functional Regions in the Jiangsu Province, China. Int. J. Environ. Res. Public Health 2019, 16, 1277. [Google Scholar] [CrossRef] [PubMed] [Green Version]
- Zhang, W.; Xu, H. Exploring the causal relationship between carbon emissions and land urbanization quality in China using a panel data analysis. Environ. Dev. Sustain. 2016, 19, 1445–1462. [Google Scholar] [CrossRef]
- Tang, M.; Hu, F. How Does Land Urbanization Promote CO2 Emissions Reduction? Evidence From Chinese Prefectural-Level Cities. Front. Environ. Sci. 2021, 9, 766839. [Google Scholar] [CrossRef]
- Reid, W.V.; Ali, M.K.; Field, C.B. The future of bioenergy. Glob. Chang. Biol. 2020, 26, 274–286. [Google Scholar] [CrossRef] [Green Version]
- Stone, B., Jr. Urban sprawl and air quality in large US cities. J. Environ. Manag. 2008, 86, 688–698. [Google Scholar] [CrossRef]
- Makido, Y.; Dhakal, S.; Yamagata, Y. Relationship between urban form and CO2 emissions: Evidence from fifty Japanese cities. Urban Clim. 2012, 2, 55–67. [Google Scholar] [CrossRef] [Green Version]
- Di Vittorio, A.V.; Simmonds, M.B.; Nico, P. Quantifying the effects of multiple land management practices, land cover change, and wildfire on the California landscape carbon budget with an empirical model. PLoS ONE 2021, 16, e0251346. [Google Scholar] [CrossRef]
- Zhang, D.; Wang, Z.; Li, S.; Zhang, H. Impact of Land Urbanization on Carbon Emissions in Urban Agglomerations of the Middle Reaches of the Yangtze River. Int. J. Environ. Res. Public Health 2021, 18, 1403. [Google Scholar] [CrossRef]
- Cao, W.; Yuan, X. Region-county characteristic of spatial-temporal evolution and influencing factor on land use-related CO2 emissions in Chongqing of China, 1997–2015. J. Clean. Prod. 2019, 231, 619–632. [Google Scholar] [CrossRef]
- Wang, C.; Wang, F.; Zhang, X.; Yang, Y.; Su, Y.; Ye, Y.; Zhang, H. Examining the driving factors of energy related carbon emissions using the extended STIRPAT model based on IPAT identity in Xinjiang. Renew. Sustain. Energy Rev. 2017, 67, 51–61. [Google Scholar] [CrossRef]
- Hashmi, R.; Alam, K. Dynamic relationship among environmental regulation, innovation, CO2 emissions, population, and economic growth in OECD countries: A panel investigation. J. Clean. Prod. 2019, 231, 1100–1109. [Google Scholar] [CrossRef]
- Rosenlund, M.; Forastiere, F.; Stafoggia, M.; Porta, D.; Perucci, M.; Ranzi, A.; Nussio, F.; Perucci, C.A. Comparison of regression models with land-use and emissions data to predict the spatial distribution of traffic-related air pollution in Rome. J. Expo. Sci. Environ. Epidemiol. 2008, 18, 339. [Google Scholar] [CrossRef] [Green Version]
- Ang, B.W. Decomposition analysis for policy making in energy: Which is the preferred method? Energy Policy 2004, 32, 1131–1139. [Google Scholar] [CrossRef]
- Cansino, J.M.; Sánchez-Braza, A.; Rodríguez-Arévalo, M.L. Driving forces of Spain׳s CO2 emissions: A LMDI decomposition approach. Renew. Sustain. Energy Rev. 2015, 48, 749–759. [Google Scholar] [CrossRef]
- Karmellos, M.; Kosmadakis, V.; Dimas, P.; Tsakanikas, A.; Fylaktos, N.; Taliotis, C.; Zachariadis, T. A decomposition and decoupling analysis of carbon dioxide emissions from electricity generation: Evidence from the EU-27 and the UK. Energy 2021, 231, 120861. [Google Scholar] [CrossRef]
- Hu, M.; Li, R.; You, W.; Liu, Y.; Lee, C.-C. Spatiotemporal evolution of decoupling and driving forces of CO2 emissions on economic growth along the Belt and Road. J. Clean. Prod. 2020, 277, 123272. [Google Scholar] [CrossRef]
- Alajmi, R.G. Carbon emissions and electricity generation modeling in Saudi Arabia. Environ. Sci. Pollut. Res. Int. 2022, 29, 23169–23179. [Google Scholar] [CrossRef]
- Zhao, Y.; Ma, S.; Fan, J.; Cai, Y. Examining the Effects of Land Use on Carbon Emissions: Evidence from Pearl River Delta. Int. J. Environ. Res. Public Health 2021, 18, 2623. [Google Scholar] [CrossRef]
- Fitzpatrick, J.J.; Dooley, P. Holistic view of CO2 reduction potential from energy use by an individual processing company. Renew. Sustain. Energy Rev. 2017, 77, 336–343. [Google Scholar] [CrossRef]
- Raza, M.Y.; Lin, B. Decoupling and mitigation potential analysis of CO2 emissions from Pakistan’s transport sector. Sci. Total Environ. 2020, 730, 139000. [Google Scholar] [CrossRef] [PubMed]
- Adedoyin, F.F.; Gumede, M.I.; Bekun, F.V.; Etokakpan, M.U.; Balsalobre-Lorente, D. Modelling coal rent, economic growth and CO2 emissions: Does regulatory quality matter in BRICS economies? Sci. Total Environ. 2020, 710, 136284. [Google Scholar] [CrossRef] [PubMed]
- Ji, Y.; Xue, J. Decoupling Effect of County Carbon Emissions and Economic Growth in China: Empirical Evidence from Jiangsu Province. Int. J. Environ. Res. Public Health 2022, 19, 3275. [Google Scholar] [CrossRef] [PubMed]
- Karakaya, E.; Bostan, A.; Ozcag, M. Decomposition and decoupling analysis of energy-related carbon emissions in Turkey. Environ. Sci. Pollut. Res. Int. 2019, 26, 32080–32091. [Google Scholar] [CrossRef]
- Zhao, X.; Jiang, M.; Zhang, W. Decoupling between Economic Development and Carbon Emissions and Its Driving Factors: Evidence from China. Int. J. Environ. Res. Public Health 2022, 19, 2893. [Google Scholar] [CrossRef]
- Xie, J.; Sun, Y.; Huo, X. Dry Port-Seaport Logistics Network Construction under the Belt and Road Initiative: A Case of Shandong Province in China. J. Syst. Sci. Syst. Eng. 2021, 30, 178–197. [Google Scholar] [CrossRef]
- Cui, J.; Zhu, M.; Liang, Y.; Qin, G.; Li, J.; Liu, Y. Land Use/Land Cover Change and Their Driving Factors in the Yellow River Basin of Shandong Province Based on Google Earth Engine from 2000 to 2020. ISPRS Int. J. Geo-Inf. 2022, 11, 163. [Google Scholar] [CrossRef]
- Chen, J.; Gao, M.; Cheng, S.; Hou, W.; Song, M.; Liu, X.; Liu, Y.; Shan, Y. County-level CO2 emissions and sequestration in China during 1997–2017. Sci. Data 2020, 7, 391. [Google Scholar] [CrossRef]
- Shevliakova, E.; Stouffer, R.J.; Malyshev, S.; Krasting, J.P.; Hurtt, G.C.; Pacala, S.W. Historical warming reduced due to enhanced land carbon uptake. Proc. Natl. Acad. Sci. USA 2013, 110, 16730–16735. [Google Scholar] [CrossRef] [Green Version]
- Rong, T.; Zhang, P.; Jing, W.; Zhang, Y.; Li, Y.; Yang, D.; Yang, J.; Chang, H.; Ge, L. Carbon Dioxide Emissions and Their Driving Forces of Land Use Change Based on Economic Contributive Coefficient (ECC) and Ecological Support Coefficient (ESC) in the Lower Yellow River Region (1995–2018). Energies 2020, 13, 2600. [Google Scholar] [CrossRef]
- Huang, S.; Xi, F.; Chen, Y.; Gao, M.; Pan, X.; Ren, C. Land Use Optimization and Simulation of Low-Carbon-Oriented—A Case Study of Jinhua, China. Land 2021, 10, 1020. [Google Scholar] [CrossRef]
- Stokes, E.C.; Seto, K.C. Climate change and urban land systems: Bridging the gaps between urbanism and land science. J. Land Use Sci. 2016, 11, 698–708. [Google Scholar] [CrossRef]
- Raupach, M.R.; Rayner, P.J.; Paget, M. Regional variations in spatial structure of nightlights, population density and fossil-fuel CO2 emissions. Energy Policy 2010, 38, 4756–4764. [Google Scholar] [CrossRef]
- Letu, H.; Hara, M.; Yagi, H.; Naoki, K.; Tana, G.; Nishio, F.; Shuhei, O. Estimating energy consumption from night-time DMPS/OLS imagery after correcting for saturation effects. Int. J. Remote Sens. 2010, 31, 4443–4458. [Google Scholar] [CrossRef]
- Katircioglu, S.T.; Feridun, M.; Kilinc, C. Estimating tourism-induced energy consumption and CO2 emissions: The case of Cyprus. Renew. Sustain. Energy Rev. 2014, 29, 634–640. [Google Scholar] [CrossRef]
- Zhao, J.; Chen, Y.; Ji, G.; Wang, Z. Residential carbon dioxide emissions at the urban scale for county-level cities in China: A comparative study of nighttime light data. J. Clean. Prod. 2018, 180, 198–209. [Google Scholar] [CrossRef]
- IPCC. Guidelines for National Greenhouse Gas Inventories; Intergovernmental Panel on Climate Change: Geneva, Switzerland, 2006. [Google Scholar]
- Tapio, P. Towards a theory of decoupling: Degrees of decoupling in the EU and the case of road traffic in Finland between 1970 and 2001. Transp. Policy 2005, 12, 137–151. [Google Scholar] [CrossRef] [Green Version]
- Liu, H.; Cui, W.; Zhang, M. Exploring the causal relationship between urbanization and air pollution: Evidence from China. Sustain. Cities Soc. 2022, 80, 103783. [Google Scholar] [CrossRef]
- Zhang, Y.-J.; Da, Y.-B. The decomposition of energy-related carbon emission and its decoupling with economic growth in China. Renew. Sustain. Energy Rev. 2015, 41, 1255–1266. [Google Scholar] [CrossRef]
- Kaya, Y. Impact of Carbon Dioxide Emission Control on GNP Growth: Interpretation of Proposed Scenarios; Intergovernmental Panel on Climate Change/Response Strategies Working Group: Paris, France, 1990. [Google Scholar]
- Wu, Y.; Chau, K.W.; Lu, W.; Shen, L.; Shuai, C.; Chen, J. Decoupling relationship between economic output and carbon emission in the Chinese construction industry. Environ. Impact Assess. Rev. 2018, 71, 60–69. [Google Scholar] [CrossRef]
- Li, Y.; Wang, X.; Chen, C.; Jing, C.; Wu, T. Exploring firms’ innovation capabilities through learning systems. Neurocomputing 2020, 409, 27–34. [Google Scholar] [CrossRef]
- Wang, Q.; Wang, S. Decoupling economic growth from carbon emissions growth in the United States: The role of research and development. J. Clean. Prod. 2019, 234, 702–713. [Google Scholar] [CrossRef]
- Wang, J.; Wang, C.; Yu, S.; Li, M.; Cheng, Y. Coupling Coordination and Spatiotemporal Evolution between Carbon Emissions, Industrial Structure, and Regional Innovation of Counties in Shandong Province. Sustainability 2022, 14, 7484. [Google Scholar] [CrossRef]
- Chen, Q.; Zha, D.; Wang, L.; Yang, G. The direct CO2 rebound effect in households: Evidence from China’s provinces. Renew. Sustain. Energy Rev. 2022, 155, 111888. [Google Scholar] [CrossRef]
- Motta, S.L.; Santino, D.; Ancona, P.; Weiss, M. CO2 emission accounting for the non-energy use of fossil fuels in Italy: A comparison between NEAT model and the IPCC approaches. Resour. Conserv. Recycl. 2005, 45, 310–330. [Google Scholar] [CrossRef]
- Ogungbile, A.J.; Shen, G.Q.; Wuni, I.Y.; Xue, J.; Hong, J. A Hybrid Framework for Direct CO2 Emissions Quantification in China’s Construction Sector. Int. J. Environ. Res. Public Health 2021, 18, 11965. [Google Scholar] [CrossRef]
- Danish; Zhang, B.; Wang, B.; Wang, Z. Role of renewable energy and non-renewable energy consumption on EKC: Evidence from Pakistan. J. Clean. Prod. 2017, 156, 855–864. [Google Scholar] [CrossRef]
- Huang, L.; Krigsvoll, G.; Johansen, F.; Liu, Y.; Zhang, X. Carbon emission of global construction sector. Renew. Sustain. Energy Rev. 2018, 81, 1906–1916. [Google Scholar] [CrossRef] [Green Version]
- Zhang, X.; Brandt, M.; Tong, X.; Ciais, P.; Yue, Y.; Xiao, X.; Zhang, W.; Wang, K.; Fensholt, R. A large but transient carbon sink from urbanization and rural depopulation in China. Nat. Sustain. 2022, 5, 321–328. [Google Scholar] [CrossRef]


| Types of Energy | Standard Coal Coefficient | Carbon Emission Coefficient | Types of Energy | Standard Coal Coefficient | Carbon Emission Coefficient |
|---|---|---|---|---|---|
| Raw coal | 0.714 | 0.756 | Natural gas | 1.330 | 0.448 |
| Coke | 0.971 | 0.855 | Heating power | 0.034 | 0.670 |
| Crude oil | 1.429 | 0.586 | Electricity | 0.345 | 0.272 |
| Petrol | 1.471 | 0.554 | Finished coal | 0.900 | 0.756 |
| Paraffin | 1.471 | 0.571 | Coke oven gas | 0.614 | 0.355 |
| Diesel | 1.457 | 0.592 | Liquefied petroleum gas | 1.714 | 0.504 |
| Fuel oil | 1.429 | 0.619 | Refinery gas | 1.571 | 0.460 |
| Model Categories | Fitting Equation | p | R2 | Provincial Scale MRE (%) | County Scale MRE (%) |
|---|---|---|---|---|---|
| Linear | Y = 0.058X + 16846.745 | 0.000 | 0.764 | 20.075 | 26.726 |
| Logarithm | Y = 35034.163lnX − 413160.777 | 0.000 | 0.865 | 14.362 | / |
| Quadratic polynomial | Y = 0.152X − 6.618 × 10−8X2 − 13347.298 | 0.000 | 0.877 | 12.788 | 55.265 |
| Power exponent | Y = 0.428X0.875 | 0.000 | 0.856 | 15.190 | 76.165 |
| Exponential | 0.000 | 0.691 | 23.190 | / |
| Carbon Emissions | 2000 | 2005 | 2010 | 2015 | 2020 |
|---|---|---|---|---|---|
| Construction land | 17,320.64 | 42,125.053 | 57,167.141 | 61,531.094 | 79,969.061 |
| Arable land | 436.832 | 432.556 | 432.635 | 427.608 | 422.824 |
| Forest land | −63.781 | −63.761 | −57.94 | −57.944 | −58.182 |
| Grassland | −2.908 | −2.744 | −1.78 | −1.78 | −1.808 |
| Water bodies | −15.175 | −14.701 | −18.252 | −18.331 | −22.518 |
| Unused land | −0.115 | −0.082 | −0.033 | −0.033 | −0.052 |
| Total carbon sinks | −81.979 | −81.289 | −78.005 | −78.088 | −82.560 |
| Total carbon sources | 17,757.472 | 42,557.609 | 57,599.776 | 61,958.702 | 80,391.885 |
| Net carbon emissions | 17,675.493 | 42,476.321 | 57,521.771 | 61,880.614 | 80,309.325 |
| Study Period | ΔLC | ΔCE | T | Decoupling Relationships |
|---|---|---|---|---|
| 2000–2005 | 0.088 | 1.403 | 15.856 | Expansive negative decoupling |
| 2005–2010 | 0.230 | 0.354 | 1.538 | Expansive negative decoupling |
| 2010–2015 | 0.043 | 0.076 | 1.775 | Expansive negative decoupling |
| 2015–2020 | −0.021 | 0.298 | −13.986 | Strong negative decoupling |
| 2000–2020 | 0.367 | 3.544 | 9.664 | Expansive negative decoupling |
| Study Period | |||||||||
|---|---|---|---|---|---|---|---|---|---|
| 2000–2005 | 1.377 | −22.174 | 10.315 | −1.209 | 12.292 | −9.105 | 19.635 | −1.330 | 8.046 |
| 2005–2010 | 2.153 | −5.519 | 2.911 | −0.285 | 2.083 | −2.626 | 0.811 | −2.026 | −2.499 |
| 2010–2015 | 8.830 | −29.486 | 9.927 | −0.338 | 18.843 | −9.589 | 1.055 | −2.157 | −2.917 |
| 2015–2020 | −8.052 | −39.206 | 4.743 | −0.618 | 31.331 | −7.125 | −1.249 | 2.533 | −17.644 |
| 2000–2020 | 2.022 | −16.261 | 6.456 | −0.536 | 9.469 | −5.919 | 5.992 | −1.735 | −0.514 |
Publisher’s Note: MDPI stays neutral with regard to jurisdictional claims in published maps and institutional affiliations. |
© 2022 by the authors. Licensee MDPI, Basel, Switzerland. This article is an open access article distributed under the terms and conditions of the Creative Commons Attribution (CC BY) license (https://creativecommons.org/licenses/by/4.0/).
Share and Cite
Li, M.; Liu, H.; Yu, S.; Wang, J.; Miao, Y.; Wang, C. Estimating the Decoupling between Net Carbon Emissions and Construction Land and Its Driving Factors: Evidence from Shandong Province, China. Int. J. Environ. Res. Public Health 2022, 19, 8910. https://doi.org/10.3390/ijerph19158910
Li M, Liu H, Yu S, Wang J, Miao Y, Wang C. Estimating the Decoupling between Net Carbon Emissions and Construction Land and Its Driving Factors: Evidence from Shandong Province, China. International Journal of Environmental Research and Public Health. 2022; 19(15):8910. https://doi.org/10.3390/ijerph19158910
Chicago/Turabian StyleLi, Mengcheng, Haimeng Liu, Shangkun Yu, Jianshi Wang, Yi Miao, and Chengxin Wang. 2022. "Estimating the Decoupling between Net Carbon Emissions and Construction Land and Its Driving Factors: Evidence from Shandong Province, China" International Journal of Environmental Research and Public Health 19, no. 15: 8910. https://doi.org/10.3390/ijerph19158910
APA StyleLi, M., Liu, H., Yu, S., Wang, J., Miao, Y., & Wang, C. (2022). Estimating the Decoupling between Net Carbon Emissions and Construction Land and Its Driving Factors: Evidence from Shandong Province, China. International Journal of Environmental Research and Public Health, 19(15), 8910. https://doi.org/10.3390/ijerph19158910