
Characterizing Retail Food Environments in Peri-Urban Pakistan during the COVID-19 Pandemic

 , ,
, ,  and
and
Abstract
:1. Introduction
2. Materials and Methods
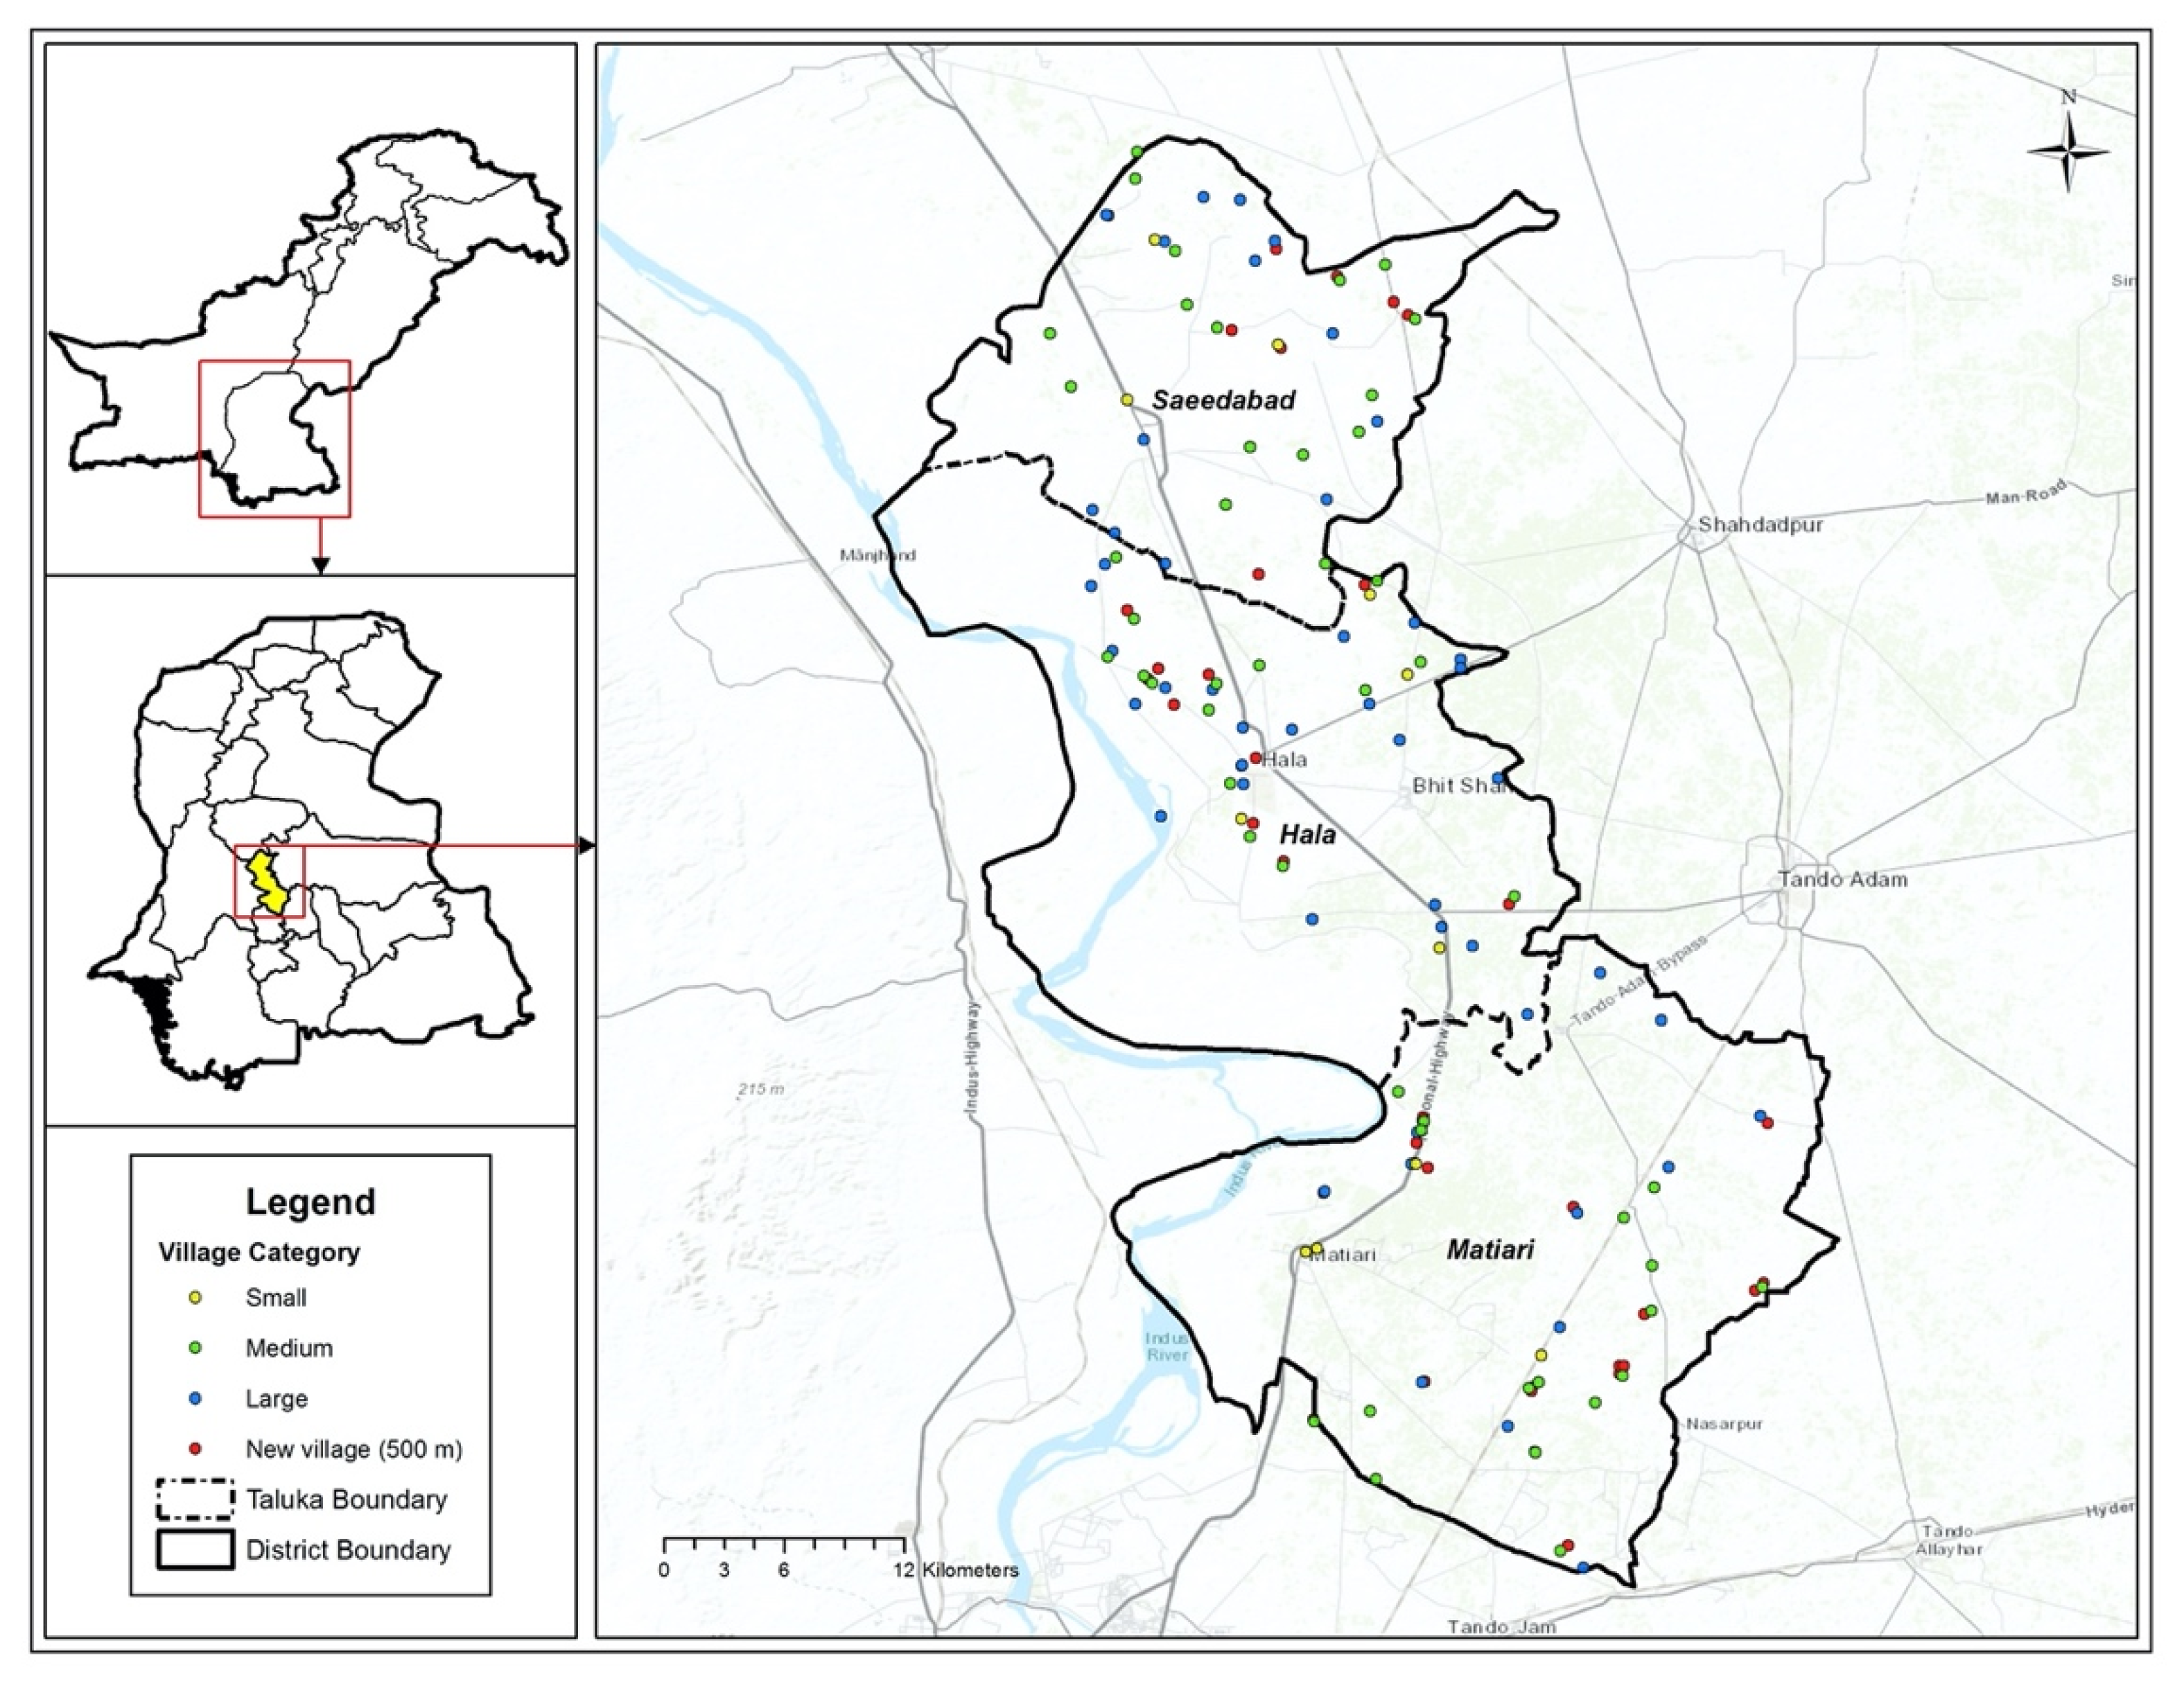
2.1. Study Setting
2.2. Survey Tool Development
- Accessibility measures included days and hours of operation, proximity to schools, and type of food outlet.
- Availability referred to food availability and diversity of certain food and beverage products offered at different retailers (i.e., healthy food options vs. unhealthy food options).
- Promotion referred to food advertising, marketing, and branding, and packaging directed at individuals through various mediums.
2.3. Sampling Strategy
2.4. Statistical Analysis
3. Results
3.1. Accessibility
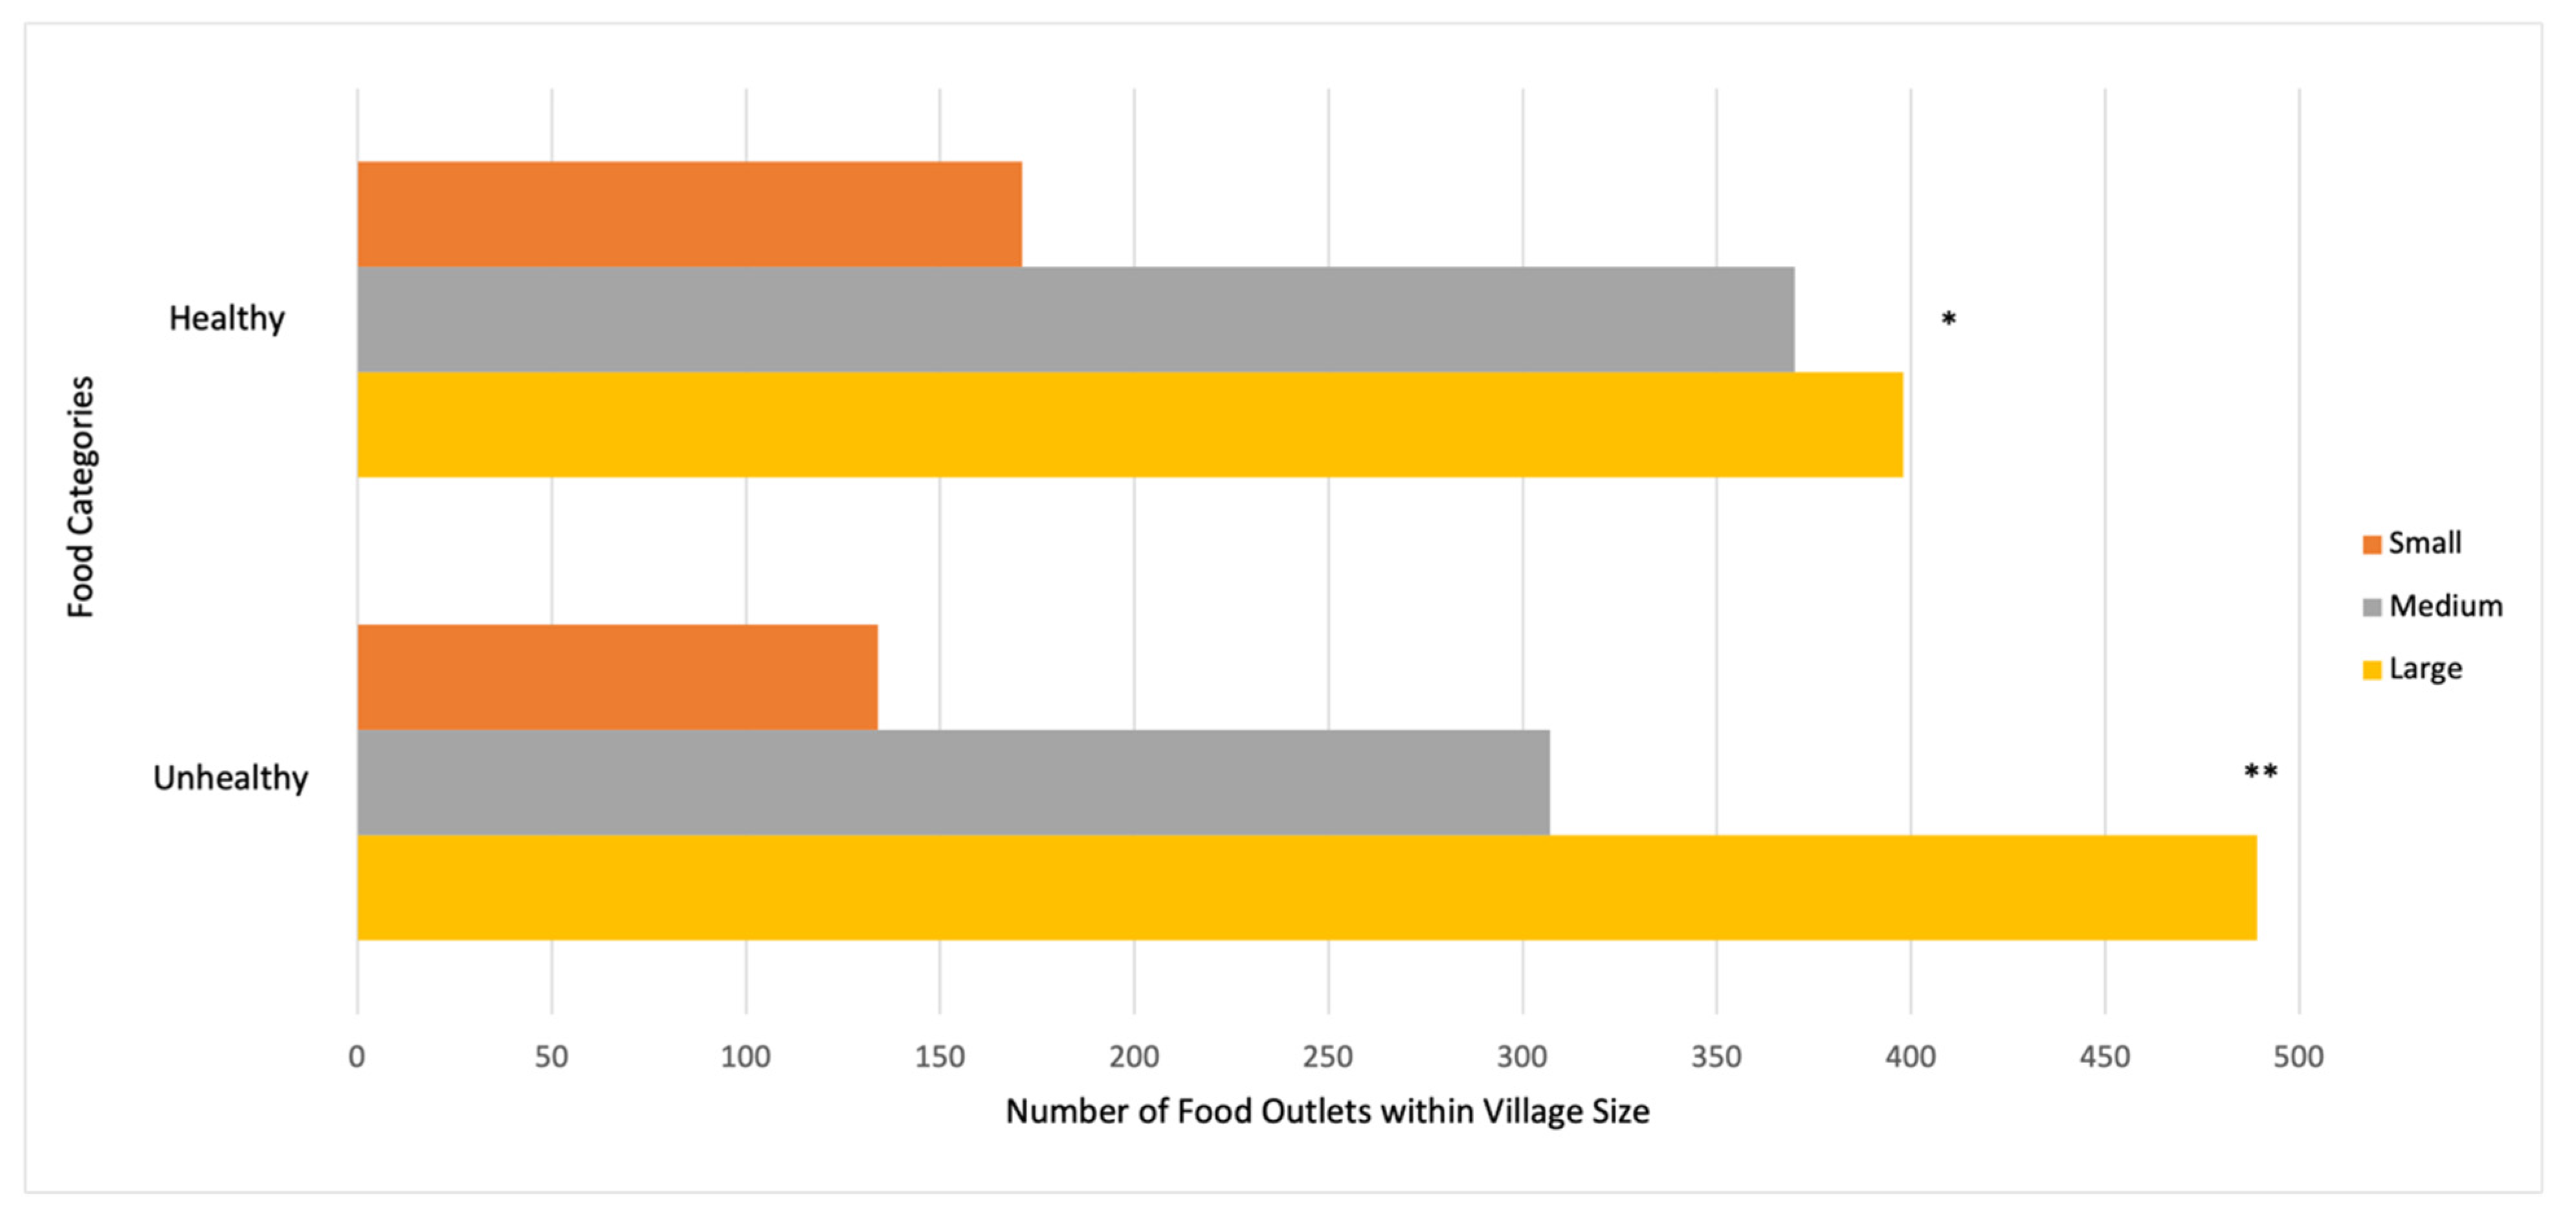
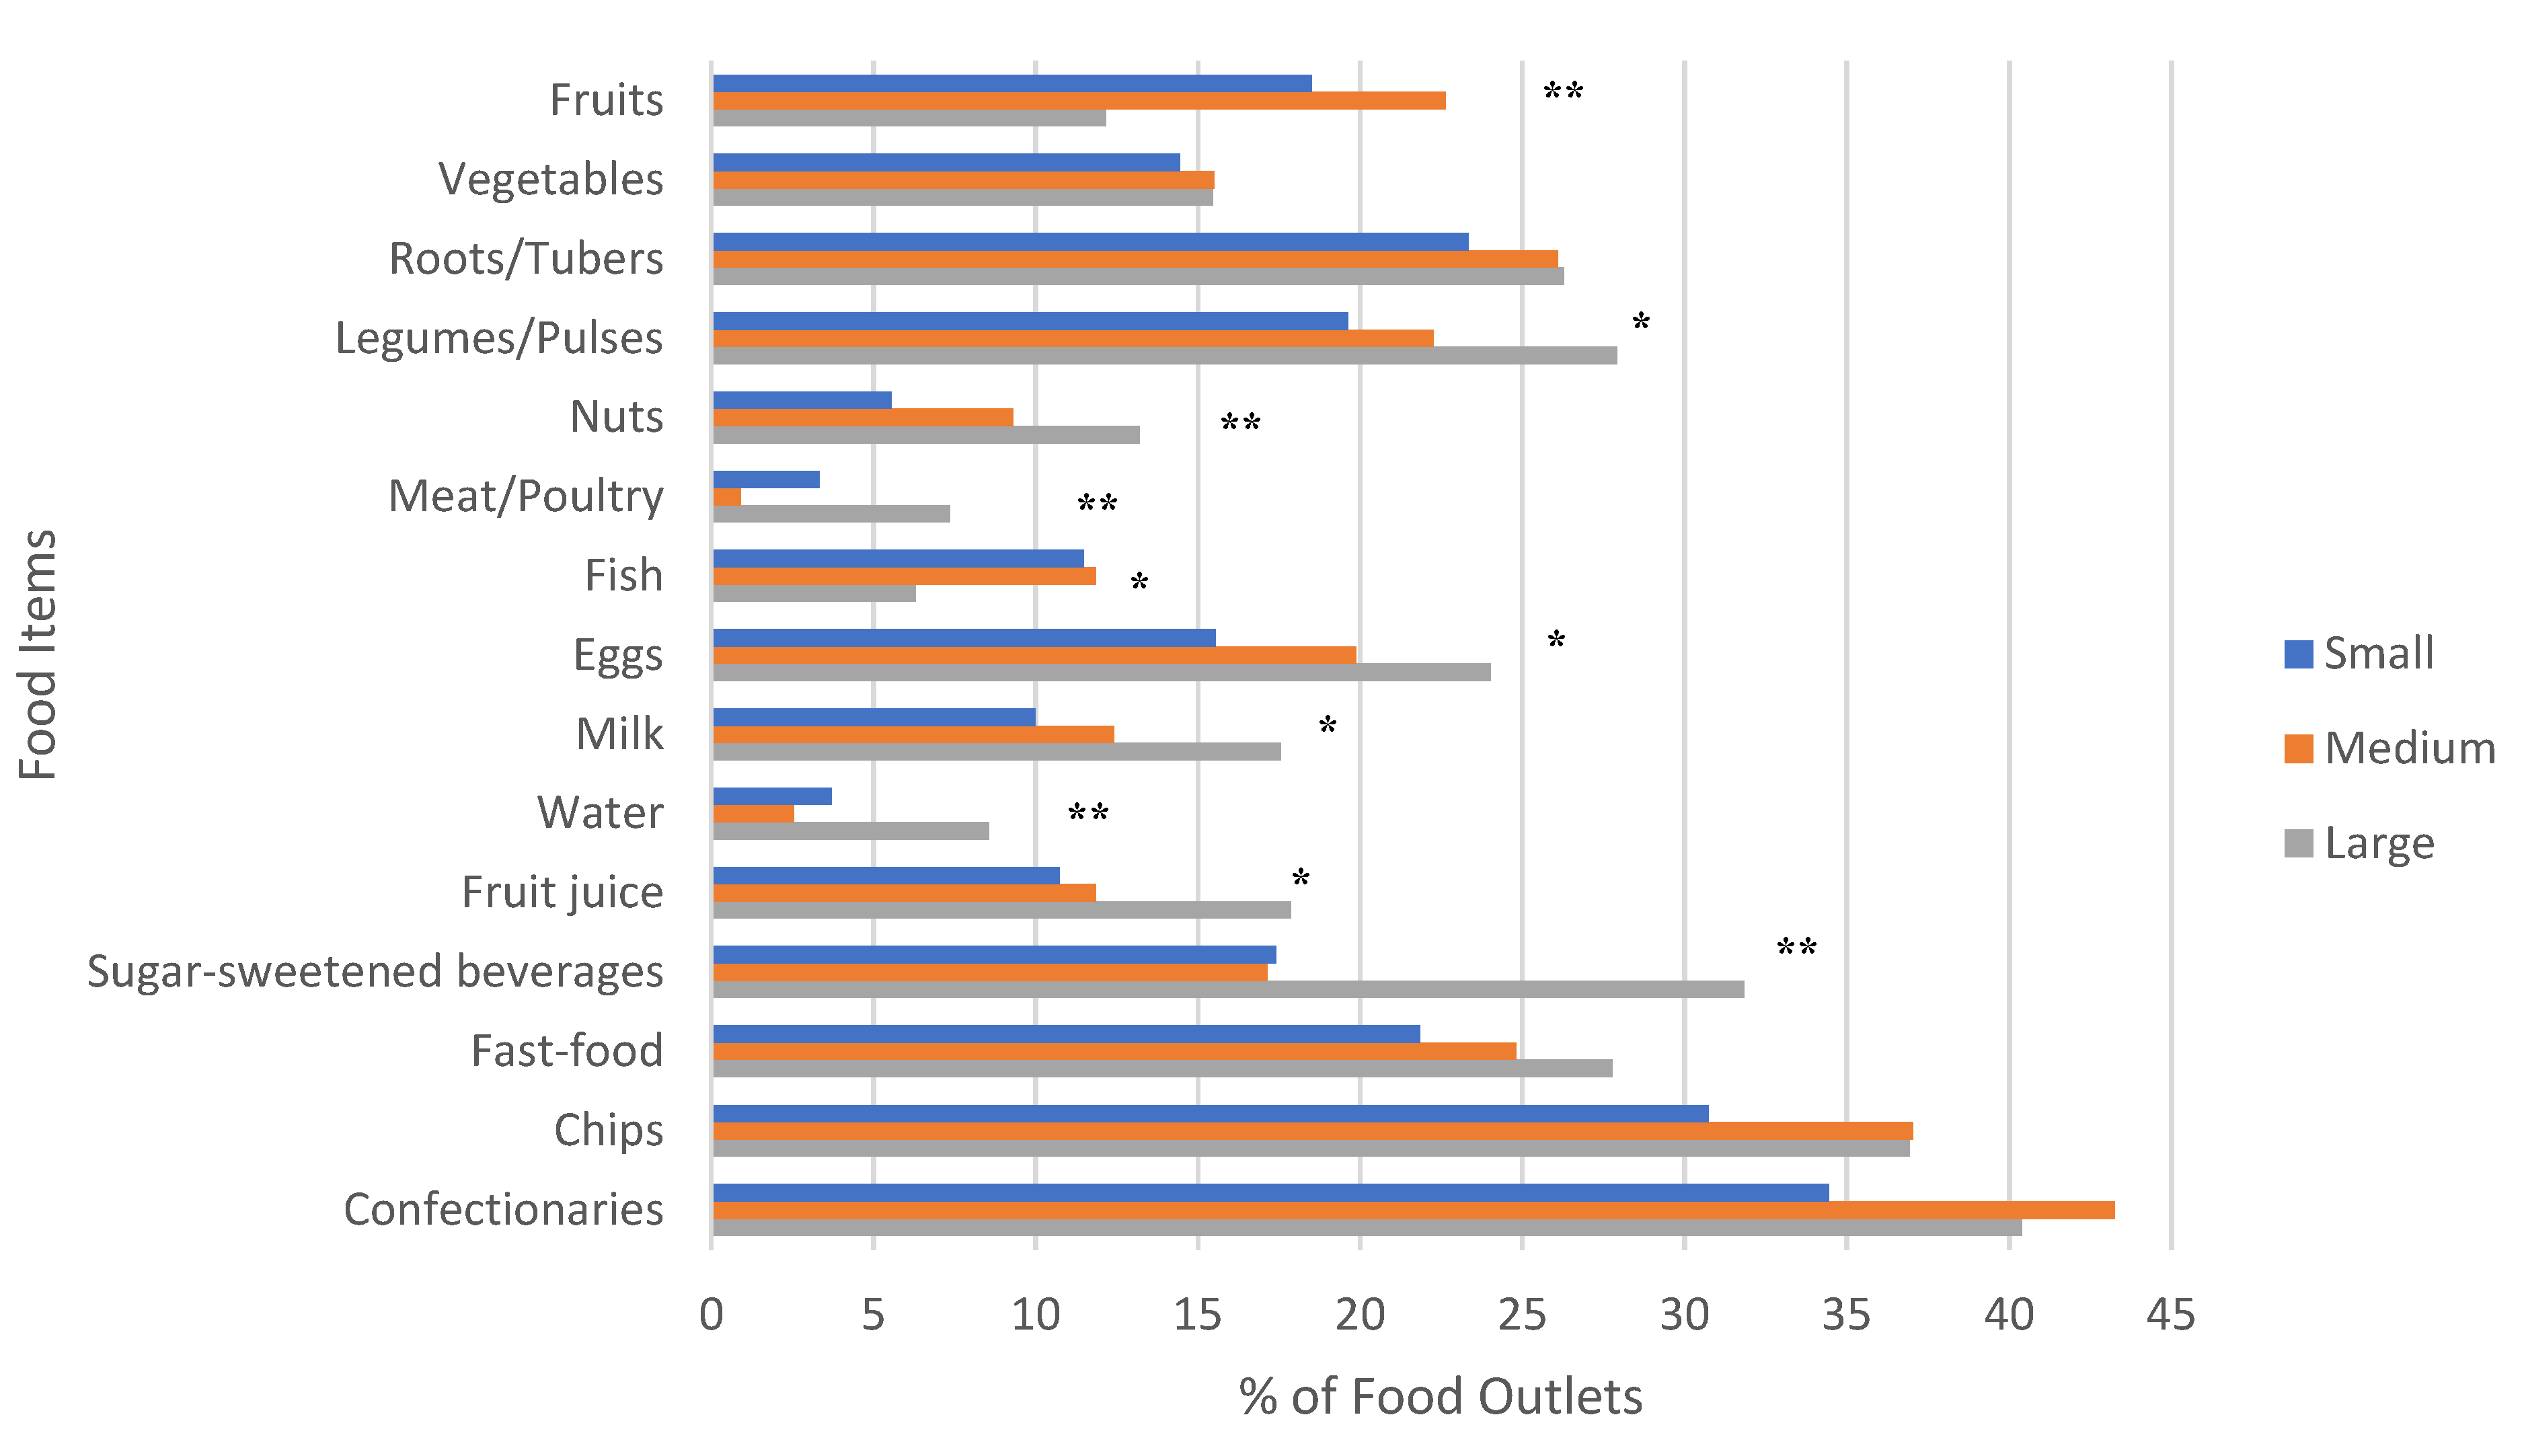
3.2. Availability
3.3. Promotion
4. Discussion
5. Conclusions
Supplementary Materials
Author Contributions
Funding
Institutional Review Board Statement
Informed Consent Statement
Data Availability Statement
Acknowledgments
Conflicts of Interest
References
- Popkin, B.M. Nutrition in transition: The changing global nutrition challenge. Asia Pac. J. Clin. Nutr. 2001, 10, S13–S18. [Google Scholar] [CrossRef] [PubMed]
- Drewnowski, A.; Popkin, B.M. The Nutrition Transition: New Trends in the Global Diet. Nutr. Rev. 1997, 55, 31–43. [Google Scholar] [CrossRef] [PubMed]
- Popkin, B.M. Nutrition, Agriculture and the Global Food System in Low and Middle Income Countries. Food Policy 2014, 47, 91–96. [Google Scholar] [CrossRef] [Green Version]
- Davis, J.N.; Oaks, B.M.; Engle-Stone, R. The Double Burden of Malnutrition: A Systematic Review of Operational Definitions. Curr. Dev. Nutr. 2020, 4, nzaa127. [Google Scholar] [CrossRef]
- Afshin, A.; Sur, P.J.; Fay, K.A.; Cornaby, L.; Ferrara, G.; Salama, J.S.; Mullany, E.C.; Abate, K.H.; Abbafati, C.; Abebe, Z.; et al. Health effects of dietary risks in 195 countries, 1990–2017: A systematic analysis for the Global Burden of Disease Study 2017. Lancet 2019, 393, 1958–1972. [Google Scholar] [CrossRef] [Green Version]
- Headey, D.; Heidkamp, R.; Osendarp, S.; Ruel, M.; Scott, N.; Black, R.; Shekar, M.; Bouis, H.; Flory, A.; Haddad, L.; et al. Impacts of COVID-19 on childhood malnutrition and nutrition-related mortality. Lancet 2020, 396, 519–521. [Google Scholar] [CrossRef]
- Baker, P.; Friel, S. Processed foods and the nutrition transition: Evidence from Asia. Obes. Rev. 2014, 15, 564–577. [Google Scholar] [CrossRef] [Green Version]
- Sachs, J.; Schmidt-Traub, G.; Kroll, C.; Lafortune, G.; Fuller, G. Sustainable Development Report: The Decade of Action for the Sustainable Development Goals; Cambridge University Press: Cambridge, UK, 2021. [Google Scholar]
- Government of Pakistan. National Nutrition Survey 2018: Key Findings Report; Ministry of National Health Services; Government of Pakistan: Islamabad, Pakistan, 2018; Available online: https://www.unicef.org/pakistan/media/1951/file/Final%20Key%20Findings%20Report%202019.pdf (accessed on 5 January 2022).
- Wulan, S.N.; Raza, Q.; Prasmita, H.S.; Martati, E.; Maligan, J.M.; Mageshwari, U.; Fatima, I.; Plasqui, G. Energy Metabolism in Relation to Diet and Physical Activity: A South Asian Perspective. Nutrients 2021, 13, 3776. [Google Scholar] [CrossRef]
- Food and Agriculture Organization. National Agrifood Systems and COVID-19 in Pakistan: Effects, Policy Responses, and Long-Term Implications. 2020. Available online: https://www.fao.org/3/cb1343en/CB1343EN.pdf (accessed on 5 January 2022).
- Committee on World Food Security; Nutrition and Food Systems; FAO. High Level Panel of Experts on Food Security and Nutrition. 2017. Available online: https://www.fao.org/3/i7846e/i7846e.pdf (accessed on 5 January 2022).
- Swinburn, B.; Sacks, G.; Vandevijvere, S.; Kumanyika, S.; Lobstein, T.; Neal, B.; Barquera, S.; Friel, S.; Hawkes, C.; Kelly, B.; et al. INFORMAS (International Network for Food and Obesity/non-communicable diseases Research, Monitoring and Action Support): Overview and key principles. Obes. Rev. 2013, 14 (Suppl. 1), 1–12. [Google Scholar] [CrossRef]
- Turner, C.; Aggarwal, A.; Walls, H.; Herforth, A.; Drewnowski, A.; Coates, J.; Kalamatianou, S.; Kadiyala, S. Concepts and critical perspectives for food environment research: A global framework with implications for action in low- and middle-income countries. Glob. Food Secur. 2018, 18, 93–101. [Google Scholar] [CrossRef]
- Lytle, L.A.; Sokol, R.L. Measures of the food environment: A systematic review of the field, 2007–2015. Health Place 2017, 44, 18–34. [Google Scholar] [CrossRef] [PubMed]
- McKinnon, R.A.; Reedy, J.; Morrissette, M.A.; Lytle, L.A.; Yaroch, A.L. Measures of the Food Environment: A Compilation of the Literature, 1990–2007. Am. J. Prev. Med. 2009, 36 (Suppl. 4), S124–S133. [Google Scholar] [CrossRef] [PubMed]
- Charreire, H.; Casey, R.; Salze, P.; Simon, C.; Chaix, B.; Banos, A.; Badariotti, D.; Weber, C.; Oppert, J.-M. Measuring the food environment using geographical information systems: A methodological review. Public Health Nutr. 2010, 13, 1773–1785. [Google Scholar] [CrossRef] [PubMed]
- Glanz, K.; Sallis, J.F.; Saelens, B.E.; Frank, L.D. Nutrition Environment Measures Survey in Stores (NEMS-S): Development and Evaluation. Am. J. Prev. Med. 2007, 32, 282–289. [Google Scholar] [CrossRef] [PubMed]
- Glanz, K.; Sallis, J.F.; Saelens, B.E.; Frank, L.D. Healthy Nutrition Environments: Concepts and Measures. Am. J. Health Promot. 2005, 19, 330–333. [Google Scholar] [CrossRef]
- Liu, Y.; Song, S.; Gittelsohn, J.; Jiang, N.; Hu, J.; Ma, Y.; Wen, D. Adaptation and Validation of the Chinese Version of the Nutrition Environment Measurement Tool for Stores. Int. J. Environ. Res. Public Health 2019, 16, 782. [Google Scholar] [CrossRef] [Green Version]
- Carducci, B.; Oh, C.; Roth, D.E.; Neufeld, L.M.; Frongillo, E.A.; L’Abbe, M.R.; Fanzo, J.; Herforth, A.; Sellen, D.W.; Bhutta, Z.A. Gaps and priorities in assessment of food environments for children and adolescents in low- and middle-income countries. Nat. Food 2021, 2, 396–403. [Google Scholar] [CrossRef]
- Toure, D.H.A.; Pelto, G.H.; Neufeld, L.M.; Mbuya, M.N.N. An Emergent Framework of the Market Food Environment in Low- and Middle-Income Countries. Curr. Dev. Nutr. 2021, 5, nzab023. [Google Scholar] [CrossRef]
- Turner, C.; Kalamatianou, S.; Drewnowski, A.; Kulkarni, B.; Kinra, S.; Kadiyala, S. Food Environment Research in Low- and Middle-Income Countries: A Systematic Scoping Review. Adv. Nutr. 2020, 11, 387–397. [Google Scholar] [CrossRef]
- Mistry, S.; Puthussery, S. Risk factors of overweight and obesity in childhood and adolescence in South Asian countries: A systematic review of the evidence. Public Health 2015, 129, 200–209. [Google Scholar] [CrossRef]
- Pakistan Bureau of Statistics. Census Results. 2017. Available online: https://www.pbs.gov.pk/sites/default/files//population_census/census_2017_tables/pakistan/Table04n.pdf (accessed on 5 January 2022).
- Intergrated Food Security Phase Classification. IPC Acute Food Security Analysis; Sindh, Pakistan, 2021. Available online: https://www.ipcinfo.org/ipc-country-analysis/details-map/es/c/1154292/?iso3=PAK (accessed on 5 January 2022).
- Golfin, F.; Murillo, C.; Jensen, M.L.; Frongillo, E.A. Adaptation and Validation of the Nutrition Environment Measures Survey in Stores (NEMS-S) in Costa Rica. J. Hunger Environ. Nutr. 2022, 1–13. [Google Scholar] [CrossRef]
- Martins, P.A.; Cremm, E.C.; Leite, F.H.; Maron, L.R.; Scagliusi, F.B.; Oliveira, M.A. Validation of an Adapted Version of the Nutrition Environment Measurement Tool for Stores (NEMS-S) in an Urban Area of Brazil. J. Nutr. Educ. Behav. 2013, 45, 785–792. [Google Scholar] [CrossRef] [PubMed]
- Downs, S.M.; Ahmed, S.; Fanzo, J.; Herforth, A. Food Environment Typology: Advancing an Expanded Definition, Framework, and Methodological Approach for Improved Characterization of Wild, Cultivated, and Built Food Environments toward Sustainable Diets. Foods 2020, 9, 532. [Google Scholar] [CrossRef] [PubMed] [Green Version]
- Baxter, J.-A.; Wasan, Y.; Hussain, A.; Soofi, S.; Ahmed, I.; Bhutta, Z. Characterizing Micronutrient Status and Risk Factors among Late Adolescent and Young Women in Rural Pakistan: A Cross-Sectional Assessment of the MaPPS Trial. Nutrients 2021, 13, 1237. [Google Scholar] [CrossRef] [PubMed]
- Lobstein, T.; Davies, S. Defining and labelling ‘healthy’ and ‘unhealthy’ food. Public Health Nutr. 2009, 12, 331–340. [Google Scholar] [CrossRef] [PubMed] [Green Version]
- World Health Organization. Healthy Diet; World Health Organization: Geneva, Switzerland, 2020; Available online: https://www.who.int/news-room/fact-sheets/detail/healthy-diet (accessed on 25 January 2022).
- Carducci, B.; Keats, E.C.; Ruel, M.; Haddad, L.; Osendarp, S.J.M.; Bhutta, Z.A. Food systems, diets and nutrition in the wake of COVID-19. Nat. Food 2021, 2, 68–70. [Google Scholar] [CrossRef]
- Workie, E.; Mackolil, J.; Nyika, J.; Ramadas, S. Deciphering the impact of COVID-19 pandemic on food security, agriculture, and livelihoods: A review of the evidence from developing countries. Curr. Res. Environ. Sustain. 2020, 2, 100014. [Google Scholar] [CrossRef]
- Nandi, R.; Nedumaran, S.; Ravula, P. The interplay between food market access and farm household dietary diversity in low and middle income countries: A systematic review of literature. Glob. Food Secur. 2021, 28, 100484. [Google Scholar] [CrossRef]
- Ohly, H.C.M.; Read, S.; Frison, S.; Goudet, S. Food Security and Diets in Urban Asia: How Resilient are Food Systems in Times of COVID-19? World Food Programme and Dikoda. 2022. Available online: https://www.wfp.org/publications/food-security-and-diets-urban-asia-how-resilient-are-food-systems-times-covid-19 (accessed on 5 January 2022).
- Reardon, T.; Liverpool-Tasie, L.S.O.; Minten, B. Quiet Revolution by SMEs in the midstream of value chains in developing regions: Wholesale markets, wholesalers, logistics, and processing. Food Secur. 2021, 13, 1577–1594. [Google Scholar] [CrossRef]
- Rasul, G.; Nepal, A.K.; Hussain, A.; Maharjan, A.; Joshi, S.; Lama, A.; Gurung, P.; Ahmad, F.; Mishra, A.; Sharma, E. Socio-Economic Implications of COVID-19 Pandemic in South Asia: Emerging Risks and Growing Challenges. Front. Sociol. 2021, 6, 629693. [Google Scholar] [CrossRef]
- Nordhagen, S.; Igbeka, U.; Rowlands, H.; Shine, R.S.; Heneghan, E.; Tench, J. COVID-19 and small enterprises in the food supply chain: Early impacts and implications for longer-term food system resilience in low- and middle-income countries. World Dev. 2021, 141, 105405. [Google Scholar] [CrossRef]
- Scott, S. Promises and Challenges of the Informal Food Sector in Developing Countries, 1st ed.; FAO: Rome, Italy, 2007; Available online: https://www.fao.org/sustainable-food-value-chains/library/details/fr/c/274002/ (accessed on 5 January 2022).
- Government of Pakistan. National Food Security Policy. Ministry of National Food Security and Research; Government of Pakistan: Islamabad, Pakistan, 2018. Available online: http://www.mnfsr.gov.pk/userfiles1/file/National%20Food%20Security%20Policy%20%202018%20(1).pdf (accessed on 5 January 2022).
- Yamano, T.; Sato, N.; Arif, B.W. The Impact of COVID-19 and Locust Invasion on Farm Households in Punjab and Sindh: Analysis from Cross-Sectional Surveys in Pakistan; Asian Development Bank: Mandaluyong, Philippines, 2021; Available online: https://www.adb.org/sites/default/files/publication/714791/cwwp-010-impact-covid-19-locust-farm-households.pdf (accessed on 5 January 2022).
- Global Alliance for Improved Nutrition. COVID-19 Vendor Survey Factsheet Peshawar, Pakistan. 2021. Available online: https://www.gainhealth.org/sites/default/files/publications/documents/covid-19-vendor-survey-factsheet-markets-peshawar-pakistan.pdf (accessed on 5 January 2022).
- Clapp, J.; Moseley, W.G.; Burlingame, B.; Termine, P. Viewpoint: The case for a six-dimensional food security framework. Food Policy 2021, 106, 102164. [Google Scholar] [CrossRef]
- Durao, S.; Visser, M.E.; Ramokolo, V.; Oliveira, J.M.; Schmidt, B.-M.; Balakrishna, Y.; Brand, A.; Kristjansson, E.; Schoonees, A. Community-level interventions for improving access to food in low- and middle-income countries. Cochrane Database Syst. Rev. 2020, 8, CD011504. [Google Scholar] [CrossRef] [Green Version]
- Karanja, A.; Ickowitz, A.; Stadlmayr, B.; McMullin, S. Understanding drivers of food choice in low- and middle-income countries: A systematic mapping study. Glob. Food Secur. 2022, 32, 100615. [Google Scholar] [CrossRef]
- Bisoffi, S.; Ahrné, L.; Aschemann-Witzel, J.; Báldi, A.; Cuhls, K.; DeClerck, F.; Duncan, J.; Hansen, H.O.; Hudson, R.L.; Kohl, J.; et al. COVID-19 and Sustainable Food Systems: What Should We Learn Before the Next Emergency. Front. Sustain. Food Syst. 2021, 5, 1–14. [Google Scholar] [CrossRef]

| Term | Definition |
|---|---|
| Food outlet | A food outlet includes all establishments where customers can buy food and drinks. These can include corner/convenience stores, fast-food outlets, wet markets, mobile/street/kiosk vendors, and restaurants. |
| Wet market | A wet market is a large outdoor, ‘open-air’ market, where individual vendors might sell fresh fruits and vegetables, as well as meat, fish, and grains. |
| Mobile food/street/kiosk vendor | A mobile food vendor, street vendor, or kiosk is usually run out of a motorized vehicles or non-motorized cart. These sorts of establishments are primarily engaged in preparing and serving meals and snacks for immediate consumption, like a specialty snack, such as pakoras, bun kebobs, or crisps; or serving non-alcoholic beverages, such as coffee, juices, or sodas. Consumption of the food or drink would usually happen at the vendor’s spot or nearby. |
| Small retailers | A corner or convenience store is a small store that sells some staple foods and a limited range of household goods. |
| Fast-food service | A fast-food outlet is usually a food retail shop with a limited menu that offers precooked or quickly prepared foods. In these shops, customers generally order or select items and pay before eating. Food and drink may be consumed on premises, taken out, or delivered to customers’ location. |
| Formal food service | Formal food service are outlets where people pay to sit and eat a meal that has been cooked on the premises and served to them (i.e., restaurants and cafes). Customers will usually order food while seated from a server and pay after eating. Sometimes restaurants may provide take away service. |
| Strata | Description | Population | Number of Villages | Number of People Per Village | % Food Insecure | Distribution of Villages (Per Strata) |
|---|---|---|---|---|---|---|
| 1 | Small villages (<25% of population) | 3362 | 144 | 58 | 30% | 55 |
| 2 | Medium villages (25–75% of population) | 60376 | 295 | 59–490 | 27% | 113 |
| 3 | Large villages (>75% of population) | 281708 | 146 | >490 | 29% | 56 |
| Total | 345446 | 585 | ||||
| Sample | 224 |
| Accessibility | ||||
|---|---|---|---|---|
| Small | Medium | Large | p | |
| Food Outlets in Village Catchment n (%) | <0.001 | |||
| Mobile vendors (n = 560) | 129 (47.8) | 247 (45.1) | 184 (27.6) | |
| Corner stores (n = 517) | 74 (27.4) | 203 (37.0) | 240 (36.0) | |
| Specialized food (n = 244) | 38 (14.1) | 68 (12.4) | 138 (20.7) | |
| Fast-food (n = 109) | 16 (5.9) | 21 (3.8) | 72 (10.8) | |
| Restaurants (n= 49) | 11 (4.1) | 7 (1.3) | 31 (4.6) | |
| Other (n = 5) | 2 (0.7) | 2 (0.4) | 1 (0.2) | |
| Total (n = 1484) | 270 | 548 | 666 | |
| Proximity to schools n (%) | <0.001 | |||
| Walking distance < 5 min | 57 (21.1) | 143 (26.1) | 251 (37.7) | |
| Walking distance > 5 min | 83 (30.7) | 136 (24.8) | 256 (38.4) | |
| Walking distance > 10 min | 30 (11.1) | 44 (8.0) | 108 (16.2) | |
| Other (outside of school) | 100 (37.0) | 225 (41.1) | 51(7.7) | |
| Hours of operation n (%) | <0.001 | |||
| All hours | 2 (0.7) | 4 (0.7) | 1 (0.2) | |
| Morning (7 a.m.–10 a.m.) | 178 (65.9) | 361 (65.9) | 564 (84.7) | |
| Afternoon (12 p.m.–4 p.m.) | 51(18.9) | 75 (13.7) | 42 (6.3) | |
| Evening (4 p.m.–close) | 3 (1.1) | 7 (1.3) | 31(4.7) | |
| No fixed time | 36 (13.3) | 101 (18.4) | 28 (4.2) | |
| Days of operation n (%) | <0.001 | |||
| All days | 152 (56.3) | 308 (56.2) | 548 (82.3) | |
| Weekdays | 0 | 2 (0.4) | 4 (0.6) | |
| Weekends | 0 | 1 (0.2) | 2 (0.3) | |
| Other a | 118 (43.7) | 237 (43.2) | 112 (16.8) | |
| Availability | ||||
| Mean number of healthy food group items (SD) | 1.2 (1.4) | 1.4 (1.5) | 1.5 (1.8) | <0.052 |
| Mean number of unhealthy food group items (SD) | 1.2 (1.5) | 1.3 (1.5) | 1.6 (1.4) | <0.001 |
| Mean number of total food group items (SD) | 2.6 (2.4) | 2.9 (2.6) | 3.2 (2.8) | <0.006 |
| Type of Food Outlet | |||||
|---|---|---|---|---|---|
| Type of Food n (%) | Mobile Vendors (n = 560) | Corner Stores (n = 517) | Specialized Food (n = 244) | Fast-Food (n = 109) | Restaurants (n = 49) |
| Fruits | 197 (35.2) | 51 (9.9) | 2 (0.8) | 3 (2.8) | 1 (2.0) |
| Vegetables | 86 (15.4) | 106 (20.5) | 3 (1.2) | 3 (2.8) | 29 (59.8) |
| Roots/Tubers | 85 (15.2) | 261 (50.5) | 3 (1.2) | 6 (5.5) | 26 (53.1) |
| Legumes/Pulses | 4 (0.7) | 316 (61.1) | 0 | 2 (1.8) | 39 (79.6) |
| Nuts | 6 (1.1) | 147 (28.4) | 0 | 1 (0.9) | 0 |
| Meat/Poultry | 1 (0.2) | 0 | 38 (15.6) | 5 (4.6) | 19 (38.8) |
| Fish | 22 (3.9) | 0 | 113 (46.3) | 1 (0.9) | 2 (4.1) |
| Eggs | 1 (0.2) | 282 (54.5) | 1 (0.4) | 4 (3.7) | 23 (46.9) |
| Milk | 0 | 182 (35.2) | 11 (4.5) | 2 (1.8) | 17 (34.7) |
| Water | 1 (0.2) | 63 (12.2) | 2 (0.8) | 5 (4.6) | 10 (20.4) |
| Fruit juice | 0 | 187 (36.2) | 5 (2.0) | 9 (8.3) | 12 (24.5) |
| Sugar-sweetened beverages | 0 | 238 (46.0) | 75 (30.7) | 12 (11.0) | 28 (57.1) |
| Fast-food | 140 (25.0) | 122 (23.6) | 2 (0.8) | 107 (98.2) | 8 (16.3) |
| Chips | 17 (3.0) | 493 (95.4) | 3 (1.2) | 4 (3.7) | 13 (26.5) |
| Confectionaries | 57 (10.2) | 499 (96.5) | 7 (2.9) | 20 (18.3) | 14 (28.6) |
| Proximity to schools n (%) | |||||
| Outside of school | 217 (38.8) | 106 (20.5) | 42 (17.2) | 5 (4.6) | 2 (4.1) |
| Walking distance < 5 min | 102 (18.2) | 226 (43.7) | 71 (29.1) | 39 (35.8) | 13 (26.5) |
| Walking distance > 5 min | 193 (34.4) | 125 (24.2) | 86 (35.2) | 43 (39.4) | 24 (49.0) |
| Walking distance > 10 min | 46 (8.2) | 59 (11.4) | 45 (18.4) | 22 (20.2) | 10 (20.4) |
Publisher’s Note: MDPI stays neutral with regard to jurisdictional claims in published maps and institutional affiliations. |
© 2022 by the authors. Licensee MDPI, Basel, Switzerland. This article is an open access article distributed under the terms and conditions of the Creative Commons Attribution (CC BY) license (https://creativecommons.org/licenses/by/4.0/).
Share and Cite
Carducci, B.; Wasan, Y.; Shakeel, A.; Hussain, A.; Baxter, J.-A.B.; Rizvi, A.; Soofi, S.B.; Bhutta, Z.A. Characterizing Retail Food Environments in Peri-Urban Pakistan during the COVID-19 Pandemic. Int. J. Environ. Res. Public Health 2022, 19, 8614. https://doi.org/10.3390/ijerph19148614
Carducci B, Wasan Y, Shakeel A, Hussain A, Baxter J-AB, Rizvi A, Soofi SB, Bhutta ZA. Characterizing Retail Food Environments in Peri-Urban Pakistan during the COVID-19 Pandemic. International Journal of Environmental Research and Public Health. 2022; 19(14):8614. https://doi.org/10.3390/ijerph19148614
Chicago/Turabian StyleCarducci, Bianca, Yaqub Wasan, Agha Shakeel, Amjad Hussain, Jo-Anna B. Baxter, Arjumand Rizvi, Sajid B. Soofi, and Zulfiqar A. Bhutta. 2022. "Characterizing Retail Food Environments in Peri-Urban Pakistan during the COVID-19 Pandemic" International Journal of Environmental Research and Public Health 19, no. 14: 8614. https://doi.org/10.3390/ijerph19148614
APA StyleCarducci, B., Wasan, Y., Shakeel, A., Hussain, A., Baxter, J.-A. B., Rizvi, A., Soofi, S. B., & Bhutta, Z. A. (2022). Characterizing Retail Food Environments in Peri-Urban Pakistan during the COVID-19 Pandemic. International Journal of Environmental Research and Public Health, 19(14), 8614. https://doi.org/10.3390/ijerph19148614