
The Geographic Context of Racial Disparities in Aggressive Endometrial Cancer Subtypes: Integrating Social and Environmental Aspects to Discern Biological Outcomes

 , , ,
, , ,
Abstract
:1. Introduction
2. Materials and Methods
2.1. Study Population
2.2. Demographic Characteristics
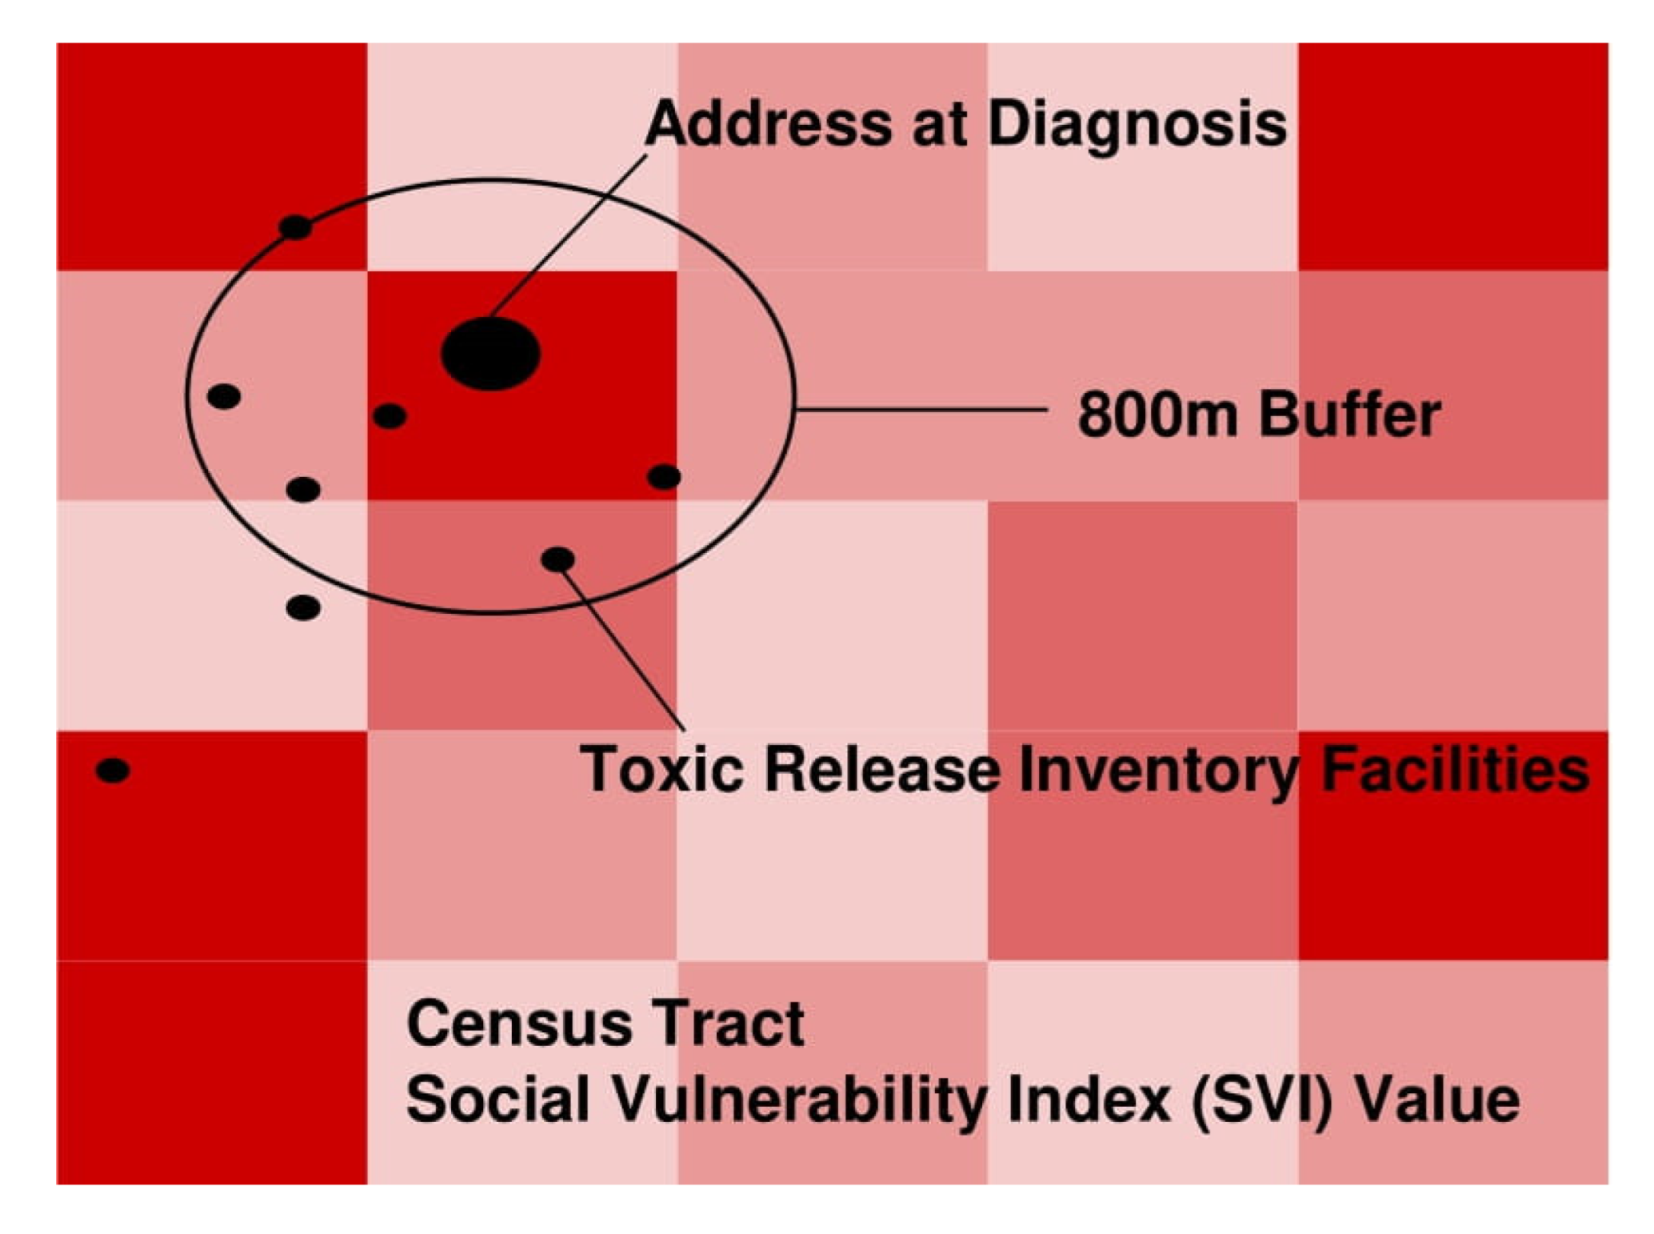
2.3. Geospatial Analyses
2.4. Statistical Analysis
3. Results
4. Discussion
5. Limitations
6. Conclusions
Supplementary Materials
Author Contributions
Funding
Institutional Review Board Statement
Informed Consent Statement
Data Availability Statement
Acknowledgments
Conflicts of Interest
References
- Siegel, R.; Naishadham, D.; Jemal, A. Cancer statistics, 2013. CA Cancer J. Clin. 2013, 63, 11–30. [Google Scholar] [CrossRef] [PubMed] [Green Version]
- Gaber, C.; Meza, R.; Ruterbusch, J.J.; Cote, M.L. Endometrial Cancer Trends by Race and Histology in the USA: Projecting the Number of New Cases from 2015 to 2040. J. Racial Ethn. Health Dispar. 2016, 4, 895–903. [Google Scholar] [CrossRef] [PubMed]
- Cote, M.L.; Ruterbusch, J.J.; Olson, S.H.; Lu, K.; Ali-Fehmi, R. The Growing Burden of Endometrial Cancer: A Major Racial Disparity Affecting Black Women. Cancer Epidemiol. Biomark. Prev. 2015, 24, 1407–1415. [Google Scholar] [CrossRef] [PubMed] [Green Version]
- Barrett, R.J., 2nd; Harlan, L.C.; Wesley, M.N.; Hill, H.A.; Chen, V.W.; Clayton, L.A.; Kotz, H.L.; Eley, J.W.; Robboy, S.J.; Edwards, B.K. Endometrial cancer: Stage at diagnosis and associated factors in black and white patients. Am. J. Obstet. Gynecol. 1995, 173, 414–422, discussion 422-3. [Google Scholar] [CrossRef]
- Hill, H.A.; Coates, R.J.; Austin, H.; Correa, P.; Robboy, S.J.; Chen, V.; Click, L.A.; Barrett, R.J., 2nd; Boyce, J.G.; Kotz, H.L.; et al. Racial differences in tumor grade among women with endometrial cancer. Gynecol. Oncol. 1995, 56, 154–163. [Google Scholar] [CrossRef]
- Javadian, P.; Washington, C.; Mukasa, S.; Benbrook, D.M. Histopathologic, Genetic and Molecular Characterization of Endometrial Cancer Racial Disparity. Cancers 2021, 13, 1900. [Google Scholar] [CrossRef]
- Clarke, M.A.; Devesa, S.S.; Harvey, S.V.; Wentzensen, N. Hysterectomy-Corrected Uterine Corpus Cancer Incidence Trends and Differences in Relative Survival Reveal Racial Disparities and Rising Rates of Nonendometrioid Cancers. J. Clin. Oncol. 2019, 37, 1895–1908. [Google Scholar] [CrossRef]
- Cote, M.L.; Alhajj, T.; Ruterbusch, J.J.; Bernstein, L.; Brinton, L.A.; Blot, W.J.; Chen, C.; Gass, M.; Gaussoin, S.; Henderson, B.; et al. Risk factors for endometrial cancer in black and white women: A pooled analysis from the Epidemiology of Endometrial Cancer Consortium (E2C2). Cancer Causes Control 2015, 26, 287–296. [Google Scholar] [CrossRef] [Green Version]
- Sherman, M.E.; Devesa, S.S. Analysis of racial differences in incidence, survival, and mortality for malignant tumors of the uterine corpus. Cancer 2003, 98, 176–186. [Google Scholar] [CrossRef]
- White, M.C.; Holman, D.M.; Boehm, J.E.; Peipins, L.A.; Grossman, M.; Henley, S.J. Age and cancer risk: A potentially modifiable relationship. Am. J. Prev. Med. 2014, 46, S7–S15. [Google Scholar] [CrossRef] [Green Version]
- Grandi, G.; Perrone, A.M.; Chiossi, G.; Friso, S.; Toss, A.; Sammarini, M.; Facchinetti, F.; Botticelli, L.; Palma, F.; De Iaco, P. Increasing BMI is associated with both endometrioid and serous histotypes among endometrial rather than ovarian cancers: A case-to-case study. Gynecol. Oncol. 2019, 154, 163–168. [Google Scholar] [CrossRef] [PubMed]
- Setiawan, V.W.; Pike, M.C.; Kolonel, L.N.; Nomura, A.M.; Goodman, M.T.; Henderson, B.E. Racial/ethnic differences in endometrial cancer risk: The multiethnic cohort study. Am. J. Epidemiol. 2007, 165, 262–270. [Google Scholar] [CrossRef] [PubMed] [Green Version]
- Williams, D.R. Race, socioeconomic status, and health. The added effects of racism and discrimination. Ann. N. Y. Acad. Sci. 1999, 896, 173–186. [Google Scholar] [CrossRef] [PubMed]
- Doll, K.M.; Snyder, C.R.; Ford, C.L. Endometrial cancer disparities: A race-conscious critique of the literature. Am. J. Obstet. Gynecol. 2018, 218, 474–482 e2. [Google Scholar] [CrossRef] [PubMed]
- Link, B.G.; Phelan, J. Social conditions as fundamental causes of disease. J. Health Soc. Behav. 1995, 35, 80–94. [Google Scholar] [CrossRef] [Green Version]
- Dolinoy, D.C.; Miranda, M.L. GIS modeling of air toxics releases from TRI-reporting and non-TRI-reporting facilities: Impacts for environmental justice. Environ. Health Perspect. 2004, 112, 1717–1724. [Google Scholar] [CrossRef] [Green Version]
- Morello-Frosch, R.; Pastor, M.; Sadd, J. Environmental justice and Southern California’s “riskscape” the distribution of air toxics exposures and health risks among diverse communities. Urban Aff. Rev. 2001, 36, 551–578. [Google Scholar] [CrossRef]
- Kirby, R.S.; Delmelle, E.; Eberth, J.M. Advances in spatial epidemiology and geographic information systems. Ann. Epidemiol. 2017, 27, 1–9. [Google Scholar]
- Sahar, L.; Foster, S.L.; Sherman, R.L.; Henry, K.A.; Goldberg, D.W.; Stinchcomb, D.G.; Bauer, J.E. GIScience and cancer: State of the art and trends for cancer surveillance and epidemiology. Cancer 2019, 125, 2544–2560. [Google Scholar] [CrossRef]
- Gordon, J.; Blackburn, P.; Watson, C.; Ulm, M.; Daily, L.; Elnaggar, A.; Tillmanns, T. Geographic information system (GIS) analysis of food deserts in the southern United States and endometrial cancer recurrence. Gynecol. Oncol. 2018, 149, 139. [Google Scholar] [CrossRef]
- NIH. Cancel Control Continuum; NIH: Bethesda, MD, USA, 2020.
- Saini, G.; Ogden, A.; McCullough, L.E.; Torres, M.; Rida, P.; Aneja, R. Disadvantaged neighborhoods and racial disparity in breast cancer outcomes: The biological link. Cancer Causes Control 2019, 30, 677–686. [Google Scholar] [PubMed]
- EPA. TRI Basic Data Files: Calendar Years 1987-Present. 2021. Available online: https://www.epa.gov/toxics-release-inventory-tri-program/tri-basic-data-files-calendar-years-1987-present (accessed on 19 January 2022).
- Flanagan, B.E.; Hallisey, E.J.; Adams, E.; Lavery, A. Measuring Community Vulnerability to Natural and Anthropogenic Hazards: The Centers for Disease Control and Prevention’s Social Vulnerability Index. J. Environ. Health 2018, 80, 34–36. [Google Scholar]
- CDC. Centers for Disease Control and Prevention/Agency for Toxic sSubstances and Disease Registry/Geospatial Research, Analysis, and Services Program. CDC/ATSDR Social Vulnerability Index Database [Ohio]. 2018. Available online: https://www.atsdr.cdc.gov/placeandhealth/svi/data_documentation_download.html (accessed on 19 January 2022).
- Hanchette, C.; Zhang, C.H.; Schwartz, G.G. Ovarian Cancer Incidence in the U.S. and Toxic Emissions from Pulp and Paper Plants: A Geospatial Analysis. Int. J. Environ. Res. Public Health 2018, 15, 1619. [Google Scholar] [CrossRef] [Green Version]
- McKeon, T.P.; Hwang, W.T.; Ding, Z.; Tam, V.; Wileyto, P.; Glanz, K.; Penning, T.M. Environmental exposomics and lung cancer risk assessment in the Philadelphia metropolitan area using ZIP code-level hazard indices. Environ. Sci. Pollut. Res. Int. 2021, 28, 31758–31769. [Google Scholar] [PubMed]
- Bulka, C.; Nastoupil, L.J.; McClellan, W.; Ambinder, A.; Phillips, A.; Ward, K.; Bayakly, A.R.; Switchenko, J.M.; Waller, L.; Flowers, C.R. Residence proximity to benzene release sites is associated with increased incidence of non-Hodgkin lymphoma. Cancer 2013, 119, 3309–3317. [Google Scholar] [CrossRef] [Green Version]
- Boer, J.T.; Pastor, M.; Sadd, J.L.; Snyder, L.D. Is there environmental racism? The demographics of hazardous waste in Los Angeles County. Soc. Sci. Q. 1997, 78, 793810. [Google Scholar]
- Abbas, A.; Madison Hyer, J.; Pawlik, T.M. Race/Ethnicity and County-Level Social Vulnerability Impact Hospice Utilization Among Patients Undergoing Cancer Surgery. Ann. Surg. Oncol. 2021, 28, 1918–1926. [Google Scholar] [CrossRef]
- Diaz, A.; Dalmacy, D.; Hyer, J.M.; Tsilimigras, D.; Pawlik, T.M. Intersection of social vulnerability and residential diversity: Postoperative outcomes following resection of lung and colon cancer. J. Surg. Oncol. 2021, 124, 886–893. [Google Scholar] [CrossRef]
- Anselin, L. Local Indicators of Spatial Association—LISA. Geogr. Anal. 1995, 27, 93–115. [Google Scholar] [CrossRef]
- Ord, J.K.; Getis, A. Local Spatial Autocorrelaation Statistics: Distributional Issues and an Application. Geogr. Anal. 1995, 27, 286–306. [Google Scholar] [CrossRef]
- Curtis, A.; Ajayakumar, J.; Curtis, J.; Mihalik, S.; Purohit, M.; Scott, Z.; Muisyo, J.; Labadorf, J.; Vijitakula, S.; Yax, J.; et al. Geographic monitoring for early disease detection (GeoMEDD). Sci. Rep. 2020, 10, 21753. [Google Scholar] [CrossRef] [PubMed]
- ESRI (Environmental Systems Research Institute). ArcMap, 10.x; ESRI: Redlands, CA, USA, 2021. [Google Scholar]
- Clough, L.; Bayakly, A.R.; Ward, K.C.; Khan, M.K.; Chen, S.C.; Lechowicz, M.J.; Flowers, C.R.; Allen, P.B.; Switchenko, J.M. Clustering of cutaneous T-cell lymphoma is associated with increased levels of the environmental toxins benzene and trichloroethylene in the state of Georgia. Cancer 2020, 126, 1700–1707. [Google Scholar] [CrossRef] [PubMed]
- Fan, Q.; Yao, X.A.; Han, X. Spatial variation and disparity in female breast cancer relative survival in the United States. Cancer 2021, 127, 4006–4014. [Google Scholar] [CrossRef] [PubMed]
- Waller, L.G.C. Applied Spatial Statistics for Public Health Data; John Wiley & Sons, Inc.: New York, NY, USA, 2004. [Google Scholar]
- Hjalmars, U.; Kulldorff, M.; Wahlqvist, Y.; Lannering, B. Increased incidence rates but no space-time clustering of childhood astrocytoma in Sweden, 1973–1992: A population-based study of pediatric brain tumors. Cancer 1999, 85, 2077–2090. [Google Scholar]
- Austin, S.B.; Melly, S.J.; Sanchez, B.N.; Patel, A.; Buka, S.; Gortmaker, S.L. Clustering of fast-food restaurants around schools: A novel application of spatial statistics to the study of food environments. Am. J. Public Health 2005, 95, 1575–1581. [Google Scholar] [CrossRef]
- Timperio, A.; Jeffery, R.W.; Crawford, D.; Roberts, R.; Giles-Corti, B.; Ball, K. Neighbourhood physical activity environments and adiposity in children and mothers: A three-year longitudinal study. Int. J. Behav. Nutr. Phys. Act. 2010, 7, 18. [Google Scholar] [CrossRef] [Green Version]
- Hyer, J.M.; Tsilimigras, D.I.; Diaz, A.; Mirdad, R.S.; Azap, R.A.; Cloyd, J.; Dillhoff, M.; Ejaz, A.; Tsung, A.; Pawlik, T.M. High Social Vulnerability and “Textbook Outcomes” after Cancer Operation. J. Am. Coll. Surg. 2021, 232, 351–359. [Google Scholar] [CrossRef]
- Mock, J.; Meyer, C.; Mau, L.W.; Nguyen, C.; Arora, P.; Heron, C.; Balkrishnan, R.; Burns, L.; Devine, S.; Ballen, K. Barriers to Access to Hematopoietic Cell Transplantation among Patients with Acute Myeloid Leukemia in Virginia. Transpl. Cell Ther. 2021, 27, 869 e1–869 e9. [Google Scholar] [CrossRef]
- Azap, R.A.; Diaz, A.; Hyer, J.M.; Tsilimigras, D.I.; Mirdad, R.S.; Ejaz, A.; Pawlik, T.M. Impact of Race/Ethnicity and County-Level Vulnerability on Receipt of Surgery Among Older Medicare Beneficiaries With the Diagnosis of Early Pancreatic Cancer. Ann. Surg. Oncol. 2021, 28, 6309–6316. [Google Scholar]
- Rebbeck, T.R.; Burns-White, K.; Chan, A.T.; Emmons, K.; Freedman, M.; Hunter, D.J.; Kraft, P.; Laden, F.; Mucci, L.; Parmigiani, G.; et al. Precision Prevention and Early Detection of Cancer: Fundamental Principles. Cancer Discov. 2018, 8, 803–811. [Google Scholar] [CrossRef] [Green Version]
- Lynch, S.M.; Handorf, E.; Sorice, K.A.; Blackman, E.; Bealin, L.; Giri, V.N.; Obeid, E.; Ragin, C.; Daly, M. The effect of neighborhood social environment on prostate cancer development in black and white men at high risk for prostate cancer. PLoS ONE 2020, 15, e0237332. [Google Scholar] [CrossRef]
- Lynch, S.M.; Wiese, D.; Ortiz, A.; Sorice, K.A.; Nguyen, M.; Gonzalez, E.T.; Henry, K.A. Towards precision public health: Geospatial analytics and sensitivity/specificity assessments to inform liver cancer prevention. SSM Popul. Health 2020, 12, 100640. [Google Scholar] [CrossRef] [PubMed]
- McIntire, R.K.; Keith, S.W.; Boamah, M.; Leader, A.E.; Glanz, K.; Klassen, A.C.; Zeigler-Johnson, C.M. A Prostate Cancer Composite Score to Identify High Burden Neighborhoods. Prev. Med. 2018, 112, 47–53. [Google Scholar] [CrossRef] [PubMed]
- Powell-Wiley, T.M.; Baumer, Y.; Baah, F.O.; Baez, A.S.; Farmer, N.; Mahlobo, C.T.; Pita, M.A.; Potharaju, K.A.; Tamura, K.; Wallen, G.R. Social Determinants of Cardiovascular Disease. Circ. Res. 2022, 130, 782–799. [Google Scholar] [CrossRef] [PubMed]
- Hooten, N.N.; Pacheco, N.L.; Smith, J.T.; Evans, M.K. The accelerated aging phenotype: The role of race and social determinants of health on aging. Ageing Res. Rev. 2022, 73, 101536. [Google Scholar] [CrossRef]
- Iyer, H.S.; Hart, J.E.; James, P.; Elliott, E.G.; DeVille, N.V.; Holmes, M.D.; De Vivo, I.; Mucci, L.A.; Laden, F.; Rebbeck, T.R. Impact of neighborhood socioeconomic status, income segregation, and greenness on blood biomarkers of inflammation. Environ. Int. 2022, 162, 107164. [Google Scholar]
- Brunsdont, C.; Fotheringham, S.; Charlton, M. Geographically weighted regression -Modelling spatial non-stationarity. J. R. Stat. Soc. 1998, 47, 431–443. [Google Scholar]
- McMaster, R.B.; Leitner, H.; Sheppard, E. GIS-based environmental equity and risk assessment: Methodological problems and prospects. Cartogr. Geogr. Inf. Syst. 1997, 24, 172–189. [Google Scholar]
- Kwan, M.P. The uncertain geographic context problem. Ann. Assoc. Am. Geogr. 2012, 102, 958–968. [Google Scholar] [CrossRef]
- Curtis, J.E.; Shiau, B.; Lowery, D.; Sloane, K.; Hennigan, A.C. The Prospects and Problems for Integrating Sketch Maps with Geographic Information Systems (GIS) to Understand Environmental Perception: A Case Study of Mapping Youth Fear in Los Angeles Gang Neighborhoods. Environ. Plan. B Plan. Des. 2014, 41, 251–271. [Google Scholar] [CrossRef] [Green Version]
- MacMurdo, M.G.; Mulloy, K.B.; Felix, C.W.; Curtis, A.J.; Ajayakumar, J.; Curtis, J. Ambient air pollution exposure among individuals experiencing unsheltered homelessness. Environ. Health Perspect. 2022, 130, 027701. [Google Scholar] [CrossRef] [PubMed]
- MacMurdo, M.G.; Mulloy, K.B.; Culver, D.A.; Felix, C.W.; Curtis, A.J.; Ajayakumar, J.; Curtis, J. Mapping mobility: Utilizing local knowledge derived activity space to estimate exposure to ambient air pollution among individual experiencing unsheltered homelessness. Int. J. Environ. Res. Public Health 2022, 19, 5842. [Google Scholar] [PubMed]
- Gomez, S.L.; Shariff-Marco, S.; DeRouen, M.; Keegan, T.H.; Yen, I.H.; Mujahid, M.; Satariano, W.A.; Glaser, S.L. The impact of neighborhood social and built environment factors across the cancer continuum: Current research, methodological considerations, and future directions. Cancer 2015, 121, 2314–2330. [Google Scholar] [CrossRef] [PubMed] [Green Version]
- Dunn, E.C. The Role of Neighborhood Social Characteristics on the Epigenome-Why the Lack of Investigations? JAMA Netw. Open 2020, 3, e206111. [Google Scholar] [CrossRef] [PubMed]
- Smith, J.A.; Zhao, W.; Wang, X.; Ratliff, S.M.; Mukherjee, B.; Kardia, S.L.R.; Liu, Y.; Roux, A.V.D.; Needham, B.L. Neighborhood characteristics influence DNA methylation of genes involved in stress response and inflammation: The Multi-Ethnic Study of Atherosclerosis. Epigenetics 2017, 12, 662–673. [Google Scholar]

| Endometrioid (N = 649) | Non-Endometrioid (N = 263) | p-Value 1 | |
|---|---|---|---|
| Age | 62.63 (10.40) | 65.37 (10.80) | 5.03 × 10⁻⁴ * |
| SVI | 0.42 (0.28) | 0.47 (0.30) | 0.01 * |
| TRI Count | 0.35 (1.43) | 0.51 (3.05) | 0.41 |
| TRI Density | 881.15 (6741.13) | 220.138 (1493.28) | 0.02 * |
| BMI (mean (range)) | 35.51 (13.13–87.58) | 33.39 (16.95–79.53) | 2.82 × 10⁻³ * |
| FIGO stage, stage 1 count (%) | 527 (81.20%) | 160 (60.84%) | 1.79 × 10⁻¹⁰ * |
| Race | 4.28 × 10⁻¹⁰ * | ||
| Black | 64 (10.12%) | 69 (25.57%) | |
| White | 585 (89.88%) | 194 (74.43%) |
| Full Model SVI | Full Model TRI Count | Full Model TRI Density | ||||||
|---|---|---|---|---|---|---|---|---|
| OR (95% CI) | p-Value | OR (95% CI) | p-Value | OR (95% CI) | p-Value | |||
| SVI Middle-Low | 1.25 (0.80, 1.95) | 0.34 | TRI Count High | 0.85 (0.48, 1.47) | 0.58 | TRI Density High | 0.99 (0.51, 1.84) | 0.98 |
| SVI Middle-High | 1.00 (0.64, 1.55) | 0.99 | ||||||
| SVI High | 1.77 (1.16, 2.72) | 0.008 * | ||||||
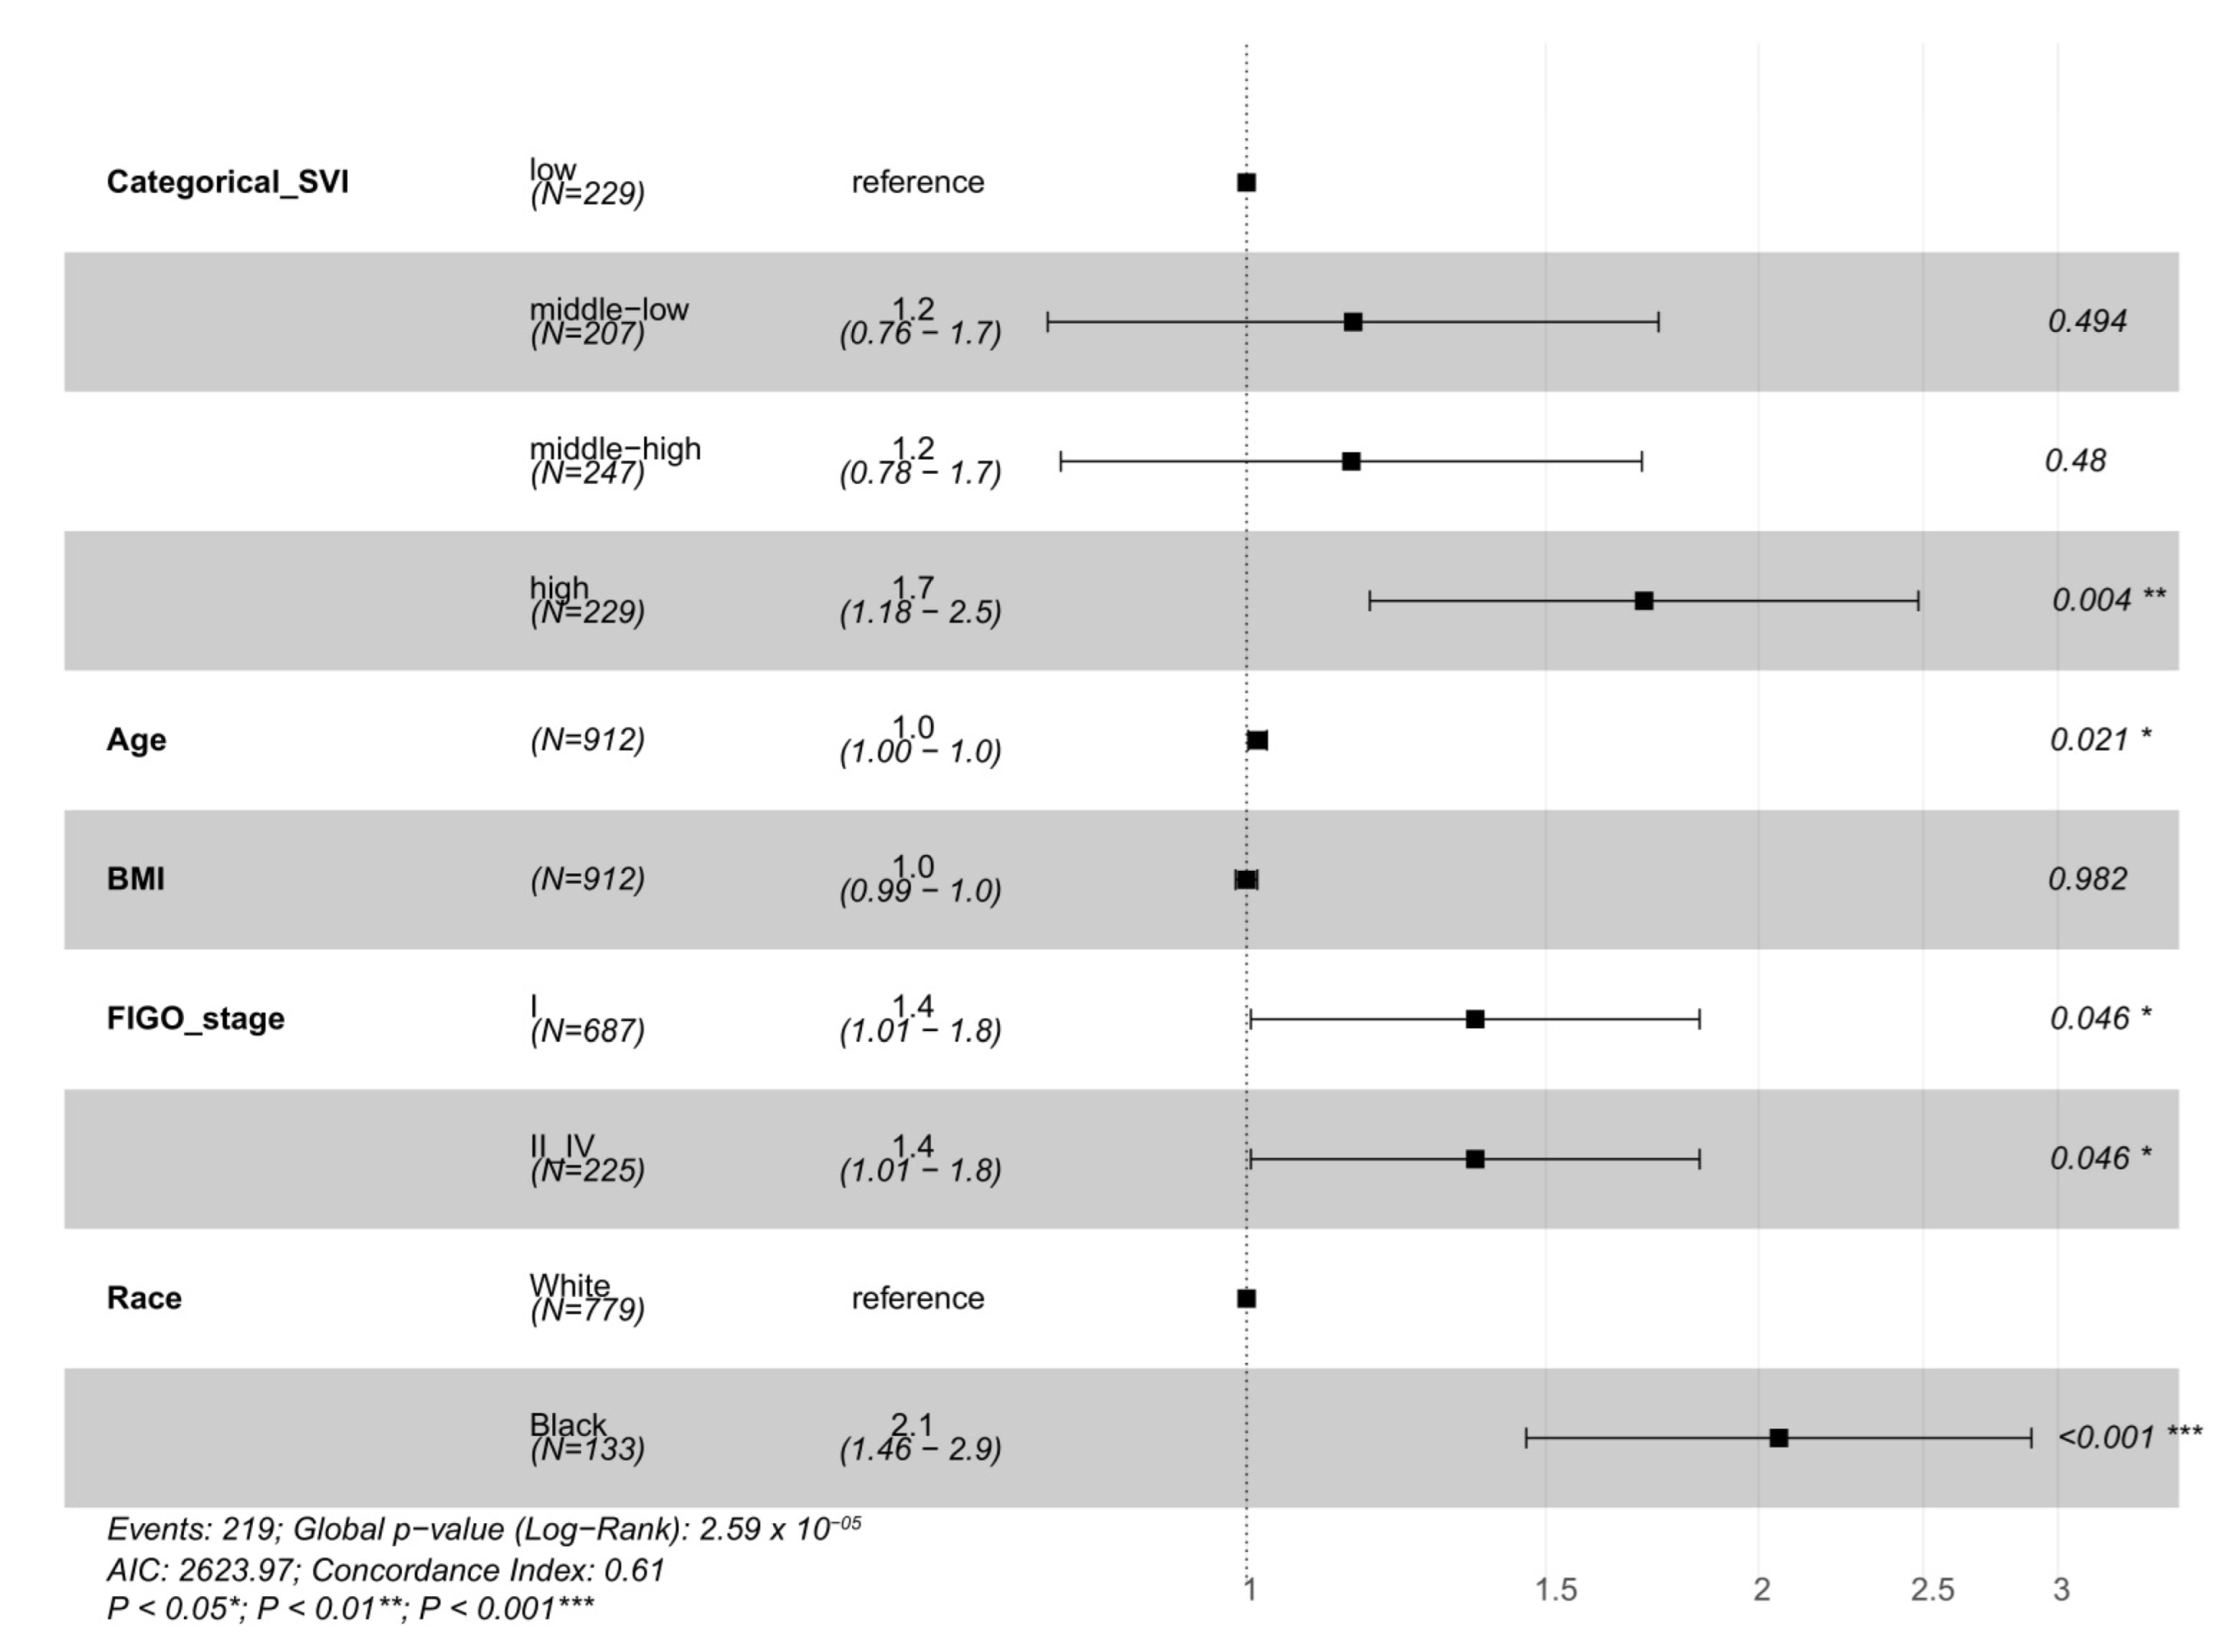
| Full Model SVI | Full Model TRI Count 1 | Full Model TRI Density 2 | ||||||
|---|---|---|---|---|---|---|---|---|
| Hazard Ratio (95% CI) | p-Value | Hazard Ratio (95% CI) | p-Value | Hazard Ratio (95% CI) | p-Value | |||
| SVI Middle-Low 3 | 1.15 (0.76, 1.73) | 0.51 | TRI Count High | 0.84 (0.51, 1.35) | 0.46 | TRI Density High | 0.97 (0.57, 1.68) | 0.93 |
| SVI Middle-High 4 | 1.08 (0.73, 1.62) | 0.69 | ||||||
| SVI High 5 | 1.67 (1.14, 2.41) | 7.95 × 10⁻³ * | ||||||
Publisher’s Note: MDPI stays neutral with regard to jurisdictional claims in published maps and institutional affiliations. |
© 2022 by the authors. Licensee MDPI, Basel, Switzerland. This article is an open access article distributed under the terms and conditions of the Creative Commons Attribution (CC BY) license (https://creativecommons.org/licenses/by/4.0/).
Share and Cite
Miller, A.K.; Gordon, J.C.; Curtis, J.W.; Ajayakumar, J.; Schumacher, F.R.; Avril, S. The Geographic Context of Racial Disparities in Aggressive Endometrial Cancer Subtypes: Integrating Social and Environmental Aspects to Discern Biological Outcomes. Int. J. Environ. Res. Public Health 2022, 19, 8613. https://doi.org/10.3390/ijerph19148613
Miller AK, Gordon JC, Curtis JW, Ajayakumar J, Schumacher FR, Avril S. The Geographic Context of Racial Disparities in Aggressive Endometrial Cancer Subtypes: Integrating Social and Environmental Aspects to Discern Biological Outcomes. International Journal of Environmental Research and Public Health. 2022; 19(14):8613. https://doi.org/10.3390/ijerph19148613
Chicago/Turabian StyleMiller, Anna Kimberly, Jennifer Catherine Gordon, Jacqueline W. Curtis, Jayakrishnan Ajayakumar, Fredrick R. Schumacher, and Stefanie Avril. 2022. "The Geographic Context of Racial Disparities in Aggressive Endometrial Cancer Subtypes: Integrating Social and Environmental Aspects to Discern Biological Outcomes" International Journal of Environmental Research and Public Health 19, no. 14: 8613. https://doi.org/10.3390/ijerph19148613
APA StyleMiller, A. K., Gordon, J. C., Curtis, J. W., Ajayakumar, J., Schumacher, F. R., & Avril, S. (2022). The Geographic Context of Racial Disparities in Aggressive Endometrial Cancer Subtypes: Integrating Social and Environmental Aspects to Discern Biological Outcomes. International Journal of Environmental Research and Public Health, 19(14), 8613. https://doi.org/10.3390/ijerph19148613