
Global Warming’s Six MTurks: A Secondary Analysis of a US-Based Online Crowdsourcing Market


Abstract
:1. Introduction
2. Materials and Methods
2.1. Consumer Panels and Online Crowdsourcing Markets (OCMs)
2.2. Case Study Methods
2.3. Data Cleaning and Analysis
3. Results
4. Discussion
Strengths and Limitations
5. Conclusions
Supplementary Materials
Author Contributions
Funding
Institutional Review Board Statement
Informed Consent Statement
Data Availability Statement
Acknowledgments
Conflicts of Interest
References
- Leiserowitz, A.; Maibach, E.; Rosenthal, S.; Kotcher, J.; Berquist, P.; Ballwe, M.; Goldberg, M.; Gustafson, A.; Wang, X. Climate Change in the American Mind, April 2020; Yale Program on Climate Change Communication: New Haven, CT, USA, 2020. [Google Scholar]
- U.S. Global Change Research Program. Fourth National Climate Assessment; U.S. Global Change Research Program: Washington, DC, USA, 2018; pp. 1–470.
- Maibach, E.W.; Kreslake, J.M.; Roser-Renouf, C.; Rosenthal, S.; Feinberg, G.; Leiserowitz, A.A. Do americans understand that global warming is harmful to human health? Evidence from a national survey. Ann. Glob. Health 2015, 81, 396–409. [Google Scholar] [CrossRef] [PubMed]
- English, P.B.; Sinclair, A.H.; Ross, Z.; Anderson, H.; Boothe, V.; Davis, C.; Ebi, K.; Kagey, B.; Malecki, K.; Shultz, R.; et al. Environmental health indicators of climate change for the United States: Findings from the state environmental health indicator collaborative. Environ. Health Perspect. 2009, 117, 1673–1681. [Google Scholar] [CrossRef] [PubMed]
- Ebi, K.L. Public Health Responses to the Risks of Climate Variability and Change in the United States. J. Occup. Environ. Med. 2009, 51, 4–12. [Google Scholar] [CrossRef] [PubMed]
- Metag, J.; Füchslin, T.; Schäfer, M.S. Global warming’s five Germanys: A typology of Germans’ views on climate change and patterns of media use and information. Public Underst. Sci. 2017, 26, 434–451. [Google Scholar] [CrossRef] [PubMed]
- Tyrer, S.; Heyman, B. Sampling in epidemiological research: Issues, hazards and pitfalls. BJPsych Bull. 2016, 40, 57. [Google Scholar] [CrossRef] [PubMed]
- Abrahamson, M. Social Research Methods; Prentice Hall: Hoboken, NJ, USA, 1983. [Google Scholar]
- Amazon Mechanical Turk (MTurk). Available online: https://www.mturk.com/ (accessed on 7 May 2021).
- Buhrmester, M.; Kwang, T.; Gosling, S.D. Amazon’s mechanical Turk: A new source of inexpensive, yet high-quality, data? Perspect. Psychol. Sci. 2011, 6, 3–5. [Google Scholar] [CrossRef] [PubMed]
- Mason, W.; Suri, S. Conducting behavioral research on Amazon’s Mechanical Turk. Behav. Res. Methods 2012, 44, 1–23. [Google Scholar] [CrossRef]
- Steelman, Z.R.; Hammer, B.I.; Limayem, M. Data Collection in the Digital Age: Innovative alternatives to student samples. MIS Q. 2006, 30, 611–642. [Google Scholar] [CrossRef] [Green Version]
- Chryst, B.; Marlon, J.; Wang, X.; van der Linden, S.; Maibach, E.; Roser-Renouf, C.; Leiserowitz, A. Six Americas Super Short Survey (SASSY!). Available online: https://climatecommunication.yale.edu/visualizations-data/sassy/ (accessed on 27 August 2020).
- Maibach, E.W.; Leiserowitz, A.; Roser-Renouf, C.; Mertz, C.K. Identifying Like-Minded Audiences for Global Warming Public Engagement Campaigns: An Audience Segmentation Analysis and Tool Development. PLoS ONE 2011, 6, e17571. [Google Scholar] [CrossRef] [PubMed] [Green Version]
- Smith, S.M.; Roster, C.A.; Golden, L.L.; Albaum, G.S. A multi-group analysis of online survey respondent data quality: Comparing a regular USA consumer panel to MTurk samples. J. Bus. Res. 2016, 69, 3139–3148. [Google Scholar] [CrossRef]
- U.S. Census Bureau. Current Population Survey, 2020 Annual Social and Economic Supplement (CPS ASEC). 2020. Available online: https://www.census.gov/data/tables/time-series/demo/income-poverty/cps-hinc/hinc-01.2019.html (accessed on 5 April 2022).
- StataCorp. Stata Statistical Software: Release 16; StataCorp LLC: College Station, TX, USA, 2019. [Google Scholar]
- Leiserowitz, A.; Maibach, E.; Rosenthal, S.; Kotcher, J.; Bergquist, P.; Ballew, M.; Goldberg, M.; Gustafson, A. Climate Change in the American Mind: April 2019; Yale Program on Climate Change Communication: New Haven, CT, USA, 2019. [Google Scholar]
- Myers, T.A.; Nisbet, M.C.; Maibach, E.W.; Leiserowitz, A.A. A public health frame arouses hopeful emotions about climate change. Clim. Change 2012, 113, 1105–1112. [Google Scholar] [CrossRef] [Green Version]
- Kearney, G.D.; Bell, R.A. Perceptions of Global Warming among the Poorest Counties in the Southeastern United States. J. Public Health Manag. Pract. 2019, 25, 107–112. [Google Scholar] [CrossRef] [PubMed]
- Madrigano, J.; Lane, K.; Petrovic, N.; Ahmed, M.; Blum, M.; Matte, T. Awareness, risk perception, and protective behaviors for extreme heat and climate change in New York City. Int. J. Environ. Res. Public Health 2018, 15, 1433. [Google Scholar] [CrossRef] [PubMed] [Green Version]
- Beckmann, S.K.; Hiete, M. Predictors associated with health-related heat risk perception of urban citizens in Germany. Int. J. Environ. Res. Public Health 2020, 17, 874. [Google Scholar] [CrossRef] [PubMed] [Green Version]
- Akompab, D.A.; Bi, P.; Williams, S.; Grant, J.; Walker, I.A.; Augoustinos, M. Heat waves and climate change: Applying the health belief model to identify predictors of risk perception and adaptive behaviours in Adelaide, Australia. Int. J. Environ. Res. Public Health 2013, 10, 2164–2184. [Google Scholar] [CrossRef] [PubMed] [Green Version]
- Wolf, J.; Adger, W.N.; Lorenzoni, I. Heat waves and cold spells: An analysis of policy response and perceptions of vulnerable populations in the UK. Environ. Plan. A 2010, 42, 2721–2734. [Google Scholar] [CrossRef]
- Abrahamson, V.; Wolf, J.; Lorenzoni, I.; Fenn, B.; Kovats, S.; Wilkinson, P.; Adger, W.N.; Raine, R. Perceptions of heatwave risks to health: Interview-based study of older people in London and Norwich, UK. J. Public Health 2009, 31, 119–126. [Google Scholar] [CrossRef] [PubMed] [Green Version]
- Howe, P.D.; Marlon, J.R.; Wang, X.; Leiserowitz, A. Public perceptions of the health risks of extreme heat across US states, counties, and neighborhoods. Proc. Natl. Acad. Sci. USA 2019, 116, 6743–6748. [Google Scholar] [CrossRef] [PubMed] [Green Version]
- Maibach, E.W.; Sarfaty, M.; Mitchell, M.; Gould, R. Limiting global warming to 1.5 to 2.0 °C—A unique and necessary role for health professionals. PLoS Med. 2019, 16, e1002804. [Google Scholar] [CrossRef] [PubMed]


| US Census | Ipsos, April 2020 n = 1029 | MTurk, July 2020 n = 504 | p (Census vs. Ipsos) | p (Census vs. MTurk) | p (Ipsos vs. MTurk) | |
|---|---|---|---|---|---|---|
| Gender | 0.437 | 0.697 | 0.900 | |||
| Male | 159,028 (49.0) | 517 (50.2) | 249 (49.4) | |||
| Female | 165,328 (51.0) | 512 (49.8) | 250 (49.6) | |||
| Age category | <0.001 | <0.001 | <0.001 | |||
| Millennials (1981–1996) | 66,652 (20.5) | 222 (21.6) | 258 (51.2) | |||
| Generation X (1965–1980) | 60,284 (18.6) | 268 (26.0) | 173 (34.3) | |||
| Baby Boomers (1946–1964) | 73,242 (22.6) | 421 (40.9) | 72 (14.3) | |||
| Silent (1928–1945) | 21,300 (6.6) | 81 (7.9) | 1 (0.2) | |||
| Greatest (Before 1928) | 0 (0.0) | 2 (0.2) | 0 (0.0) | |||
| Education | <0.001 | <0.001 | <0.001 | |||
| Less than high school | 26,559 (10.6) | 56 (5.4) | 3 (0.6) | |||
| High school | 70,947 (28.3) | 250 (24.3) | 60 (11.9) | |||
| Some college | 69,577 (27.8) | 296 (28.8) | 162 (32.1) | |||
| Bachelor’s degree or higher | 83,478 (33.3) | 427 (41.5) | 279 (55.4) | |||
| Income | <0.001 | <0.001 | <0.001 | |||
| <$25 K | 21,864 (17.0) | 98 (9.5) | 114 (22.6) | |||
| $25 K–<$50 K | 25,755 (20.1) | 177 (17.2) | 116 (23.0) | |||
| $50 K–<$75 K | 21,242 (16.5) | 180 (17.5) | 149 (29.6) | |||
| $75 K–<$100 K | 15,804 (12.3) | 130 (12.6) | 49 (9.7) | |||
| $100 K–<$125 K | 12,114 (9.4) | 132 (12.8) | 56 (11.1) | |||
| $125 K+ | 31,674 (24.7) | 292 (28.4) | 20 (4.0) | |||
| Race/ethnicity 1 | <0.001 | <0.001 | <0.001 | |||
| White, Non-Hispanic | 195,060 (76.3) | 758 (73.7) | 390 (77.4) | |||
| Black, Non-Hispanic | 43,464 (13.4) | 88 (8.6) | 37 (7.3) | |||
| Hispanic | 60,095 (18.5) | 115 (11.2) | 27 (5.4) | |||
| 2 + races, Non-Hispanic | 9082 (2.8) | 27 (2.6) | 1 (0.2) | |||
| Other, Non-Hispanic | 24,002 (7.4) | 41 (4.0) | 49 (9.7) | |||
| Region | 0.002 | <0.001 | <0.001 | |||
| Northeast | 22,031 (17.2) | 208 (20.2) | 116 (23.0) | |||
| Midwest | 27,757 (21.6) | 244 (23.7) | 104 (20.6) | |||
| South | 49,486 (38.5) | 341 (33.1) | 104 (20.6) | |||
| West | 29,177 (22.7) | 236 (22.9) | 179 (35.5) | |||
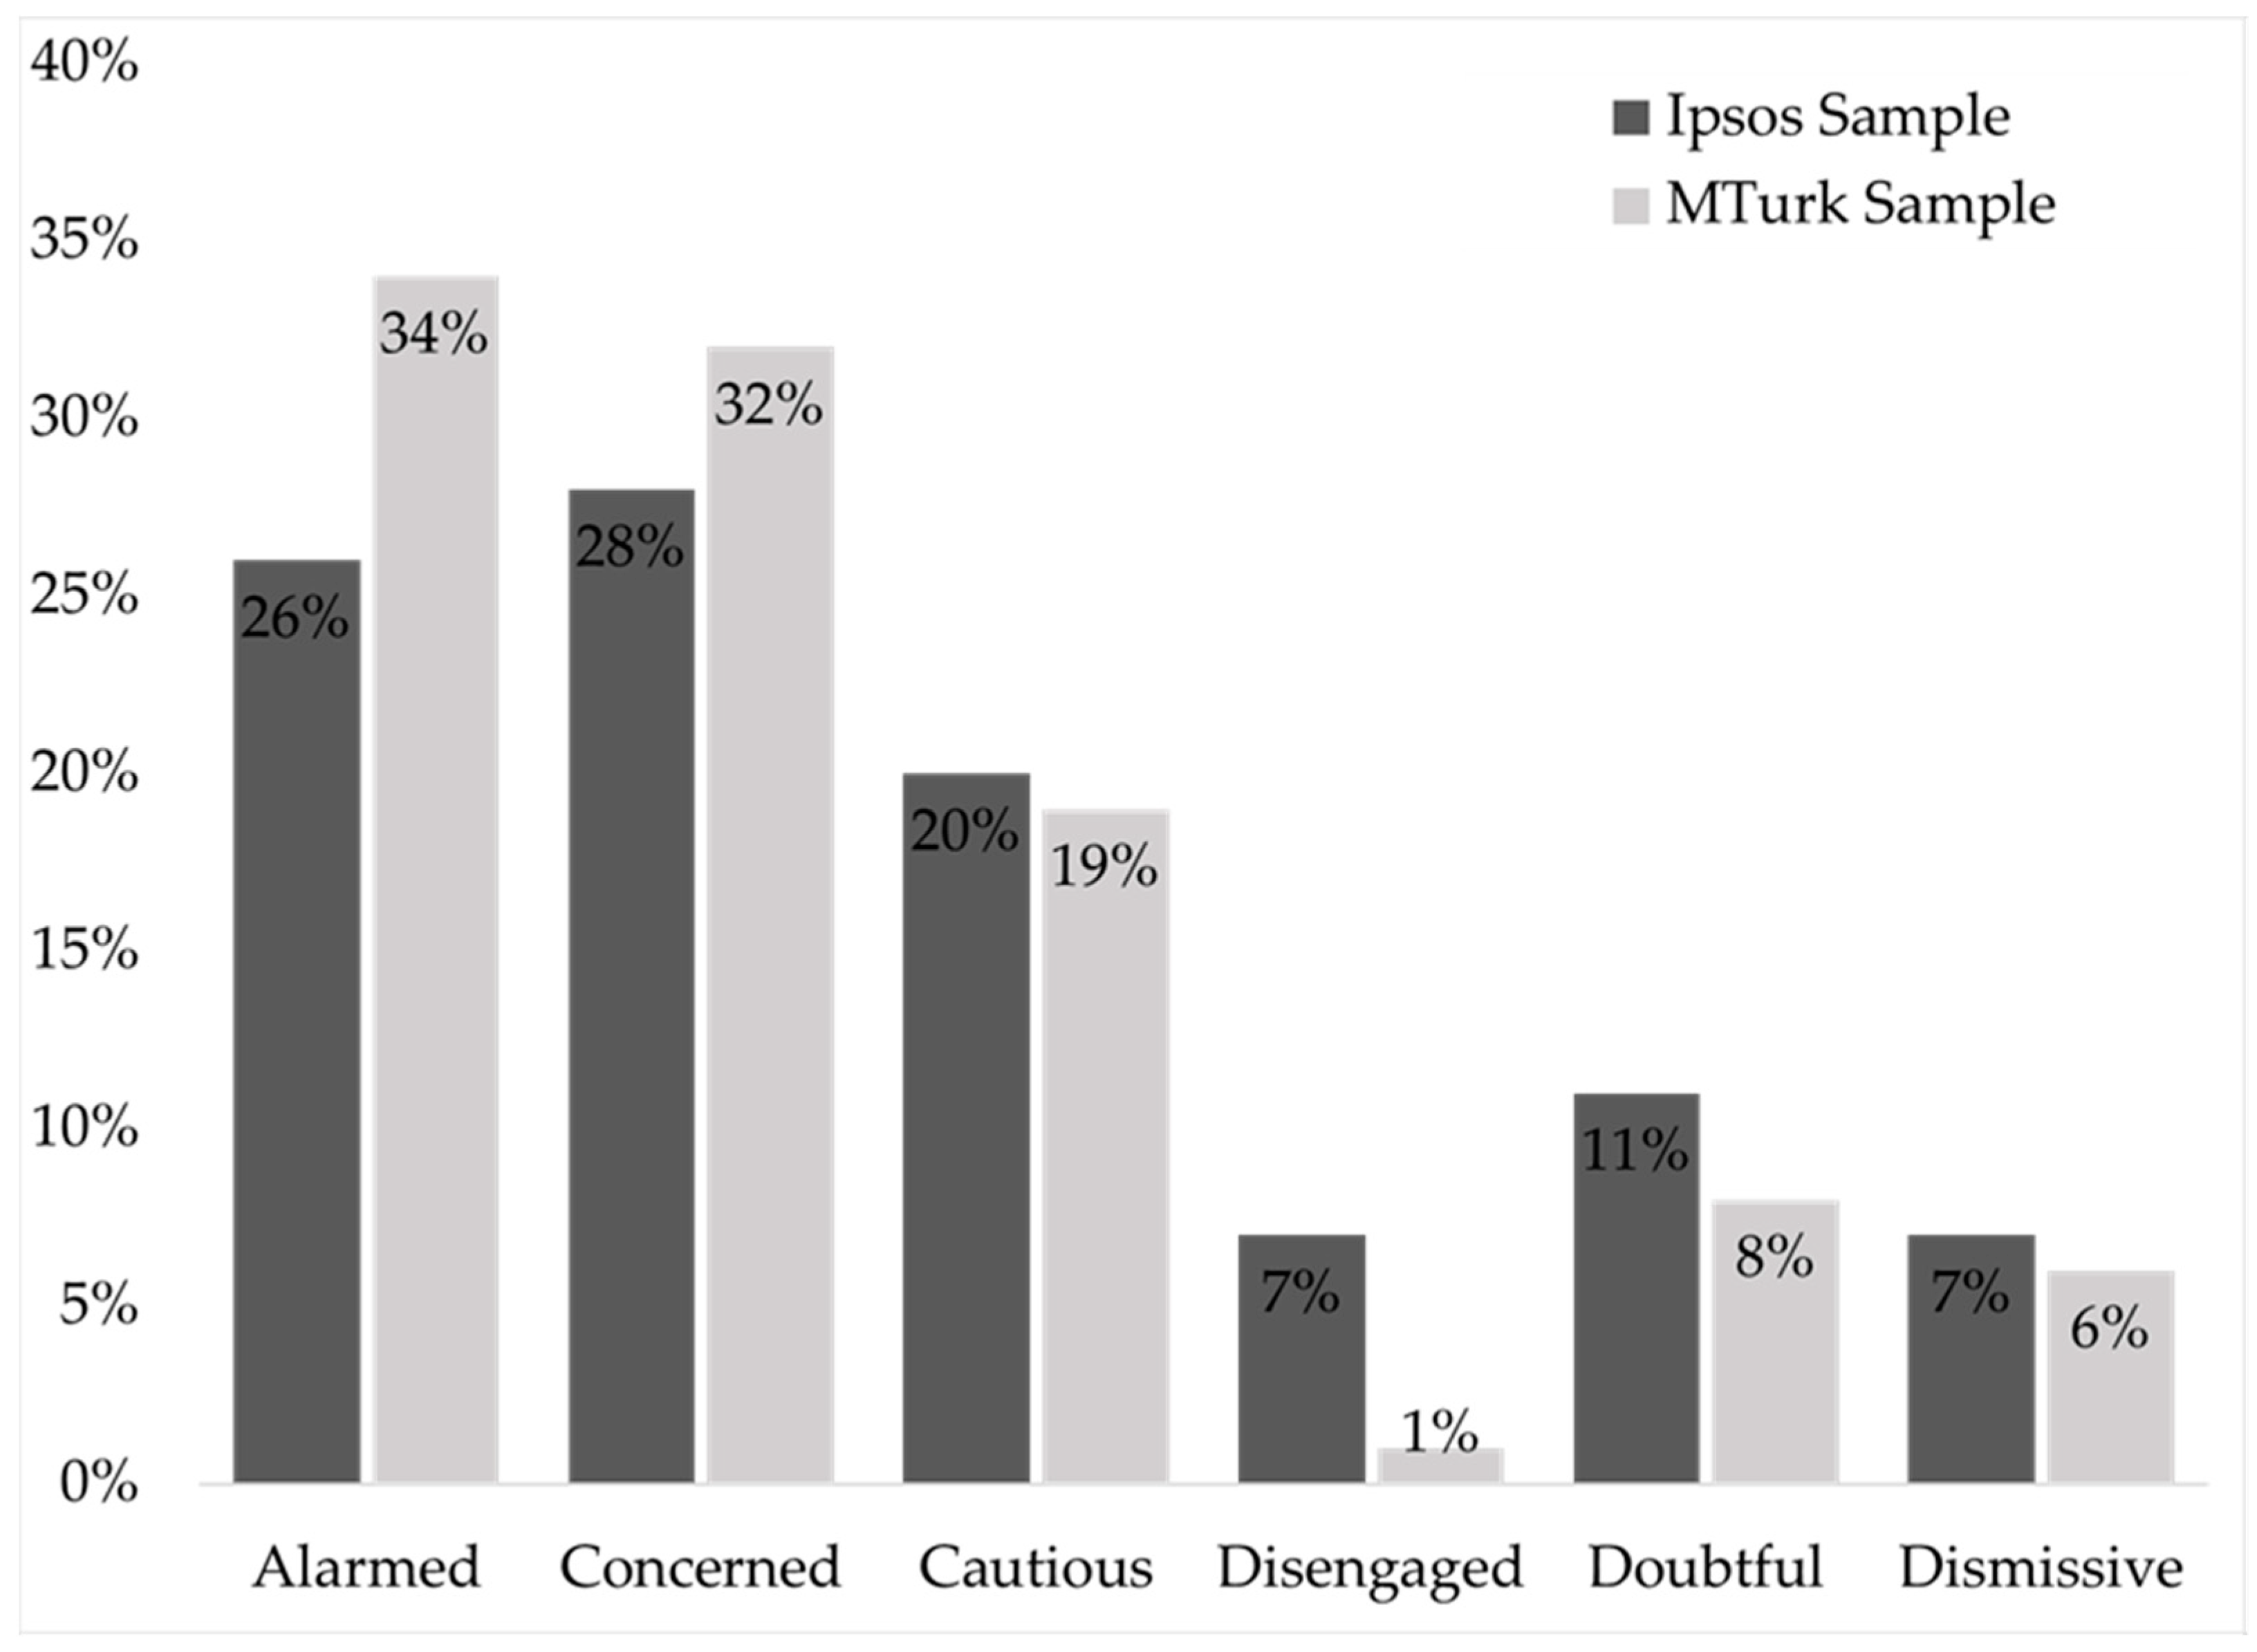
| SASSY audience segment | -- | -- | <0.001 | |||
| Alarmed | -- | 268 (26.0) | 172 (34.1) | |||
| Concerned | -- | 288 (28.0) | 161 (31.9) | |||
| Cautious | -- | 206 (20.0) | 93 (18.5) | |||
| Disengaged | -- | 72 (7.0) | 3 (0.6) | |||
| Doubtful | -- | 113 (11.0) | 41 (8.1) | |||
| Dismissive | -- | 72 (7.0) | 30 (6.0) |
| Alarmed n (%) | Concerned n (%) | Cautious n (%) | Doubtful n (%) | Dismissive n (%) | p-Value | |
|---|---|---|---|---|---|---|
| Gender | 0.378 | |||||
| Male | 77 (31.2) | 79 (32.0) | 50 (20.2) | 22 (8.9) | 19 (7.7) | |
| Female | 92 (37.6) | 80 (32.7) | 43 (17.6) | 19 (7.8) | 11 (4.5) | |
| Age Category | 0.005 | |||||
| Millennials (1981–1996) | 80 (31.5) | 97 (38.2) | 54 (21.3) | 15 (5.9) | 8 (3.2) | |
| Generation X (1965–1980) | 66 (38.4) | 42 (24.4) | 30 (17.4) | 17 (9.9) | 17 (9.9) | |
| Baby Boomers or older (1946–1964) | 26 (36.6) | 22 (31.0) | 9 (12.7) | 9 (12.7) | 5 (7.0) | |
| Education | 0.074 | |||||
| Some college or less | 50 (32.5) | 48 (31.2) | 28 (18.2) | 21 (13.6) | 7 (4.6) | |
| Associate/Bachelor or more | 122 (35.6) | 113 (32.9) | 65 (18.9) | 20 (5.8) | 23 (6.7) | |
| Total household income (in 1000 s) | 0.050 | |||||
| Less than $30 | 41 (36.9) | 34 (30.6) | 15 (13.5) | 13 (11.7) | 8 (7.2) | |
| $30–99 | 97 (31.3) | 108 (34.8) | 67 (21.6) | 24 (7.7) | 14 (4.5) | |
| $100 or more | 34 (44.7) | 19 (25.0) | 11 (14.5) | 4 (5.3) | 8 (10.5) | |
| Race/ethnicity | 0.741 | |||||
| White, Non-Hispanic | 129 (33.4) | 128 (33.2) | 73 (18.9) | 33 (8.6) | 23 (5.9) | |
| Black, Non-Hispanic | 14 (38.9) | 8 (22.2) | 8 (22.2) | 3 (8.3) | 3 (8.3) | |
| Hispanic | 8 (29.6) | 10 (37.0) | 3 (11.1) | 4 (14.8) | 2 (7.4) | |
| Other, Non-Hispanic | 21 (43.8) | 15 (31.3) | 9 (18.8) | 1 (2.1) | 2 (4.2) | |
| Region | 0.860 | |||||
| West | 46 (40.4) | 34 (29.8) | 18 (15.8) | 10 (8.8) | 6 (5.3) | |
| Northeast | 39 (37.9) | 34 (33.0) | 20 (19.4) | 6 (5.8) | 4 (3.9) | |
| Midwest | 29 (28.2) | 38 (36.9) | 19 (18.5) | 9 (8.7) | 8 (7.8) | |
| South | 58 (32.9) | 55 (31.3) | 36 (20.5) | 15 (8.5) | 12 (6.8) |
Publisher’s Note: MDPI stays neutral with regard to jurisdictional claims in published maps and institutional affiliations. |
© 2022 by the authors. Licensee MDPI, Basel, Switzerland. This article is an open access article distributed under the terms and conditions of the Creative Commons Attribution (CC BY) license (https://creativecommons.org/licenses/by/4.0/).
Share and Cite
Austhof, E.; Brown, H.E. Global Warming’s Six MTurks: A Secondary Analysis of a US-Based Online Crowdsourcing Market. Int. J. Environ. Res. Public Health 2022, 19, 8320. https://doi.org/10.3390/ijerph19148320
Austhof E, Brown HE. Global Warming’s Six MTurks: A Secondary Analysis of a US-Based Online Crowdsourcing Market. International Journal of Environmental Research and Public Health. 2022; 19(14):8320. https://doi.org/10.3390/ijerph19148320
Chicago/Turabian StyleAusthof, Erika, and Heidi E. Brown. 2022. "Global Warming’s Six MTurks: A Secondary Analysis of a US-Based Online Crowdsourcing Market" International Journal of Environmental Research and Public Health 19, no. 14: 8320. https://doi.org/10.3390/ijerph19148320
APA StyleAusthof, E., & Brown, H. E. (2022). Global Warming’s Six MTurks: A Secondary Analysis of a US-Based Online Crowdsourcing Market. International Journal of Environmental Research and Public Health, 19(14), 8320. https://doi.org/10.3390/ijerph19148320