
Analyzing Successful Aging and Longevity: Risk Factors and Health Promoters in 2020 Older Adults

 , , , ,
Abstract
1. Introduction
2. Materials and Methods
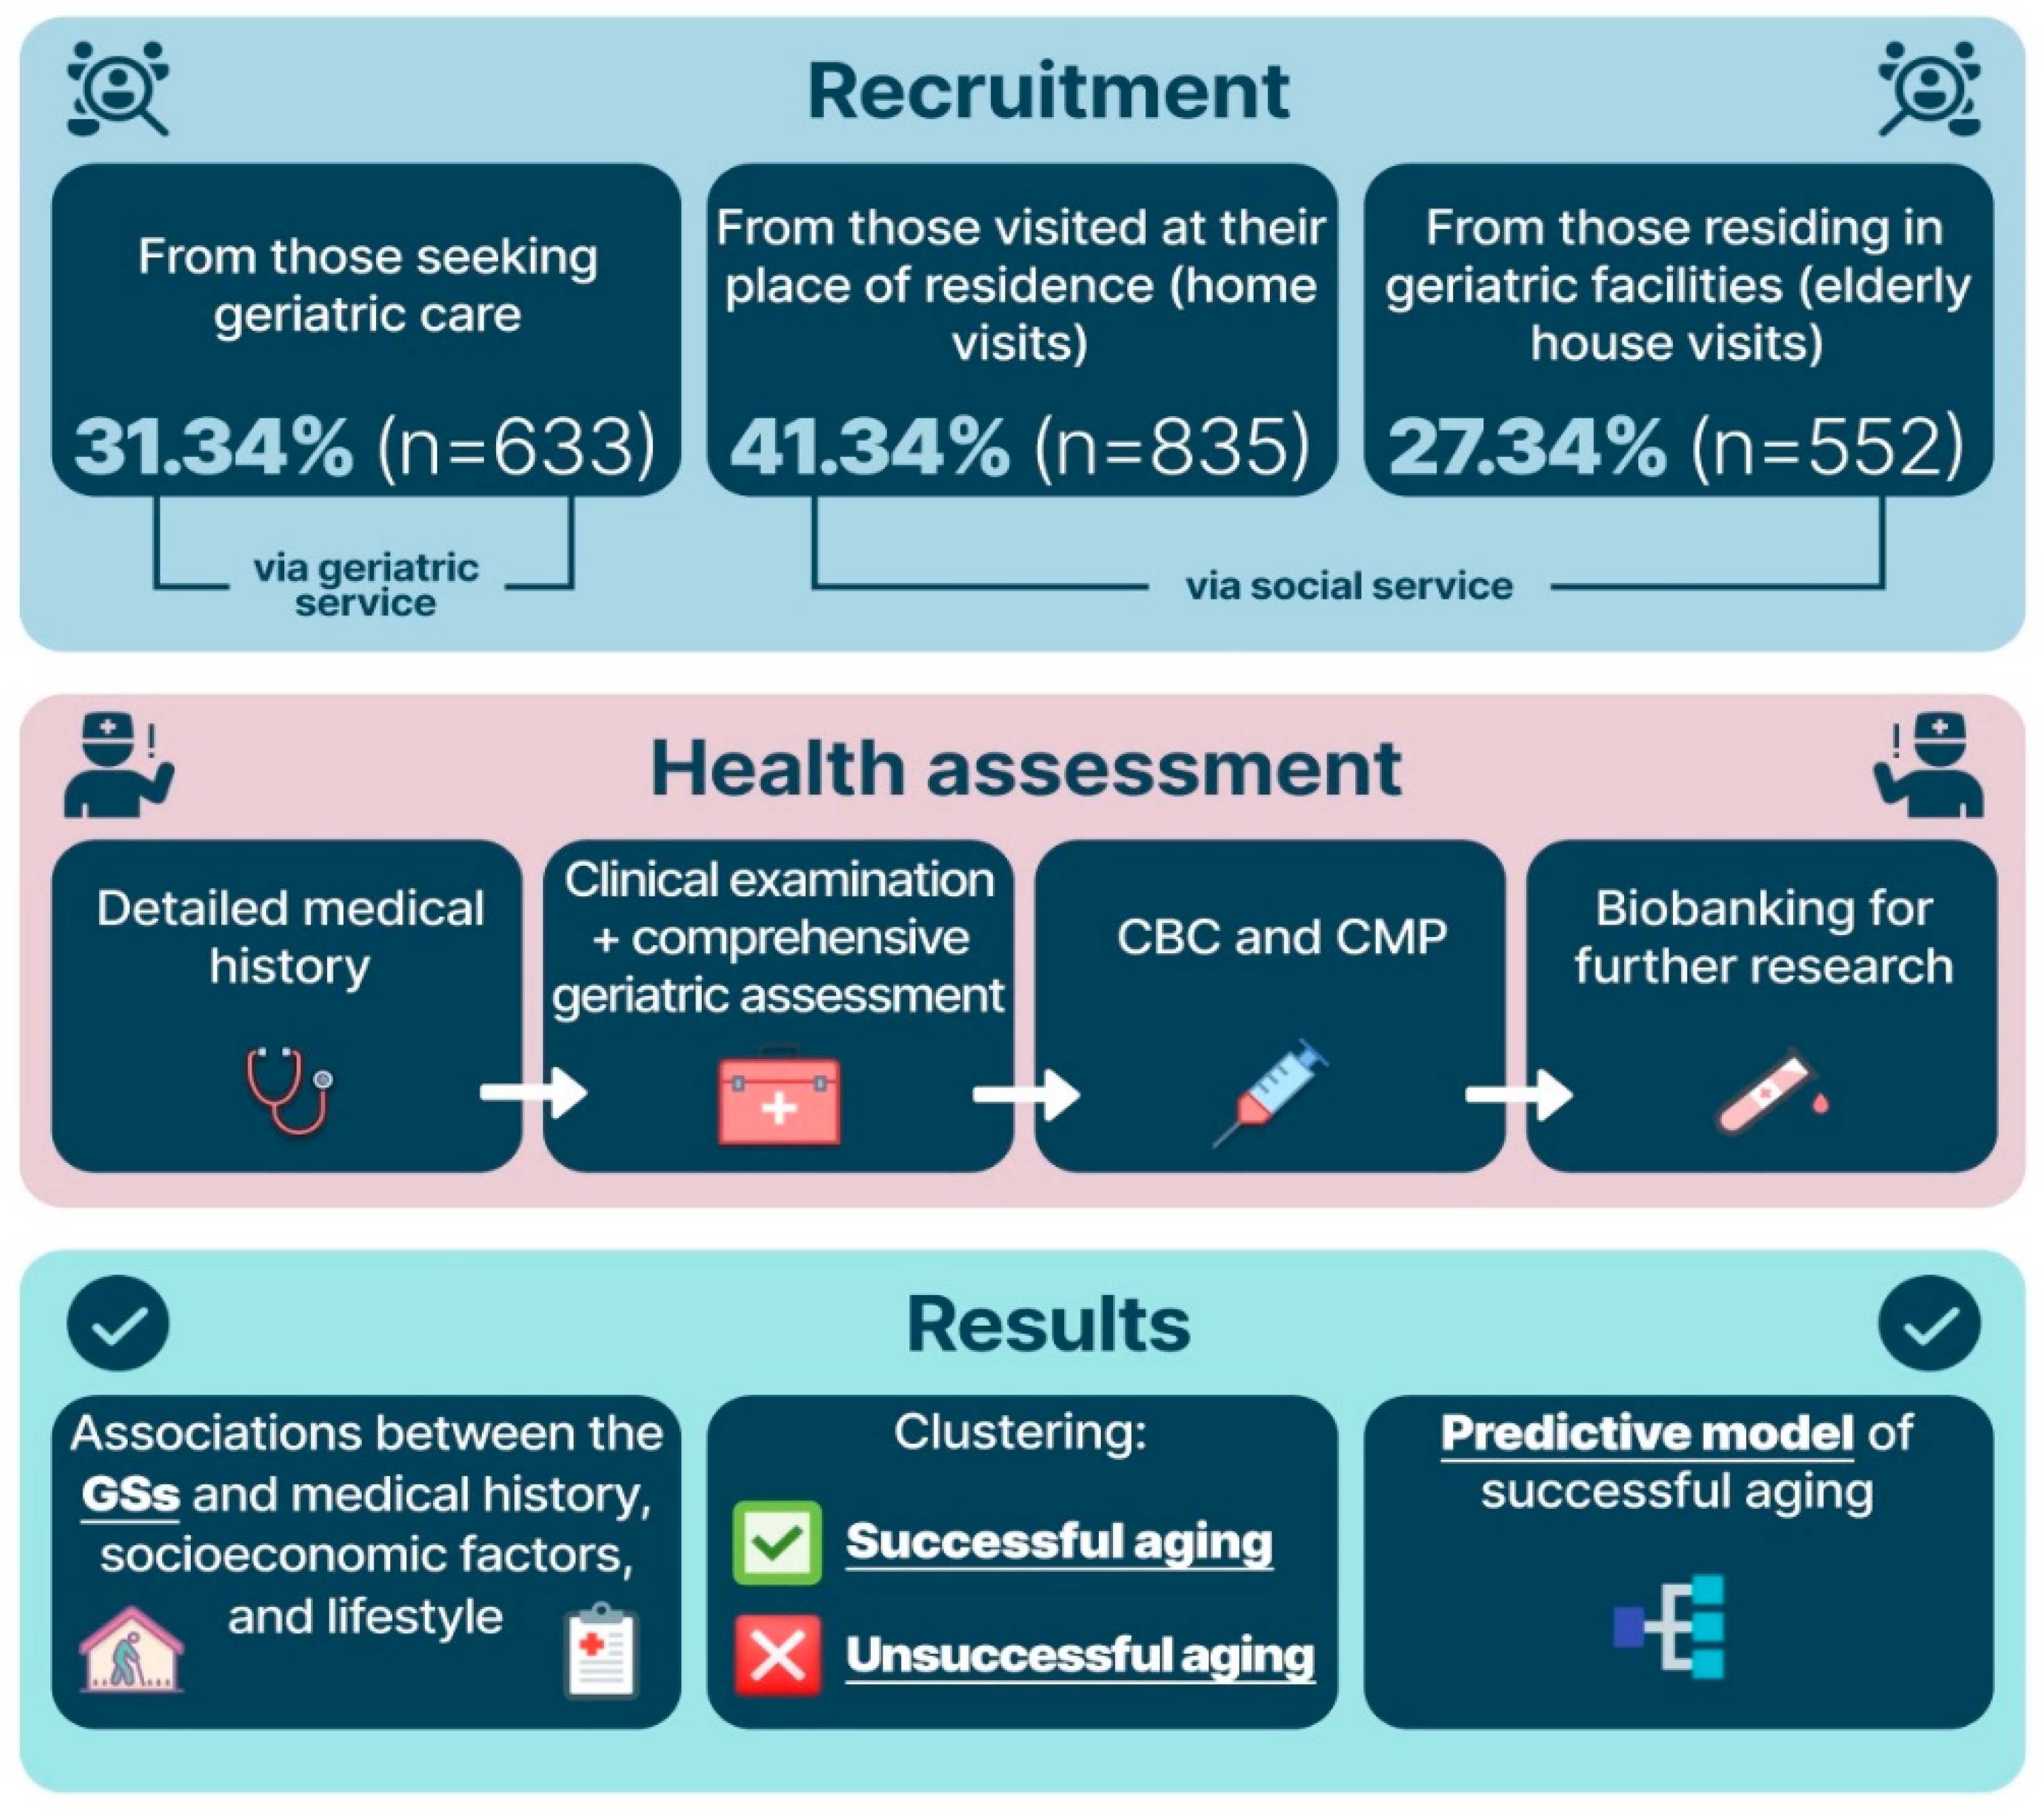
2.1. Study Design
2.2. Study Procedures
- Frailty syndrome, diagnosed using the Short Physical Performance Battery;
- Cognitive impairment, assessed by the Mini-Mental State Examination (MMSE) and clock-drawing test;
- Frontal lobe dysfunction, assessed using the Frontal Assessment Battery (FAB) test;
- Chronic pain, assessed based on the questionnaire presented in the Supplementary Materials, Table S1;
- Anxiety disorder, assessed based on the questionnaire presented in the Supplementary Materials, Table S1;
- Risk of falls, assessed based on the questionnaire presented in the Supplementary Materials, Table S1;
- Sensory deficit, assessed based on the questionnaire presented in the Supplementary Materials, Table S1;
- Depression, diagnosed using the Five-Item Geriatric Depression Scale (GDS-5);
- Sarcopenia, diagnosed using the SARC-F questionnaire (strength, assistance walking, rise from a chair, climb stairs, and falls) and hand-held dynamometry;
- Risk of malnutrition, assessed based on the Mini Nutritional Assessment (MNA-scale);
- Fecal or urinary incontinence, self-reported;
- Dependence in ADL (activity of daily living), assessed based on the Barthel index;
- Dependence in IADL (instrumental activity of daily living), assessed based on the Lawton scale;
- Polypragmasia, defined as a simultaneous administration of 5 or more medications;
- Orthostatic hypotension, measured using the standard diagnostic procedure [17].
3. Data Analysis
4. Results
4.1. Clinical Characteristics of the Participants
4.2. Associations and Correlations between the GSs and Evaluated Factors
- Family history;
- Socioeconomic factors;
- Lifestyle and physical activity;
- Obstetrics and gynecological history;
- Factors reflecting current health status.
4.2.1. Assessment of the Associations between the GSs and Factors
4.2.2. Assessment of the Association between the Laboratory Test Results, GSs and Presence of ADDs
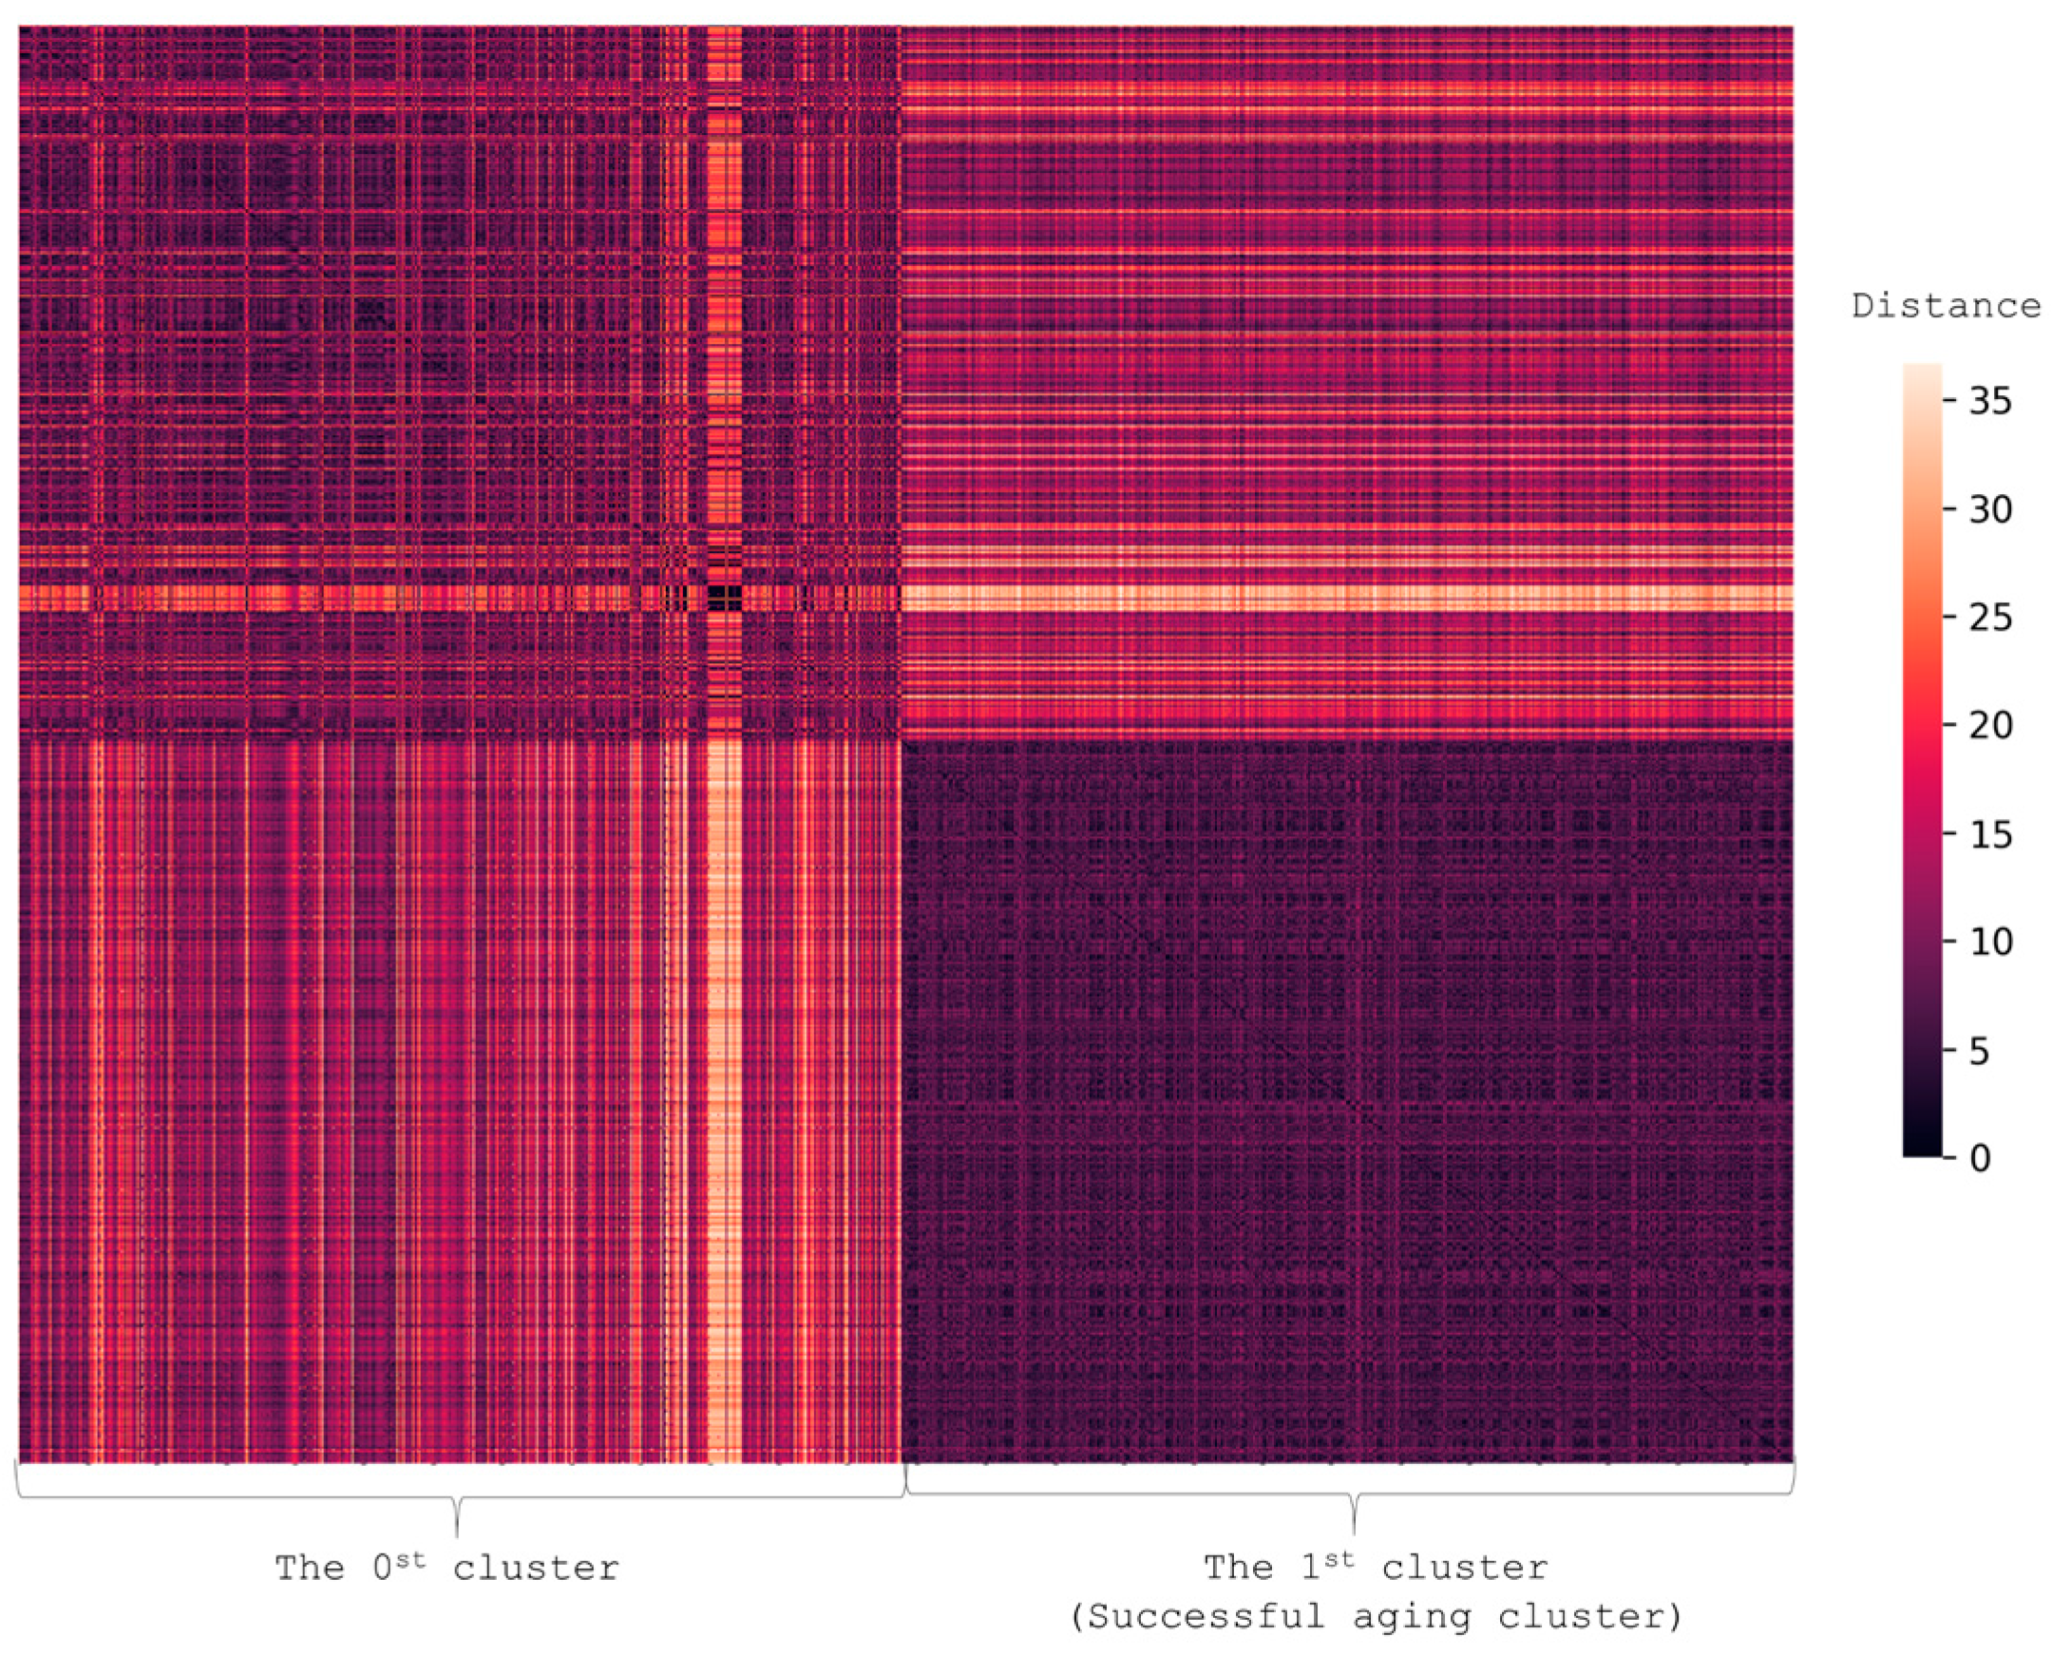
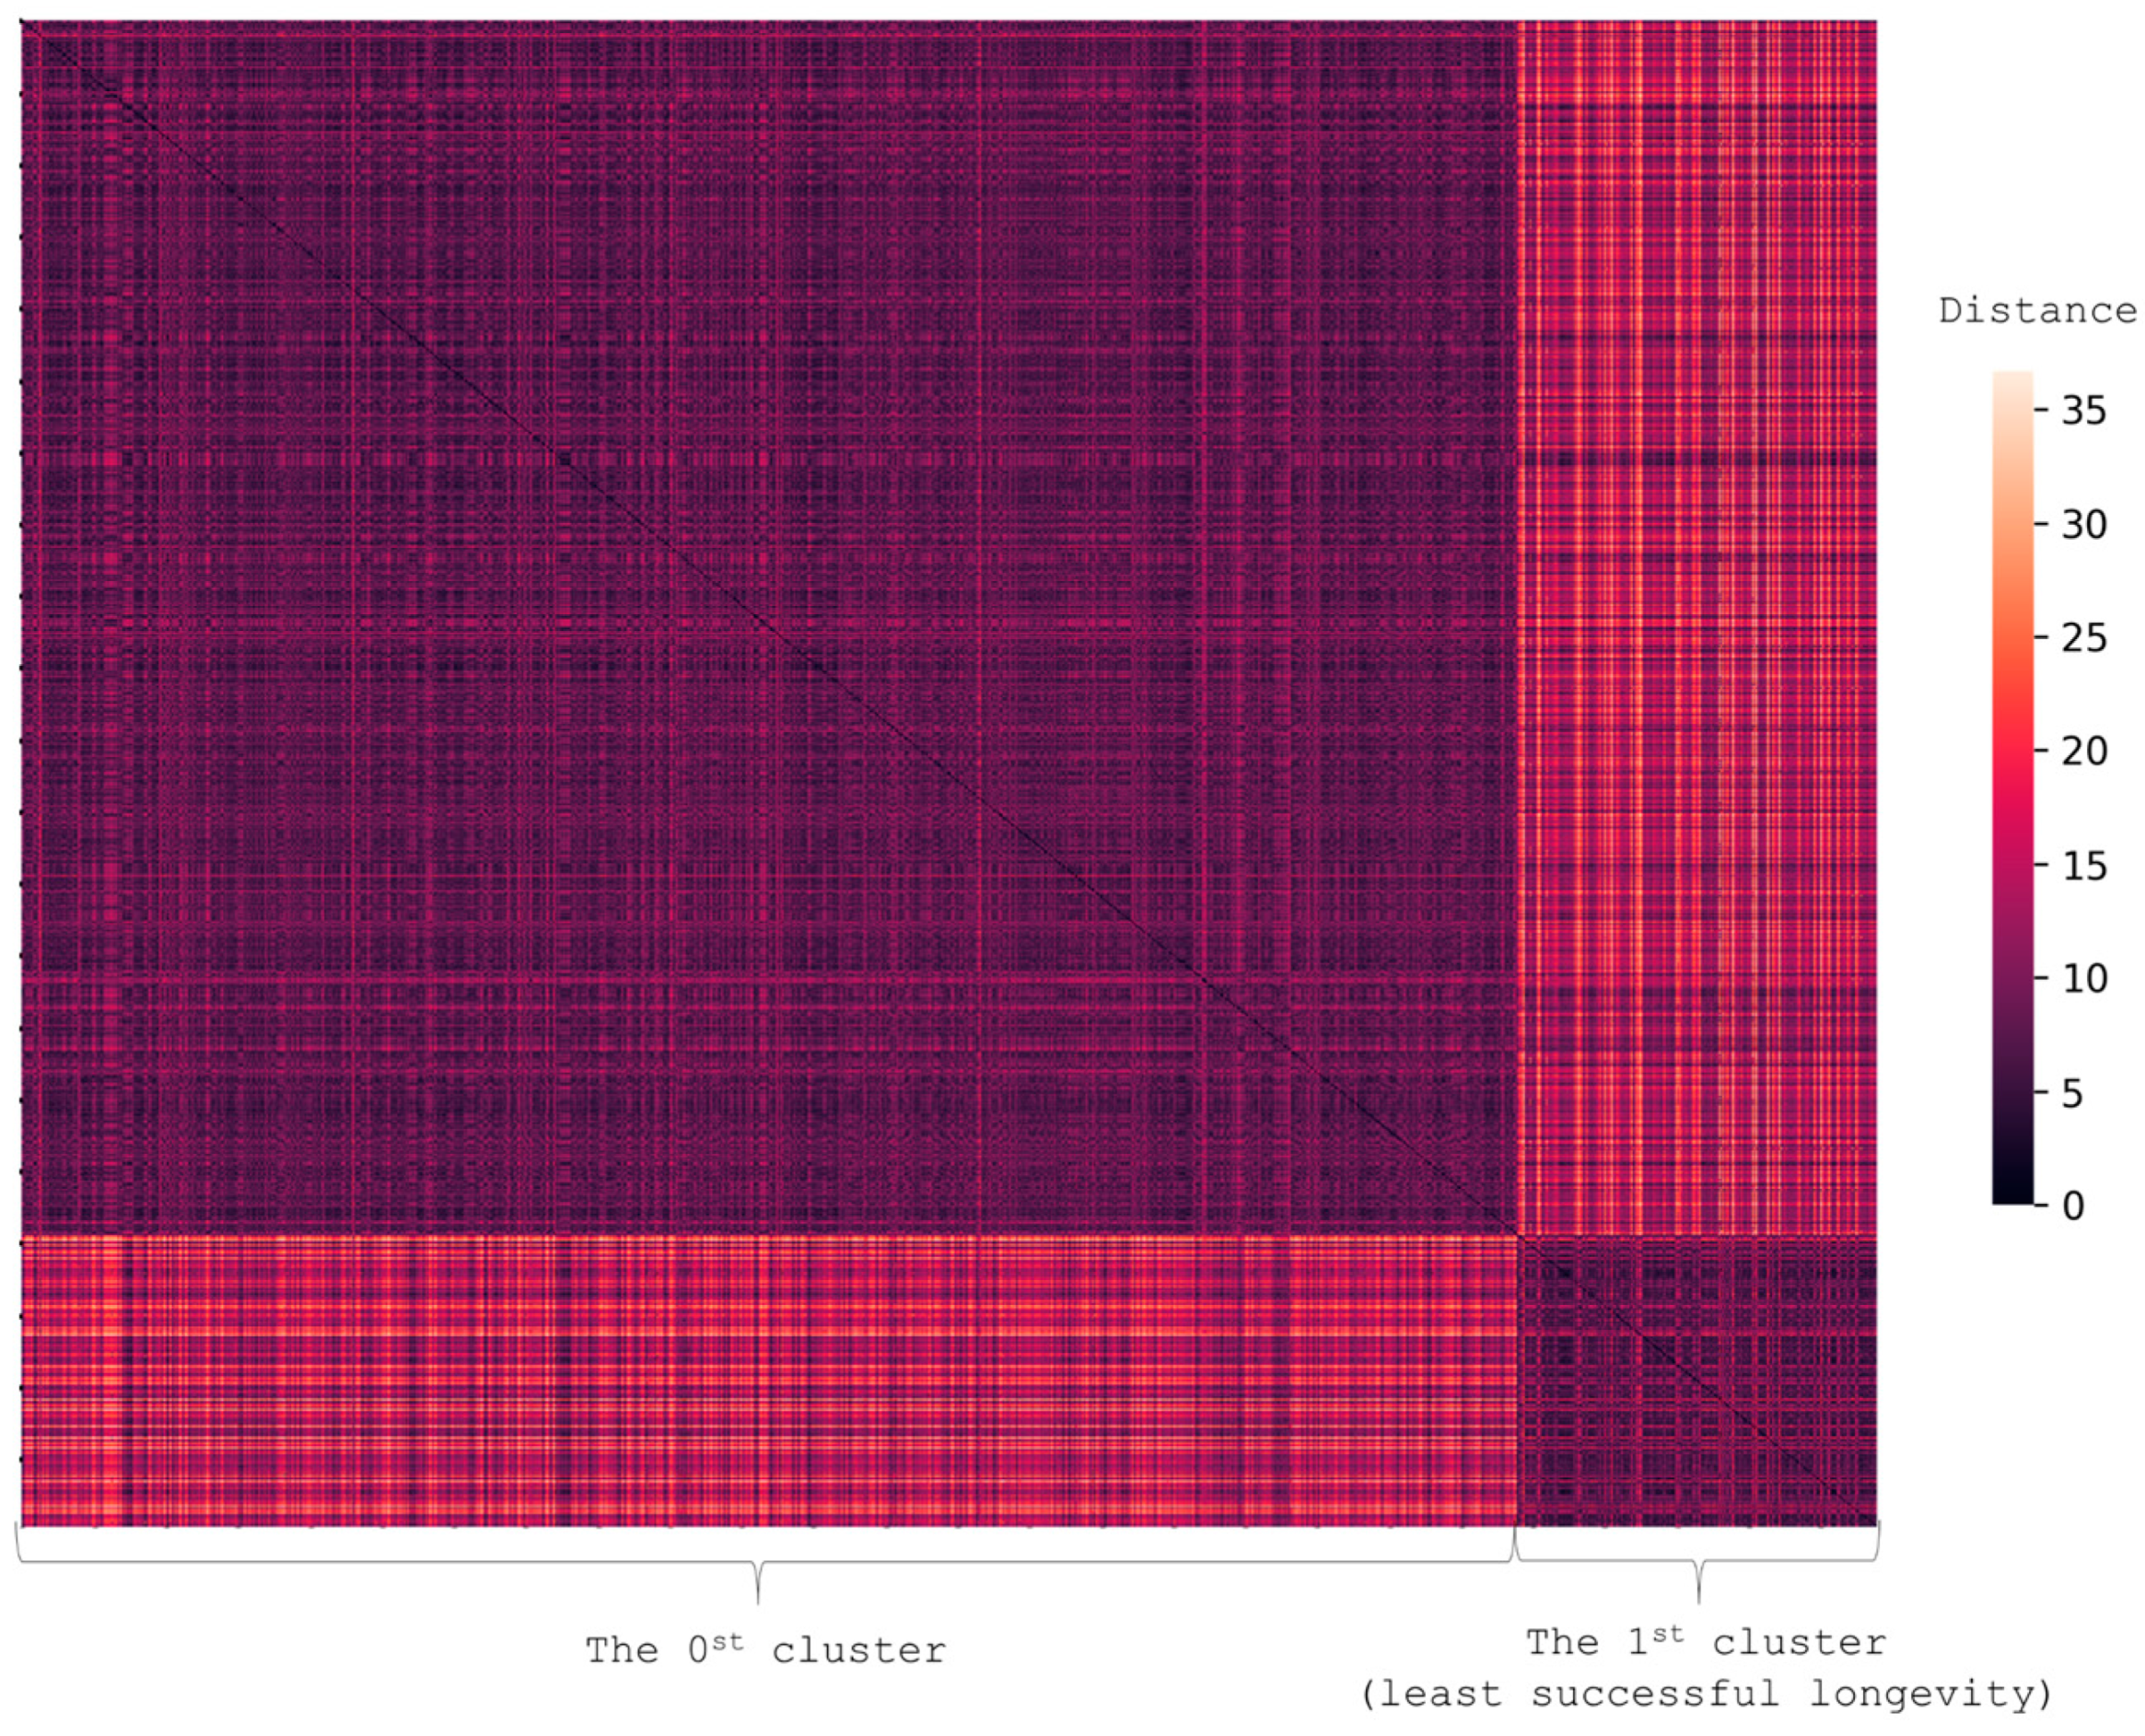
4.3. Clustering for Patterns of the Most Successful and Unsuccessful Aging
4.3.1. Successful Aging Cluster
4.3.2. Cluster of the Least Successful Aging
4.4. Predicting Successful Aging
- Family history of cognitive decline (1—yes; 0—no);
- Physical activity for the most part of one’s life;
- Mother’s age at death;
- Father’s age at death;
- Income at the peak of the career (0—low, 1—medium, 2—high);
- Total number of children;
- Area of residence (1—non-urban, 2—urban);
- Type of job (0—physical work, 2—intellectually demanding work, 1—both);
- Former dog owner (1—true, 0—false);
- Former cat owner (1—true, 0—false);
- Disability (0—none, 1—40–60% of functionality loss, 2—70–80% of functionality loss, 3—90–100% of functionality loss);
- Marital status (1—married or other type of relationship, 2—widow/widower, 3—divorced/separated, 4—never married);
- Age of retirement;
- Age of starting to work;
- Hobby (1—yes, 0—no);
- Education (0—primary school, 1—middle school, 2—high school, 3—high school and vocational training, 4—vocational training, 5—incomplete higher education, 6—complete higher education, 7—doctoral degree);
- Religion (0—non-religious, 1—religious);
- Grip strength;
5. Discussion
6. Conclusions
Supplementary Materials
Author Contributions
Funding
Institutional Review Board Statement
Informed Consent Statement
Data Availability Statement
Acknowledgments
Conflicts of Interest
Abbreviations
| AADs | aging-associated diseases |
| ADL | activity of daily-living |
| BMI | body mass index |
| CC | correlation coefficient |
| Cholesterol HDL | cholesterol high-density lipoprotein |
| COPD | chronic obstructive pulmonary disease |
| CVD | cardiovascular diseases |
| DM2 | diabetes mellitus type 2 |
| FAB | Frontal Assessment Battery |
| GDS-5 | Geriatric Depression Scale |
| GSs | geriatric syndromes |
| IADL | instrumental activity of daily-living |
| IQR | interquartile range |
| MHT | menopausal hormone therapy |
| MMSE | the Mini-Mental State Examination |
| MNA | Mini Nutritional Assessment |
| OR | odds ratio |
| SARC-F | a Simple Questionnaire to Rapidly Diagnose Sarcopenia |
| SPPB | the Short Physical Performance Battery |
| T3 | triiodothyronine |
References
- Ageing and Health. Available online: https://www.who.int/news-room/fact-sheets/detail/ageing-and-health/ (accessed on 4 October 2021).
- Goroshko, N.V.; Emelyanova, E.K. Socio-Demographic Processes in Modern Russia as an Indicator of the Market of Geriatric Services and Social Support for the Elderly. Vestnik Permskogo universiteta. Philos. Psychol. Sociol. 2019, 2, 241–258. [Google Scholar] [CrossRef]
- Chinnadurai, R.; Ogedengbe, O.; Agarwal, P.; Money-Coomes, S.; Abdurrahman, A.Z.; Mohammed, S.; Kalra, P.A.; Rothwell, N.; Pradhan Chinnadurai, S. Older age and frailty are the chief predictors of mortality in COVID-19 patients admitted to an acute medical unit in a secondary care setting- a cohort study. BMC Geriatr. 2020, 20, 1–11. [Google Scholar] [CrossRef]
- Pan, D.; Sze, S.; Minhas, J.S.; Squire, I.B.; Pareek, M. Frailty and mortality in patients with COVID-19. Lancet Public Health 2020, 5, 581. [Google Scholar] [CrossRef]
- Yanez, N.D.; Weiss, N.S.; Romand, J.-A.; Treggiari, M.M. COVID-19 mortality risk for older men and women. BMC Public Health 2020, 20, 1742. [Google Scholar] [CrossRef]
- Pignolo, R.J. Exceptional Human Longevity. Mayo Clin. Proc. 2019, 94, 110–124. [Google Scholar] [CrossRef]
- Pes, G.M.; Tolu, F.; Dore, M.P.; Sechi, G.P.; Errigo, A.; Canelada, A.; Poulain, M. Male longevity in Sardinia, a review of historical sources supporting a causal link with dietary factors. Eur. J. Clin. Nutr. 2015, 69, 411–418. [Google Scholar] [CrossRef]
- Willcox, D.C.; Willcox, B.J.; Todoriki, H.; Suzuki, M. The Okinawan diet: Health implications of a low-calorie, nutrient-dense, antioxidant-rich dietary pattern low in glycemic load. J. Am. Coll. Nutr. 2009, 28, 500S–516S. [Google Scholar] [CrossRef]
- Rosero-Bixby, L.; Dow, W.H.; Rehkopf, D.H. The Nicoya region of Costa Rica: A high longevity island for elderly males. Vienna Yearb. Popul. Res. 2013, 11, 109–136. [Google Scholar] [CrossRef]
- Edjolo, A.; Helmer, C.; Barberger-Gateau, P.; Dartigues, J.-F.; Maubaret, C.; Pérès, K. Becoming a nonagenarian: Factors associated with survival up to 90 years old in 70+ men and women. Results from the PAQUID longitudinal cohort. J. Nutr. Health Aging 2013, 17, 881–892. [Google Scholar] [CrossRef]
- Brandts, L.; van Poppel, F.W.; van den Brandt, P.A. Parental lifespan and the likelihood of reaching the age of 90 years in the Netherlands Cohort Study. Geriatr. Gerontol. Int. 2021, 21, 215–221. [Google Scholar] [CrossRef]
- SiteSoft. Federal State Statistics Service. Available online: https://rosstat.gov.ru/ (accessed on 17 June 2022).
- What prevents older people from having an active lifestyle? Available online: https://nafi.ru/en/analytics/chto-meshaet-pozhilym-vesti-aktivnyy-obraz-zhizni-/ (accessed on 17 June 2022).
- Stereotypes, vs. Stereotypes vs. global trends: Why most Russians won’t go for outsourcing elderly care. (In Russian). Available online: https://nafi.ru/analytics/stereotipy-protiv-mirovogo-trenda-bolshinstvo-rossiyan-ne-khotyat-otdavat-rodstvennikov-v-doma-prest/ (accessed on 17 June 2022).
- Federal State Statistics Service. Average life expectancy in men and women. (In Russian). 8 January 2020. Available online: https://rosinfostat.ru/prodolzhitelnost-zhizni/? (accessed on 14 June 2022).
- Orthostatic Hypotension (Postural Hypotension). 2022. Available online: https://www.mayoclinic.org/diseases-conditions/orthostatic-hypotension/diagnosis-treatment/drc-20352553 (accessed on 17 June 2022).
- Clinical Guidelines. Frailty. (Approved by the Russian Ministry of Health). (In Russian). Available online: https://sudact.ru/law/klinicheskie-rekomendatsii-starcheskaia-asteniia-utv-minzdravom-rossii/ (accessed on 17 June 2022).
- Di Lego, V.; Di Giulio, P.; Luy, M. Gender Differences in healthy and unhealthy life expectancy. In International Handbook of Health Expectancies, 1st ed.; Jagger, C., Crimmins, E., Saito, Y., De Carvalho Yokota, R., Van Oyen, H., Robine, J.M., Eds.; Springer International Publishing AG: Cham, Switzerland, 2020; Volume 9, pp. 151–172. ISBN 978-3030376666. [Google Scholar]
- Aging. Available online: https://aging.com/prostate-cancer-a-guide-for-aging-men/ (accessed on 16 May 2018).
- Locke, D.E.C.; Ivnik, R.J.; Cha, R.H.; Knopman, D.S.; Tangalos, E.G.; Boeve, B.F.; Petersen, R.C.; Smith, G.E. Age, family history, and memory and future risk for cognitive impairment. J. Clin. Exp. Neuropsychol. 2009, 31, 111–116. [Google Scholar] [CrossRef][Green Version]
- Lautenschlager, N.T.; Cupples, L.A.; Rao, V.S.; Auerbach, S.A.; Becker, R.; Burke, J.; Chui, H.; Duara, R.; Foley, E.J.; Glatt, S.L.; et al. Risk of dementia among relatives of Alzheimer’s disease patients in the MIRAGE study: What is in store for the oldest old? Neurology 1996, 46, 641–650. [Google Scholar] [CrossRef]
- Meyer, A.M.; Becker, I.; Siri, G.; Brinkkötter, P.T.; Benzing, T.; Pilotto, A.; Polidori, M.C. The prognostic significance of geriatric syndromes and resources. Aging Clin. Exp. Res. 2020, 32, 115–124. [Google Scholar] [CrossRef]
- Rausch, C.; van Zon, S.; Liang, Y.; Laflamme, L.; Möller, J.; de Rooij, S.; Bültmann, U. Geriatric syndromes and incident chronic health conditions among 9094 older community-dwellers: Findings from the Lifelines Cohort Study. J. Am. Med. Dir. Assoc. 2021, 21, S1525–S8610. [Google Scholar] [CrossRef]
- Aguila, E.; Casanova, M. Short-term impact of income on cognitive function: Evidence from a sample of Mexican older adults. J. Aging Health 2020, 32, 591–603. [Google Scholar] [CrossRef]
- Cheng, G.; Yan, Y. Sociodemographic, health-related, and social predictors of subjective well-being among Chinese oldest-old: A national community-based cohort study. BMC Geriatr. 2021, 21, 124. [Google Scholar] [CrossRef]
- Swan, L.; Warters, A.; O’Sullivan, M. Socioeconomic inequality and risk of sarcopenia in community-dwelling older adults. Clin. Interv. Aging 2021, 16, 1119–1129. [Google Scholar] [CrossRef]
- Hyejin, L.; Bumjo, O.; Sunyoung, K.; Kiheon, L. ADL/IADL dependencies and unmet healthcare needs in older persons: A nationwide survey. Arch. Gerontol. Geriatr. 2021, 96, 104458. [Google Scholar] [CrossRef]
- Gutiérrez, M.; Tomás, J.M.; Calatayud, P. Contributions of psychosocial factors and physical activity to successful aging. Span. J. Psychol. 2018, 21, E26. [Google Scholar] [CrossRef]
- Avelar-González, A.K.; Bureau-Chávez, M.; Durón-Reyes, D.; Mondragón-Cervantes, M.I.; Jiménez-Acosta, Y.D.C.; Leal-Mora, D.; Díaz-Ramos, J.A. Spirituality and religious practices and its association with geriatric syndromes in older adults attending to a geriatric’s clinic in a university hospital. J. Relig. Health 2020, 59, 2794–2806. [Google Scholar] [CrossRef]
- Miller, K.J.; Suárez-Iglesias, D.; Varela, S.; Rodríguez, D.; Ayán, C. Exercise for nonagenarians: A systematic review. J. Geriatr. Phys. Ther. 2020, 43, 208–218. [Google Scholar] [CrossRef]
- Tolley, A.P.L.; Ramsey, K.A.; Rojer, A.G.M.; Reijnierse, E.M.; Maier, A.B. Objectively measured physical activity is associated with frailty in community-dwelling older adults: A systematic review. J. Clin. Epidemiol. 2021, 137, 218–230. [Google Scholar] [CrossRef]
- Hainer, V.; Aldhoon-Hainerová, I. Obesity paradox does exist. Diabetes Care 2013, 36 (Suppl. S2), S276–S281. [Google Scholar] [CrossRef]
- Read, S.L.; Grundy, E.M.D. Fertility history and cognition in later life. J. Gerontol. Ser. B Psychol. Sci. Soc. Sci. 2017, 72, 1021–1031. [Google Scholar] [CrossRef]
- Grundy, E.; Tomassini, C. Fertility history and health in later life: A record linkage study in England and Wales. Soc. Sci. Med. 2005, 61, 217–228. [Google Scholar] [CrossRef]
- Georgakis, M.K.; Thomopoulos, T.P.; Diamantaras, A.-A.; Kalogirou, E.I.; Skalkidou, A.; Daskalopoulou, S.S.; Petridou, E. Association of age at menopause and duration of reproductive period with depression after menopause: A systematic review and meta-analysis. JAMA Psychiatry 2016, 73, 139–149. [Google Scholar] [CrossRef]
- Henderson, V.W.; Benke, K.S.; Green, R.C.; A Cupples, L.; A Farrer, L. Postmenopausal hormone therapy and Alzheimer’s disease risk: Interaction with age. J. Neurol. Neurosurg. Psychiatry 2005, 76, 103–105. [Google Scholar] [CrossRef]
- Whitmer, R.A.; Quesenberry, C.P.; Zhou, J.; Yaffe, K. Timing of hormone therapy and dementia: The critical window theory revisited. Ann. Neurol. 2011, 69, 163–169. [Google Scholar] [CrossRef]
- Zhang, Z.; Pereira, S.L.; Luo, M.; Matheson, E.M. Evaluation of blood biomarkers associated with risk of malnutrition in older adults: A systematic review and meta-analysis. Nutrients 2017, 9, 829. [Google Scholar] [CrossRef]
- Hirata, T.; Arai, Y.; Yuasa, S.; Abe, Y.; Takayama, M.; Sasaki, T.; Kunitomi, A.; Inagaki, H.; Endo, M.; Morinaga, J.; et al. Associations of cardiovascular biomarkers and plasma albumin with exceptional survival to the highest ages. Nat. Commun. 2020, 11, 3820. [Google Scholar] [CrossRef]
- Can, B.; Kara, O.; Kizilarslanoglu, M.C.; Arik, G.; Aycicek, G.S.; Sumer, F.; Civelek, R.; Demirtas, C.; Ulger, Z. Serum markers of inflammation and oxidative stress in sarcopenia. Aging Clin. Exp. Res. 2017, 29, 745–752. [Google Scholar] [CrossRef]
- Wang, L.; Wang, F.; Liu, J.; Zhang, Q.; Lei, P. Inverse relationship between baseline serum albumin levels and risk of mild cognitive impairment in elderly: A seven-year retrospective cohort Study. Tohoku J. Exp. Med. 2018, 246, 51–57. [Google Scholar] [CrossRef]
- Ritchie, S.C.; Kettunen, J.; Brozynska, M.; Nath, A.P.; Havulinna, A.S.; Männistö, S.; Perola, M.; Salomaa, V.; Ala-Korpela, M.; Abraham, G.; et al. Elevated serum alpha-1 antitrypsin is a major component of GlycA-associated risk for future morbidity and mortality. PLoS ONE 2019, 14, e0223692. [Google Scholar] [CrossRef]
- Ceciliani, F.; Lecchi, C. The immune functions of α1 Acid Glycoprotein. Curr. Protein Pept. Sci. 2019, 20, 505–524. [Google Scholar] [CrossRef]
- Calice-Silva, V.; Suemoto, C.K.; Brunoni, A.R.; Bensenor, I.M.; Lotufo, P.A. Association between GlycA and cognitive function: Cross-sectional results from the ELSA-Brasil Study. Alzheimer Dis. Assoc. Disord. 2021, 35, 128–134. [Google Scholar] [CrossRef]
- Gruppen, E.G.; Kunutsor, S.K.; Kieneker, L.M.; van der Vegt, B.; Connelly, M.A.; de Bock, G.H.; Gansevoort, R.T.; Bakker, S.J.; Dullaart, R.P.; Vegt, B.; et al. GlycA, a novel pro-inflammatory glycoprotein biomarker is associated with mortality: Results from the PREVEND study and meta-analysis. J. Intern. Med. 2019, 286, 596–609. [Google Scholar] [CrossRef]
- Soysal, P.; Arik, F.; Smith, L.; Jackson, S.E.; Isik, A.T. Inflammation, frailty and cardiovascular disease. Frailty Cardiovasc. Dis. 2020, 1216, 55–64. [Google Scholar] [CrossRef]
- Chhetri, J.K.; de Souto Barreto, P.; Fougère, B.; Rolland, Y.; Vellas, B.; Cesari, M. Chronic inflammation and sarcopenia: A regenerative cell therapy perspective. Exp. Gerontol. 2018, 103, 115–123. [Google Scholar] [CrossRef]
- Newcombe, E.A.; Camats-Perna, J.; Silva, M.L.; Valmas, N.; Huat, T.J.; Medeiros, R. Inflammation: The link between comorbidities, genetics, and Alzheimer’s disease. J. Neuroinflamm. 2018, 15, 276. [Google Scholar] [CrossRef]
- Franceschi, C.; Garagnani, P.; Parini, P.; Giuliani, C.; Santoro, A. Inflammaging: A new immune-metabolic viewpoint for age-related diseases. Nat. Rev. Endocrinol. 2018, 14, 576–590. [Google Scholar] [CrossRef]
- Kong, S.H.; Kim, J.H.; Park, Y.J.; Lee, J.H.; Hong, A.R.; Shin, C.S.; Cho, N.H. Low free T3 to free T4 ratio was associated with low muscle mass and impaired physical performance in community-dwelling aged population. Osteoporos. Int. 2020, 31, 525–531. [Google Scholar] [CrossRef]
- Di Iorio, A.; Paganelli, R.; Abate, M.; Barassi, G.; Ireland, A.; Macchi, C.; Molino-Lova, R.; Cecchi, F. Thyroid hormone signaling is associated with physical performance, muscle mass, and strength in a cohort of oldest-old: Results from the Mugello study. GeroScience 2021, 43, 1053–1064. [Google Scholar] [CrossRef]
- Xiu, S.; Mu, Z.; Zhao, L.; Sun, L. Low free triiodothyronine levels are associated with risk of frailty in older adults with type 2 diabetes mellitus. Exp. Gerontol. 2020, 138, 111013. [Google Scholar] [CrossRef]
- Bertoli, A.; Valentini, A.; Cianfarani, M.A.; Gasbarra, E.; Tarantino, U.; Federici, M. Low FT3: A possible marker of frailty in the elderly. Clin. Interv. Aging 2017, 12, 335–341. [Google Scholar] [CrossRef]
- Arosio, B.; Monti, D.; Mari, D.; Passarino, G.; Ostan, R.; Ferri, E.; De Rango, F.; Franceschi, C.; Cesari, M.; Vitale, G. Thyroid hormones and frailty in persons experiencing extreme longevity. Exp. Gerontol. 2020, 138, 111000. [Google Scholar] [CrossRef]
- Ferri, E.; Casati, M.; Cesari, M.; Vitale, G.; Arosio, B. Vitamin D in physiological and pathological aging: Lesson from centenarians. Rev. Endocr. Metab. Disord. 2019, 20, 273–282. [Google Scholar] [CrossRef]
- Marcos-Pérez, D.; Sánchez-Flores, M.; Proietti, S.; Bonassi, S.; Costa, S.; Teixeira, J.; Fernández-Tajes, J.; Pásaro, E.; Valdiglesias, V.; Laffon, B. Low vitamin D levels and frailty status in older adults: A systematic review and meta-analysis. Nutrients 2020, 12, 2286. [Google Scholar] [CrossRef]
- Zuliani, G.; Volpato, S.; Dugo, M.; Vigna, G.B.; Morieri, M.L.; Maggio, M.; Cherubini, A.; Bandinelli, S.; Guralnik, J.M.; Ferrucci, L. Combining LDL-C and HDL-C to predict survival in late life: The InChianti study. PLoS ONE 2017, 12, e0185307. [Google Scholar] [CrossRef]
- Feingold, K.R. Introduction to lipids and lipoproteins. In Endotext [Internet]; Feingold, K.R., Anawalt, B., Boyce, A., Chrousos, G., de Herder, W.W., Dhatariya, K., Dungan, K., Hershman, J.M., Hofland, J., Kalra, S., et al., Eds.; MDText.com, Inc.: South Dartmouth, MA, USA, 2000. Available online: https://www.ncbi.nlm.nih.gov/books/NBK305896 (accessed on 17 June 2021).
- Wang, S.; Liu, M.; Yang, S.; Wang, J.; Jia, W.; Cao, W.; Han, K.; He, Y. Higher normal levels of triglyceride and low and high-density lipoprotein cholesterol might have a protective effect against activities of daily living disability within chinese female centenarians: A cross-sectional, complete sample study. Clin. Interv. Aging 2020, 15, 225–237. [Google Scholar] [CrossRef]


| In All Participants (n = 2020) | In Men (n = 504) | In Women (n = 1516) | p-Value for the Difference between Men and Women | |
|---|---|---|---|---|
| age (mean ± sd) | 93 ± 2.5 | 94 ± 2.39 | 94 ± 2.58 | 0.61 |
| BMI (mean ± sd) | 25.91 ± 4.5 | 25.45 ± 3.61 | 26.07 ± 4.76 | 0.009 |
| Smoke status n (%) | ||||
| current smoker | 9 (0.5%) | 6 (1%) | 3 (0.2%) | <0.001 |
| ex-smoker | 231 (12%) | 195 (40%) | 36 (2%) | |
| Physical activity n (%) | ||||
| Unable to get out of bed ** | 269 (14%) | 37 (7%) | 232 (16%) | <0.001 |
| Able to move inside the house but unable to leave the house ** | 618 (31%) | 117 (23%) | 501 (34%) | <0.001 |
| Leaves the house only when necessary | 262 (13%) | 60 (12%) | 202 (14%) | 0.41 |
| Able to go for a walk * | 715 (36%) | 231 (46%) | 484 (33%) | <0.001 |
| Performs physical exercise * | 117 (6%) | 53 (11%) | 64 (4%) | <0.001 |
| Presence of AADs | ||||
| Cancer * | 141 (7%) | 61 (12%) | 80 (5%) | <0.001 |
| CVD * | 1380 (69%) | 369 (74%) | 1011(68%) | <0.001 |
| DM2 | 291 (15%) | 59 (12%) | 233 (16%) | 0.04 |
| Alzheimer’s disease | 272 (18%) | 53 (14%) | 219 (19%) | 0.01 |
| COPD | 277 (14%) | 86 (17%) | 191 (13%) | 0.01 |
| Average number of AADs (mean ± sd) | 1 ± 1 | 1 ± 1 | 1 ± 1 | 0.22 |
| Average number of received medicines (mean ± sd) | 5 ± 2 | 5 ± 2 | 4 ± 2 | 0.35 |
| Presence of GSs | ||||
| Cognitive impairment ** | 1016 (53%) | 207 (43%) | 809 (56%) | <0.001 |
| Frontal lobe dysfunction | 1495 (77%) | 358 (73%) | 1137(78%) | 0.03 |
| Chronic pain ** | 1236 (63%) | 277 (55%) | 959 (65%) | <0.001 |
| Depression ** | 956 (49%) | 205 (42%) | 751 (51%) | <0.001 |
| Anxiety disorder ** | 471 (36%) | 96 (27%) | 375 (38%) | <0.001 |
| Orthostatic hypotension | 361 (27%) | 113 (30%) | 248 (26%) | 0.14 |
| Risk of falls ** | 1122 (57%) | 247 (49%) | 875 (59%) | <0.001 |
| Sensory deficit | 1841 (94%) | 463 (92%) | 1378(94%) | 0.34 |
| Sarcopenia | 1417 (83%) | 369 (83%) | 1048(82%) | 0.63 |
| Fecal or urinary incontinence ** | 1464 (73%) | 309 (61%) | 1155(76%) | <0.001 |
| Dependence in ADL ** | 1800 (92%) | 402 (82%) | 1398(94%) | <0.001 |
| Dependence in IADL | 1859 (94%) | 450 (91%) | 1409(95%) | 0.005 |
| Polypragmasia | 935 (51%) | 236 (51%) | 699 (50%) | 0.69 |
| Frailty ** | 1786 (89%) | 411 (81%) | 1375(90%) | <0.001 |
| Risk of malnutrition ** | 1517 (86%) | 346 (77%) | 1171(89%) | <0.001 |
| Average number of GS (mean ± sd) | 10 ± 2 | 9 ± 2 | 10 ± 2 | <0.001 |
| Factor | GS | CC or OR | n |
|---|---|---|---|
| Family history | |||
| Father’s age at death (median = 68, IQR = (50, 76)) | Risk of falls | CC −0.14 | 1518 |
| Relative with cognitive decline (memory loss) | Fecal or urinary incontinence | OR 2.1 | 1784 |
| Depression | OR 2.85 | 1737 | |
| Risk of malnutrition | OR 2.91 | 1611 | |
| Frontal lobe dysfunction | OR 4.47 | 1725 | |
| Orthostatic hypotension | OR 1.82 | 1229 | |
| Anxiety disorder | OR 1.81 | 1266 | |
| Cognitive impairment | OR 2.43 | 1704 | |
| Socioeconomic factors | |||
| Education | Cognitive impairment | CC −0.23 | 1854 |
| Frontal lobe dysfunction | CC −0.16 | 1883 | |
| Age of the first employment (median = 17, IQR = (14, 20)) | Depression | CC −0.13 | 1723 |
| Frontal lobe dysfunction | CC −0.29 | 1716 | |
| Chronic pain | CC −0.13 | 1763 | |
| Anxiety disorder | CC −0.1 | 1235 | |
| job type | Cognitive impairment | CC −0.18 | 1827 |
| Age of retiring (median = 64, IQR = (57, 70)) | Cognitive impairment | CC −0.14 | 1649 |
| Frontal lobe dysfunction | CC −0.13 | 1680 | |
| Income at the peak of the career | Cognitive impairment | CC −0.181 | 1397 |
| Obstetric and gynecological history | |||
| Age at the first childbirth (median = 24, IQR = (22, 27)) | Cognitive impairment | CC −0.11 | 1031 |
| Number of pregnancies (median = 2, IQR = (1, 3)) | Chronic pain | CC 0.11 | 1274 |
| Age at menopause onset (median = 50, IQR = (48, 55)) | Orthostatic hypotension | CC −0.17 | 791 |
| Depression | CC −0.15 | 1096 | |
| Frontal lobe dysfunction | CC −0.31 | 1095 | |
| Dependence in IADL | CC −0.1 | 1096 | |
| Lifestyle | |||
| Long-term urban resident | Polypragmasia | OR 2.43 | 1422 |
| Religion | Orthostatic hypotension | OR 0.57 | 1305 |
| Depression | OR 0.62 | 1852 | |
| Risk of malnutrition | OR 1.07 | 1716 | |
| Frontal lobe dysfunction | OR 0.43 | 1848 | |
| Church attendance | Frontal lobe dysfunction | CC −0.126 | 1852 |
| Depression | CC −0.112 | 1857 | |
| Having a hobby | Cognitive impairment | OR 0.28 | 1341 |
| Risk of malnutrition | OR 0.32 | 1291 | |
| Sarcopenia | OR 0.35 | 1277 | |
| Dependence in IADL | OR 0.31 | 1386 | |
| Depression | OR 0.59 | 1352 | |
| Frontal lobe dysfunction | OR 0.61 | 1361 | |
| Current cat owner | Sarcopenia | OR 0.47 | 1307 |
| Former cat owner | Chronic pain | OR 2.82 | 1446 |
| Current dog owner | Sarcopenia | OR 0.49 | 1310 |
| Risk of falls | OR 1.79 | 1459 | |
| Former dog owner | Chronic pain | OR 1.87 | 1451 |
| Receiving guests | Depression | CC −0.15 | 1851 |
| Frontal lobe dysfunction | CC −0.138 | 1842 | |
| Physical activity | |||
| Lifelong physical activity | Sarcopenia | OR 0.27 | 1259 |
| Risk of falls | OR 1.85 | 1387 | |
| Orthostatic hypotension | OR 2.79 | 960 | |
| Frontal lobe dysfunction | OR 1.82 | 1341 | |
| Dependence in ADL | OR 0.36 | 1351 | |
| Dependence in IADL | OR 0.36 | 1368 | |
| Chronic pain | OR 2.33 | 1383 | |
| Risk of malnutrition | OR 0.63 | 1272 | |
| Current physical activity | Cognitive impairment | CC −0.267 | 1876 |
| Frailty | CC −0.251 | 1978 | |
| Dependence in ADL | CC −0.256 | 1934 | |
| Depression | CC −0.225 | 1909 | |
| Fecal or urinary incontinence | CC −0.206 | 1977 | |
| Sarcopenia | CC −0.166 | 1703 | |
| Frontal lobe dysfunction | CC −0.148 | 1905 | |
| Risk of malnutrition | CC −0.324 | 1752 | |
| Dependence in IADL | CC −0.263 | 1943 | |
| Walks and their duration | Risk of malnutrition | CC −0.325 | 1754 |
| Dependence in IADL | CC −0.253 | 1942 | |
| Dependence in ADL | CC −0.248 | 1932 | |
| Frailty | CC −0.223 | 1978 | |
| Depression | CC −0.202 | 1907 | |
| Cognitive impairment | CC −0.21 | 1877 | |
| Sarcopenia | CC −0.172 | 1706 | |
| Fecal or urinary incontinence | CC −0.17 | 1977 | |
| Factors, reflecting current health status | |||
| Insomnia severity index (median = 8, IQR = (4, 13)) | Depression | CC −0.319 | 251 |
| Sensory deficit | CC −0.239 | 246 | |
| Waist circumference (median = 89, IQR = (80, 97)) | Chronic pain | CC −0.125 | 1643 |
| Sarcopenia | CC −0.102 | 1518 | |
| Health self-assessment | Frontal lobe dysfunction | CC −0.312 | 1675 |
| Frailty | CC −0.22 | 1711 | |
| Cognitive impairment | CC −0.198 | 1637 | |
| Dependence in ADL | CC −0.194 | 1674 | |
| Risk of malnutrition | CC −0.198 | 1571 | |
| Orthostatic hypotension | CC −0.192 | 1238 | |
| Risk of falls | CC −0.163 | 1711 | |
| Chronic pain | CC −0.16 | 1708 | |
| Fecal or urinary incontinence | CC −0.124 | 1709 | |
| Blood Test Results | GSs | CC | n |
|---|---|---|---|
| Total protein (median = 70, IQR = (65, 75)) | Dependence in IADL | CC −0.09 | 1937 |
| Frailty | CC −0.08 | 1978 | |
| Frontal lobe dysfunction | CC 0.14 | 1893 | |
| Risk of malnutrition | CC −0.13 | 1735 | |
| Sarcopenia | CC −0.09 | 1691 | |
| Orthostatic hypotension | CC −0.14 | 1296 | |
| Alpha 1 globulins (median = 3.2, IQR = (2.9, 3.5)) | Cognitive impairment | CC 0.08 | 1862 |
| Frailty | CC 0.08 | 1974 | |
| Frontal lobe dysfunction | CC 0.13 | 1891 | |
| Risk of malnutrition | CC 0.12 | 1734 | |
| Cholesterol HDL (median = 1.26, IQR = (1.06, 1.53)) | Cognitive impairment | CC −0.09 | 1874 |
| Dependence in ADL | CC −0.07 | 1937 | |
| Frailty | CC −0.08 | 1987 | |
| T3 free (median = 3.6, IQR = (3.2, 4)) | Cognitive impairment | CC −0.08 | 1868 |
| Dependence in IADL | CC −0.07 | 1938 | |
| Frailty | CC −0.1 | 1980 | |
| Risk of malnutrition | CC −0.14 | 1736 | |
| Sarcopenia | CC −0.1 | 1692 | |
| 25-OH-D (median = 8, IQR = (5, 12)) | Cognitive impairment | CC −0.13 | 1872 |
| Dependence in ADL | CC −0.1 | 1934 | |
| Dependence in IADL | CC −0.1 | 1944 | |
| Frailty | CC −0.1 | 1985 | |
| Polypragmasia | CC 0.09 | 1802 | |
| Risk of malnutrition | CC −0.11 | 1743 | |
| Albumin (median = 35, IQR = (38, 41)) | Chronic pain | CC 0.08 | 1921 |
| Cognitive impairment | CC −0.15 | 1862 | |
| Dependence in ADL | CC −0.12 | 1924 | |
| Dependence in IADL | CC −0.13 | 1933 | |
| Frailty | CC −0.14 | 1974 | |
| Incontinence | CC −0.08 | 1970 | |
| Risk of malnutrition | CC −0.18 | 1734 | |
| Sarcopenia | CC −0.14 | 1690 | |
| Orthostatic hypotension | CC 0.09 | 1295 | |
| Total protein (median = 70, IQR = (65, 75)) | Presence of AADs | CC −0.13 | 1975 |
| Cholesterol HDL (median = 1.26, IQR = (1.06, 1.53)) | CC −0.06 | 1984 | |
| T3 free (median = 3.6, IQR = (3.2, 4)) | CC −0.11 | 1977 | |
| 25-OH-D (median = 8, IQR = (5, 12)) | CC −0.08 | 1982 | |
| Albumin (median = 28.3, IQR = (35.1, 41.5)) | CC −0.14 | 1971 |
| Cluster 0 | Cluster 1. Successful Aging | p-Value | ||||||||
|---|---|---|---|---|---|---|---|---|---|---|
| men | 172 | 259 | 2.14 × 10⁻⁶ | |||||||
| women | 674 | 591 | ||||||||
| age (median [IQR])) | 94 (92, 96) | 93 (92, 95) | ||||||||
| Family history | ||||||||||
| Family history of cognitive decline | 26% | 8% | 3.95 × 10⁻²¹ | |||||||
| Lifestyle | ||||||||||
| Religion | 72% | 79% | 2.47 × 10⁻⁴ | |||||||
| Life-long hobby | 36% | 48% | 5.88 × 10⁻⁶ | |||||||
| Education | ||||||||||
| Primary education | 15% | 4% | 1.34 × 10⁻¹⁹ | |||||||
| Middle school | 13% | 12% | ||||||||
| High school | 21% | 15% | ||||||||
| Vocational education | 5% | 5% | ||||||||
| High school and vocational education | 16% | 16% | ||||||||
| Incomplete higher education | 1% | 2% | ||||||||
| Higher education | 27% | 41% | ||||||||
| Doctoral degree | 2% | 5% | ||||||||
| Job type | ||||||||||
| Intellectually and physically demanding job | 33% | 18% | 3.76 × 10⁻¹¹ | |||||||
| Intellectually demanding job | 29% | 38% | ||||||||
| Physically demanding job | 38% | 44% | ||||||||
| Age of the first employment | 17 (14, 20) | 19 (15, 20) | 9.43 × 10⁻¹⁵ | |||||||
| Age of retiring | 60 (55, 68) | 65 (60, 70) | 3.55 × 10⁻¹³ | |||||||
| Currently employed | <1% | 2% | 7.83 × 10⁻⁵ | |||||||
| Income at the peak of the career | ||||||||||
| Low | 17% | 6% | 3.4 × 10⁻⁶ | |||||||
| Middle | 71% | 79% | ||||||||
| High | 13% | 15% | ||||||||
| Disability | ||||||||||
| no | 16% | 15% | 3.34 × 10⁻⁴ | |||||||
| 40–60% of functionality loss | 3% | 3% | 6.35 × 10⁻⁸ | |||||||
| 70–80% of functionality loss | 58% | 70% | ||||||||
| 90–100% of functionality loss | 23% | 12% | ||||||||
| Obstetrics-gynecologic history | ||||||||||
| Age of the menopause onset | 50 (48, 52) | 52 (50, 55) | 1.57 × 10⁻¹⁸ | |||||||
| Physical examination | ||||||||||
| Clock-drawing test | 4 (0, 6) | 8 (5, 10) | 1.22 × 10−77 | |||||||
| Weight | 65 (56, 74) | 69 (60, 78) | 3.19 × 10⁻⁸ | |||||||
| Waist circumference | 88 (78, 96) | 90 (83, 98) | 1.07 × 10⁻⁶ | |||||||
| MMSE * | 18 (13, 22) | 26 (24, 28) | 1.02 × 10−194 | |||||||
| Age is not a barrier test | 4 (3, 5) | 6 (2, 4) | 1.98 × 10⁻²⁵ | |||||||
| SPPB * | 1 (0, 3) | 5 (2, 7) | 2.64 × 10−92 | |||||||
| Charlson comorbidity index | 2 (1, 4) | 1 (0, 3) | 9.11 × 10⁻³¹ | |||||||
| BMI | 25 (22.5, 28) | 26.1 (23.6, 29.2) | 1.98 × 10⁻⁶ | |||||||
| GDS-5 | 2 (1, 4) | 1 (0, 2) | 3.09 × 10−36 | |||||||
| Vision without glasses | ||||||||||
| Good | 19% | 22% | 4.74 × 10⁻⁵ | |||||||
| Average | 34% | 43% | ||||||||
| Bad | 47% | 35% | ||||||||
| Syndromes and diseases | ||||||||||
| Frontal lobe disorder * | 97% | 43% | 7.72 × 10−121 | |||||||
| Hippocampus dysfunction | 55% | 11% | 4.64 × 10−78 | |||||||
| Alzheimer’s disease | 34% | 46% | 3.95 × 10−39 | |||||||
| Health self-assessment (10 grade scale) | 5 (3, 6) | 6 (5, 7) | 1.49 × 10−42 | |||||||
| Quality of life self-assessment (10 grade scale) | 5 (4, 7) | 7 (6, 8) | 8.38 × 10⁻³¹ | |||||||
| Number of aging-associated diseases | 1 (1, 2) | 1 (1, 2) | 9.93 × 10⁻⁶ | |||||||
| Frequency of taking a walk | ||||||||||
| No walks | 58% | 37% | 5.12 × 10⁻⁵ | |||||||
| Everyday | 15% | 30% | ||||||||
| Several times a week | 12% | 18% | ||||||||
| Once a week | 4% | 8% | ||||||||
| Less often | 11% | 8% | ||||||||
| Church attendance | ||||||||||
| No attendance | 53% | 38% | 1.43 × 10⁻⁵ | |||||||
| occasionally | 33% | 48% | ||||||||
| regularly | 14% | 14% | ||||||||
| Physical activity | ||||||||||
| Unable to get out of bed | 20% | 3% | 8.19 × 10⁻³⁰ | |||||||
| Able to move inside the house but unable to leave the house | 34% | 28% | ||||||||
| Leaves the house only when necessary | 11% | 16% | ||||||||
| Able to go for a walk | 30% | 45% | ||||||||
| Performs physical exercise | 4% | 8% | ||||||||
| Duration of walks | ||||||||||
| does not go for walk | 58% | 37% | 2.56 × 10⁻¹⁵ | |||||||
| less than 15 min | 4% | 2% | ||||||||
| 15-30 min | 8% | 16% | ||||||||
| 30-60 min | 14% | 26% | ||||||||
| more than 1 h | 16% | 19% | ||||||||
| Guests and Communication | ||||||||||
| receiving guests | visiting | going out | communication through phone/Internet | using Internet | ||||||
| cluster | 0 | 1 | 0 | 1 | 0 | 1 | 0 | 1 | 0 | 1 |
| does not | 40% | 25% | 76% | 42% | 40% | 25% | 40% | 12% | 94% | 88% |
| 1-2 times a year | 16% | 18% | 14% | 16% | 12% | 8% | 2% | 3% | 2% | 2% |
| 1-2 times a month | 27% | 40% | 8% | 29% | 15% | 13% | 11% | 16% | 2% | 2% |
| 1-2 times a week | 15% | 14% | 2% | 12% | 17% | 23% | 21% | 32% | 2% | 2% |
| everyday | 2% | 3% | 0% | 1% | 16% | 31% | 26% | 37% | 0% | 6% |
| p-value | 1.09 × 10⁻⁷ | 1.35 × 10⁻⁷ | 5.11 × 10⁻¹⁹ | 5.35 × 10⁻³⁰ | 6.35 × 10⁻⁸ | |||||
| Cluster 0 | Cluster 1. The Least Successful Aging | p-Value | ||||||
|---|---|---|---|---|---|---|---|---|
| men | 289 | 51 | 0.02 | |||||
| women | 792 | 209 | ||||||
| age (median [IQR]) | 93 (92, 95) | 94 (92, 96) | ||||||
| Family history | ||||||||
| Family history of cognitive decline | 12% | 32% | 7.21 × 10⁻¹⁴ | |||||
| Lifestyle | ||||||||
| Life-long hobby | 46% | 29% | 4.78 × 10⁻⁶ | |||||
| Education | ||||||||
| Primary education | 6% | 16% | 1.64 × 10⁻⁸ | |||||
| Middle school | 15% | 14% | ||||||
| High school | 15% | 23% | ||||||
| Vocational education | 4% | 6% | ||||||
| High school and vocational education | 17% | 13% | ||||||
| Incomplete higher education | 2% | 2% | ||||||
| Higher education | 38% | 25% | ||||||
| Doctoral degree | 3% | 1% | ||||||
| Job type | ||||||||
| Intellectually and physically demanding job | 22% | 35% | 3.01 × 10⁻⁴ | |||||
| Intellectually demanding job | 35% | 30% | ||||||
| Physically demanding job | 43% | 35% | ||||||
| Age of retiring | 65 (60, 70) | 60 (55, 68) | 1.27 × 10⁻⁵ | |||||
| Income at the peak of the career | ||||||||
| Low | 9% | 18% | 7.72 × 10⁻⁵ | |||||
| Middle | 76% | 71% | ||||||
| High | 15% | 11% | ||||||
| Physical examination | ||||||||
| Clock-drawing test | 7 (5, 9) | 3 (0, 5) | 3.39 × 10−41 | |||||
| Waist circumference | 90 (81, 98) | 87.5 (78, 95) | 8.88 × 10⁻⁴ | |||||
| MMSE * | 25 (22, 27) | 15 (11, 16) | 2.09 × 10−135 | |||||
| Age is not a barrier test | 3 (2, 4) | 5 (3, 5) | 1.66 × 10⁻²⁸ | |||||
| SPPB * | 4 (2, 7) | 1 (0, 2) | 2.43 × 10−55 | |||||
| Charlson comorbidity index | 2 (1, 3) | 3 (2, 4) | 2.01 × 10⁻²¹ | |||||
| GDS-5 | 1 (0, 3) | 3 (1, 4) | 4.75 × 10⁻²⁶ | |||||
| Vision without glasses | ||||||||
| Good | 20% | 15% | 4.17 × 10⁻⁵ | |||||
| Average | 43% | 32% | ||||||
| Bad | 37% | 53% | ||||||
| Syndromes and diseases | ||||||||
| Frontal lobe disorder * | 60% | 94% | 8.45 × 10⁻²⁷ | |||||
| Hippocampus dysfunction | 19% | 67% | 1.23 × 10−50 | |||||
| Alzheimer’s disease | 9% | 49% | 5.62 × 10−44 | |||||
| Health self-assessment (10 grade scale) | 6 (5, 7) | 4 (3, 5) | 1.29 × 10⁻²⁸ | |||||
| Quality of life self-assessment (10 grade scale) | 7 (5, 8) | 5 (3, 7) | 1.29 × 10⁻²² | |||||
| Number of aging-associated diseases | 1 (1, 2) | 1 (1, 2) | 1.44 × 10⁻⁷ | |||||
| Church attendance | ||||||||
| No attendance | 39% | 52% | 2.42 × 10⁻⁴ | |||||
| occasionally | 44% | 38% | ||||||
| regularly | 15% | 10% | ||||||
| Physical activity | ||||||||
| Unable to get out of bed | 5% | 27% | 4.69 × 10⁻²¹ | |||||
| Able to move inside the house but unable to leave the house | 32% | 38% | ||||||
| Leaves the house only when necessary | 15% | 7% | ||||||
| Able to go for a walk | 42% | 28% | ||||||
| Performs physical exercise | 6% | 0% | ||||||
| Duration of walks | ||||||||
| does not go for walk | 58% | 68% | 2.72 × 10⁻¹⁴ | |||||
| less than 15 min | 4% | 7% | ||||||
| 15−30 min | 8% | 7% | ||||||
| 30−60 min | 14% | 10% | ||||||
| more than 1 h | 16% | 8% | ||||||
| Guests and Communication | ||||||||
| receiving guests | visiting | going out | communication through phone/Internet | |||||
| cluster | 0 | 1 | 0 | 1 | 0 | 1 | 0 | 1 |
| does not | 28% | 50% | 49% | 76% | 27% | 48% | 15% | 43% |
| 1−2 times a year | 18% | 14% | 17% | 14% | 11% | 11% | 3% | 3% |
| 1−2 times a month | 37% | 22% | 23% | 9% | 15% | 15% | 15% | 13% |
| 1−2 times a week | 14% | 13% | 10% | 1% | 22% | 17% | 30% | 24% |
| everyday | 4% | 1% | 1% | 0% | 25% | 9% | 37% | 17% |
| p-value | 2.08 × 10⁻⁸ | 6.21 × 10⁻¹⁷ | 8.50 × 10⁻¹⁴ | 9.03 × 10⁻²⁴ | ||||
Publisher’s Note: MDPI stays neutral with regard to jurisdictional claims in published maps and institutional affiliations. |
© 2022 by the authors. Licensee MDPI, Basel, Switzerland. This article is an open access article distributed under the terms and conditions of the Creative Commons Attribution (CC BY) license (https://creativecommons.org/licenses/by/4.0/).
Share and Cite
Kashtanova, D.A.; Taraskina, A.N.; Erema, V.V.; Akopyan, A.A.; Ivanov, M.V.; Strazhesko, I.D.; Akinshina, A.I.; Yudin, V.S.; Makarov, V.V.; Kraevoy, S.A.; et al. Analyzing Successful Aging and Longevity: Risk Factors and Health Promoters in 2020 Older Adults. Int. J. Environ. Res. Public Health 2022, 19, 8178. https://doi.org/10.3390/ijerph19138178
Kashtanova DA, Taraskina AN, Erema VV, Akopyan AA, Ivanov MV, Strazhesko ID, Akinshina AI, Yudin VS, Makarov VV, Kraevoy SA, et al. Analyzing Successful Aging and Longevity: Risk Factors and Health Promoters in 2020 Older Adults. International Journal of Environmental Research and Public Health. 2022; 19(13):8178. https://doi.org/10.3390/ijerph19138178
Chicago/Turabian StyleKashtanova, Daria A., Anastasiia N. Taraskina, Veronika V. Erema, Anna A. Akopyan, Mikhail V. Ivanov, Irina D. Strazhesko, Alexandra I. Akinshina, Vladimir S. Yudin, Valentin V. Makarov, Sergey A. Kraevoy, and et al. 2022. "Analyzing Successful Aging and Longevity: Risk Factors and Health Promoters in 2020 Older Adults" International Journal of Environmental Research and Public Health 19, no. 13: 8178. https://doi.org/10.3390/ijerph19138178
APA StyleKashtanova, D. A., Taraskina, A. N., Erema, V. V., Akopyan, A. A., Ivanov, M. V., Strazhesko, I. D., Akinshina, A. I., Yudin, V. S., Makarov, V. V., Kraevoy, S. A., Korolev, D. E., Tarasova, I. V., Beloshevskaya, O. A., Mkhitaryan, E. A., Tkacheva, O. N., & Yudin, S. M. (2022). Analyzing Successful Aging and Longevity: Risk Factors and Health Promoters in 2020 Older Adults. International Journal of Environmental Research and Public Health, 19(13), 8178. https://doi.org/10.3390/ijerph19138178