
Allocation of Flood Drainage Rights in Watershed Using a Hybrid FBWM-Grey-TOPSIS Method: A Case Study of the Jiangsu Section of the Sunan Canal, China


Abstract
:1. Introduction
2. Materials and Methods
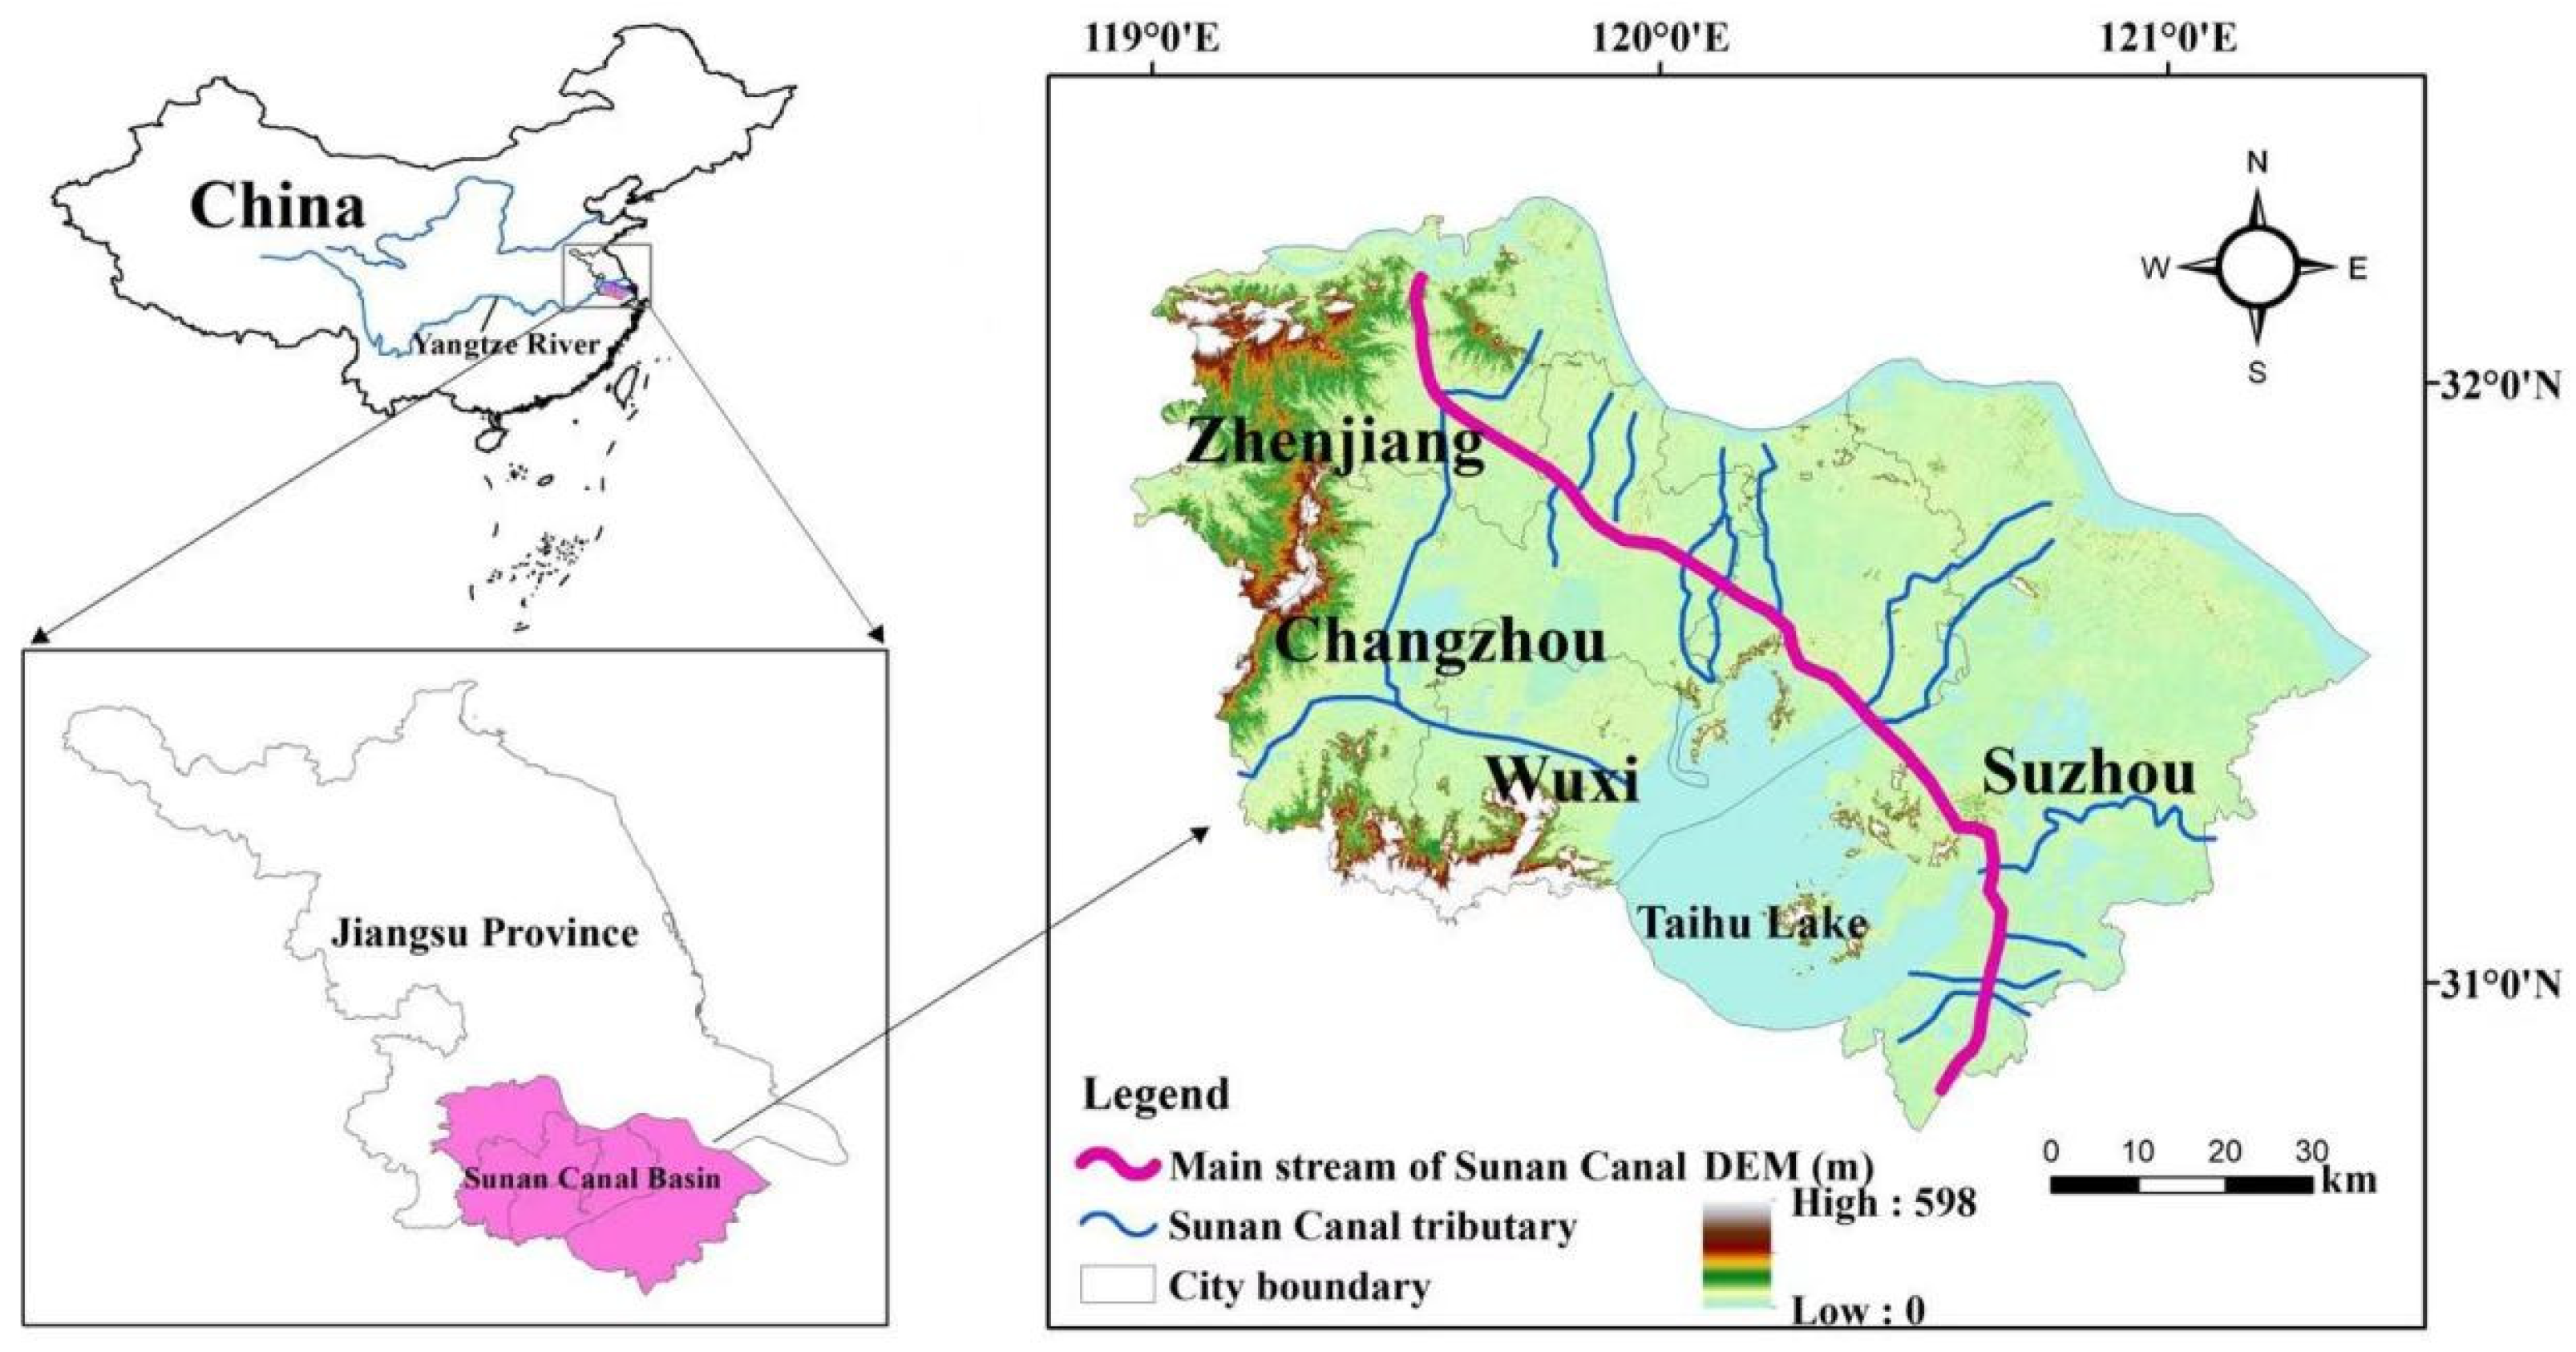
2.1. Research Area
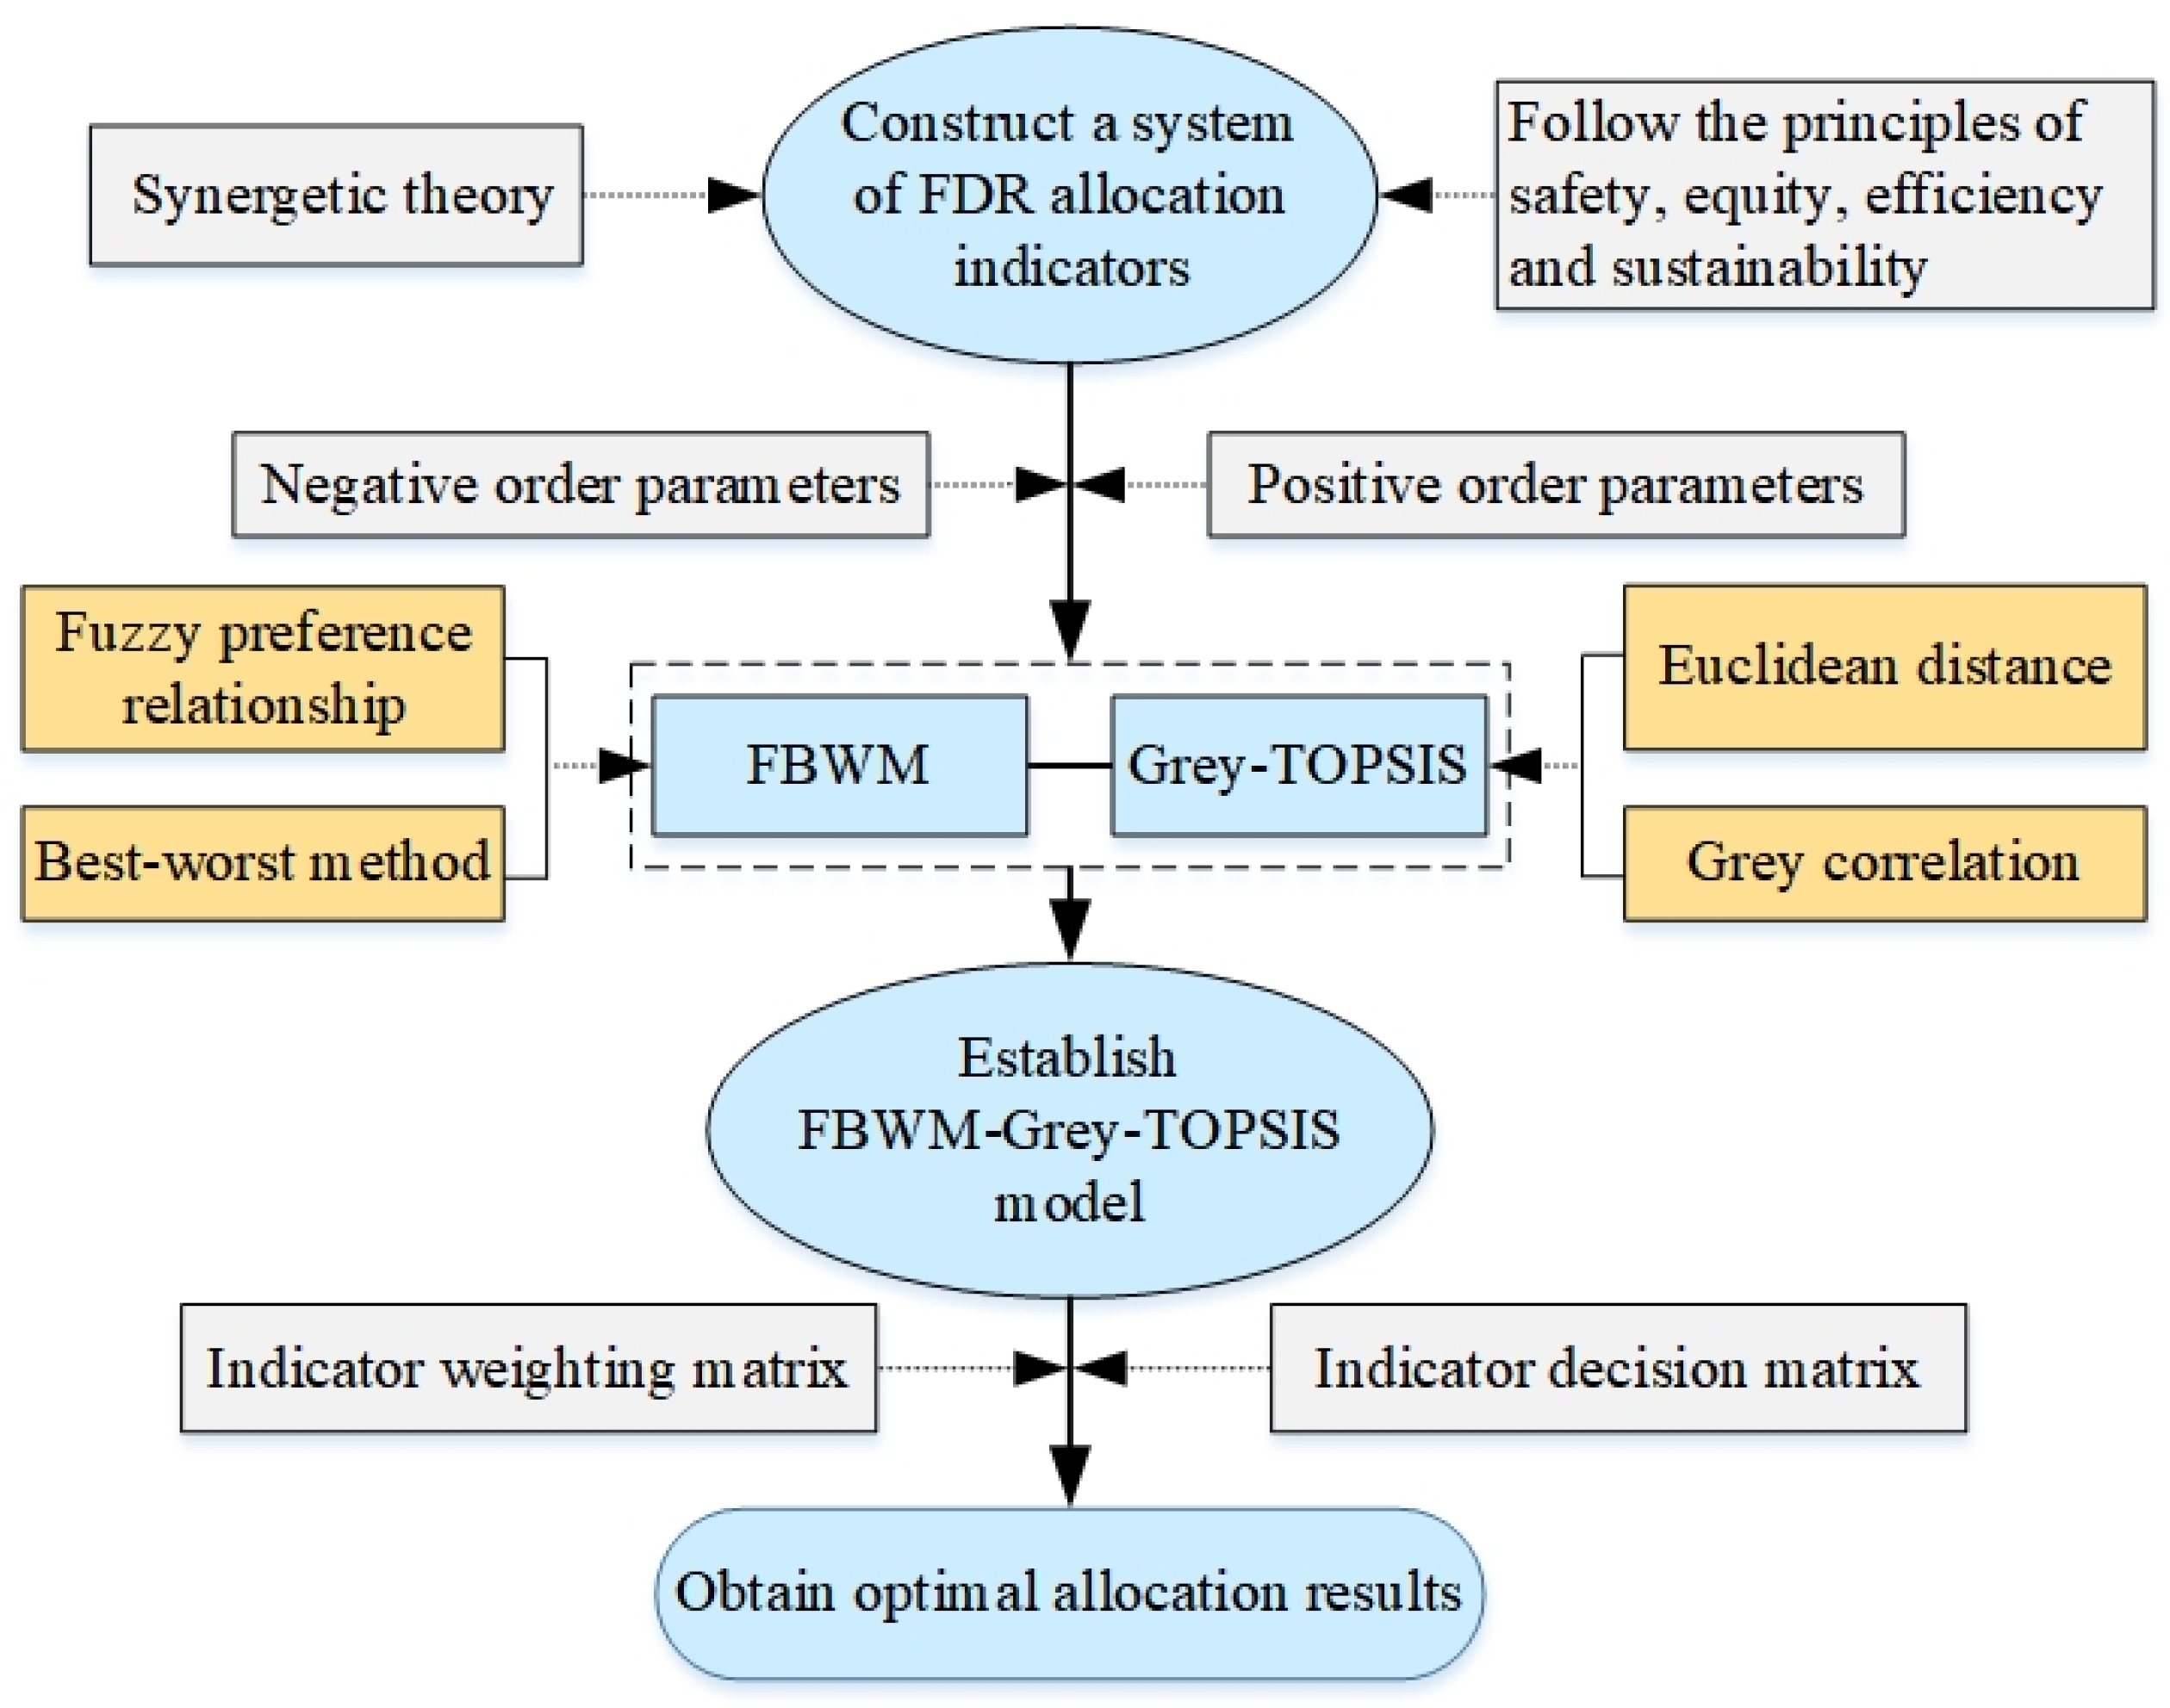
2.2. Methods
2.2.1. Construction of Indicator System
- (1)
- Economic subsystem
- (2)
- Social subsystem
- (3)
- Natural environment subsystem
2.2.2. Normalize the Raw Data
2.2.3. Fuzzy Best–Worst Method (FBWM)
- Step I: Determine a set of indicators
- Step II: Select the best indicator () and the worst indicator ()
- Step III: Execute fuzzy reference comparisons of the best indicator
- Step IV: Execute the fuzzy reference comparisons of the worst indicator
- Step V: Derive the optimal fuzzy weights ()
2.2.4. Grey-TOPSIS
- (1)
- Build the normalized weighted decision matrix
- (2)
- Determine the positive and negative ideal solutions and
- (3)
- Calculate Euclidean distance and grey correlation
- (4)
- Construct Grey-Euclidean Distance Measures
- (5)
- Calculate the relative closeness
- (6)
- Calculate FDR allocation ratio
3. Results
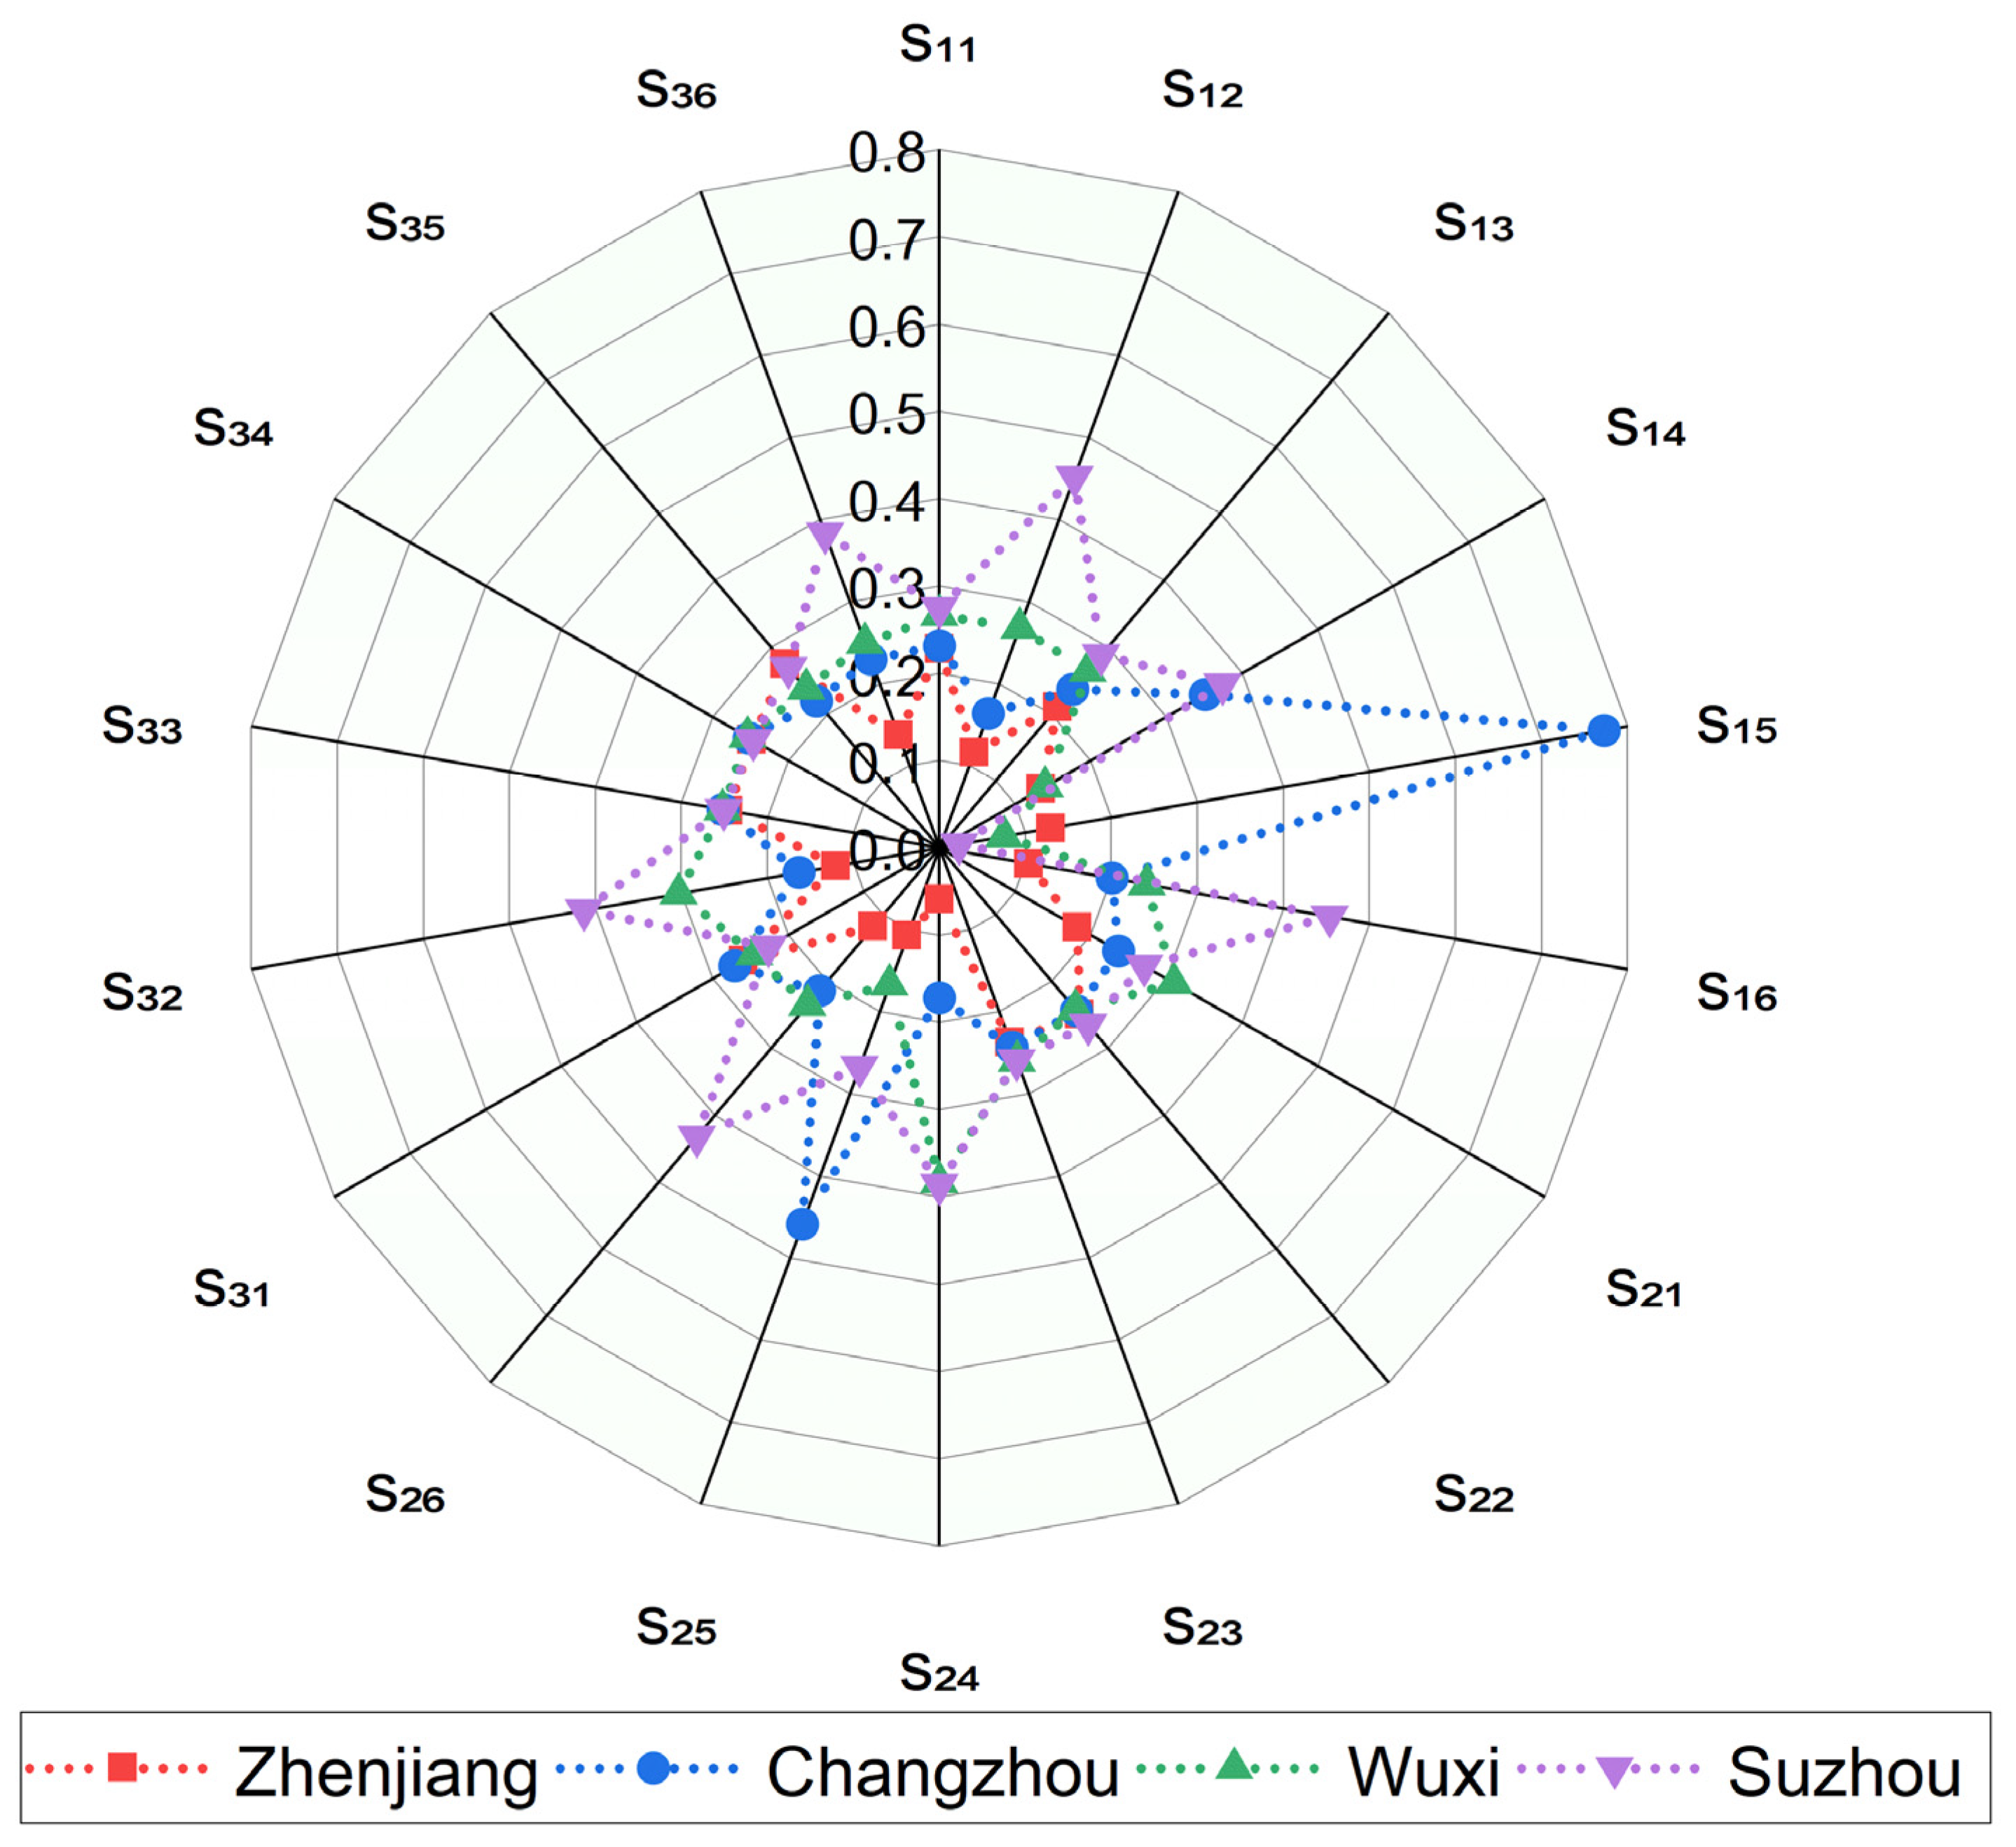
3.1. Indicator Normalization Results
3.2. Determination of Indicator Weights
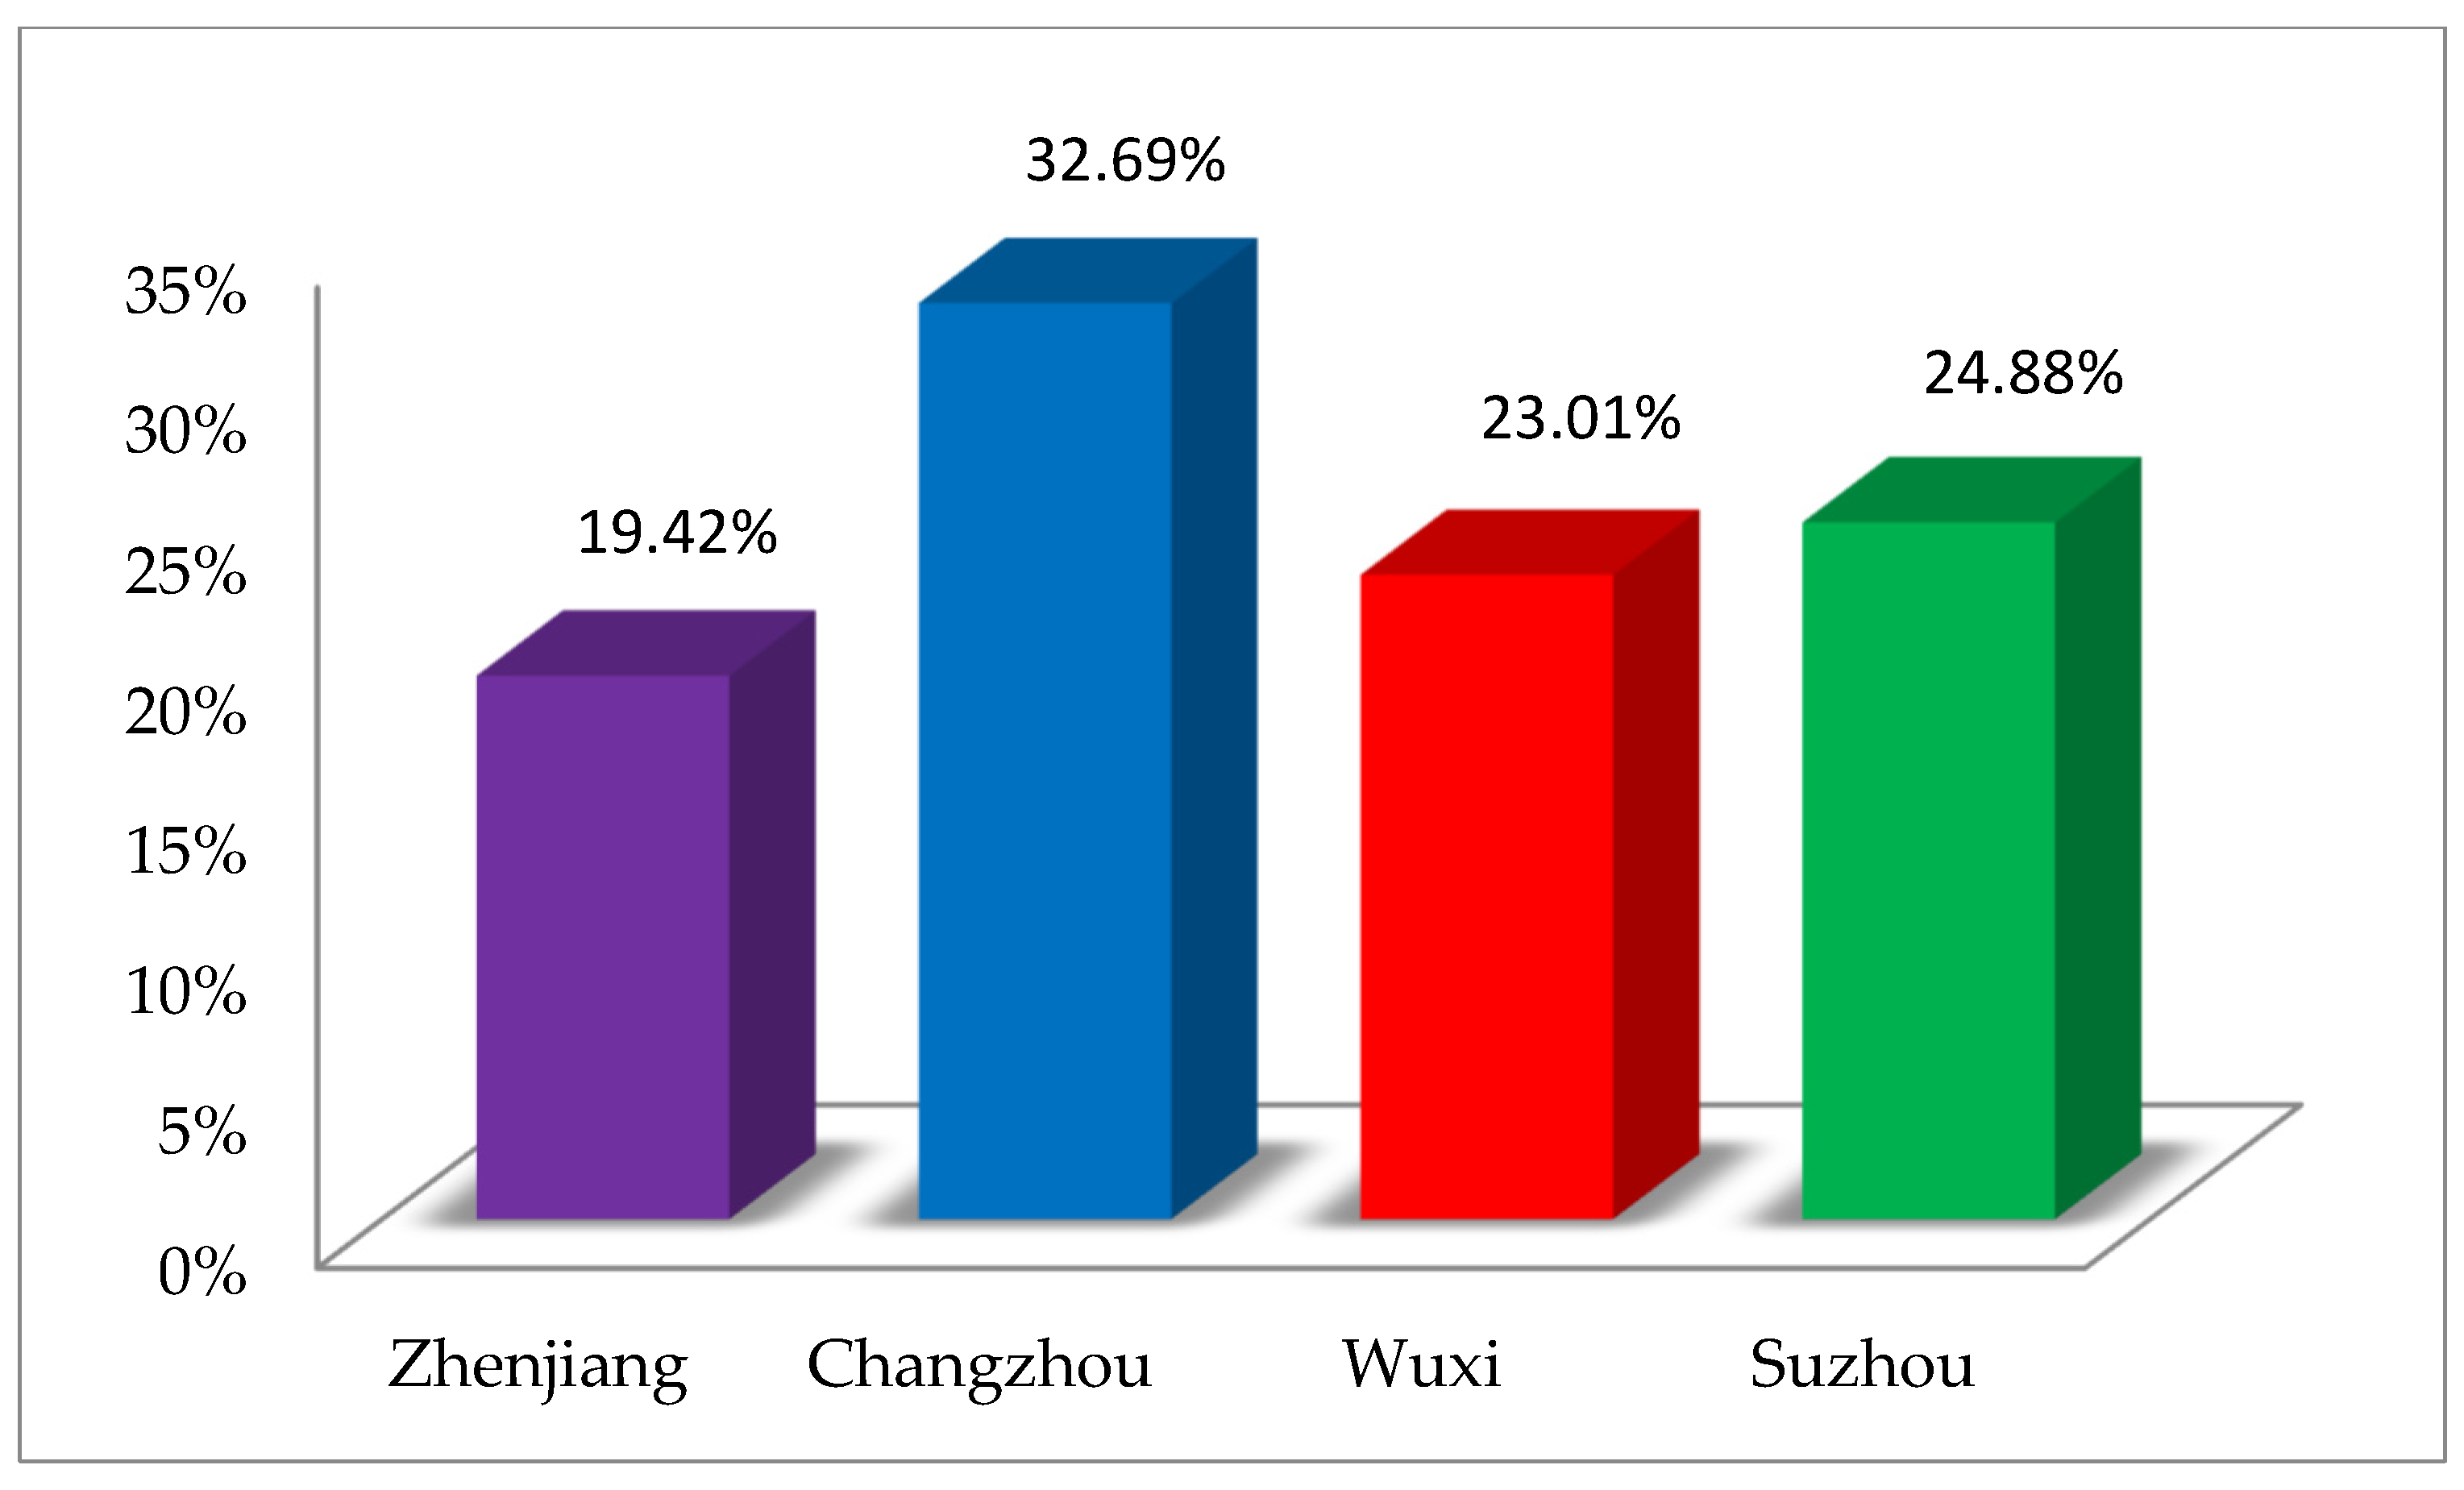
3.3. Allocation Result of FDR
4. Discussions
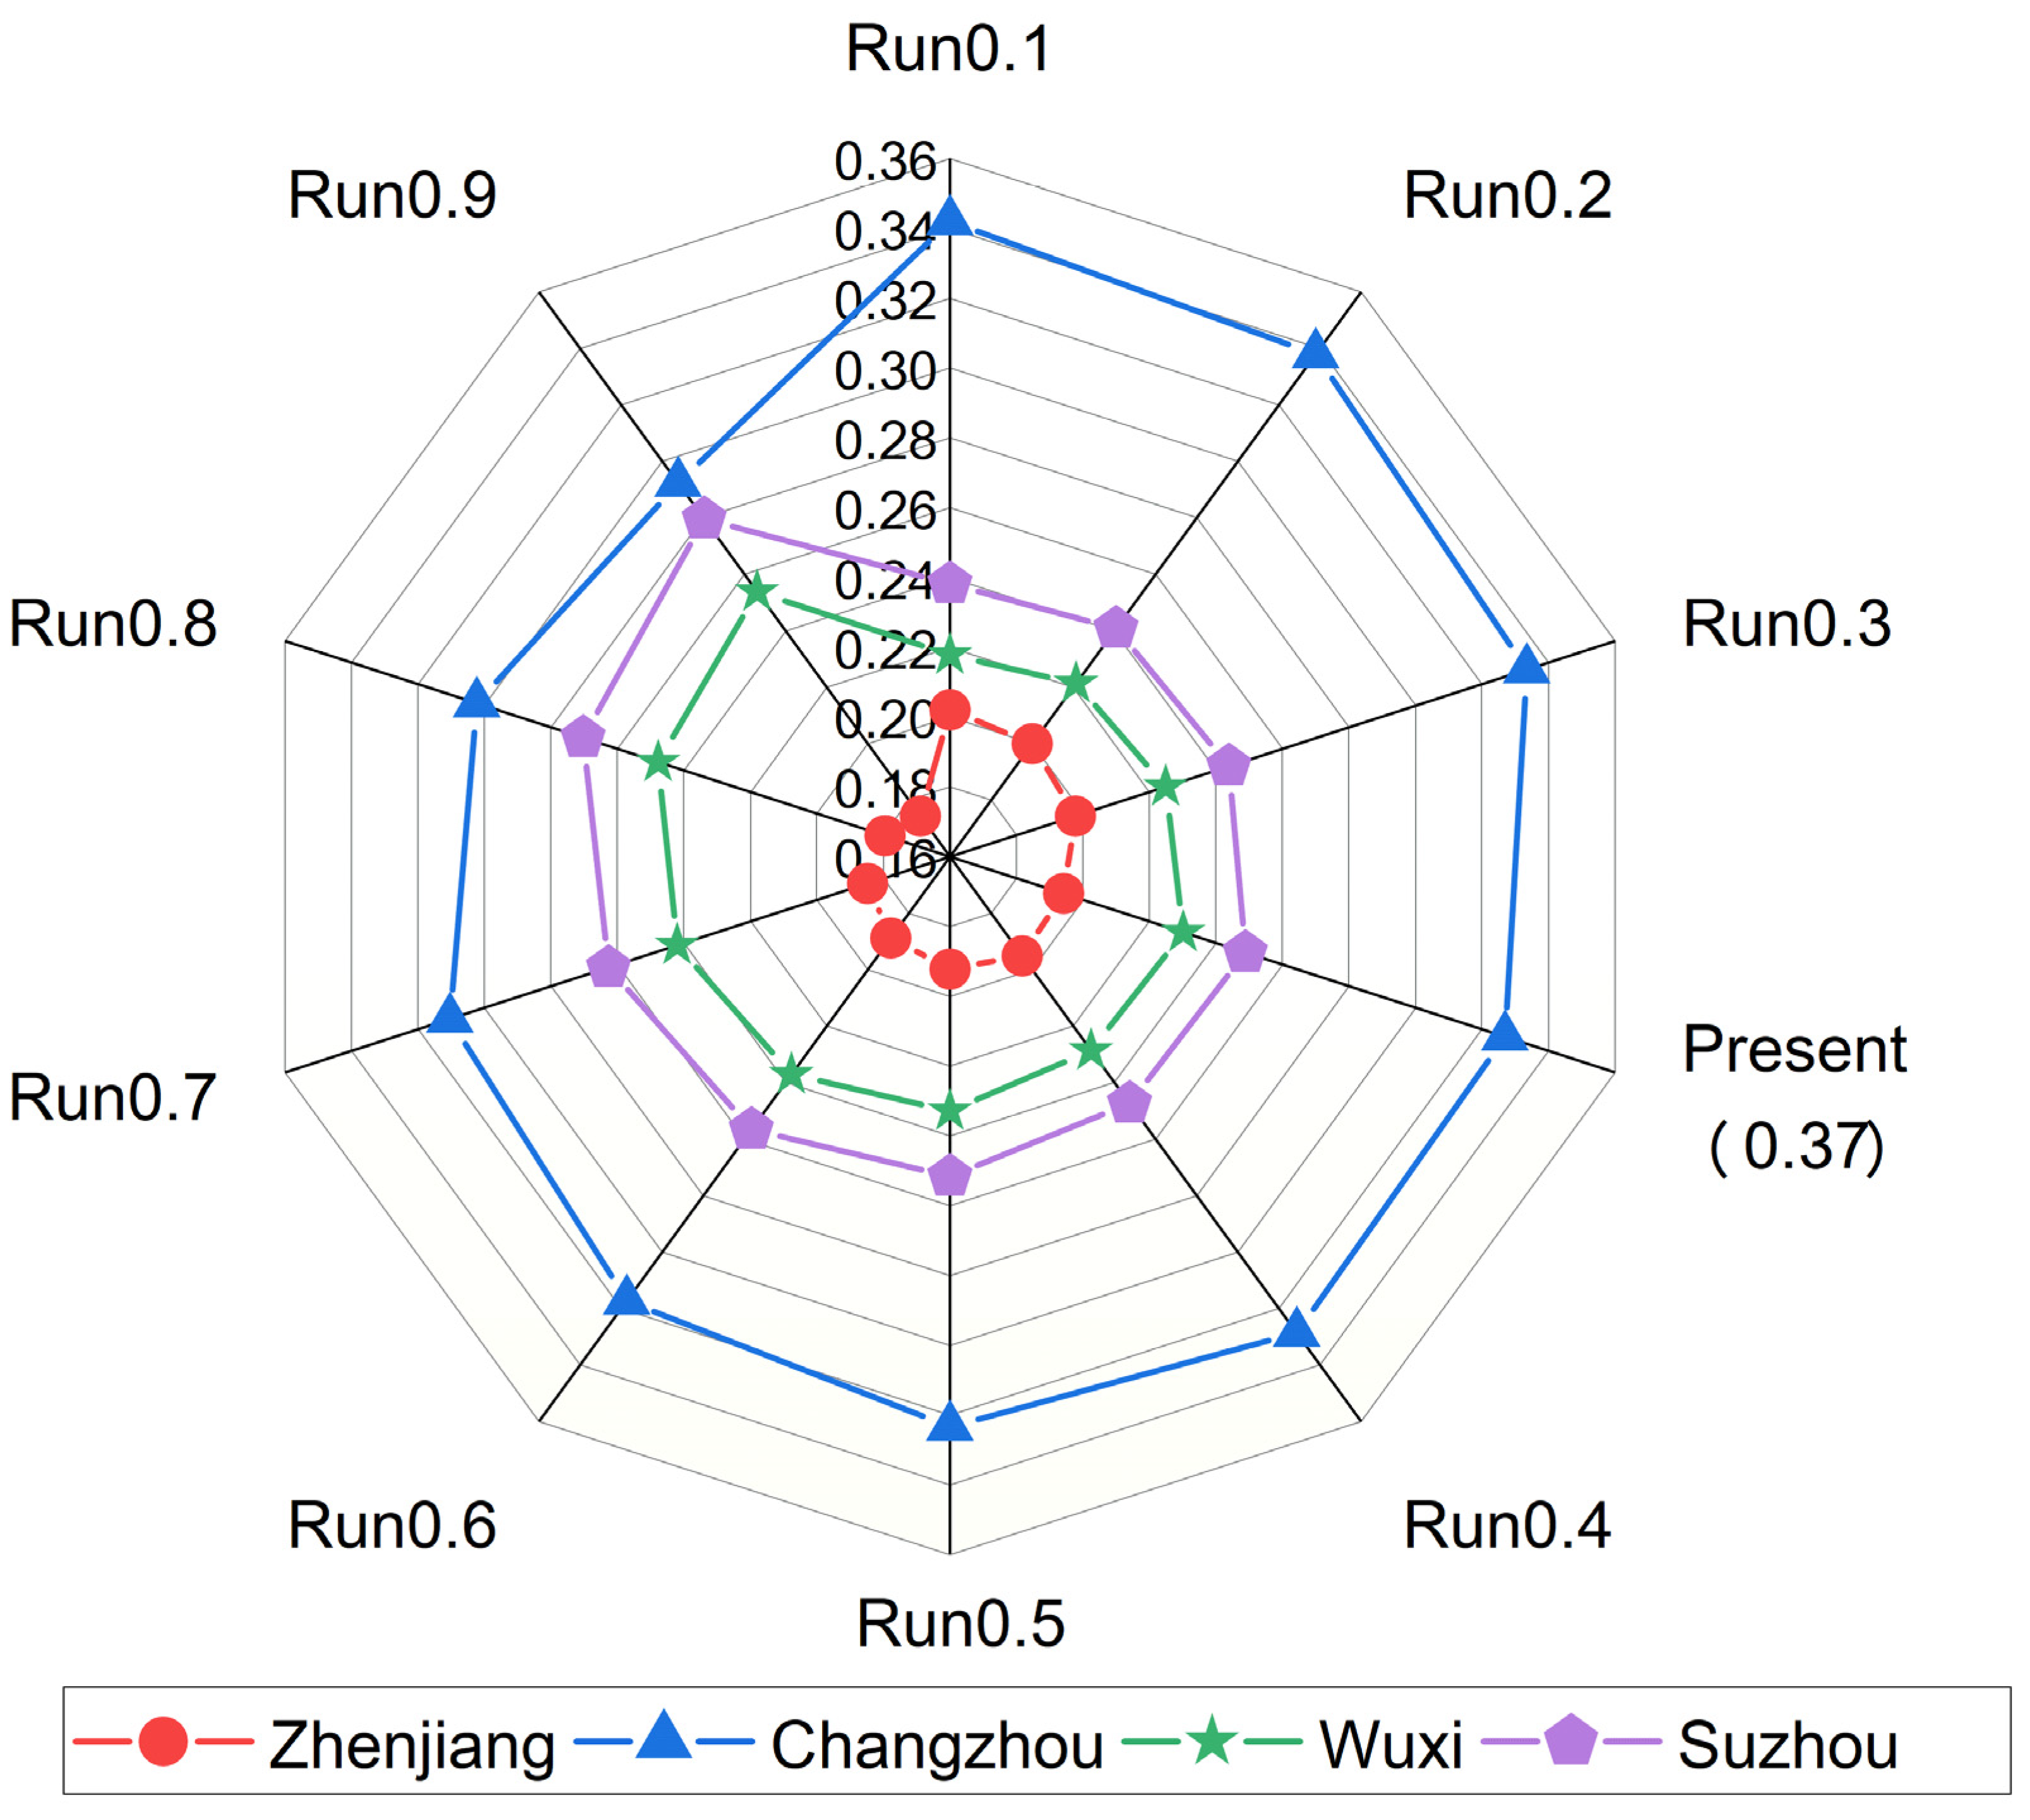
4.1. Sensitivity Analysis
4.2. Comparisons with Other Methods
5. Conclusions
Author Contributions
Funding
Data Availability Statement
Acknowledgments
Conflicts of Interest
References
- Hirabayashi, Y.; Mahendran, R.; Koirala, S.; Konoshima, L.; Yamazaki, D.; Watanabe, S.; Kim, H.; Kanae, S. Global flood risk under climate change. Nat. Clim. Chang. 2013, 3, 816–821. [Google Scholar] [CrossRef]
- Choubin, B.; Moradi, E.; Golshan, M.; Adamowski, J.; Sajedi-Hosseini, F.; Mosavi, A. An ensemble prediction of flood susceptibility using multivariate discriminant analysis, classification and regression trees, and support vector machines. Sci. Total Environ. 2019, 651, 2087–2096. [Google Scholar] [CrossRef] [PubMed]
- He, Y.; Gong, Z. China’s regional rainstorm floods disaster evaluation based on grey incidence multiple-attribute decision model. Nat. Hazards 2013, 71, 1125–1144. [Google Scholar] [CrossRef]
- Visser, H.; Petersen, A.C.; Ligtvoet, W. On the relation between weather-related disaster impacts, vulnerability and climate change. Clim. Chang. 2014, 125, 461–477. [Google Scholar] [CrossRef] [Green Version]
- Kundzewicz, Z.W.; Pińskwar, I.; Brakenridge, G.R. Changes in river flood hazard in Europe: A review. Hydrol. Res. 2018, 49, 294–302. [Google Scholar] [CrossRef]
- Wang, Y.; Fang, Z.; Hong, H.; Peng, L. Flood susceptibility mapping using convolutional neural network frameworks. J. Hydrol. 2020, 582, 124482. [Google Scholar] [CrossRef]
- Zhou, B.; Qian, J. Changes of weather and climate extremes in the IPCC AR6. Progress. Inquisitiones Mutat.Clim. 2021, 17, 713–718. [Google Scholar]
- Winsemius, H.C.; Aerts, J.C.J.H.; van Beek, L.P.H.; Bierkens, M.F.P.; Bouwman, A.; Jongman, B.; Kwadijk, J.C.J.; Ligtvoet, W.; Lucas, P.L.; van Vuuren, D.P.; et al. Global drivers of future river flood risk. Nat. Clim.Chang. 2016, 6, 381–385. [Google Scholar] [CrossRef]
- Kron, W.; Eichner, J.; Kundzewicz, Z.W. Reduction of flood risk in Europe—Reflections from a reinsurance perspective. J. Hydrol. 2019, 576, 197–209. [Google Scholar] [CrossRef]
- Zhang, K.; Shen, J.; Han, H.; Zhang, J. Study of the Allocation of Regional Flood Drainage Rights in Watershed Based on Entropy Weight TOPSIS Model: A Case Study of the Jiangsu Section of the Huaihe River, China. Int. J. Environ. Res. Public Health 2020, 17, 5020. [Google Scholar] [CrossRef]
- Wang, L.; Cai, Y.; Chen, H.; Daler, D.; Zhao, J.; Yang, J. Flood disaster in Taihu Basin, China: Causal chain and policy option analyses. Environ. Earth Sci. 2011, 63, 1119–1124. [Google Scholar]
- Shi, Y.; Zhai, G.; Zhou, S.; Lu, Y.; Chen, W.; Deng, J. How Can Cities Respond to Flood Disaster Risks under Multi-Scenario Simulation? A Case Study of Xiamen, China. Int. J. Environ. Res. Public Health 2019, 16, 618. [Google Scholar] [CrossRef] [PubMed] [Green Version]
- Dadson, S.J.; Hall, J.W.; Murgatroyd, A.; Acreman, M.; Bates, P.; Beven, K.; Heathwaite, L.; Holden, J.; Holman, I.P.; Lane, S.N.; et al. A restatement of the natural science evidence concerning catchment-based ‘natural’ flood management in the UK. Proc. Math. Phys. Eng. Sci. 2017, 473, 20160706. [Google Scholar] [CrossRef] [PubMed] [Green Version]
- Temmerman, S.; Meire, P.; Bouma, T.J.; Herman, P.M.; Ysebaert, T.; de Vriend, H.J. Ecosystem-based coastal defence in the face of global change. Nature 2013, 504, 79–83. [Google Scholar] [CrossRef] [PubMed]
- Glaus, A.; Mosimann, M.; Rothlisberger, V.; Ingold, K. How flood risks shape policies: Flood exposure and risk perception in Swiss municipalities. Reg. Environ. Change 2020, 20, 120. [Google Scholar] [CrossRef] [PubMed]
- Zhang, K. Research on China’s Drainage Rights Trading Management under the Quasi Market:Based on the Perspective of Evolutionary Game. J. Henan Univ. Soc.Sci. 2019, 59, 21–29. [Google Scholar]
- Shen, J.; Li, L.; Zhang, K.; Sun, F.; Zhang, D. Initial allocation of water discharge right based on chaos optimization- projection pursuit. Resour. Ind. 2019, 21, 39–49. [Google Scholar]
- Shen, J.; Zhao, M.; Wang, C.; Zhang, D.; Zhan, Q.; Sun, F. Allocation of water drainage right based on combined weight of game theory-TOPSIS model. J. Econ. Water Resour. 2021, 39, 42–48. [Google Scholar]
- Zhang, J.; Zhang, C.; Liu, L.; Shen, J.; Zhang, D.; Sun, F. Necessity and feasibility of allocation and trading of drainage rights in Jiangsu Province. Water Resour. Prot. 2019, 35, 25–28. [Google Scholar]
- Zeng, X.; Xiang, H.; Liu, J.; Xue, Y.; Zhu, J.; Xu, Y. Identification of Policies Based on Assessment-Optimization Model to Confront Vulnerable Resources System with Large Population Scale in a Big City. Int. J. Environ. Res. Public Health 2021, 18, 13097. [Google Scholar] [CrossRef]
- Zeng, X.; Zhang, S.; Feng, J.; Huang, G.; Li, Y.; Zhang, P.; Chen, J.; Li, K. A multi-reservoir based water-hydroenergy management model for identifying the risk horizon of regional resources-energy policy under uncertainties. Energy Convers. Manag. 2017, 143, 66–84. [Google Scholar] [CrossRef]
- Zeng, X.; Zhang, S.; Li, T.; Xue, Y.; Zhao, J.; Fu, Y.; Zhang, J.; Chen, C.; Kong, X.; Zhang, J. A risk-simulation based optimization model for wetland reallocation on Yongding floodplain, China. Ecol. Indic. 2021, 123, 107342. [Google Scholar] [CrossRef]
- Zeng, X.; Yang, X.; Yu, L.; Chen, H.J.W. A mix inexact-quadratic fuzzy water resources management model of floodplain (IQT-WMMF) for regional sustainable development of Dahuangbaowa, China. Water 2015, 7, 2771–2795. [Google Scholar] [CrossRef] [Green Version]
- Yu, F.C.; Wang, Y.Z.; Yuan, X.J.; Jiang, S.M. Preliminary Study on Concept and Its Basic Characteristics of Flood Drainage Right. J. Irrig. Drain. 2014, 33, 134–137. [Google Scholar]
- Zhang, D.; Shen, J.; Sun, F.; Liu, B.; Wang, Z.; Zhang, K.; Li, L. Research on the Allocation of Flood Drainage Rights of the Sunan Canal Based on a Bi-level Multi-Objective Programming Model. Water 2019, 11, 1769. [Google Scholar] [CrossRef] [Green Version]
- Sun, F.; Lai, X.; Shen, J.; Nie, L.; Gao, X. Initial allocation of flood drainage rights based on a PSR model and entropy-based matter-element theory in the Sunan Canal, China. PLoS ONE 2020, 15, e0233570. [Google Scholar]
- Zhang, D.; Shen, J.; Liu, P.; Zhang, Q.; Sun, F. Use of Fuzzy Analytic Hierarchy Process and Environmental Gini Coefficient for Allocation of Regional Flood Drainage Rights. Int. J. Environ. Res. Public Health 2020, 17, 2063. [Google Scholar] [CrossRef] [Green Version]
- Zhang, K.; Shen, J.; Guo, L.; Boyer, E.W.; Mello, C.R.; Lan, P.; Liu, H.; Gao, J.; Fan, B. Flood drainage rights in watersheds based on the harmonious allocation method. J. Hydrol. 2021, 601, 126627. [Google Scholar] [CrossRef]
- Jiang, Y.C.; Huang, X.J.; Xu, X.Y. Pricing Method and Case Study on the Cost of Drainage Rights: A Case Study of the Qinhuai River Basin. Resour. Environ. Yangtze Basin 2021, 30, 1308–1316. [Google Scholar]
- Shen, J.; Zhan, Q.; Cao, Q.; Sun, F.; Zhang, K.; Zhang, D.; Zhao, M. Pricing method for transaction of drainage rights based on full cost method and its application. J. Econ. WaterResour. 2022, 40, 79–84, 88. [Google Scholar]
- Omrani, H.; Alizadeh, A.; Emrouznejad, A. Finding the optimal combination of power plants alternatives: A multi response Taguchi-neural network using TOPSIS and fuzzy best-worst method. J. Clean. Prod. 2018, 203, 210–223. [Google Scholar] [CrossRef] [Green Version]
- Xu, Y.; Zhu, X.; Wen, X.; Herrera-Viedma, E. Fuzzy best-worst method and its application in initial water rights allocation. Appl. Soft Comput. 2021, 101, 107007. [Google Scholar] [CrossRef]
- Guo, S.; Zhao, H. Fuzzy best-worst multi-criteria decision-making method and its applications. Knowl.-Based Syst. 2017, 121, 23–31. [Google Scholar] [CrossRef]
- Hwang, C.L.; Yoon, K. Multi Attribute Decision Making Method and Applications; Springer: Berlin/Heidelberg, Germany, 1981. [Google Scholar]
- Liu, D.; Qi, X.; Fu, Q.; Li, M.; Zhu, W.; Zhang, L.; Faiz, M.A.; Khan, M.I.; Li, T.; Cui, S. A resilience evaluation method for a combined regional agricultural water and soil resource system based on Weighted Mahalanobis distance and a Gray-TOPSIS model. J. Clean. Prod. 2019, 229, 667–679. [Google Scholar] [CrossRef]
- Rezaei, J. Best-worst multi-criteria decision-making method. Omega 2015, 53, 49–57. [Google Scholar] [CrossRef]
- Dong, J.; Wan, S.; Chen, S.-M. Fuzzy best-worst method based on triangular fuzzy numbers for multi-criteria decision-making. Inf. Sci. 2021, 547, 1080–1104. [Google Scholar] [CrossRef]
- Zhao, H.; Li, J.; Mi, Z.; Pu, L.; Cui, Y. Grading evaluation of power quality based on CRITIC and improved Grey-TOPSIS. Power Syst. Prot. Control. 2022, 50, 1–8. [Google Scholar] [CrossRef]
- Qiao, J.; Wang, M.; Zhang, D.; Ding, C.; Wang, J.; Xu, D. Synergetic Development Assessment of Urban River System Landscapes. Sustainability 2017, 9, 2145. [Google Scholar] [CrossRef]
- Chang, J.; Huang, Q.; Wang, Y.; Peng, S. A method for synergetic control of multi-objective operation of reservoirs in the Yellow River basin. Sci. Sin. Technol. 2004, 34, 175–184. [Google Scholar]
- Zhang, T.; Tan, Q.; Yu, X.N.; Zhang, S. Synergy assessment and optimization for water-energy-food nexus: Modeling and application. Renew. Sustain. Energy Rev. 2020, 134, 110059. [Google Scholar] [CrossRef]
- Wang, C.D.; Wang, Y.T.; Geng, Y.; Wang, R.Q.; Zhang, J.Y. Measuring regional sustainability with an integrated social-economic-natural approach: A case study of the Yellow River Delta region of China. J. Clean. Prod. 2016, 114, 189–198. [Google Scholar] [CrossRef]
- Wang, L.; Fang, L.; Hipel, K.W. On Achieving Fairness in the Allocation of Scarce Resources: Measurable Principles and Multiple Objective Optimization Approaches. IEEE Syst.J. 2007, 1, 17–28. [Google Scholar] [CrossRef]
- Sun, T.; Zhang, H.; Wang, Y. The application of information entropy in basin level water waste permits allocation in China. Resour. Conserv.Recycl. 2013, 70, 50–54. [Google Scholar] [CrossRef]
- Xu, J.; Lv, C.; Yao, L.; Hou, S. Intergenerational equity based optimal water allocation for sustainable development: A case study on the upper reaches of Minjiang River, China. J.Hydrol. 2019, 568, 835–848. [Google Scholar] [CrossRef]
- Shi, L. Labor industry allocation, industrial structure optimization, and economic growth. Discret. Dyn. Nat. 2021, 2021, 5167422. [Google Scholar] [CrossRef]
- Lai, X.; Sun, F.; Shen, J.; Gao, X.; Zhang, D. Influencing factors for initial allocation of regional flood drainage rights based on WSR system method. J. Econ. Water Resour. 2020, 38, 74–80. [Google Scholar] [CrossRef]
- Zeng, Z.; Guan, D.; Steenge, A.E.; Xia, Y.; Mendoza-Tinoco, D. Flood footprint assessment: A new approach for flood-induced indirect economic impact measurement and post-flood recovery. J. Hydrol. 2019, 579, 124204. [Google Scholar] [CrossRef]
- Zhao, H.; Zhao, H.; Guo, S. Evaluating the comprehensive benefit of eco-industrial parks by employing multi -criteria decision making approach for circular economy. J. Clean. Prod. 2017, 142, 2262–2276. [Google Scholar] [CrossRef]
- Feng, X.-Q.; Pang, X.-D.; Wei, C.-P. Distance-Based Consistency Measure and Priority Weights of Best-Worst Multi-Criteria Decision Making Method. Int. J. Uncertain. Fuzziness Knowl.-Based Syst. 2020, 28, 853–878. [Google Scholar] [CrossRef]
- Brunelli, M.; Rezaei, J. A multiplicative best–worst method for multi-criteria decision making. Oper. Res. Lett. 2019, 47, 12–15. [Google Scholar] [CrossRef]
- Duleba, S.; Moslem, S.; Esztergar-Kiss, D. Estimating commuting modal split by using the Best-Worst Method. Eur. Transp. Res. Rev. 2021, 13, 29. [Google Scholar] [CrossRef]
- Orlovsky, S.A. Decision-making with a fuzzy preference relation. Fuzzy Sets Syst. 1978, 1, 155–167. [Google Scholar] [CrossRef]
- Tetsuz, T. Fuzzy preference orderings in group decision making. Fuzzy Sets Syst. 1984, 12, 117–131. [Google Scholar]
- Rezaei, J.; Nispeling, T.; Sarkis, J.; Tavasszy, L. A supplier selection life cycle approach integrating traditional and environmental criteria using the best worst method. J. Clean. Prod. 2016, 135, 577–588. [Google Scholar] [CrossRef]
- Ghorabaee, M.K.; Zavadskas, E.K.; Amiri, M.; Esmaeili, A. Multi-criteria evaluation of green suppliers using an extended WASPAS method with interval type-2 fuzzy sets. J. Clean. Prod. 2016, 137, 213–229. [Google Scholar] [CrossRef]
- Alvandi, E.; Soleimani-Sardo, M.; Meshram, S.G.; Giglou, B.F.; Ghaleno, M.R.D. Using Improved TOPSIS and Best Worst Method in prioritizing management scenarios for the watershed management in arid and semi-arid environments. Soft Comput. 2021, 25, 11363–11375. [Google Scholar] [CrossRef]
- Tu, Y.; Chen, K.; Wang, H.; Li, Z. Regional Water Resources Security Evaluation Based on a Hybrid Fuzzy BWM-TOPSIS Method. Int. J. Environ. Res. Public Health 2020, 17, 4987. [Google Scholar] [CrossRef]
- Tian, Z.-P.; Zhang, H.-Y.; Wang, J.-Q.; Wang, T.-L. Green Supplier Selection Using Improved TOPSIS and Best-Worst Method Under Intuitionistic Fuzzy Environment. Informatica 2018, 29, 773–800. [Google Scholar] [CrossRef] [Green Version]
- Wu, F.; Cao, Q.; Zhang, D.; Sun, F.; Shen, J. Allocation of flood drainage rights of Sunan Canal based on environmental Gini coefficient. J. Hohai Univ. Nat. Sci. 2020, 48, 314–319. [Google Scholar]
- Govindan, K.; Sarkis, J.; Palaniappan, M. An analytic network process-based multicriteria decision making model for a reverse supply chain. Int. J. Adv. Manuf. Technol. 2013, 68, 863–880. [Google Scholar] [CrossRef]
- Poh, K.L.; Ang, B.W. Transportation fuels and policy for Singapore: An AHP planning approach. Comput. Ind. Eng. 1999, 37, 507–525. [Google Scholar] [CrossRef]
- Chang, C.W.; Wu, C.R.; Lin, C.T.; Chen, H.C. An application of AHP and sensitivity analysis for selecting the best slicing machine. Comput. Ind. Eng. 2007, 52, 296–307. [Google Scholar] [CrossRef]
- Govindan, K.; Kaliyan, M.; Kannan, D.; Haq, A.N. Barriers analysis for green supply chain management implementation in Indian industries using analytic hierarchy process. Int. J. Prod. Econ. 2014, 147, 555–568. [Google Scholar] [CrossRef]

| Target Layer (System) | Criteria Layer (Subsystem) | Indicator Layer (Order Parameter) | Indicator Meaning | Nature | References |
|---|---|---|---|---|---|
| FDR allocation system | Economic subsystem (s1) | Per capita GDP (s11) | The relationship between regional GDP and resident population | + | [25,27] |
| Industrial added value (s12) | New value-added to the production process of regional industrial enterprises | + | [27] | ||
| Per capita disposable income (s13) | Changes in regional living levels | + | [17,27] | ||
| Engel coefficient (s14) | Food expenditure as a share of total personal consumption expenditure | - | [18,28] | ||
| Flood direct economic loss (s15) | Direct property damage from regional flooding disasters | + | [17,28] | ||
| Degree of industrial structure optimization (s16) | Regional economic industry resource allocation efficiency | + | [46,47] | ||
| Social subsystem (s2) | Population density (s21) | Population per unit land area | + | [10,26,27] | |
| Employment rate (s22) | Percentage of employed persons to the sum of employed persons and non-employed persons | + | [16,18] | ||
| Urbanization rate (s23) | Percentage of urban population to the total population | + | [27,28] | ||
| Drainage pipe length (s24) | The capacity of drainage pipes to discharge flood water | + | [17,26] | ||
| Water construction investment (s25) | The amount of investment in the construction of water conservancy projects | + | [17,18] | ||
| Policy inclination (s26) | Policy support for a region from a high-level government | + | [19,32] | ||
| Natural environment Subsystem (s3) | Annual rainfall (s31) | The sum of the average monthly precipitation in a year | + | [10,25] | |
| Built-up area (s32) | The scale of a city in an area | + | [28,47] | ||
| Green coverage (s33) | The ratio of the total area covered by greenery in the region to the total area of the region | - | [18,30] | ||
| Sewage treatment rate (s34) | Regional capacity to treat wastewater | + | [10,27] | ||
| Water quality compliance rate in water functional areas (s35) | The proportion of water functional areas that meet water quality standards to the water functional areas evaluated | + | [18] | ||
| Water resources development and utilization degree (s36) | The ratio of exploited water resources to total water resources in a region | + | [18,32] |
| 0.5 | 0.6 | 0.7 | 0.8 | 0.9 | |
| CI (max ) | 0 | 0.2 | 0.62 | 1.63 | 5.23 |
| Experts | Subsystem | Order Parameter | |||
|---|---|---|---|---|---|
| (s1–s3) | (s11–s16) | (s21–s26) | (s31–s36) | ||
| e1 | (0.5, 0.7, 0.6) | (0.6, 0.7, 0.6, 0.9, 0.5, 0.7) | (0.5, 0.7, 0.6, 0.7, 0.6, 0.9) | (0.5, 0.6, 0.6, 0.8, 0.7, 0.6) | |
| e2 | (0.6, 0.5, 0.8) | (0.5, 0.6, 0.7, 0.8, 0.6, 0.7) | (0.6, 0.8, 0.5, 0.7, 0.7, 0.6) | (0.5, 0.6, 0.6, 0.7, 0.6, 0.6) | |
| e3 | (0.5, 0.6, 0.7) | (0.6, 0.7, 0.6, 0.7, 0.5, 0.8) | (0.5, 0.6, 0.6, 0.7, 0.8, 0.6) | (0.5, 0.7, 0.6, 0.7, 0.6, 0.8) | |
| e4 | (0.6, 0.5, 0.7) | (0.6, 0.8, 0.5, 0.7, 0.6, 0.6) | (0.5, 0.8, 0.7, 0.6, 0.6, 0.7) | (0.5, 0.7, 0.6, 0.8, 0.9, 0.6) | |
| e5 | (0.7, 0.5, 0.8) | (0.6, 0.6, 0.7, 0.6, 0.5, 0.6) | (0.5, 0.7, 0.6, 0.8, 0.6, 0.6) | (0.5, 0.7, 0.6, 0.7, 0.8, 0.6) | |
| e1 | (0.7, 0.5, 0.6) T | (0.8, 0.6, 0.7, 0.5, 0.9, 0.7) T | (0.9, 0.7, 0.8, 0 6, 0.7, 0.5) T | (0.8, 0.6, 0.6, 0.5, 0.6, 0.7) T | |
| e2 | (0.7, 0.8, 0.5) T | (0.8, 0.7, 0.6, 0.5, 0.7, 0.6) T | (0.7, 0.5, 0.9, 0.7, 0.6, 0.7) T | (0.7, 0.7, 0.6, 0.5, 0.7, 0.7) T | |
| e3 | (0.7, 0.6, 0.5) T | (0.7, 0.6, 0.7, 0.6, 0.8, 0.5) T | (0.8, 0.7, 0.7, 0.6, 0.5, 0.7) T | (0.8, 0.7, 0.6, 0.7, 0.7, 0.5) T | |
| e4 | (0.6, 0.7, 0.5) T | (0.7, 0.5, 0.8, 0.6, 0.8, 0.7) T | (0.8, 0.5, 0.7, 0.6, 0.6, 0.7) T | (0.9, 0.7, 0.8, 0.6, 0.5, 0.7) T | |
| e5 | (0.7, 0.8, 0.5) T | (0.7, 0.6, 0.6, 0.6, 0.7, 0.5) T | (0.8, 0.6, 0.7, 0.5, 0.7, 0.7) T | (0.8, 0.6, 0.6, 0.8, 0.5, 0.7) T | |
| Subsystem | e1 | e2 | e3 | e4 | e5 | Average Weights |
|---|---|---|---|---|---|---|
| s1 | 0.478 | 0.337 | 0.478 | 0.299 | 0.278 | 0.374 |
| s2 | 0.208 | 0.525 | 0.315 | 0.532 | 0.592 | 0.434 |
| s3 | 0.315 | 0.138 | 0.208 | 0.168 | 0.130 | 0.192 |
| 0.003 | 0.009 | 0.003 | 0.040 | 0.019 | ||
| CRs | 0.005 | 0.005 | 0.005 | 0.065 | 0.012 |
| e1 | e2 | e3 | e4 | e5 | Average Weights | ||||||
|---|---|---|---|---|---|---|---|---|---|---|---|
| Weights | CRs | Weights | CRs | Weights | CRs | Weights | CRs | Weights | CRs | ||
| s11 | 0.216 | 0.010 | 0.297 | 0.005 | 0.191 | 0.005 | 0.168 | 0.017 | 0.193 | 0.081 | 0.213 |
| s12 | 0.105 | 0.191 | 0.122 | 0.063 | 0.125 | 0.121 | |||||
| s13 | 0.170 | 0.122 | 0.191 | 0.284 | 0.155 | 0.184 | |||||
| s14 | 0.057 | 0.078 | 0.122 | 0.106 | 0.155 | 0.104 | |||||
| s15 | 0.318 | 0.191 | 0.297 | 0.212 | 0.288 | 0.261 | |||||
| s16 | 0.134 | 0.122 | 0.078 | 0.168 | 0.084 | 0.117 | |||||
| s21 | 0.299 | 0.015 | 0.183 | 0.015 | 0.270 | 0.031 | 0.288 | 0.031 | 0.253 | 0.018 | 0.259 |
| s22 | 0.176 | 0.070 | 0.181 | 0.084 | 0.154 | 0.133 | |||||
| s23 | 0.140 | 0.304 | 0.145 | 0.125 | 0.154 | 0.174 | |||||
| s24 | 0.141 | 0.116 | 0.145 | 0.155 | 0.094 | 0.130 | |||||
| s25 | 0.178 | 0.145 | 0.078 | 0.193 | 0.154 | 0.150 | |||||
| s26 | 0.066 | 0.183 | 0.181 | 0.155 | 0.191 | 0.155 | |||||
| s31 | 0.278 | 0.025 | 0.236 | 0.048 | 0.304 | 0.015 | 0.327 | 0.031 | 0.302 | 0.017 | 0.290 |
| s32 | 0.157 | 0.144 | 0.116 | 0.176 | 0.113 | 0.141 | |||||
| s33 | 0.157 | 0.178 | 0.183 | 0.109 | 0.226 | 0.170 | |||||
| s34 | 0.088 | 0.087 | 0.145 | 0.109 | 0.113 | 0.109 | |||||
| s35 | 0.126 | 0.178 | 0.183 | 0.058 | 0.067 | 0.122 | |||||
| s36 | 0.194 | 0.178 | 0.070 | 0.222 | 0.179 | 0.168 | |||||
| Subsystem | Subsystem Weights | Order Parameter | Local Weights of Order Parameter | Global Weights of Order Parameter | Ranking |
|---|---|---|---|---|---|
| Economic subsystem (s1) | 0.374 | s11 | 0.213 | 0.080 | 3 |
| s12 | 0.121 | 0.045 | 11 | ||
| s13 | 0.184 | 0.069 | 5 | ||
| s14 | 0.104 | 0.039 | 13 | ||
| s15 | 0.261 | 0.098 | 2 | ||
| s16 | 0.117 | 0.044 | 12 | ||
| Social subsystem (s2) | 0.434 | s21 | 0.259 | 0.112 | 1 |
| s22 | 0.133 | 0.058 | 8 | ||
| s23 | 0.174 | 0.075 | 4 | ||
| s24 | 0.130 | 0.057 | 9 | ||
| s25 | 0.150 | 0.065 | 7 | ||
| s26 | 0.155 | 0.067 | 6 | ||
| Natural environment subsystem (s3) | 0.192 | s31 | 0.290 | 0.056 | 10 |
| s32 | 0.141 | 0.027 | 16 | ||
| s33 | 0.170 | 0.033 | 14 | ||
| s34 | 0.109 | 0.021 | 18 | ||
| s35 | 0.122 | 0.024 | 17 | ||
| s36 | 0.168 | 0.032 | 15 |
| Subsystem | Weights of Other Subsystems as the Weight of the Social Subsystem (s2) Changes from 0.1 to 0.9 | ||||||||
|---|---|---|---|---|---|---|---|---|---|
| s1 | 0.595 | 0.529 | 0.463 | 0.397 | 0.330 | 0.264 | 0.198 | 0.132 | 0.066 |
| s2 | 0.1 | 0.2 | 0.3 | 0.4 | 0.5 | 0.6 | 0.7 | 0.8 | 0.9 |
| s3 | 0.305 | 0.271 | 0.237 | 0.203 | 0.170 | 0.136 | 0.102 | 0.068 | 0.034 |
| Total | 1 | 1 | 1 | 1 | 1 | 1 | 1 | 1 | 1 |
| City | “PAG” Model | FBWM-TOPSIS | FBWM-Grey-TOPSIS | ||
|---|---|---|---|---|---|
| Population | Area | GDP | |||
| h1 | 0.1822 | 0.1786 | 0.1102 | 0.0748 | 0.1942 |
| h2 | 0.2368 | 0.2034 | 0.1658 | 0.4341 | 0.3269 |
| h3 | 0.3104 | 0.2152 | 0.2679 | 0.2074 | 0.2301 |
| h4 | 0.2705 | 0.4027 | 0.4561 | 0.2836 | 0.2488 |
Publisher’s Note: MDPI stays neutral with regard to jurisdictional claims in published maps and institutional affiliations. |
© 2022 by the authors. Licensee MDPI, Basel, Switzerland. This article is an open access article distributed under the terms and conditions of the Creative Commons Attribution (CC BY) license (https://creativecommons.org/licenses/by/4.0/).
Share and Cite
Zhang, X.; Shen, J.; Sun, F.; Wang, S.; Zhang, S.; Chen, J. Allocation of Flood Drainage Rights in Watershed Using a Hybrid FBWM-Grey-TOPSIS Method: A Case Study of the Jiangsu Section of the Sunan Canal, China. Int. J. Environ. Res. Public Health 2022, 19, 8180. https://doi.org/10.3390/ijerph19138180
Zhang X, Shen J, Sun F, Wang S, Zhang S, Chen J. Allocation of Flood Drainage Rights in Watershed Using a Hybrid FBWM-Grey-TOPSIS Method: A Case Study of the Jiangsu Section of the Sunan Canal, China. International Journal of Environmental Research and Public Health. 2022; 19(13):8180. https://doi.org/10.3390/ijerph19138180
Chicago/Turabian StyleZhang, Xiaoyan, Juqin Shen, Fuhua Sun, Shou Wang, Shuxuan Zhang, and Jian Chen. 2022. "Allocation of Flood Drainage Rights in Watershed Using a Hybrid FBWM-Grey-TOPSIS Method: A Case Study of the Jiangsu Section of the Sunan Canal, China" International Journal of Environmental Research and Public Health 19, no. 13: 8180. https://doi.org/10.3390/ijerph19138180
APA StyleZhang, X., Shen, J., Sun, F., Wang, S., Zhang, S., & Chen, J. (2022). Allocation of Flood Drainage Rights in Watershed Using a Hybrid FBWM-Grey-TOPSIS Method: A Case Study of the Jiangsu Section of the Sunan Canal, China. International Journal of Environmental Research and Public Health, 19(13), 8180. https://doi.org/10.3390/ijerph19138180